impact of hydroponics technology in pakistan’s fruits and
TRANSCRIPT

FWU Journal of Social Sciences, Summer 2018, Part-11, Vol.12, No.3, 190-202
Impact of Hydroponics Technology in Pakistan’s Fruits and Vegetable
Sector and Global Trade: A CGE Analysis
Arshad Mahmood Malik PMAS- Arid Agriculture University, Rawalpindi
Khalid Mahmood Mughal Preston University Kohat, Islamabad Campus
Muhammad Aamir Khan COMSATS institute of Information Technology, Islamabad
Amjad Masood Preston University Kohat, Islamabad Campus
Hydroponics is a method of growing plants using mineral nutrient solutions, in water, without soil enhancing productivity multiple times as compared to conventional agriculture. From decades vegetable productivity is stagnant in Pakistan forcing Pakistan to import. Climate change, and extreme climatic conditions are further threatening agriculture production and hence food security. Food security through productivity enhancement is the major thrust of most of the national and international development agendas. This coupled with increasing population are driving up global food demand thus putting upward pressure on Agricultural productivity. Technological development via Hydroponics can be the potential solution to this issue. With this backdrop, we adapted a global commutable general equilibrium model using latest available GTAP data set to quantify the potential hydroponics production on macro as well as at micro level in Pakistan. Different simulations were designed comprises of increase in the production of fruits and vegetables using hydroponics and reducing the import tariffs of chemical used as an input in this state of art technology. Result shows an overall positive impact on Pakistan’ real GDP, sectoral exports and imports, improves terms of trade and reducing the local market price of fruits and vegetables in Pakistan. In short adoption of hydroponics technology can positively contributes in improving
the macroeconomic indicators and consumer welfare in the country.
Keywords: Hydroponics; fruits and vegetables; general equilibrium models; GTAP; Pakistan JEL classification: F-62, Q-16, Q-17, C-68
Pakistan’s economy is based mainly on agriculture which contributes 18.9 percent in GDP and employs
42.3 percent labour force. Total GDP of agriculture sector remained Rs. 2336 billion with growth rate of 3.81 percent during 2017-18 (GoP, 2018). Vegetables and fruits are grown in almost all provinces of Pakistan. Gross value added of fruits and vegetables during 2014-15 was Rs. 537 billion at current basic prices, out of which 34 percent was contributed by vegetables and 66 percent by fruits. During 2014-15 vegetables were sown on 437.1 thousand hectares in the country as against fruit cultivation on 775 thousand hectares. Punjab is the dominant province in supply of vegetables. Total area under vegetable cultivation in Punjab was 300 thousand hectares during 2014-15 which constitutes 69% of the total vegetable area of Pakistan following Sind, KPK and Baluchistan (GoP, 2016a).
Agriculture productivity stagnation is a worldwide phenomenon. Many econometric studies have focused on productivity stagnation in the agriculture sector (Frisvold & Ingram, 1995; Ghura & Just, 1992; Haley, 1991; Kawagoe, Hayami, & Ruttan, 1985; Lileeva & Trefler, 2010; D. Nguyen, 1979). Productivity measures sectoral efficiency in the use of factors of production like land, labour and capital. Estimation of agricultural
Correspondence concerning this article should be addressed to Dr. Arshad Mahmood Malik, Assistant Professor, Department of Economics, PMAS- Arid Agriculture University, Rawalpindi. Email: [email protected]

Malik, Mughal, Khan, Masood
191
production function and land and labor productivity remained the analytical point of different studies. Various sources of agriculture productivity stagnation in Pakistan were also analysed in some studies (Ahmad, 2001; Saleem & Jan, 2011). Climate change and severe climatic conditions are further deteriorating the situation.
Pakistan is facing serious issue of vegetable yield stagnancy during last many decades. During 1971, vegetable yield was 11.76 ton per hectare which increased to a maximum of 15.27 during 1997 and then decreased to 12.39 tons per hectare in 2016 as reported by Food and Agriculture Organisation (FAO, 2018) (Fig.1). In Agriculture Statistics of Pakistan, Government of Pakistan reported yield of vegetable as 10.95 ton per hectare during 1997-98 which further decreased to 9.48 ton per hectare in 2014-15 (GoP, 2016a).
Pakistan’s average yield of vegetable is very low as compared to world average. Crop specific yield gap is also dominant feature of Pakistan’s agriculture. There is a wide gap of yield of tomato in Pakistan which is around 10t/ha in open field (GoP, 2016a) and the world average of 34.69 t/ha (FAO, 2018). This is mainly due to traditional system of production. Adoption of high tech. system can support Pakistan to enhance its productivity and ultimately global food security.
Demand of food is rising globally (Tilman, Balzer, Hill, & Befort, 2011). High growth rate of population, urbanization and increased purchasing power are contributing positively in increasing demand of food in the country. Per capita consumption of food is high in urban areas as compared to rural area. This also required more demand for food. World population is also increasing which need increased supply of food as a global responsibility.
Total area of Pakistan is 79.61 million hectare (m.ha.). The cultivated area is 22.06 m.ha., which is stagnant over many decades (GoP, 2018). The increase in vegetable production is mainly attributed to the crop trade off in agriculture sector. The horizontal expansion to increase supply of food has limited scope. Option left with Pakistan is vertical expansion i.e, increased per hectare productivity of each crop. Increasing yield is only possible through adoption of modern technology (Nguyen & Gizaw, 2014).
Among most modern techniques for increasing productivity, hydroponic is the potential technology to adapt. The production of fruits and vegetables could increase manifold in hydroponic system. Hydroponics is a method of growing plants using mineral nutrient solutions, in water, without soil. Hydroponics is a successful and rapidly expanding industry in the world over and is recognized for manifold productivity improvement in developed countries especially in Australia (Carruthers, 2002). Hydroponic technology is a capital-intensive technology involving development of infrastructure which has positive impact on productivity and growth (Imran & Niazi, 2011). US department of labour classify food crops grown under cover as 0182 sub-head of major Agriculture production as 01 (USDL, 2014).
0
50000
100000
150000
200000
Yie
ld=h
g/h
a.
Fig.1: Vegetable Yield of Pakistan as per FAO database

HYDROPONICS TECHNOLOGY IN PAKISTAN
192
Hydroponic is capital intensive technology (Jensen, 1997) as against tradition agriculture which is labour intensive. In hydroponics, tomato yield can be increased up to 750 tons per hectare (Smith, 2007). Average yield of tomato obtained in hydroponics production system in Pakistan was 162 ton per hectare (Malik, Mughal, Mian, & Khan, 2018) as compared to 10 ton per hectare in open field (FAO, 2018).
Pakistan has comparative advantage in the trade of fruits and vegetables. The revealed comparative advantage index of Pakistan for vegetable was 1.2 and for fruits 1.75 from 1999-08 (Riaz, Jansen, & Malik). Total exports of vegetables of Pakistan was US$173 million during 2017 as against world trade of US$71.7 billion in the same year. The export of fruits HS code 08 was comprised of US$ 707.8 m during 2017. The import of vegetable of Pakistan comprising of HS code 07, were 981m US$ and that of fruits US$ 702 m (ITC, 2018).
Market integration in global economies is increasing. CGE models are widely accepted for their role in regional policy analysis and market integration. Each country is ambitious in boosting his exports. Computable General Equilibrium models provide set of simulations integrating general equilibrium structure of the economy using real economic data for numerical solution of different levels of supply, demand and prices which help in equilibrium in a specific set of markets.
Quantitative analysis of this global integration phenomenon is important to understand its pros and cons. Interests of one country are effecting the interests of other country. National trade policy of Pakistan is centered on export promotion. Pakistan’s Strategic Policy Framework 2015-18 aims at boosting exports and to achieve the target of US$35 b. to meet the ever increasing imports currently at US$34 billion (GoP, 2016b). Decreasing this gap can boost Pakistan’s economy.
In GTAP model, the world economy has been distributed into different regions and each region has a single representative household called regional household. This regional household is generating its income from factor payment and tax revenues. This regional household utilizes its income in the form of government and private expenditures and savings as in Cobb Douglas per capita utility function so that its final demand includes constant share of total regional income. GTAP modeling is new in developing world with separate sectors of fruits and vegetables among 57 GTAP sectors and inclusion of Pakistan among 140 GTAP regions of the world. This technique is not utilized yet in developing world for estimating productivity benefits which support in vertical expansion.
Different countries have levied different tariff pattern on fruits and vegetables imports and exports. Last two decades, openness in economies becomes an important trade topic. It is generally considered that openness leads to growth and multilateral and regional efforts were leading world towards free trade (Roy & Zarrouk, 2002). Agro based industrial products are major component of export in Pakistan. Fruits and vegetable sector of Pakistan is also a potential sector to contribute in export promotion. Analysis of this sector in CGE framework provides an insight to the policy makers and planners for addressing the issues of the sector.
This study is designed to investigate the impact of hydroponics technology on productivity enhancement and global trade by using CGE modeling technique.
Method Computable General Equilibrium [CGE] model is an economic model, which is employed for the analysis of changes in government policies, technology and environment etc. using real economic data. It is a multi-sectoral model and explains the explicit information about the behavior of economic agent. It treats households as utility maximizing agents and firms as cost minimizing and profit maximizing agents in the economy. It is assumed that agents’ decisions about the production and consumption are based on prices, which are determined by the equilibrium conditions of demand and supply.
This research used a globally consistent, multi sectoral and regional CGE model that provides the framework for the economy to cumulate the decisions of all producers and households in response to a change in price or quantity. Major benefit of the Global CGE model is its ability to relate the cross linkages within the

Malik, Mughal, Khan, Masood
193
economy (Partridge & Rickman, 1998). (Blake, Rayner, & Reed, 1998) describes that a CGE model is based on neo classical theory where producers base their decisions on cost minimizing and profit maximizing and the consumer on achieving utility maximization. The model has the ability to explain the inter-linkages within the economy and the behavioural equations describe the effect of a price change on the inter-linkages (Minor & Walmsley, 2013). The models are consistent and capture both the economy wide different sectors and their interaction and inter linkages between the sectors of the economy. The Global CGE model can be performed with the help of a standard GTAP model and is supported by GTAP modeling framework and its worldwide database act as the source of trade data for the model.
Design Choices It is a general equilibrium model and therefore it doesn’t restrict itself to only one sector like the partial equilibrium model. There are many sectors enumerated in this model and we can analyses the effects of many goods (exportable, importable, tradable, non-tradable).GTAP model is global as it not only covers one country but also the whole world. It encompasses almost the whole world. Though, all countries are not individually represented but they are represented in a region. Each region has a different design as in the case of the Basic Linked System model. As every region has different structure so this makes the teaching and interpretation of the model a bit challenging. GTAP can be used to predict the differences between different possible states of the economy. Therefore it is regarded as a comparative static model. GTAP also encompasses the input-output accounting framework; all the inputs in the production process are accounted for. All sources and uses of economic goods are also taken into account. Therefore, looking at all these features we can conclude that GTAP has proved to be a successful as a broad-based general equilibrium model. The GTAP model is implemented using the GEMPACK suite of economic modeling software (Harrison & Pearson, 1996). The input-output structure in the GTAP provides the framework in which we can account for the supply and the use of the economic goods of the model. Goods and services are distinguished by region or origin and other factors as well. In the GTAP model these are then referred to as tradable and endowment commodities. There are some restrictions imposed on the border as well and all the countries choose different mix of imports. Every country has different set of imports and exports varying on the prevailing demand of the particular products. However, there is absence of the transport costs and all other costs which are incurred from the production point to the point of use. The working capital is not recognized as a factor of production and there are no re-exports, only domestic goods are exported. Figure 2 below explains the circular flow in the standard GTAP model. This explains that production generates income that goes to the households and then is spent back by them on three heads. These three heads are private expenditure, government spending and savings. This diagram includes both domestic and exports by the firms.

HYDROPONICS TECHNOLOGY IN PAKISTAN
194
Figure 2: Circular flow in a regional economy
Source: (Corong, Hertel, McDougall, Tsigas, & van der Mensbrugghe, 2017) In each production activity, there are set of intermediate goods and factors to produce output. Like many CGE models, it is based on a sequence of nested constant elasticity of substitution functions. Its aim is to reproduce the substitution possibilities across the full sets of inputs. Figure 3: Production structure
Source : (Corong et al., 2017) The top two nests include the intermediate demand and value added; the second level nests include the demand for individual intermediate goods on one hand and demand for individual factors on the other hand. The final nest decomposes demand for composite good into domestic and imported components. In this
Malik, Mughal, Khan, Masood
195
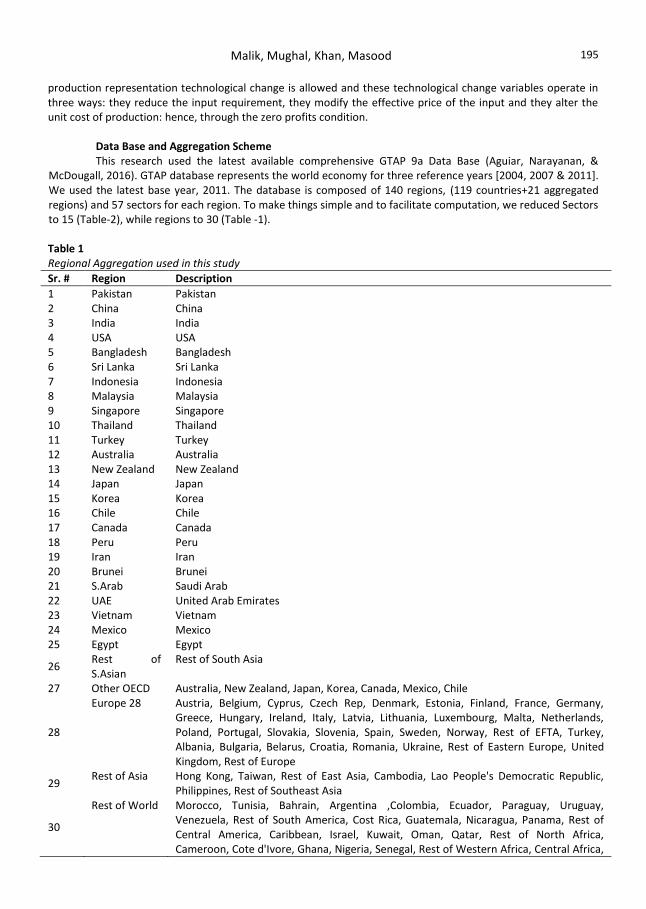
production representation technological change is allowed and these technological change variables operate in three ways: they reduce the input requirement, they modify the effective price of the input and they alter the unit cost of production: hence, through the zero profits condition. Data Base and Aggregation Scheme
This research used the latest available comprehensive GTAP 9a Data Base (Aguiar, Narayanan, & McDougall, 2016). GTAP database represents the world economy for three reference years [2004, 2007 & 2011]. We used the latest base year, 2011. The database is composed of 140 regions, (119 countries+21 aggregated regions) and 57 sectors for each region. To make things simple and to facilitate computation, we reduced Sectors to 15 (Table-2), while regions to 30 (Table -1).
Table 1 Regional Aggregation used in this study
Sr. # Region Description
1 Pakistan Pakistan 2 China China 3 India India 4 USA USA 5 Bangladesh Bangladesh 6 Sri Lanka Sri Lanka 7 Indonesia Indonesia 8 Malaysia Malaysia 9 Singapore Singapore 10 Thailand Thailand 11 Turkey Turkey 12 Australia Australia 13 New Zealand New Zealand 14 Japan Japan 15 Korea Korea 16 Chile Chile 17 Canada Canada 18 Peru Peru 19 Iran Iran 20 Brunei Brunei 21 S.Arab Saudi Arab 22 UAE United Arab Emirates 23 Vietnam Vietnam 24 Mexico Mexico 25 Egypt Egypt
26 Rest of S.Asian
Rest of South Asia
27 Other OECD Australia, New Zealand, Japan, Korea, Canada, Mexico, Chile
28
Europe 28 Austria, Belgium, Cyprus, Czech Rep, Denmark, Estonia, Finland, France, Germany, Greece, Hungary, Ireland, Italy, Latvia, Lithuania, Luxembourg, Malta, Netherlands, Poland, Portugal, Slovakia, Slovenia, Spain, Sweden, Norway, Rest of EFTA, Turkey, Albania, Bulgaria, Belarus, Croatia, Romania, Ukraine, Rest of Eastern Europe, United Kingdom, Rest of Europe
29 Rest of Asia Hong Kong, Taiwan, Rest of East Asia, Cambodia, Lao People's Democratic Republic,
Philippines, Rest of Southeast Asia
30
Rest of World Morocco, Tunisia, Bahrain, Argentina ,Colombia, Ecuador, Paraguay, Uruguay, Venezuela, Rest of South America, Cost Rica, Guatemala, Nicaragua, Panama, Rest of Central America, Caribbean, Israel, Kuwait, Oman, Qatar, Rest of North Africa, Cameroon, Cote d'Ivore, Ghana, Nigeria, Senegal, Rest of Western Africa, Central Africa,

HYDROPONICS TECHNOLOGY IN PAKISTAN
196
South Central Africa, Ethiopia, Kenya, Madagascar, Malawi, Mauritius, Mozambique, Tanzania, Uganda, Zambia, Zimbabwe, Rest of Eastern Africa, Botswana, Namibia, South Africa, Rest of South Africa Customs Union , Rest of North America, Rest of the World
Source: Author’s own aggregation using GTAP 9a Data Base
Table-2
Sectoral Aggregation used in this study
Sr. # Short name Comprising GTAP sectorsa
1 Grain Crops PDR, WHT, GRO, OSD, C_B, PFB, OCR, PCR
2 Vegetables & Fruit V_F
3 Meat & Livestock CTL, OAP, RMK, WOL, CMT, OMT
4 Extraction FRS, FSH, COA, OIL, GAS, OMN
5 Processed Food VOL, MIL, SGR, OFD, B_T
6 Leather LEA
7 Wearing Apparel WAP
8 Textile TEX
9 Light Manufactures LUM, PPP, FMP, MVH, OTN, OMF
10 Heavy Manufactures P_C, CRP, NMM, I_S, NFM, ELE, OME
11 Utilities and Construction
ELY, GDT, W
12 Transport & Communication
TRD, OTP, WTP, ATP, CMN
13 Financial services OFI, ISR
14 Business services OBS
15 Other Services ROS, OSG, DWE
a. See https://www.gtap.agecon.purdue.edu/databases/v9/v9_sectors.asp for a more detailed description of GTAP sector codes. Source: Author’s own aggregation using GTAP 9a Data Base
Hydroponics production system ensures a gigantic increase in productivity (Smith, 2007). Adoption of
this technology can improve the productivity of vegetable in Pakistan (Malik et al., 2018). This provides the basis for simulation design of the present study. Simulation design used in this study is illustrated in Table-3. Table 3 Simulation design of the study
Simulations Productivity increase due to hydroponics
Subsidy (import duty) removal
Tariff removal by importing countries
SI 25% -- --
II 50% -- --
SIII 50% Yes Yes
Source: Authors own simulations
Model Closure
The standard GTAP closures are taken as the starting point for our analysis which infers the following factors.

Malik, Mughal, Khan, Masood
197
• It is deduced that there is perfect competition in all sectors. Production factors; capital and labour are presumed to be completely mobile among factors, while land and regular assets are sluggish.
• Government spending is presumed to be a constant share of government income and there is no tax replacement, hence as tariff revenue falls, the government deficit expands.
• Foreign income flows are assumed to rise or fall with factor prices in the country in which they are located.
• Investment is driven by the expected rate of return in standard GTAP and total domestic savings by the sum of private household savings and the government budget deficit. Thus, the trade balance is endogenous.
Results and Discussion
Impact of Productivity changes on Macro economic variables of Pakistan The model mainly focused on three prong strategies of increasing productivity, removal of tariff by the
Pakistan govt. on salts and chemicals used in hydroponics and all this coupled with trade liberalization by the product destination countries. These supportive measures have direct effects on macro economy of Pakistan. For analyzing their effects on real GDP, Real investment, Real Export and Import, various simulations were used, cumulative results were presented in Table 4.
Table 4 Response of macroeconomic indicators to productivity changes
Variables Simulation 1 Simulation II Simulation III
% changes (Monetary Change in thousand US$)
% changes (Monetary Change in thousand US$))
% changes (Monetary Change in thousand US$))
Real GDP 0.74 (1600.4) 01.51 (3241) 1.53(3264)
Terms of Trade -0.21(-0.00206) -0.44(-0.0044) -0.93(-0.0093)
Source: Author’s own simulation
The productivity of vegetables was stagnant from past five decades in Pakistan. Cyst of frozen productivity of tomato was broken with hydroponic tomato production technology. Overall increase in production was envisaged due to increase in area of vegetables. Hydroponics technology supports in vertical expansion in fruits and vegetables sector of Pakistan. Productivity shock of 25%, 50% and 50% with subsidy and tariff reduction uniform increase in productivity of fruits and vegetables in Pakistan has been given to the Global trade policy project software (CGE model) as simulation I, II and III respectively. The impacts of this productivity increase coupled with tariff reduction have been envisaged on all sectors of economy and trade.
Table 4 illustrates the impacts of all simulation used in this study on real GDP—that is changes in output measured at base prices. The results of GDP of different scenarios designed in this study show an increase in Pakistan’s real GDP by 0.75 %, 1.5% and 1.5 % in simulations I, II and III respectively. In monetary terms the increase in GDP of Pakistan was observed to be 1.6, 3.24 and 3.26 billion US$ in simulation I, II and III respectively (Table-4). This increased supply due to adoption of hydroponics will ultimately decrease prices.
The terms-of-trade, is generally defined as the ratio of prices a country receives for its exports and pays
for its imports. It is an important idea in comprehending the effect of price changes on general welfare of a certain country Khan, M. A., Zada, N., & Mukhopadhyay, 2018). Terms of trade and technological progress are interrelated (Kohli, 2004). Higher terms of trade and less volatility in tot leads to growth (commodity export) in developing economies (Grimes, 2006). The terms of trade in agriculture commodities generally remain unfavorable for Pakistan in different periods ((Rashid, Rafique, & Ali, 1997), (Khan, Ahmed, & Ashiq, 2004) (Fatima, 2010)). Trade of fruits and vegetables among different regions of the world has supported people of these countries to consume different variety of fruits and vegetables produced in different parts of the world. Terms of trade of fruits and vegetables among different regions of the world will represent the ratio of prices of

HYDROPONICS TECHNOLOGY IN PAKISTAN
198
imports and exports among regional countries. Terms of trade of fruits and vegetable economy of Pakistan will slightly deteriorate by (0.21%) primarily (Table-4), even after productivity shock of 25%. Terms of trade of fruits and vegetable would be positive for China and Middle Eastern countries. Terms of trade of India would also deteriorate.
Impact on Sectoral Exports of Pakistan Total Exports of Pakistan stood at 22 billion dollars during 2017-18 as against imports of 48 billion
dollars (GoP, 2015). Due to poor performance of exports Pakistan is facing problem of Balance of Trade (BOT) deficit. Increasing exports has many fold advantages on Pakistan’s economy including narrowing the BOT gap, increased exports, decreased imports, increase in foreign reserves, strengthening of Pak Rs. against US Dollar etc. Both imports and exports have long run relationship with economic growth of Pakistan (Dilawar Khan, Umar, Zaman, Ahmad, & Shoukat, 2012). With an increase in the fruits and vegetable production via hydroponics the exports of fruits and vegetable sector of Pakistan will rise. The increase in fruits and vegetable export will rise by 627, 1255 and 1257.2 million US dollar due to simulation S-I, S-II and S-III respectively (Table-5). Very small negative change was observed in other sectors of the economy. This might be due to tradeoff between different sectors and their competitive nature. It is expected that with the increase in productivity of fruits and vegetables of Pakistan, domestic supply will increase resulting in decrease in imports of fruits and vegetables.
Table 5 Impact on Sectoral Exports of Pakistan (Million US Dollars)
Qxw Simulation-I Simulation-II Simulation-III
Grains and Crops -53.32 -106.64 -32.67
Vegetables and fruits 627.63 1255.26 1257.30
Livestock and Meat Products -6.6 -13.20 -9.88
Mining and Extraction -364.245 -728.49 -205.42
Light Manufacturing -90.985 -181.97 -105.76
Heavy Manufacturing -119.445 -238.89 -129.58
Processed Food -11.345 -22.69 -2.79
Power -2.345 -4.69 -2.67
TransComm -50.575 -101.15 -70.61
Services -94.025 -188.05 -130.57
Source: results of GTAP version 9 based on author’s calculation
Impact on Real Factor Wages Factor income is the flow of income earned from employment of these factors (Atkinson, 2000). In
GTAP-9, eight factors of production are included in the production process. These factors were further aggregated into five factors (Table-6). Land rent was found to be negative from simulation one and two and positive from simulation three. Labor wages will increase due to these simulations. The wages of skilled labor will increase relatively more than unskilled labor as hydroponics technology employed more skilled labor as compared to unskilled labor. In hydroponics technology, natural resources like mineral salts were used as recipe of the production process (Malik et al., 2018), so earnings of natural resource will also improve from simulation I and II in Pakistan.

Malik, Mughal, Khan, Masood
199
Table 6 Impact on Real Factor Wages
Pfactreal Simulation -I Simulation -II Simulation -III
1 Land -1.76 -3.81 2.39 2 Un-Skilled Labor 0.64 1.29 1.14 3 Skilled Labor 0.98 2.00 1.16 4 Capital 1.10 2.24 1.27 5 Natural Resources 0.27 0.58 -4.01
Source: Author own calculations based on simulation results.
Impact on Domestic Sale of Fruits and vegetables Improved access to global markets enhance the productive capacity of the producer (Lileeva & Trefler,
2010). Table 7 illustrates the increase in domestic sales of fruits and vegetables because hydroponics production system supported in increased production of fruits and vegetables in the country and its availability in the local market.
Table 7 Impact on Domestic Sales (Constant 2011 fruits and vegetable Prices)
Qds Increase in domestics sale (Million $)
Simulation-I 615 Simulation-II 1249 Simulation-III 19
Source: Authors own calculations using GTAP-9.
Impact on Rental Rate of Capital of Pakistan Capital goods are primary factor of production like labour and land (Wekepedia) and are linked with
technology. More capital goods mean more use of technology (Xu & Wang, 1999). Application of modern technology in industrial sector of Pakistan helps in efficiency of capital goods (Romijn, 1997). For productivity enhancement in fruits and vegetable sector with the use of hydroponics technology, reflect the use of advanced agriculture and engineering technology in the country. Without controlled climate and advanced computerized irrigation scheduling, hydroponics products cannot be produced. It also reflects that investment in agriculture increased.
The increase in output of capital goods supported the idea of inevitable use of technology in the production of fruits and vegetable sector. This technological intervention has increased efficiency and ultimately enhanced capital goods in the country. This state of the art technology has increased productivity of the vegetable sector. The output of capital goods will be positively affected due to this productivity improvement. Pakistan is net gainer in output of capital goods. The output of capital goods sector will increase by 0.949% in Pakistan due to simulation-I. Pakistan is in benefit due to increase in output of capital goods. The other regions of the world will foresee no loss due to increase in output of capital goods in Pakistan.
The simulation-II and III, has more positive impact on productivity of capital goods. Due to simulation II, the output of capital goods increased to 1.917% and similarly in simulation III, output of capital goods increased by 1.929%. Pakistan gain due to these three scenarios, Pakistan gains in terms of productivity of capital goods will help in increased investment in technological sector. This scenario has spillover effects as well. The spills over effect are as follows;
Investment in the country increased
Technological development in the country taken place
Employment opportunities for both skilled and unskilled labor increased
Export increased

HYDROPONICS TECHNOLOGY IN PAKISTAN
200
Globally the other regions of the world are loser in output of capital goods except Sri Lanka. This might be due to enhanced share of Pakistan in world supply. Sri Lanka as a third major export partner of fruits and vegetable sector will gain due to productivity enhancement in Pakistan resulting in lowering prices and domestic unit cost structure of the product (Table-8). Table 8 Effect of various simulations on rental rate of capital of Pakistan
Regions S-I S-II S-III
Pakistan 0.94 1.91 1.93
Source: Author calculations GTAP version 9 results
Welfare Effect of productivity enhancement Prices of fruits and vegetables play an influential role in determining consumer behavior in an
economy. Consumer welfare is directly linked with consumer prices (Werden, 1996). Prices of food items have mixed effects on poverty and hunger both in terms of burden of increased prices on consumer and increasing income of the farmer (Swinnen & Squicciarini, 2012). The significant factor influencing buying behavior is match between price and quality of the product (T. H. Nguyen & Gizaw, 2014). Consumer purchasing price of fruits and vegetable decreased to 32% in Pakistan due to increasing productivity of fruits and vegetables by 25% in Pakistan while no significant change is observed in other regions of the world except increase of fruits and vegetable prices in Sri Lanka by 6.2%. Increasing productivity by 50% will cause local consumer purchasing price of fruits and vegetables to decrease by 64%. In simulation III, the local consumer purchasing prices decreased by 35% (Table-9) ultimately improving purchasing power of the local consumers. This will enhance welfare of local consumers of the fruits and vegetables.
Table 9 Effect on Consumer Purchasing price of fruits and vegetables on Pakistan (Percent Changes)
Countries Sim-I Sim-II Sim-III
Pakistan -0.32 -0.65 -0.38 Source: Authors own calculations
Conclusion Pakistan is facing serious issue of productivity stagnation in the field of fruits and vegetable from
decades. Hydroponics technology is state of the art technology recognized for high productivity and safe food. The technology has been tested in Pakistan and per average yield of tomato obtained was 162 ton per ha. per annum as against national average of about 10 ton per ha. This provided baseline for present study by giving productivity shock to the GTAP database. When productivity of fruits and vegetables sector will increase by 25%, its welfare effects envisaged as 32% decrease in the market price of fruits and vegetables. The factor earning of unskilled labour, skilled labour, capital and natural resources will increase by 0.51, 0.85, 0.97 and 0.13 percent respectively in the factor market. The market price of land will also decrease due to increasing production efficiency through technology adoption. Overall market price of fruits and vegetable in the product market will decrease in all other regions of the world. Exports, industry output and GDP quantity index of the country will also improve. The productivity of unskilled labor will improve causing increase in demand of unskilled labor. On overall basis productivity improvement has positive role in improving Pakistan agriculture and agricultural trade and in return balance of payment. Investing in hydroponics technology Pakistan can solve dual problem of productivity of vegetable and increase in exports for mitigation of trade deficit.
Recommendations Adoption of hydroponics technology to meet the challenges of food security in the country through
productivity enhancement
Improving fruits and vegetable trade through CPEC as export promotion strategy

Malik, Mughal, Khan, Masood
201
References Aguiar, A., Narayanan, B., & McDougall, R. (2016). An overview of the GTAP 9 data base. Journal of Global
Economic Analysis, 1(1), 181-208. Ahmad, M. (2001). Agricultural productivity growth differential in Punjab, Pakistan: A district-level analysis. The
Pakistan Development Review, 1-25. Atkinson, A. B. (2000). The changing distribution of income: Evidence and explanations. German Economic
Review, 1(1), 3-18. Blake, A., Rayner, A., & Reed, G. (1998). A CGE Analysis of Agricultural Liberalisation: the Uruguay Round and the
CAP Reform. Paper presented at the First Annual Conference on Global Trade Analysis, Purdue, USA. Carruthers. (2002). Hydroponics as an agricultural production system. Issue 63, (Story Title: Hydroponics as an
agricultural production system, March/April -2002). Corong, E. L., Hertel, T. W., McDougall, R., Tsigas, M. E., & van der Mensbrugghe, D. (2017). The standard gtap
model, version 7. Journal of Global Economic Analysis, 2(1), 1-119. Dilawar Khan, A., Umar, M., Zaman, N., Ahmad, E., & Shoukat, Y. (2012). Exports, imports and economic growth
nexus: Time series evidence from Pakistan. Work Applied Sciences Journal, 18(4), 538-542. FAO. (2018). FAOSTAT. FAO headquater: Food and Agriculture Organisation. Fatima, N. (2010). Analysing the terms of trade Effect for Pakistan. Working Papers & Research Reports, 2010. Frisvold, G., & Ingram, K. (1995). Sources of agricultural productivity growth and stagnation in sub-Saharan
Africa. Agricultural Economics, 13(1), 51-61. Ghura, D., & Just, R. E. (1992). Education, infrastructure and instability in East African agriculture: Implications for
structural adjustment programs. Journal of African Development, 1(1), 85-107. GoP. (2015). Trade and Payments. Pakistan Economic Survey 2014-15. Page 127-130, Finance Division, Govt. of
Pakistan. GoP. (2016a). Crops, Agriculture Statistics of Pakistan. Islamabad: Economic Wing, Ministry of National Food
Security and Research, Islamabad. GoP. (2016b). Trade & Payments, Pakistan Economic Survey 2015-16. Islamabad: Economic Advisor's Wing,
Finance Division, Government of Pakistan, Islamabad. GoP. (2018). Statitical Appendix, Agriculture, Pakistan Economic Survey. Islamabad: Economic Advisor's Wing,
Finance Division, Government of Pakistan, Islamabad. Grimes, A. (2006). A smooth ride: Terms of trade, volatility and GDP growth. Journal of Asian Economics, 17(4),
583-600. Haley, S. (1991). Capital accumulation and the growth of aggregate agricultural production. Agricultural
Economics, 6(2), 129-157. Harrison, J., & Pearson, R. K. (1996). GEMPACK User Documentation Vol. Release 8.0. Imran, M., & Niazi, J. (2011). Infrastructure and growth. The Pakistan Development Review, 355-364. ITC. (2018). Trade Map: International Trade Center. Jensen, M. H. (1997). Hydroponics worldwide. Paper presented at the International Symposium on Growing
Media and Hydroponics 481. Kawagoe, T., Hayami, Y., & Ruttan, V. W. (1985). The intercountry agricultural production function and
productivity differences among countries. Journal of Development economics, 19(1-2), 113-132. Khan, A. A., Ahmed, Q. M., & Ashiq, R. M. (2004). Agricultural Terms of Trade in Pakistan: Issues of Profitability
and Standard of Living of the Farmers [with Comments]. The Pakistan Development Review, 515-537. Kohli, U. (2004). Real GDP, real domestic income, and terms-of-trade changes. Journal of International
Economics, 62(1), 83-106. Lileeva, A., & Trefler, D. (2010). Improved access to foreign markets raises plant-level productivity… for some
plants. The Quarterly journal of economics, 125(3), 1051-1099. Malik, A. M., Mughal, K. M., Mian, S. A., & Khan, M. A. U. (2018). Hydroponic Tomato Production and
Productivity Improvement in Pakistan. Pakistan Journal of Agriculture Research, 31(2), 133-144. doi: http://dx.doi.org/10.17582/journal.pjar/2018/31.2.133.144
Minor, P., & Walmsley, T. (2013). MyGTAP: A Program for Customizing and Extending the GTAP Database for Multiple Households, Split Factors, Remittances, Foreign Aid and Transfers: Center for Global Trade Analysis, Department of Agricultural Economics, Purdue University.

HYDROPONICS TECHNOLOGY IN PAKISTAN
202
Nguyen, D. (1979). On agricultural productivity differences among countries. American Journal of Agricultural Economics, 61(3), 565-570.
Nguyen, T. H., & Gizaw, A. (2014). Factors that influence consumer purchasing decision of Private Label Food Product: A case study of ICA Basic.
Partridge, M. D., & Rickman, D. S. (1998). Regional computable general equilibrium modeling: a survey and critical appraisal. International Regional Science Review, 21(3), 205-248.
Rashid, A., Rafique, E., & Ali, N. (1997). Micronutrient deficiencies in rainfed calcareous soils of Pakistan. II. Boron nutrition of the peanut plant. Communications in soil science and plant analysis, 28(1-2), 149-159.
Riaz, K., Jansen, H. G., & Malik, S. Revealed Comparative Advantage of Pakistan’s Agricultural Exports. Romijn, H. (1997). Acquisition of technological capability in development: A quantitative case study of Pakistan's
capital goods sector. World development, 25(3), 359-377. Roy, J., & Zarrouk, J. (2002). Completing the GCC customs union: Mimeo. The World Bank. Saleem, M. A., & Jan, F. A. (2011). The impact of agricultural credit on agricultural productivity in Dera Ismail
Khan (District) Khyber Pakhtonkhawa Pakistan. European Journal of Business and Management, 3(2), 38-44.
Smith, G. (2007). Field Vs Glasshouse Tomatoes, Hydroponics. Issue 94, (May-June 2007). Swinnen, J., & Squicciarini, P. (2012). Mixed messages on prices and food security. Science, 335(6067), 405-406. Tilman, D., Balzer, C., Hill, J., & Befort, B. L. (2011). Global food demand and the sustainable intensification of
agriculture. Proceedings of the National Academy of Sciences, 108(50), 20260-20264. USDL. (2014). Occupational health and safety administration. United State Department of Labor. Retrieved from
https://www.osha.gov/pls/imis/sic_manual.html. Werden, G. J. (1996). A robust test for consumer welfare enhancing mergers among sellers of differentiated
products. The Journal of Industrial Economics, 409-413. Xu, B., & Wang, J. (1999). Capital goods trade and R&D spillovers in the OECD. Canadian Journal of Economics,
1258-1274.
Received: Jan 15th
, 2018 Revisions Received: May 30
th, 2018