impact of demand uncertainty for automotive powertrains ... · mckinsey & company 2 bulk...
TRANSCRIPT

Nancy, France | 27th – 29th June 2018
Impact of Demand Uncertainty for Automotive Powertrains and Body on Bulk Materials
CONFIDENTIAL AND PROPRIETARY Any use of this material without specific permission of McKinsey & Company is strictly prohibited

2 McKinsey & Company
Bulk materials such as aluminum, steel and copper are impacted by increasing adaptation of electromobility which leads to changes in powertrain technology, the car body and chassis
2 McKinsey & Company SOURCE: McKinsey
Car body – continuous battle for Aluminum and steel lightweight solutions, especially for ICEs
Chassis – BEVs with different long steel product requirements compared to ICEs due to heavy batteries
Powertrain – BEVs with a higher Copper intensity per car and different long steel product requirements compared to ICEs
Cu 63.546 Copper
29

3 McKinsey & Company
Iron ore availability will not be an issue
3 McKinsey & Company SOURCE: McKinsey 3 McKinsey & Company
Uncertainty of supply
Vulnerability to the absence of substitution
Fe 26
55.845 Iron
55 years of iron ore reserves (83 bn t) at current production volume
Sufficient mine capacity (2.5 bn tons) already today to meet future demand
Uncertainty of demand Decline of iron ore demand by 350 Mt due to increase of scrap supply
Political exposure of supply
Low political exposure supply risk (Australia, Brazil, China)
Supply chain recycling Further increase of steel scrap supply (~100 Mt in China, another ~100 Mt in Rest of World)
Years of known reserves
No supply disruptions resulting in vulnerability expected
Years of known reserves
Uncertainty of supply
Political exposure of
supply
Supply chain recycling
Uncertainty of demand
Vulnerability to absence of substitution

4 McKinsey & Company
Global steel demand is expected to grow slowly at ~0.5-1.0% p.a. and automotive end uses account for 10-12% of finished steel demand
4 McKinsey & Company
11%
1,499
40%
18%
10%
12%
2017 2015
1,587
11% 7%
11%
40%
11%
19%
8%
12%
10%
12%
12% 1,647
39%
12%
Construction
7% 12%
10%
10%
21%
2025 2020
1,614
8%
Others
39%
20%
+0.5% p.a.
Other transport
40%
Engineering
7% Oil and Gas
Automotive 1,702
20%
11%
2030 SOURCE: Worldsteel; McKinsey integrated steel demand model 2018Q1; JFK
Million tons
§ Continuous growth at low level for automotive steel
§ Shift to high-value ultra-high strength flat steel due to continuation of light-weight trend
§ Shift in long steel portfolio due EV adaptation
1.4
CAGR 2017-30, % p.a.

5 McKinsey & Company
Research suggests a strong decline for the share of steel in the automotive BIW and a shift towards higher value AHSS and UHSS at the same time
5 McKinsey & Company SOURCE: CAR - Center of Automotive Research, June 2017
42%
20% 18%
20%
16% 14%
10%
15%14%
10%12%
6% 8%
9% 9%8%
5%
2025
Aluminum (5000/6000 Alloys)
Magnesium
2020
Carbon Fiber Reinforced Plastic/ Composites
Aluminum High Strength Alloys
2015
Mild steel
High Strength Low Alloy
High Strength Steel
2%
Advanced High Strength Steel Ultra High Strength Steel Boron/Martensite (UHSS)
Material distribution Body-in-White1 Global Demand AHSS steel In million tons
1 Body-in-White plus closures in the US fleet
22
16
12
2025 2016 2020

6 McKinsey & Company
Iron ore demand is expected to decline by 350 Mt due to increasing scrap availability
6 McKinsey & Company
400
800
2,400
2,000
1,600
1,200
0
~350
Rest of World
China
2030 25 20 15 10
SOURCE: Global steel and raw materials model 2018Q1; McKinsey iron ore team analysis
Million tons
Global Iron Ore Demand Global Scrap Availability and Supply
+100
~85
~275
~400
~215
~315
2017 ~60
2030
Unused scrap
Scrap supplied
+100
~450
~225
~200
~550 ~775
~650 2017
2030
75-80%
75-80%
~70%
~70%
Recycling rate

7 McKinsey & Company
Aluminum won't be an issue either
7 McKinsey & Company SOURCE: McKinsey 7 McKinsey & Company
Al 13
26.9815386 Aluminum
Years of known reserves
Uncertainty of supply
Vulnerability to the absence of substitution
~100 years of bauxite reserves (30 bn tons) at current production volume
Sufficient future mine capacity (~700 Mt) expected to meet future demand
Uncertainty of demand Continuous growth at slower rates than over the last decade, ~25% of demand for automotive, strong competition with steel
Political exposure of supply
Medium political exposure supply risk (Australia, China, Guinea)
No supply disruptions resulting in vulnerability expected
Supply chain recycling Further increase of scrap recycling rates expected (Ø 40% globally; automotive and construction Europe >90%)
Years of known reserves
Uncertainty of supply
Political exposure of
supply
Supply chain recycling
Uncertainty of demand
Vulnerability to absence of substitution

8 McKinsey & Company
Global aluminum demand is expected to grow steady at ~3% p.a., share of automotive end uses in demand expected to increase from 25% to 30% until 2030
8 McKinsey & Company SOURCE: Worldsteel; McKinsey integrated steel demand model 2018Q1; JFK
85
16%
28%
93
26%
10%
28%
10%
11% 16%
10% 10%
15%
2017 2020
119
2030
Automotive
23%
27%
+2.7% p.a.
Consumer durables
Engineering Packaging
25%
ABC
11% 11%
10%
30% 106
Others 15%
10%
2025
12% 10%
10%
25%
Million tons
§ Strong growth in automotive, mainly driven by flat rolled products
4.1
CAGR 2017-30, % p.a.

9 McKinsey & Company
Automotive body sheet (ABS) shows strong demand growth, however, mainly driven by the use in standard ICE's – further investments in new capacity required to meet future demand
9 McKinsey & Company
Capacity 2025
3.2
2025 2020
1.9
3.3
2017
1.2
Mt Global ABS Demand What would it take to increase ABS penetration?
§ ABS will represent <3% of global aluminum demand in 2025 with focus on premium car segment
§ Global ABS nameplate capacity 2025 will grow to ~3.2 Mt based on installed and announced capacity expansions; further investments required to meet the growing demand
§ Use of aluminum body sheet has clear advantages - Much higher weight reduction potential than AHSS - Longer life-cycle for aluminum processing machines - Lower scrap price discount for aluminum than steel
§ Potential drivers to increase ABS penetration - Set up sufficient large scale production capacity to reduce
cost gap to steel, e.g., continuous CRM instead of reversing - Improve relationships to automotive OEMs - Get involved early on in model development and assembly
plant planning (e.g., F150 example)
SOURCE: McKinsey Integrated Aluminum Model v1.27 2018Q1

10 McKinsey & Company
A detailed analysis from a teardown reveals a 5-10% p. larger share of aluminum in BEVs vs. ICEs today and a lower share of HSS
10 McKinsey & Company
47% 41% 36%
22%22%
19%
12% 18%
24%22%22%3%
Gasoline Diesel
3% 100%
BEV
6%
3% 100% 100%
Split of total vehicle weight (excl. powertrain) by material1
Standard steel and cast iron Others
HSS
Aluminum
Plastics
Breakdown of material type by powertrain ▪ In line with expectations,
BEVs with largest share of aluminum in structural components (mainly BiW)
▪ BEVs also with lowest share of HSS and significantly lower share of standard steel
Insights
SOURCE: A2Mac1, McKinsey
1 Results based on Honda Civic, Honda CR-V, Mazda 2, Peugeot 208, Renault Kwid ,Toyota Camry, VW Golf, Ford Ranger, Mercedes S-Class, Nissan Qashqai, BMW X5, Toyota Prius, Nissan Leaf, Opel Ampera-e, Tesla Model S, VW e-Golf, Toyota Mirai as available in US market

11 McKinsey & Company
Costs to be considered when thinking about aluminum vs. steel substitution in automotive
SOURCE: McKinsey 11 McKinsey & Company
Disposal Usage Manufacturing
▪ Scrap credit discount vs. virgin material
▪ Fuel costs ▪ CO2 emissions ▪ Body repair costs
– Equipment and processing cost for repair shops
– Material costs
▪ Raw material cost – Material needs – Material price – CO2 emissions
▪ Manufacturing cost – Manufacturing/quality yield – Other costs
▪ Capex – For ABS production lines – For OEM assembling lines

12 McKinsey & Company
Tesla Model 3
Potentially investment into lightweight no longer outweighs the investment into larger and better battery packs in the future
12 McKinsey & Company SOURCE: A2Mac1, McKinsey
Tesla Model S
Aluminum body in white
(Mostly) steel body in white
Weight Kg ~275 ~320
Volume adjusted weight1
Kg ~244 ~320
1 Tesla Model S weight adjusted to dimensions of smaller Tesla Model 3
Material cost
EUR ~928 ~608
Model 3 frame is ~76 kg heavier than the Model S but saves ~EUR 320 in material cost In future, OEMs are likely to pay less for lightweight in BEVs as battery prices are
expected to drop which will influence the choice of materials used
-320
13 McKinsey & Company
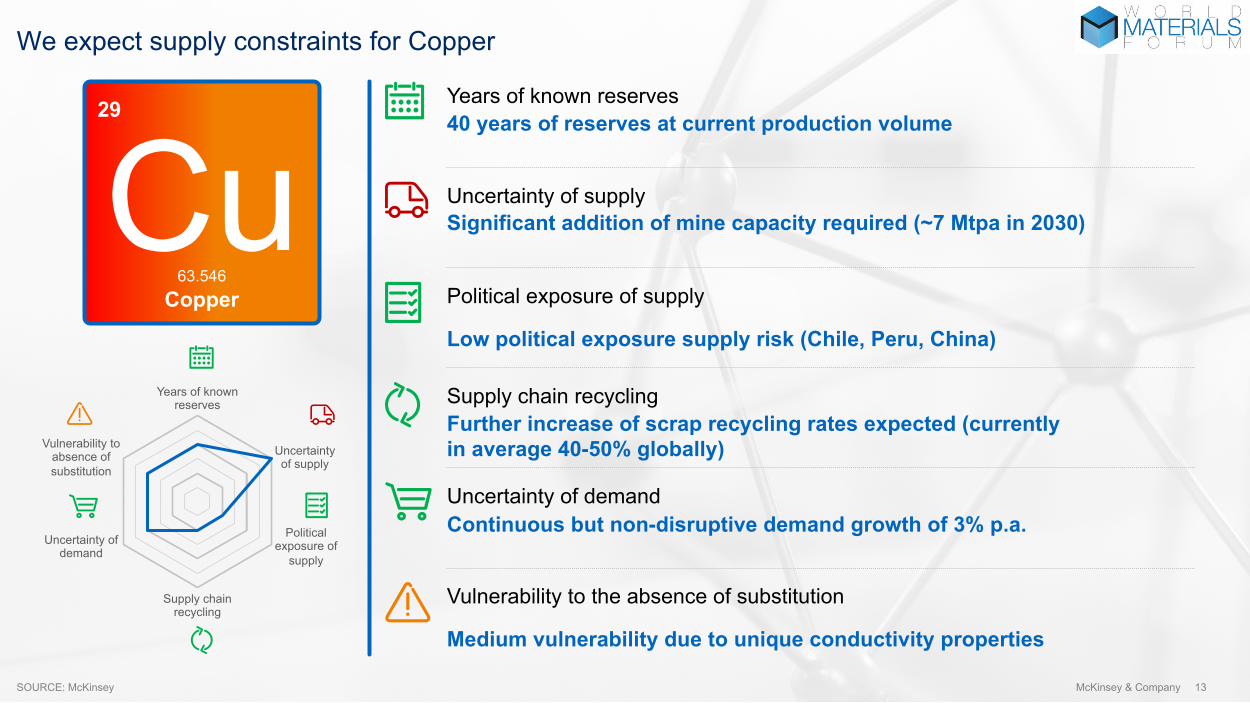
We expect supply constraints for Copper
13 McKinsey & Company SOURCE: McKinsey
Cu 29
63.546 Copper
Years of known reserves
Uncertainty of supply
Uncertainty of demand
Political exposure of supply
Supply chain recycling
Vulnerability to the absence of substitution
40 years of reserves at current production volume
Significant addition of mine capacity required (~7 Mtpa in 2030)
Continuous but non-disruptive demand growth of 3% p.a.
Low political exposure supply risk (Chile, Peru, China)
Further increase of scrap recycling rates expected (currently in average 40-50% globally)
Medium vulnerability due to unique conductivity properties
Years of known reserves
Uncertainty of supply
Political exposure of
supply
Supply chain recycling
Uncertainty of demand
Vulnerability to absence of substitution

14 McKinsey & Company
Demand growth mainly driven by electrical and industrial applications as well as EVs and EV-infrastructure – additional upside of 1.1 Mt in our high case demand scenario
SOURCE: McKinsey 14 McKinsey & Company
+40%
High case demand
33.3 34.4
Upside Base case demand
1.1
2.7
0
Electric vehicles
Transpor- tation
1.3
2.9
Building and construction
0.9 1.7
Consumer and general products
Electrical/ electronic
2017
23.8
Industrial machinery and equip.
Change of refined copper usage by end-use, in million tons
▪ Adoption of electric vehicles will be a major contributor of growth to the copper demand ▪ Copper intensity in EVs is ~3-4x higher than conventional
propulsion cars ▪ Charging infrastructure to add ~0.8 kg of copper per unit

15 McKinsey & Company
The continuous copper demand growth accelerated by EVs puts even more pressure on suppliers to add primary production capacity
SOURCE: MineSpans by McKinsey, McKinsey copper scrap model
Copper primary and secondary supply Kt, 2017-30
Likelihood of higher copper prices going forward
▪ Greenfield price regime needed to incentivize capacity additions, i.e. premium of 50-70% over C90 to recover greenfield investment costs
▪ Accelerating cost inflation due to lower grade deposits and more challenging geological conditions
Primary Secondary Induced additions to meet demand
29.7
7.2
25
33.3
2030 20 2017
23.6 1.5
25.9
15 McKinsey & Company

16 McKinsey & Company
Conclusions for the impact of demand uncertainty for automotive powertrains and body on bulk materials
16 McKinsey & Company
§ Automotive body sheet (ABS) will see further strong demand growth driven by the need for lightweight solutions for standard ICE's – further investments in new capacity required to meet future demand
§ Iron ore and aluminum availability won't be an issue going forward. Iron ore demand will decline due to increase scrap availability, especially in China
§ OEMs likely to pay less for lightweight in BEVs in future as battery prices are expected to drop. Choice of materials likely to shift towards high strength steels, similar to the trend observed in 2nd generation mass market BEVs (Nissan Leaf, Tesla Model 3)
§ BEVs contribute to the copper demand growth. Absolute demand volume for EVs and infrastructure expected to reach ~1.8Mt. This contribution puts more pressure on suppliers to add primary production capacity and we expect a greenfield price regime for copper in future to incentivize further supply capacity additions
SOURCE: McKinsey