impact of climate change on groundwater - india, south asia · 2015-10-08 · uses, the impact of...
TRANSCRIPT

HESSD12, 10109–10156, 2015
Impact of climatechange on
groundwater
Y. Caballero andB. Ladouche
Title Page
Abstract Introduction
Conclusions References
Tables Figures
J I
J I
Back Close
Full Screen / Esc
Printer-friendly Version
Interactive Discussion
Discussion
Paper
|D
iscussionP
aper|
Discussion
Paper
|D
iscussionP
aper|
Hydrol. Earth Syst. Sci. Discuss., 12, 10109–10156, 2015www.hydrol-earth-syst-sci-discuss.net/12/10109/2015/doi:10.5194/hessd-12-10109-2015© Author(s) 2015. CC Attribution 3.0 License.
This discussion paper is/has been under review for the journal Hydrology and Earth SystemSciences (HESS). Please refer to the corresponding final paper in HESS if available.
Impact of climate change on groundwaterin a confined Mediterranean aquiferY. Caballero and B. Ladouche
BRGM, Water Environment and Ecotechnologies Division, 1039 rue de Pinville, 34000,Montpellier, France
Received: 23 July 2015 – Accepted: 10 August 2015 – Published: 2 October 2015
Correspondence to: Y. Caballero ([email protected])
Published by Copernicus Publications on behalf of the European Geosciences Union.
10109

HESSD12, 10109–10156, 2015
Impact of climatechange on
groundwater
Y. Caballero andB. Ladouche
Title Page
Abstract Introduction
Conclusions References
Tables Figures
J I
J I
Back Close
Full Screen / Esc
Printer-friendly Version
Interactive Discussion
Discussion
Paper
|D
iscussionP
aper|
Discussion
Paper
|D
iscussionP
aper|
Abstract
This paper presents an inverse modeling method based on wavelet analysis, devotedto assessment of the impacts of climate change on the groundwater resources of a con-fined coastal multi-layer aquifer, located in the south of France (Pyrénées-Orientales).The hydraulic behavior of the aquifer is described based on the results of a model cali-5
brated to simulate the groundwater dynamics observed on two representative piezome-ters. The relative contributions of the climate and pumping forcings to the piezometricvariations are quantified. The results illustrate in quantitative terms the dominant in-fluence of pumping on the temporal variations of the hydraulic head of the aquifer.Based on this specific behavior simulation, we show the moderate vulnerability of such10
confined aquifers to climate change. Some insights regarding pumping strategies forconfined coastal aquifers that could contribute towards preserving their good status infuture are also provided.
1 Introduction
Although groundwater resources are often critical for agricultural and drinking water15
uses, the impact of climate change on groundwater is less frequently analyzed thanfor surface water. Existing studies at the regional scale focus on changes of aquiferrecharge using reservoir models employing precipitation and PET (Thomsen, 1990;Chen et al., 2002), aquifer storage (groundwater level) and drainage (spring flow) us-ing water balance models (Döll, 2009; Rivard et al., 2014; Wada et al., 2014), three-20
dimensional finite difference groundwater models (Loaiciga et al., 2000; Allen et al.,2004; Serrat-Capdevila et al., 2007; van Roosmalen et al., 2007; Woldeamlak et al.,2007; Carneiro et al., 2010; Goderniaux et al., 2011; Habets et al., 2013; Castañoet al., 2013) or soil-vegetation-atmosphere transfer schemes (Bouraoui et al., 1999;Eckhardt and Ulbrich, 2003; Brouyère et al., 2004; Scibek and Allen, 2006; Caballero25
10110

HESSD12, 10109–10156, 2015
Impact of climatechange on
groundwater
Y. Caballero andB. Ladouche
Title Page
Abstract Introduction
Conclusions References
Tables Figures
J I
J I
Back Close
Full Screen / Esc
Printer-friendly Version
Interactive Discussion
Discussion
Paper
|D
iscussionP
aper|
Discussion
Paper
|D
iscussionP
aper|
et al., 2007; Crosbie et al., 2013; Portmann et al., 2013). For a complete review ofclimate change impacts on groundwater see Green et al. (2011).
Existing studies generally focus on unconfined aquifers because (1) they are gener-ally shallow (2) they are often in hydraulic connection with surface water where river-groundwater interactions control the impact of recharge on both systems (Allen et al.,5
2004; Scibek and Allen, 2006). Nevertheless, confined aquifers are of great interestespecially for water supply since they generally provide a water resource protectedfrom anthropogenic pollution. The few existing assessments of climate change impacton confined aquifers are usually performed using complex hydrodynamic models (seeGreen et al., 2011 or more recent papers such as Ali et al., 2012). For such models,10
detailed descriptions of the geometry and the hydraulic properties of the different layersare required, for a correct estimation of the transient flow component of the recharge(Seiler et al., 2008), as the aquifer response to loading from surface recharge mainlydepends on the change of pressure in the overlying confining units (Maliva et al., 2011).
For complex geological contexts such as those that can be found in the Mediter-15
ranean sedimentary rim (Duvail et al., 2005; Clauzon et al., 2015), the description ofthe layers geometry and hydraulic properties may be challenging enough to preventthe use of a hydrodynamic model. Alternative modeling methods able to simulate theclimate change impact without a detailed description of the aquifer geometry are thusrequired.20
This paper aims to present a modeling method based on wavelet analysis for theassessment of the climate change impact on a confined multi-layer aquifer affectedby major pumping exploitation. Such a method allows fitting a numerical relation be-tween climate, pumping and groundwater level variation, without explicitly taking intoaccount the aquifer geometry and its hydraulic properties. It thus represents an inter-25
esting option to explore global (ie. both climate and economic – considering the linkbetween future economic situation and the pumping withdrawals evolution to for thelatter) change impacts on such kind of complex aquifers.
10111

HESSD12, 10109–10156, 2015
Impact of climatechange on
groundwater
Y. Caballero andB. Ladouche
Title Page
Abstract Introduction
Conclusions References
Tables Figures
J I
J I
Back Close
Full Screen / Esc
Printer-friendly Version
Interactive Discussion
Discussion
Paper
|D
iscussionP
aper|
Discussion
Paper
|D
iscussionP
aper|
The following section describes the study area, the main hydrogeological character-istics of the confined aquifer studied, and the available data used for modeling. Thethird section presents a general description of the wavelet analysis and the way it hasbeen used for the estimation of the pumped volumes and the groundwater level vari-ation simulation. It also presents the climate scenarios used to force the model built.5
Results are presented and discussed in the fourth section, and main conclusions aresummarized in the last section.
2 The Roussillon plain Plio–Quaternary (PQ) aquifer
The Roussillon basin is located along the southernmost part of the French Mediter-ranean coast, near the Spanish border. This 700 km2 sedimentary basin is bordered10
by the foothills of the Pyrenean Mountains on the south and west, the Corbières karstregion on the north and the Mediterranean Sea on the east (Fig. 1). It is embeddedwithin a Miocene structured margin, the consequence of a marine regression followingthe Messinian salinity crisis (partial drying up of the Mediterranean Sea, approximately6 My ago, Benson et al., 1991). The regression caused the excavation of deep canyons15
by fluvial erosion, which were then filled up with fluvial and marine sands, which nowconstitute various sedimentological units deposited according to the “Gilbert Delta” ge-netic model (Clauzon, 1990; Guennoc et al., 2000; Aunay et al., 2006). Two majoraquifers, the Quaternary aquifer and the underlying continental and marine Plioceneaquifer, occupy these sediments.20
The Quaternary one lies along the principal rivers (Agly, Têt and Tech) and the coast-line, with thicknesses ranging from 10 m in the upper part of the valleys to more than20 m in the coastal fringe (Aunay et al., 2006). It is mainly exploited by farmers, privateindividuals and campsite owners.
The Pliocene is divided into an upper system formed by prograding fluvial sands25
and a lower system of prograding marine sands and clays, separated by diachronouslayers of lignite with plant remains alternating with marshy plastic-clays (Aunay et al.,
10112

HESSD12, 10109–10156, 2015
Impact of climatechange on
groundwater
Y. Caballero andB. Ladouche
Title Page
Abstract Introduction
Conclusions References
Tables Figures
J I
J I
Back Close
Full Screen / Esc
Printer-friendly Version
Interactive Discussion
Discussion
Paper
|D
iscussionP
aper|
Discussion
Paper
|D
iscussionP
aper|
2006). Its depth increases towards the coastline, where its maximum thickness reaches300 m (Duvail et al., 2005). Both sedimentological units constitute productive con-fined aquifers, with a transmissivity (and associated storage coefficient) ranging from10−2 m2 s−1 (4×10⁻⁵ m−1) for the continental sands, to 10−3 m2 s−1 (1×10⁻⁵ m−1) forthe marine sands (Chabart, 1996). These latter layers are not present everywhere,5
implying potential local connections between the upper and lower Pliocene aquifers(Aunay et al., 2006).
A network for monitoring groundwater status has enabled the compilation ofa database of piezometric levels over periods in some cases exceeding 30 years forcertain sites (Fig. 1).10
The data acquired indicate that the groundwater flows from west to east in thePliocene aquifers. The hydraulic gradient is low (about 1 to 4 ‰), and flow rates areprobably less than ten meters per year (Chery, 1992). Fourty years ago the piezomet-ric level of groundwater in the deep marine sands was artesian (Got, 1965; Aunay,2007). Since then, major exploitation of the aquifers by drilling (essentially for drinking15
water supplies and agriculture) has caused a net decrease in the hydraulic loads, espe-cially during the summer. In recent years and at certain sites, this decline has loweredthe groundwater level below sea level during the summer months, when withdrawalsare most intense.
The multilayer Plio–Quaternary Roussillon aquifer accounts for almost 80 % of the20
resources used for drinking water in the Département of Pyrénées Orientales. With-drawals for this purpose have doubled in the past 30 years to 47 Mm3 in 2007, including29 Mm3 from Pliocene formations (Terrasson et al., 2014). This increase in withdrawalsis in line with the increase in the population within the study area which depend onthis resource (+56 % in 30 years). However, a trend towards the stabilization of with-25
drawals for this purpose has been observed in recent years. Withdrawals from the Plio–Quaternary aquifer for uses other than drinking water supply are less well documented.They could be around 28 Mm3 yr−1 (including 5 Mm3 from the Pliocene) for agriculture,4 Mm3 from the Pliocene for industry, and 6 Mm3 (including 1 Mm3 in the Pliocene) from
10113

HESSD12, 10109–10156, 2015
Impact of climatechange on
groundwater
Y. Caballero andB. Ladouche
Title Page
Abstract Introduction
Conclusions References
Tables Figures
J I
J I
Back Close
Full Screen / Esc
Printer-friendly Version
Interactive Discussion
Discussion
Paper
|D
iscussionP
aper|
Discussion
Paper
|D
iscussionP
aper|
private wells. Thus, the total annual withdrawals from the Plio–Quaternary aquifer forall uses would reach a total of 83 Mm3, including 39 Mm3 from the Pliocene (Terrassonet al., 2014). Accordingly, the importance of this aquifer for the Département’s waterresources quickly established a need to understand its functioning, so as to be able tomanage the available resource in a sustainable manner.5
A lot of work has been done to describe the structure and geometry of the Plioceneaquifer (Duvail et al., 2005; Chabart, 1996; Aunay, 2007); it emphasizes the strongspatial variation of the sedimentological units involved. The first difficulty faced whentrying to deduce the hydrodynamic processes of the corresponding aquifers from theirgeological geometry is that there is a great lithological heterogeneity in the various10
sedimentological units described, e.g., continental sands and marine sands and clays.A consequence of this is that the hydrodynamic behavior of such units is also spatiallyvariable. There are also connections between the units, which are not simple horizontallayers separated by units of low permeability but the distributary channels of a deltaiccomplex filled by sand. Moreover, many more than 500 boreholes have been drilled15
to exploit the available groundwater resource in the Roussillon basin, 35 % of whichtap more than one sedimentological unit (Aunay, 2007). Thus pumping groundwater ina single borehole may have an impact on the hydraulic head of several sedimentologi-cal units. These major difficulties have so far prevented the construction of a 3-D grid-ded hydrodynamic model. Nonetheless, the monitoring network (Fig. 2) shows a rather20
coherent seasonal evolution of the groundwater levels at the scale of the whole aquifersystem. Consequently, the evolution of one particular groundwater level time series ofthe piezometric network can roughly be considered representative of that of the wholeaquifer system. Based on this fact, the data from two piezometers (10972X0137/PONTand 10908X0263/FIGUER), along those with the longer time series and located at con-25
trasted distance of the sea shore (Fig. 1), have been analyzed to provide some insightsabout the dynamic of the whole aquifer system under present and future conditions.
10114

HESSD12, 10109–10156, 2015
Impact of climatechange on
groundwater
Y. Caballero andB. Ladouche
Title Page
Abstract Introduction
Conclusions References
Tables Figures
J I
J I
Back Close
Full Screen / Esc
Printer-friendly Version
Interactive Discussion
Discussion
Paper
|D
iscussionP
aper|
Discussion
Paper
|D
iscussionP
aper|
3 Modeling method
3.1 General approach
Two piezometers The daily variations of the water levels observed in the piezome-ters at Perpignan (French Database Index 10908X0263/FIGUER) and Argelès (FrenchDatabase Index 10972X0137/PONT) are shown in Fig. 3. The groundwater level’s vari-5
ation is affected by recharge from rainfall, and pumping for domestic, industrial or agri-cultural needs. The groundwater level time series show a seasonal cycle at the annualscale and a long term tendency to fall (Fig. 3). To analyze whether the pumping couldexplain this, the monthly variation of the total pumping volume of all the boreholes lo-cated on the Pliocene aquifer during the 1998–2007 period, is compared to both time10
series (Fig. 3). As regards confined groundwater, it is considered that all the pump-ing operations targeting the aquifer will impact the piezometric levels measured at anypoint on it (Sen, 1995, page 170). In this study, various areas containing pumping op-erations likely to affect the Perpignan and Argelès piezometers were defined, on theassumption that the water flows are mainly oriented from west to east (Fig. 1). On the15
pumping measurement series, the seasonal pumping (SP) can be distinguished fromthe permanent pumping (PP) (Fig. 3). The PP is estimated from the pump dischargesduring the winter months (October to March). The SP is calculated by subtracting thePP from the pump discharges (total pumping).
We assume that annual variations in the piezometry are linked to the SP, while the20
long-term trend is linked to the PP from drinking water withdrawals, which have con-tinued to grow for nearly 30 years (Terrasson et al., 2014). To test and verify the effectof pumping on the piezometry we applied the techniques of signal processing, and inparticular the use of continuous wavelets (wavelet analysis sub-section). Cross char-acterizations of pumping and piezometry for the period 1998–2008 were then used25
to estimate the volumes pumped over the period 1974–1997, for which the volumespumped from Pliocene aquifers are poorly known (sub-section on estimation of pumpedvolumes).
10115

HESSD12, 10109–10156, 2015
Impact of climatechange on
groundwater
Y. Caballero andB. Ladouche
Title Page
Abstract Introduction
Conclusions References
Tables Figures
J I
J I
Back Close
Full Screen / Esc
Printer-friendly Version
Interactive Discussion
Discussion
Paper
|D
iscussionP
aper|
Discussion
Paper
|D
iscussionP
aper|
Transfer models were then developed to model the observed piezometric variations(sub-section on Inverse modeling), taking as input components the computed with-drawals and the recharge (effective rainfall). Finally, these transfer models were usedto simulate the impact of climate change on the Roussillon aquifer’s water resources,and to facilitate its discussion.5
3.2 Wavelet analysis
The variability and oscillations observed in the long-term hydrogeological time seriesin the monitored boreholes (Fig. 3) were studied using wavelet analysis. This analytictechnique is now extensively used in geoscience for the visualization, identificationand filtering of the main spectral components in time series (Labat, 2005, 2008, 2010;10
Lafrenière and Sharp, 2003; Maraun and Kurths, 2004; Yan and Jones, 2008). Choiceof the appropriate wavelet depends on the nature of the signal and on the type of infor-mation to be extracted from it. We used the Continuous Wavelet Transform (CWT) todetermine the dominant modes of variability and how those modes vary over time. ThePaul wavelet method described in Torrence and Compo (1998), was chosen because,15
as reported by De Moortel et al. (2004), it allows a better time resolution, for any valueof the wavelet parameter, than the Morlet wavelet.
Our wavelet analysis was aimed at the characterization of water-table variations inorder to identify the energy associated with seasonal and long-term increases in pump-ing. The long-term trend was characterized by using the wavelet-filtered time series20
(Torrence and Compo, 1998). Calculations were performed using the Paul wavelet,taking into account the entire pass-band of the piezometric measurement series. Thepiezometric variables filtered by the Paul wavelet enable access to figures not influ-enced by the long-term trend linked to the increase in permanent pumping (Fig. 4).The difference between the wavelength-filtered record (y1) and the measured piezo-25
metric record (y0) enables the long-term variation of a trend (y1− y0) to be character-ized (Fig. 4). The situation at the beginning of the measurement series constitutes thereference value for each of the measurement series studied. The processing applied
10116

HESSD12, 10109–10156, 2015
Impact of climatechange on
groundwater
Y. Caballero andB. Ladouche
Title Page
Abstract Introduction
Conclusions References
Tables Figures
J I
J I
Back Close
Full Screen / Esc
Printer-friendly Version
Interactive Discussion
Discussion
Paper
|D
iscussionP
aper|
Discussion
Paper
|D
iscussionP
aper|
shows that the long-term trend produced a water level drop of nearly 2 m for the Per-pignan piezometer and 1.5 m for the Argelès piezometer, between the beginning andthe end of their observation period. This reduction begins around 1982 in the case ofPerpignan (Fig. 4b) and is expressed from the very beginning of the shorter Argelèsmeasurement series (Fig. 4d).5
The SP may be compared to a pseudo-periodic phenomenon. Characterization ofthe impact of this phenomenon on the piezometry can be addressed using the Scale–Averaged Wavelet Power (SAWP) (Torrence and Compo, 1998). The exercise amountsto determining the pass-band (bandwidth), which best represents the duration of thistransient phenomenon. As a first step, the Fourier squared coherence (Torrence and10
Webster, 1999) was used to identify the time intervals (band) during which pumpingand water level are covarying (Fig. 5). The pumping and water-level time series for thePerpignan and Argelès piezometers show significant wavelet-squared coherence in the120 to 370 day band and low consistency outside these periods, i.e., not significant atthe 95 % confidence level.15
The SAWPs over the 120–370 day band for pumping and water level were calculated(Fig. 6a–d) for the Perpignan and Argelès piezometers. The variance in water level iswell correlated with the changes in pumping, as shown in Fig. 6e and f. The normal-ized cross-wavelet spectrum exhibits maximum coherence during summer (August,Fig. 6e and f). The methodological approach developed here allows us to show that20
the piezometric decreases (drawdowns) observed during summer periods are mainlycontrolled by the seasonal increase in withdrawals (SP) from the Pliocene aquifer. Themaximum SAWP corrected to the 95 % confidence level calculated for both piezome-ters is found in August (Fig. 5a and b). The energy of this Dirac function (called a combfunction) estimated for the month of August, is assumed to be proportional to the cu-25
mulative SP discharge.
10117

HESSD12, 10109–10156, 2015
Impact of climatechange on
groundwater
Y. Caballero andB. Ladouche
Title Page
Abstract Introduction
Conclusions References
Tables Figures
J I
J I
Back Close
Full Screen / Esc
Printer-friendly Version
Interactive Discussion
Discussion
Paper
|D
iscussionP
aper|
Discussion
Paper
|D
iscussionP
aper|
3.3 Estimation of pumped volumes
Over the period 1998–2007, the figures for the long-term trend (y1− y0) are relatedto the variation of permanent pumping by power functions, best regression fit obtainedwith an origin passing by zero (Fig. 7). These functions enable reconstruction of thefigures for the permanent pumping component for the period prior to 1998, for Per-5
pignan and Argelès (Fig. 8). For the seasonal pumping, we employ the normalizedcross-wavelet spectrum (Fig. 5e and f) to reconstruct it, based on the SAWP time se-ries over the 120–371 day band for water level (Fig. 5a and b) for the period prior to1998. The variation of seasonal pumping calculated and then reconstituted for the twopiezometers during the period prior to 1998 is presented in Fig. 8. The functions estab-10
lished to reconstruct the permanent and seasonal pumping were then used as inputsfor the transfer models applied to simulate the piezometric variations at Perpignan andArgelès (see “Inverse Modeling” section).
3.4 Inverse modeling
The hydrogeologic modeling was performed using transfer methods implemented with15
TEMPO software (Pinault, 2001). Calculation of the non-parametric impulse responsesis achieved by inverse modeling with stress positivity. The term inverse modeling ishere restricted to the parameter identification of convolution kernels used to simulatethe output from the input. The calculation of impulse responses under stress allows theprinciple of conservation of water mass to be satisfied.20
Computation of the impulse response uses regularization methods inspired byTikonov and Arsenine (1976), Tikonov and Goncharsky (1987), and Dietrich and Chap-man (1993), as described by Pinault et al. (2001a). The search for a solution by theregularization technique seeks to find the optimal solution for the transport equation(Eq. 1). Among all possible solutions, the approach of minimizing the norm of the trans-25
port equation allows selecting the solution with the smallest norm so as to smooth thenon-parametric impulse response (Pinault et al., 2001a).
10118

HESSD12, 10109–10156, 2015
Impact of climatechange on
groundwater
Y. Caballero andB. Ladouche
Title Page
Abstract Introduction
Conclusions References
Tables Figures
J I
J I
Back Close
Full Screen / Esc
Printer-friendly Version
Interactive Discussion
Discussion
Paper
|D
iscussionP
aper|
Discussion
Paper
|D
iscussionP
aper|
The inverse modeling approach appears to be well suited to characterizing the func-tioning of complex hydro-systems (Pinault et al., 2001a, b; Pinault et al., 2004, 2005;Pinault and Schomburgk, 2006; Dörfliger et al., 2009; Ladouche et al., 2014). In thisstudy, the method used to simulate water-table variation in the PQ aquifer describes thefluctuations of the groundwater head by using components associated with recharge5
from rainfall, and seasonal and permanent pumping (Fig. 9), as described by thewavelet analysis.
The piezometric variation is described by the following convolution equation:
∆H(t) = λΓ∗Reff + λ1Γ1∗QSP + λ2Γ2∗QPP + λ3Γ3∗QRiv +ε (1)
where Γ,Γ1,Γ2, and Γ3 are the normalized non-parametric impulse responses (inte-10
grated area of the impulse response over its lag time equal to 1), Γ is the normalizedimpulse response of recharge from effective rainfall; Γ1 is the normalized impulse re-sponse of seasonal pumping (SP); Γ2 is the normalized impulse response of perma-nent pumping (PP); Γ3 is the normalized impulse response of the river’s contribution(QRiv), and ε represents the erratic contribution that is not described or explained by15
the model.λ,λ1, λ2 and λ3 are positive coefficients for expressing the conservation of water
mass (the bar over the quantities indicate a mean value over the total calibration pe-riod):
λReff
∆H+ λ1
QSP
∆H+ λ2
QPP
∆H+ λ3
QRiv
∆H= 1 (2)20
The term λ1QSP allows us to describe the drawdown caused by the seasonal pumping(QSP). The term λ2QPP describes the long term decreasing trend caused by the per-manent pumping (QPP). The term λ3QRiv allows us to describe the river contributionto recharge. The term λReff allows a description of the contribution from the effectiverainfall.25
10119

HESSD12, 10109–10156, 2015
Impact of climatechange on
groundwater
Y. Caballero andB. Ladouche
Title Page
Abstract Introduction
Conclusions References
Tables Figures
J I
J I
Back Close
Full Screen / Esc
Printer-friendly Version
Interactive Discussion
Discussion
Paper
|D
iscussionP
aper|
Discussion
Paper
|D
iscussionP
aper|
The effective rainfall is calculated by:
Reff(t) = R(t)−Ω(t) if RΣ(t) ≥Ω(t), otherwise Reff(t) = 0 (3)
Where R is rainfall and Ω is a threshold function:
Ω(t) = Gr∗R(t)+GTa∗Ta(t)+C (4)
where ∗ is the discrete convolution product, t the time, C a constant, and Gr and GTa5
the impulse responses such that GTa > 0 and Gr < 0. These two impulse responses(Gr and GTa) are represented by trapezia (not shown). Details of the impulse responseparameter calculation are presented in Pinault et al. (2001a).
The effective rainfall Reff(t) comprises two components: Reff(t) = Rs(t)+Rf(t), whereRs(t) and Rs(t) are the components of effective rainfall that respectively induce the slow10
and fast responses of the system. The fast component is assumed to be representativeof the fast infiltration which occurs only after high-rainfall events. The component Rf(t)is expressed according to Reff(t) by the Alpha function [α(t)]:
Rf(t) = α(t)×Reff(t) (5)
where α(t) is the proportion of effective recharge (its values lies between 0 and 1). The15
Alpha function enables consideration of the non-linear switching behavior of the soilreservoir, which depends on the effective rainfall over the preceding days. The Alphafunction is related to the effective recharge by the convolution product:
α(t) = Γα,Reff∗Reff(t) (6)
where ∗ is the discrete convolution product, t the time, and Γα,Reff the impulse re-20
sponse of α(t) to effective rainfall Reff(t). The impulse responses are also representedby trapezia (not shown).
10120

HESSD12, 10109–10156, 2015
Impact of climatechange on
groundwater
Y. Caballero andB. Ladouche
Title Page
Abstract Introduction
Conclusions References
Tables Figures
J I
J I
Back Close
Full Screen / Esc
Printer-friendly Version
Interactive Discussion
Discussion
Paper
|D
iscussionP
aper|
Discussion
Paper
|D
iscussionP
aper|
3.5 Climate scenarios
While early studies used simplified climate scenarios involving fixed ranges of precip-itation or recharge against which to compare the groundwater response (Woldeamlaket al., 2007; Wilkinson and Cooper, 1993; Ferguson and Maxwell, 2010), an increasingnumber of studies now use climate scenarios derived from the outputs of climate mod-5
els (Green et al., 2011). To build these climate scenarios, various methods of bias cor-rection and downscaling are applied. These methods range from the simple but robustso-called perturbation method, based on the mean monthly differences between fu-ture and present measurements (Déqué, 2007), to more sophisticated methods (calledstatistical or dynamic) which mainly enable the distributions of future meteorological10
variables to be compared to present-day ones (Déqué, 2007; Boé et al., 2006; Fowleret al., 2007; Goderniaux et al., 2009, 2011).
In this study a set of five climate scenarios were constructed by using the perturba-tion method. This method consists of taking a meteorological data set representativeof the present, and applying the mean monthly anomalies between future and present-15
day temperatures and precipitations simulated by the climate models (Déqué, 2007;Xu, 1999). Daily precipitation and potential evapotranspiration (PET) for the 1970–2006 period were extracted from the SAFRAN meteorological database (Vidal et al.,2010) available for the study zone on a regular 8km×8km grid (Chaouche et al.,2010). Among the 21 climate-model outputs from the World Climate Research Pro-20
gram’s (WCRP) Coupled Model Intercomparison Project Phase 3 (CMIP3) multi-modeldataset (Meehl et al., 2007), which are available through the Program for Climate ModelDiagnosis and Intercomparison (PCMDI), five climate models were selected over theFrench region. They were chosen as they were considered as able to capture both re-gional precipitation and temperature climatology for the Mediterranean region (Mariotti25
et al., 2008). These models are CNRM-CM3 (Salas y Melia et al., 2005), HadGEM1(Johns et al., 2006), IPSL-CM4 (Hourdin et al., 2006), MPI-ECHAM5 (Roeckner et al.,2006; Jungclaus et al., 2006), and NCAR-CCSM3.0 (Collins et al., 2006). Atmospheric
10121

HESSD12, 10109–10156, 2015
Impact of climatechange on
groundwater
Y. Caballero andB. Ladouche
Title Page
Abstract Introduction
Conclusions References
Tables Figures
J I
J I
Back Close
Full Screen / Esc
Printer-friendly Version
Interactive Discussion
Discussion
Paper
|D
iscussionP
aper|
Discussion
Paper
|D
iscussionP
aper|
temperature and precipitation (spatial resolution from 1 to 3.75) were extracted for theFrench region (8 W to 10 E, 40 to 52 N) and for the 1980 2000 (reference), 2020–2040 (near-term), and 2040–2060 (medium-term) periods, and for the SRES-A1B sce-nario. This greenhouse-gas emission scenario is considered to be a compromise be-tween a more optimistic scenario such as the SRES-B1 and a more pessimistic one5
such as the SRES-A2, although they differ only slightly for the period studied (Hourdinet al., 2006; Nakicenovic and Swart, 2000).
The mean monthly anomalies of temperature and precipitation calculated from thefive climate models provide a description of the average climate change between thetwo future periods considered and the present, together with an illustration of the un-10
certainties associated with climate modeling. A multi-model average increase in tem-perature of between +1.0 and +1.8 C is projected, depending on the season, for thenear-term (2020–40) compared to the present. The projected increase is even greaterfor the medium term (204060), between +1.7 and 3.3 C, with in addition a greaterinter-seasonal variation compared to the near term. For precipitation, there is no clear15
signal for the near term (−10.9 to +10.5% depending on the season), while a decrease(−21.9 to −2.1%) is projected for the medium term. The large uncertainty associatedwith the calculated anomalies is higher for precipitation than for temperature, for sum-mer than for winter, and for the medium term than for the near term.
More details about climate scenarios can be found in Caballero et al. (2008). While20
more sophisticated downscaling methods than the perturbation one (Quintana-Seguíet al., 2010) and new climate model simulations, like those carried out for the AR5 IPCCreport, (Terray and Boé, 2013) have been performed on our study area, they have sofar not produced sharply different results in terms of monthly average anomalies.
10122

HESSD12, 10109–10156, 2015
Impact of climatechange on
groundwater
Y. Caballero andB. Ladouche
Title Page
Abstract Introduction
Conclusions References
Tables Figures
J I
J I
Back Close
Full Screen / Esc
Printer-friendly Version
Interactive Discussion
Discussion
Paper
|D
iscussionP
aper|
Discussion
Paper
|D
iscussionP
aper|
4 Results
4.1 Modeling of the piezometric levels at Argelès and Perpignan
The transfer model for the Argelés piezometer provides a satisfactory simulation ofthe 10 day sampling interval variations in the measured piezometry for the calibrationperiod (Nash criterion = 0.82, Fig. 10a). These results were obtained without taking5
into account any recharge by the Tech River. The model was validated against thewater levels measured for the 1990–1998 period (Fig. 12); it satisfactorily reproducesthe seasonal pumping periods and the Nash criterion of 0.82 is considered acceptable.
The mean transit time (Tm) associated with the normalized impulse response isthe mean value of the lag time (Pinault et al., 2005). The response of the aquifer to10
recharge by effective rainfall is highly inertial, since Tm is 220 days, for an impulseresponse length of 520 days (Fig. 10c). The relative contribution of a hydrological cy-cle’s recharge (fast + slow component) results in piezometric variations of about 0.5 to0.8 m (Fig. 10b). The relative contribution of SP to the variations in piezometry is about−0.8 m over a hydrological cycle (Fig. 10b). The maximum response of the aquifer15
to seasonal pumping (SP) is detected during the month of August (Fig. 6f). It occurs75 days after the start of pumping (Fig. 10d). The increase in PP over the period 1991–2007 is expressed by a decrease in the piezometry of about −0.6 m over the 17 yearsconsidered.
For the Perpignan site, the transfer model allows reproduction of the measured piezo-20
metric variations only if a water supply from the Têt River is considered. The transfermodel enables a satisfactory reproduction of the variation in the groundwater level mea-sured at the Perpignan piezometer (Nash criterion= 0.85, Fig. 11a). The model wasvalidated with the water levels observed for the 1976–1994 period (Fig. 11a) whichwere satisfactorily reproduced (Nash criterion = 0.66). The flow rate of the Têt River25
upstream of the Roussillon plain is sustained in spring and summer by the release ofwater from the Vinca dam, which introduces a phase shift in the river’s flow regime withrespect to its natural regime. The contribution of recharge by precipitation thus differs
10123

HESSD12, 10109–10156, 2015
Impact of climatechange on
groundwater
Y. Caballero andB. Ladouche
Title Page
Abstract Introduction
Conclusions References
Tables Figures
J I
J I
Back Close
Full Screen / Esc
Printer-friendly Version
Interactive Discussion
Discussion
Paper
|D
iscussionP
aper|
Discussion
Paper
|D
iscussionP
aper|
both temporally and quantitatively from the releases at the dam on the Têt (the rechargecauses an increase in the piezometric level of a maximum of 0.5 m and is expressedmainly in winter, whereas the Têt’s contribution causes a rise in the level of between0.3 and 0.8 m, generally expressed in the summer – Fig. 11b). The response of theaquifer to recharge by effective rainfall appears less inertial than that characterized at5
Argelès (maximum and mean response time 60 and 89 days respectively – Fig. 11c).The aquifer’s response to recharge by releases from the dam reaches a maximum af-ter 70–80 days (Fig. 11c). This maximum response is detected in late July, which isconsistent with the fact that the dam releases occur generally in April of each year.
Seasonal pumping (SP) causes piezometric variations of between −1.8 and −3 m10
over a hydrological cycle (Fig. 11b). The aquifer’s maximum response to seasonalpumping (SP) occurs 75 days after the start of pumping (Fig. 11d); this maximum re-sponse is detected in late June (Fig. 6e) vs. late July for Argelès (Fig. 11b). For Perpig-nan, recharge by the Têt River, which is at a maximum during July, masks the effect ofseasonal pumping (SP), which should reach its maximum in late July.15
The increase in PP over the period 1974–2007 is expressed by a decrease in thepiezometry of about −0.9 m over the 33 year period studied. Table 1 summarizes thecharacteristics of the models applied to reproduce the piezometric variations observedin the Argelès and Perpignan piezometers. The greater inertia observed at Argelèsis illustrated by smaller piezometric variations (cf. Figs. 11a and 12, lower panel),20
a greater impulse-response length (520 days for Argelès and 300 days for Perpignan)and a markedly longer average transit time (Tm: 220 days for Argelès vs. 89 days forPerpignan). It also shows the spatial heterogeneity of the hydraulic behavior of thesandy Pliocene formations.
Near Perpignan, we note that the Pliocene aquifer responds to releases from the Têt25
dam more slowly than to recharge (τ3: 70–80 d vs. τ: 60 d in Table 1). This is probablyconnected to the fact that the water released at the dams is mostly directed to irrigatedareas, sometimes located more than 20 km downstream, via canals which may or maynot be leakproof. These canals enable the irrigation of tree and truck-farming crops
10124

HESSD12, 10109–10156, 2015
Impact of climatechange on
groundwater
Y. Caballero andB. Ladouche
Title Page
Abstract Introduction
Conclusions References
Tables Figures
J I
J I
Back Close
Full Screen / Esc
Printer-friendly Version
Interactive Discussion
Discussion
Paper
|D
iscussionP
aper|
Discussion
Paper
|D
iscussionP
aper|
on the plain. The water not consumed by irrigated crops contributes to recharging theQuaternary alluvial water tables, formerly exploited to provide drinking water. Alluvialgroundwater can contribute locally to the underlying Pliocene formations (Aunay, 2007).
Finally, the effect of permanent pumping (PP) on the piezometry is comparable forthe two sites and is expressed by a decrease of about 30 to 40 cm per decade. To5
assess the quality of the simulation performed, sensitivity analyses were carried out onvariations in the forcings (recharge and pumping) used in the transfer model developedfor Argelès (Fig. 12).
The behavior of the model was accordingly evaluated for a period of 11 years in theabsence of pumping [a], and then for a reduction in precipitations of about 50 % [b]10
and 90 % [c] with respect to the test period, under pumping conditions (for SP and PP)identical to those of 2006. A test with pumping shut down shows that the simulatedpiezometric levels quickly rise up again and then stabilize at an elevation of about9.5 m NGF. This result strengthens confidence in the quality of the model since (1) Itsimulates a piezometric level in the absence of pumping that is higher than the figures15
observed at the beginning of the available measurement series (about 9 m NGF ata period when pumping was weaker than at any other point in the time series), and (2)the simulated level stabilizes at a figure close to the piezometric level measured duringthe installation of the meter, in 1984 (9.7 ma.s.l. – Infoterre Argelès, 2013).
The test of major decrease in rainfall shows the expected disappearance of the effect20
of recharge and a stabilization of the water level, which no longer fluctuates exceptunder the effect of seasonal pumping (SP), producing variations of about 1 m. Themodel thus reproduces the confined nature of the aquifer.
4.2 Impacts of climate change
The impact of climate change on the simulated piezometric levels was assessed using25
the model constructed for the Argelès piezometer. This analysis could not be performedfor the Perpignan piezometer because this would require an explicit simulation of flowsin the Têt River and the management of the Vinca dam in the context of a future climate.
10125

HESSD12, 10109–10156, 2015
Impact of climatechange on
groundwater
Y. Caballero andB. Ladouche
Title Page
Abstract Introduction
Conclusions References
Tables Figures
J I
J I
Back Close
Full Screen / Esc
Printer-friendly Version
Interactive Discussion
Discussion
Paper
|D
iscussionP
aper|
Discussion
Paper
|D
iscussionP
aper|
The results obtained for the reference scenario [1980–2000 period] were comparedwith the results of the scenarios for the near [2020–2040] and medium [2040–2060]terms from the five climate models (CNRM; HADC; IPSL; MPIM; NCAR) and the MULTImodel (multi model average). The simulations were performed with and without pump-ing. The pumping scenario considered (PS and PP) is identical to that for the year 2008,5
i.e., the pumpings are identical from one cycle to another over the 20 years consideredin the analysis, for current and future periods.
The variations of the interannual monthly means of simulated effective rainfall overthe reference period (1980–2000), the near (2020–2040) and the medium (2040–2060)terms are compared on Fig. 13. The multi-model mean and the envelope curves limited10
by the minimum and maximum values calculated from the monthly means of effectiverainfall in all scenarios, which represent their dispersion, are shown. In the near term,effective winter rainfalls would be comparable to those in the reference period, althoughthey should be lower in the spring (−20 to −50 % in the multi-model mean). However,high uncertainty is associated with these variations because they fall within the sce-15
narios’ tolerance interval. In autumn, the effective rainfall should also be lower (from−20 to −30 % in the multi-model mean), compared to those in the reference period,with greater certainty than in the spring, given the smaller dispersion of the scenariosin October and November. In the medium term, the downward signal grows stronger,both in intensity and in certainty, as future variations fall out of the scenarios’ tolerance20
interval. Thus a sharp drop in effective rainfall may be observed in the spring (from−20 to −90 % in the multi-model mean), as well as in the fall and early winter (−30 to−60 %) as compared to the reference period. Only the effective rainfalls of Novemberand January appear unchanged.
The variation of the interannual monthly means of the simulated piezometric levels25
for the reference scenario (1980–2000) and future climate scenarios (2020–2040 and2040–2060), with and without pumping, are compared on Fig. 14. In the near term(2020–2040), the piezometric levels in the absence of pumping appear comparableto those in the reference scenario (monthly interannual range of variability expressed
10126

HESSD12, 10109–10156, 2015
Impact of climatechange on
groundwater
Y. Caballero andB. Ladouche
Title Page
Abstract Introduction
Conclusions References
Tables Figures
J I
J I
Back Close
Full Screen / Esc
Printer-friendly Version
Interactive Discussion
Discussion
Paper
|D
iscussionP
aper|
Discussion
Paper
|D
iscussionP
aper|
by the standard deviation overlaps those falling between the minimum and maximumfigures obtained for all scenarios – Fig. 14 upper panel, left). Under permanent pumpingonly (SC1) or both permanent and seasonal (SC2), the piezometric level would fallslightly in all months of the year. However, the scenarios’ tolerance interval includesthis situation, indicating that the observed decrease is probably not significant.5
In the medium term (2040–2060), piezometric levels in the absence of pumpingwould fall significantly in every season (the scenarios’ tolerance interval is located out-side the current monthly interannual range of variability – Fig. 14 upper panel, right).We see here that the projected drop in recharge in the autumn and spring (Fig. 13)produces a decrease in the piezometric level year-round (a result related to the sys-10
tem’s inertia). Taking into account the pumping (SC1 or SC2, Fig. 14, middle and lowerpanels, right), does not change the order of magnitude of the projected decline.
5 Discussion
The modeling methods based on wavelet analysis presented in this paper have enabledus to simulate the behavior of a confined aquifer with a highly complex hydrogeology, in15
the vicinity of two observation piezometers. They also allowed us develop a descriptiveoutline of the principal processes involved. Thus, while the behavior of this aquifer asobserved at the various existing monitoring stations seems fairly homogeneous (sea-sonal fluctuation of groundwater levels characterized by a downward trend over thelast 30 years), the modeling performed has identified a number of processes at work,20
depending on the areas considered.Firstly, the Argelès area exhibits a behavior that seems more inertial than the one
at Perpignan. This is expressed (Table 1) by a longer duration and mean transit timeof the normalized impulse response, and a smaller relative contribution of the SP towater-level changes for Argelès. Nonetheless, the sensitivity of its changes in water-25
level to effective rainfall is slightly greater than that at Perpignan, and its lag time formaximum response of the normalized impulse response is shorter. This means that
10127

HESSD12, 10109–10156, 2015
Impact of climatechange on
groundwater
Y. Caballero andB. Ladouche
Title Page
Abstract Introduction
Conclusions References
Tables Figures
J I
J I
Back Close
Full Screen / Esc
Printer-friendly Version
Interactive Discussion
Discussion
Paper
|D
iscussionP
aper|
Discussion
Paper
|D
iscussionP
aper|
the transfer of hydraulic head linked to recharge into the aquifer is faster for the Argelèsarea than for Perpignan. The more inertial character of Argelès expresses the lowertransmissivity of the aquifer in this area as compared to Perpignan, which is consistentwith the orders of magnitude estimated by interpretation of the pumping tests availablefor the aquifer (Aunay, 2007). The greater sensitivity of the piezometric level at Argeles5
could be explained by a smaller storage coefficient, but this parameter of the aquifer ispoorly known (Aunay, 2007).
Finally, the faster transfer of pressure (30 days for Argelès vs. 60 at Perpignan) couldbe explained by a higher diffusivity (ratio of transmissivity to storage coefficient), re-flecting that the aquifer is more confined in the Argelès sector than in the Perpignan10
sector.However, other factors may also explain the difference in behavior between the two
areas. The thicker Quaternary formations which overlie the Pliocene ones in the Per-pignan area could have a buffering effect on the infiltration of effective rainfall (Fig. 1).The formations of the Corbières karstic system, which have circulations at depths of15
more than 100 m, recharge the Pliocene aquifer at depth (Aunay, 2007), probably witha time-lag after rainfall. Lastly, the presence of a large network of canals, used for ir-rigation and fed from the dam on the Têt, may also cause a delay in the infiltration ofeffective rainfall. To distinguish the effects of these various factors on the behavior ofthe groundwater, it would be necessary to explicitly incorporate into the modeling not20
only the Quaternary and karstic formations but also the layout of the canals.Secondly, the analysis highlights the overall preponderant influence, at the annual
scale, of the withdrawals by SP and PP as compared to the recharge, which explainsthe continued decline in water levels observed throughout the measurement series.The modeling shows that the trend component corresponding to PP affects both sites25
in the same way (decrease of about 0.3 mdecade−1). The relative contribution of SP towater level changes is higher for Perpignan than for Argelès (Table 1), while the lowertransmissivities in this area should lead to larger drawdowns.
10128

HESSD12, 10109–10156, 2015
Impact of climatechange on
groundwater
Y. Caballero andB. Ladouche
Title Page
Abstract Introduction
Conclusions References
Tables Figures
J I
J I
Back Close
Full Screen / Esc
Printer-friendly Version
Interactive Discussion
Discussion
Paper
|D
iscussionP
aper|
Discussion
Paper
|D
iscussionP
aper|
This is probably related to the fact that, for Argelès, the contribution of the Tech riverwas not explicitly taken into account because it is synchronous with the contributionfrom precipitation. However, this contribution is probably included in the two seasonalcomponents used in the model (recharge and SP). In this case, it leads to an overes-timation of the recharge component and/or an underestimation of the SP component5
(hence its smaller contribution to water level changes as compared to that seen at Per-pignan),although it is impossible to quantify them. Since the contribution of the Têt riveris explicitly taken into account in modeling the piezometric level at Perpignan (via thereleases from the Vinca dam), the quantification of the SP component is probably morerealistic than at Argelès.10
Figure 12 (case a) shows that if pumping stops, the simulated water level risesabruptly back up, reaching an equilibrium level in less than one hydrological cycle.This is related to the mean transit time of the impulse response to effective rainfallemployed in the model, whose duration is less than one year (Table 1). Similarly, ifwe consider a zero recharge (Fig. 12b and c), the simulated piezometric level remains15
at an equilibrium level and does not fall over time, in spite of the pumping. The modelthus expresses the highly confined nature of the aquifer in the Argelès area, where vari-ations in the piezometric level are controlled by rapid changes of pressure within theaquifer rather than by a flow dynamic known to be slow (flow rates of less than10 myr−1,obtained from tritium and carbon-14 dating by Chery, 1992). However, although the20
functioning of the model in a no-recharge situation may be viewed as realistic, transientvariations of the piezometric level are mainly controlled by the permanent pumping (themodel was constructed on the assumption that the long-term trend is fully explainedby the signal of increase in the PPs). This explains why the simulated piezometric levelremains stable on Fig. 12b and c, instead of gradually falling under the effect of pump-25
ing, in the absence of recharge. Now, a rising trend in the temperatures of the studyarea was noted between 1971 and 2000 (Chaouche et al., 2010). This increase mayhave caused a reduction in the effective rainfall over the period 1970–2008. In thisregard, a portion of the downward trend in water levels could also be related to long-
10129
HESSD12, 10109–10156, 2015
Impact of climatechange on
groundwater
Y. Caballero andB. Ladouche
Title Page
Abstract Introduction
Conclusions References
Tables Figures
J I
J I
Back Close
Full Screen / Esc
Printer-friendly Version
Interactive Discussion
Discussion
Paper
|D
iscussionP
aper|
Discussion
Paper
|D
iscussionP
aper|
term climate variability. This is the major limitation of the modeling approach adopted,and which we cannot escape when dealing with confined aquifers subjected to majorexploitation by pumping.
The tests presented in Fig. 12 show that the equilibrium state of the water levelsin the Argelés area is controlled by PPs. If permanent pumping on the aquifer were5
doubled, it is probable that the model would simulate a fall in the piezometric level untilit reached a new steady state. From a hydrodynamic perspective it can therefore beconsidered that this aquifer would be capable of supporting a larger pumping opera-tion. The aquifer thus appears to be relatively invulnerable to climate change. This ideais backed up by the projections in Fig. 13, which show that in the medium term the10
simulated piezometric level for Argelès would be affected by a decrease of no morethan about 0.5 m. This decrease is less than that caused by the current exploitationof the aquifer (which produces a decrease of more than 1.5 m, taking PP and SP to-gether). It would therefore appear possible to offset the declining recharge projected inthe climate scenarios by a well thought-out exploitation of the aquifer, which could prob-15
ably be achieved with improved water-use efficiency and water-demand management(Green et al., 2011). The relationship between the volume pumped by the PP and thedrop in the water level (Fig. 7) indicates that over the near and medium term we couldmaintain the current piezometric level by retaining the current permanent pumping ofabout 7 million m3 (vs. about 8 million currently) for Perpignan and 2 million m3 (vs.20
some 2.2 million at present) for Argelès.Nevertheless, the vulnerability of this coastal aquifer to saline intrusion problems may
still be exacerbated by the effect of CC. If we extrapolate the simulated medium-termfall in piezometric level at Argelès (of about 50 cm) to the station at Barcarès (Frenchdatabase index 0912X0112/BAR3), located on the beach at the mouth of the Agly river,25
its piezometric level would fall to about 2 m below sea level under summer conditions.The great sensitivity of the water level to seasonal pumping identified by the modeling(Figs. 10 and 11) could then be used to limit this fall by reducing coastal withdrawalsduring the summer. This reduction could be offset by pumping in wintertime or alter-
10130

HESSD12, 10109–10156, 2015
Impact of climatechange on
groundwater
Y. Caballero andB. Ladouche
Title Page
Abstract Introduction
Conclusions References
Tables Figures
J I
J I
Back Close
Full Screen / Esc
Printer-friendly Version
Interactive Discussion
Discussion
Paper
|D
iscussionP
aper|
Discussion
Paper
|D
iscussionP
aper|
natively by an increase in withdrawals near the massifs. This is all the more plausiblesince simulation tests have shown similar modeling results whether we consider thepumping boreholes in the areas outlined in Fig. 1 or those throughout the whole studyarea (not shown). This means that given constant withdrawals across the region, pump-ing carried out sufficiently far from a given point will not impact its piezometric behavior.5
This feature could therefore be used to limit the decrease imposed by climate changeon coastal piezometers.
The work presented in this article constitutes a modeling exercise; the representa-tiveness of its results for the aquifer as a whole may be questioned. The first limit thatcan be identified resides in the fact that the two piezometers at Argelès and Perpignan10
are installed in formations that are not exactly the same throughout the sedimentarypackage that makes up the aquifer. This is expressed by their very different impulseresponse characteristics for recharge (the formations tapped at Perpignan exhibitinga lesser inertia than the ones at Argelès). Despite this, the confined nature of theaquifer is expressed by a great similarity among the piezometric behaviors observed in15
all the piezometers, particularly in coastal areas, insofar as they respond primarily topressure transfers.
It is therefore probable that the magnitude of the impact of the diminished rechargeprojected for Argelès (around 0.5 m) can be extrapolated to the entire aquifer. Thesecond limit deserving of attention lies in the fact that the modeling performed does not20
permit a rigorous exploration of the future vulnerability of the aquifer to saline intrusions.Indeed, the decreases in water level simulated for the near and medium term are likelyto intensify this vulnerability, especially along the coast.
To explicitly incorporate this issue in the analysis, it will be necessary to simulate thevariation of the quality of the water in the aquifer, and in particular its salinity.25
10131

HESSD12, 10109–10156, 2015
Impact of climatechange on
groundwater
Y. Caballero andB. Ladouche
Title Page
Abstract Introduction
Conclusions References
Tables Figures
J I
J I
Back Close
Full Screen / Esc
Printer-friendly Version
Interactive Discussion
Discussion
Paper
|D
iscussionP
aper|
Discussion
Paper
|D
iscussionP
aper|
6 Conclusions
This article shows how wavelet analysis techniques can be utilized as an alternativeto hydrodynamic models for confined aquifers, whose geological complexity preventa detailed description of the geometry and the hydraulic properties of the saturatedand overlying units. Using these techniques, the variation of groundwater levels in two5
piezometers installed in a confined, heavily exploited aquifer of a Mediterranean coastalzone has been simulated. They were implemented in order to take into account theimpact of pumping on drawdown of the water table and, by doing so, to simulate theunimpacted piezometric measurement series.
The proposed approach enabled us to identify and rank the factors that affect the10
seasonal fluctuations of the water table, and to improve our conceptual model of theaquifer.
On the one hand, the predominant influence of pumping, as the main factor con-trolling drawdown of the water table, has thereby been highlighted. For a completeunderstanding of the piezometric variation, it appeared also necessary to take into ac-15
count the contributions of surface waters in the catchment areas bordering the aquifer(streams and karstic aquifers). Lastly, differences in hydrodynamic behavior betweenthe two areas studied were described in a qualitative manner. On the other hand, itappeared that the wavelet analysis is unable to distinguish between the influences ofcomponents whose temporal dynamics are too similar, such as recharge by rainfall and20
by streams reacting to that rainfall.The assembled model was then used to study the impact of climate change (five
scenarios) on the aquifer’s water resources. The reduction in future precipitation pre-dicted by the scenarios is expressed in a moderate decrease in effective rainfall andin the piezometric level of the water table (50 cm); however, this decrease becomes25
significant in the medium term (2050), in spite of the high uncertainty associated withrainfall predictions. This relatively low vulnerability is explained by the confined natureof this aquifer, whose balance is controlled by pumping. This impact could quite easily
10132

HESSD12, 10109–10156, 2015
Impact of climatechange on
groundwater
Y. Caballero andB. Ladouche
Title Page
Abstract Introduction
Conclusions References
Tables Figures
J I
J I
Back Close
Full Screen / Esc
Printer-friendly Version
Interactive Discussion
Discussion
Paper
|D
iscussionP
aper|
Discussion
Paper
|D
iscussionP
aper|
be limited by a change in the pumping strategy for the aquifer, which might equallywell consist of taking less water each year, or a better distribution of withdrawals be-tween the summer and winter seasons, or between withdrawals at the coast and nearthe mountains. Nevertheless, the relative invulnerability to climate change of confinedaquifers of the type studied in this article must be placed in context, inasmuch as the5
modeling carried out does not take into account the problem of saline intrusions. Itappears likely that the decline in water level projected under future climates might en-courage the infiltration of sea water. The rise in sea level correlated with the predictedfuture warming trend reinforces the necessity of incorporating it into the analysis. Inthis regard, only hydrodynamic modeling based on a description of the geometry of the10
aquifers and their relationship with the sea will enable us to study this issue.
Acknowledgements. Y. Caballero and B. Ladouche designed the simulation strategy and theresults analysis, B. Ladouche developed the model code and performed the simulations. Y. Ca-ballero and B. Ladouche prepared the manuscript. This study was supported by the NationalResearch Agency (Agence Nationale pour la Recherche – ANR) through its VMC 2006 pro-15
gram (VULCAIN Project, Contract-ANR-06-VULN-008-01) and the French Geological Survey(Bureau de Recherches Géologiques et Minières – BRGM). The authors would like to thanktheir VULCAIN partners for their contributions. We are also grateful to the modeling groups, theProgram for Climate Model Diagnosis and Intercomparison (PCMDI) and the WCRP’s Work-ing Group on Coupled Modeling (WGCM) for their roles in making available the WCRP CMIP320
multi-model dataset. Support of this dataset is provided by the Office of Science, U.S. Depart-ment of Energy. The authors thank J.C. Marechal for assisting in organizing this paper.
References
Ali, R., McFarlane, D., Varma, S., Dawes, W., Emelyanova, I., Hodgson and Charles, G., S.:Potential climate change impacts on groundwater resources of south-western Australia, J.25
Hydrol., 475, 456–472, doi:10.1016/j.jhydrol.2012.04.043, 2012.
10133

HESSD12, 10109–10156, 2015
Impact of climatechange on
groundwater
Y. Caballero andB. Ladouche
Title Page
Abstract Introduction
Conclusions References
Tables Figures
J I
J I
Back Close
Full Screen / Esc
Printer-friendly Version
Interactive Discussion
Discussion
Paper
|D
iscussionP
aper|
Discussion
Paper
|D
iscussionP
aper|
Allen, D. M., Mackie, D. C., and Wei, M.: Groundwater and climate change: a sensitivity analysisfor the Grand Forks aquifer, southern British Columbia, Canada, Hydrogeol. J., 13, 270–290,2004.
Aunay, B.: Apport de la stratigraphie séquentielle à la gestion et à la modélisation desressources en eau des aquifères côtiers, available at: https://tel.archives-ouvertes.fr/5
tel-00275467, (last access: 25 September 2015), 2007.Aunay, B., Duvail, C., Giordana, G., Dörfligher, N., Le Strat, P., Montginoul, M., and Pistre, S.:
A pluridisciplinary methodology for integrated management of a coastal aquifer, Geologi-cal, hydrogeological and economic studies of the Roussillon aquifer (Pyrénées-Orientales,France), Life and Environment, 56, 275–285, 2006.10
Benson, R. H., Rakic-El Bied, K., and Bonaduce, G.: An important current reversal (influx) inthe Rifian Corridor (Morocco) at the Tortonian-Messinian boundary: the end of the TethysOcean, Paleoceanography, 6, 164–192, 1991.
Boé, J., Terray, L., Habets, F., and Martin, E.: A simple statistical-dynamical downscalingscheme based on weather types and conditional resampling, J. Geophys. Res., 111, D23106,15
doi:10.1029/2005JD006889, 2006.Bouraoui, F., Vachaud, G., Li, L. Z. X., Le Treut, H., and Chen, T.: Evaluation of the impact of
climate changes on water storage and groundwater recharge at the watershed scale, Clim.Dynam., 15, 153–161, doi:10.1007/s003820050274, 1999.
Brouyère, S., Carabin, G., and Dassargues, A.: Climate change impacts on groundwater re-20
sources: modelled deficits in a chalky aquifer, Geer basin, Belgium, Hydrogeol. J., 12, 123–134, 2004.
Caballero, Y., Voirin-Morel, S., Habets, F., Noilhan, J., LeMoigne, P., Lehenaff, A., andBoone, A.: Hydrological sensitivity of the Adour-Garonne river basin to climate change, WaterResour. Res., 43, W07448, doi:10.1029/2005WR004192, 2007.25
Caballero, Y., Chaouche, K., Neppel, L., Salas y Melia, D., Martin, E., Terrasson, I., Cha-zot, S., Citeau, J. M., Maton, L., Rinaudo, J. D., Fleury, P., Ladouche, B., Dörfliger, N.,and Pinault, J. L.: Vulnerability of Mediterranean hydrosystems to climate changes and hu-man activities: the project,VULCAIN, Montpellier, 1er au 4 septembre 2008, 20, available at:http://www.iwra.org/congress/2008/index.php?page=proceedings&abstract_id=62, (last ac-30
cess: 17 July 2014), 2008.Carneiro, J. F., Boughriba, M., Correia, A., Zarhloule, Y., Rimi, A., and El Houadi, B.: Evaluation
of climate change effects in a coastal aquifer in Morocco using a density-dependent numer-
10134

HESSD12, 10109–10156, 2015
Impact of climatechange on
groundwater
Y. Caballero andB. Ladouche
Title Page
Abstract Introduction
Conclusions References
Tables Figures
J I
J I
Back Close
Full Screen / Esc
Printer-friendly Version
Interactive Discussion
Discussion
Paper
|D
iscussionP
aper|
Discussion
Paper
|D
iscussionP
aper|
ical model, Environmental Earth Sciences, 61, 241–252, doi:10.1007/s12665-009-0339-3,2010.
Castaño, S., Sanz, D., and Gómez-Alday, J. J.: Sensitivity of a groundwater flow model to bothclimatic variations and management scenarios in a semi-arid region of SE Spain, WaterResour. Manag., 27, 2089–2101, doi:10.1007/s11269-013-0277-4, 2013.5
Chabart, M.: La recharge de l’aquifère multicouche du Roussillon et les conséquences d’unéventuel changement climatique sur la gestion des ressources en eau (Pyrénées Orien-tales), Doctorat en Hydrogéologie, Université de Paris VI, 299 pp., 1996.
Chaouche, K., Neppel, L., Dieulin, C., Pujol, N., Ladouche, B., Martin, E., Salas y Melia, D.,and Caballero, Y.: Analyses of precipitation, temperature and evapotranspiration in a French10
Mediterranean region in the context of climate change, CR Geosci., 342, 234–243,doi:10.1016/j.crte.2010.02.001, 2010.
Chen, Z., Grasby, S. E., and Osadez, K. G.: Predicting average annual groundwater levels fromclimatic variables: an empirical model, J. Hydrol., 260, 102–117, 2002.
Chery, L.: Interpretation des resultats des analyses isotopiques des eaux du multicouche15
du Roussillon, n BRGM/RR-36094-FR, 1–39, available at: http://www.brgm.fr/publication/pubDetailRapportSP.jsp?id=RSP-BRGM/RR-36094-FR, (last access: 17 July 2014), 1992.
Clauzon, G.: Restitution de l’évolution géodynamique néogène du bassin du Roussillon etde l’unité adjacente des Corbières d’après les données écostratigraphiques et paléogéo-graphiques, Paléobiologie Continentale, Montpellier, 17, 125–155, 1990.20
Clauzon, G., Le Strat, P., Duvail, C., Do Couto, D., Suc, J., Molliex, S., Bache, F., Besson, D.,Lindsay, E. H., Opdyke, N. D., Rubino, J., Popescu, S., Haq, B. U., and Gorini, C.: TheRoussillon Basin (S. France): a case-study to distinguish local and regional events between6 and 3 Ma, Mar. Petrol. Geol., in press, doi:10.1016/j.marpetgeo.2015.03.012, 2015.
Collins, W. D., Bitz, C. M., Blackmon, M. L., Bonan, G. B., Bretherton, C. S., Carton, J. A.,25
Chang, P. D., S. C., Hack, J. J., Henderson, T. B., Kiehl, J. T., Large, W. G., McKenna, D. S.,Santer, B. D., and Smith, R. D.: The Community Climate System Model Version 3(CCSM3), J. Climate, 19, 2122–2143, doi:10.1175/JCLI3761.1, 2006.
Crosbie, R. S., Scanlon, B. R., Mpelasoka, F. S., Reedy, R. C., Gates, J. B., and Zhang, L.:Potential climate change effects on groundwater recharge in the High Plains Aquifer, USA,30
Water Resour. Res., 49, 3936–3951, doi:10.1002/wrcr.20292, 2013.
10135

HESSD12, 10109–10156, 2015
Impact of climatechange on
groundwater
Y. Caballero andB. Ladouche
Title Page
Abstract Introduction
Conclusions References
Tables Figures
J I
J I
Back Close
Full Screen / Esc
Printer-friendly Version
Interactive Discussion
Discussion
Paper
|D
iscussionP
aper|
Discussion
Paper
|D
iscussionP
aper|
De Moortel, I., Munday, S. A., and Hood, A. W.: Wavelet analysis: the effect of varying basicwavelet parameters, Sol. Phys., 222, 203–228, doi:10.1023/B:SOLA.0000043578.01201.2d,2004.
Déqué, M.: Frequency of precipitation and temperature extremes over France in an anthro-pogenic scenario: model results and statistical correction according to observed values,5
Global Planet. Change, 57, 16–26, doi:10.1016/j.gloplacha.2006.11.030, 2007.Dietrich, C. R. and Chapman, T. G.: Unit graph estimation and stabilization using quadratic
programming and difference norms, Water Resour. Res., 29, 2629–2635, 1993.Döll, P.: Vulnerability to the impact of climate change on renewable groundwater re-
sources: a global-scale assessment, Environ. Res. Lett., 4, 035006, doi:10.1088/1748-10
9326/4/3/035006, 2009.Dörfliger, N., Fleury, P., and Ladouche, B.: Inverse modeling approach to allogenic karst sys-
tem characterization, Ground Water, 47, 414–426, doi:10.1111/j.1745-6584.2008.00517.x,2009.
Duvail, C., Gorini, C., Lofi, J., Lestrat, P., Clauzon, G., and Dosreis, A.: Correlation between on-15
shore and offshore Pliocene–Quaternary systems tracts below the Roussillon Basin (easternPyrenees, France), Mar. Petrol. Geol., 22, 747–756, doi:10.1016/j.marpetgeo.2005.03.009,2005.
Eckhardt, K. and Ulbrich, U.: Potential impacts of climate change on groundwater recharge andstreamflow in a central European low mountain range, J. Hydrol., 284, 244–252, 2003.20
Ferguson, I. M. and Maxwell, R. M.: Role of groundwater in watershed response andland surface feedbacks under climate change, Water Resour. Res., 46, W00F02,doi:10.1029/2009WR008616, 2010.
Fowler, H. J., Kilsby, C. G., and Stunell, J.: Modelling the impacts of projected future climatechange on water resources in north-west England, Hydrol. Earth Syst. Sci., 11, 1115–1126,25
doi:10.5194/hess-11-1115-2007, 2007.Goderniaux, P., Brouyère, S., Fowler, H. J., Blenkinsop, S., Therrien, R., Orban, P., and Dassar-
gues, A.: Large scale surface–subsurface hydrological model to assess climate change im-pacts on groundwater reserves, J. Hydrol., 373, 122–138, doi:10.1016/j.jhydrol.2009.04.017,2009.30
Goderniaux, P., Brouyère, S., Blenkinsop, S., Burton, A., Fowler, H. J., Orban, P.,and Dassargues, A.: Modeling climate change impacts on groundwater resources
10136

HESSD12, 10109–10156, 2015
Impact of climatechange on
groundwater
Y. Caballero andB. Ladouche
Title Page
Abstract Introduction
Conclusions References
Tables Figures
J I
J I
Back Close
Full Screen / Esc
Printer-friendly Version
Interactive Discussion
Discussion
Paper
|D
iscussionP
aper|
Discussion
Paper
|D
iscussionP
aper|
using transient stochastic climatic scenarios, Water Resour. Res., 47, W12516,doi:10.1029/2010WR010082, 2011.
Got, H.: Contribution à l’étude géologique et hydrogéologique de la région de Feuilla-Fitou(Corbières) et de la Salanque, http://www.sudoc.fr/071401032, (last access: 25 September2015), 158 pp., 1965.5
Green, T. R., Taniguchi, M., Kooi, H., Gurdak, J. J., Allen, D. M., Hiscock, K. M., Treidel, H., andAureli, A.: Beneath the surface of global change: impacts of climate change on groundwa-ter, J. Hydrol., 405, 532–560, doi:10.1016/j.jhydrol.2011.05.002, 2011.
Guennoc, P., Gorini, C., and Mauffret, A.: Histoire géologique du golfe du Lion et cartographiedu rift oligo-aquitanien et de la surface messinienne, Géol France, 3, 67–97, 2000.10
Habets, F., Boé, J., Déqué, M., Ducharne, A., Gascoin, S., Hachour, A., Martin, E., Pagé, C.,Sauquet, E., Terray, L., Thiéry, D., Oudin, L., and Viennot, P.: Impact of climate changeon the hydrogeology of two basins in northern France, Climatic Change, 121, 771–785,doi:10.1007/s10584-013-0934-x, 2013.
Hourdin, F., Musat, I., Bony, S., Braconnot, P., Codron, F., Dufresne, J., Fairhead, L., Filiberti, M.,15
Friedlingstein, P., Grandpeix, J., Krinner, G., LeVan, P., Li, Z., and Lott, F.: The LMDZ4 generalcirculation model: climate performance and sensitivity to parametrized physics with emphasison tropical convection, Clim. Dynam., 27, 787–813, doi:10.1007/s00382-006-0158-0, 2006.
Infoterre Argelès: available at: http://ficheinfoterre.brgm.fr/InfoterreFiche/ficheBss.action?id=10972X0137/PONT, (last access: 17 July 2014), 2013.20
Johns, T. C., Durman, C. F., Banks, H. T., Roberts, M. J., McLaren, A. J., Ridley, J. K., Se-nior, C. A., Williams, K. D., Jones, A., Rickard, G. J., Cusack, S., Ingram, W. J., Cruci-fix, M., Sexton, D. M. H., Joshi, M. M., Dong, B., Spencer, H., Hill, R. S. R., Gregory, J. M.,Keen, A. B., Pardaens, A. K., Lowe, J. A., Bodas-Salcedo, A., Stark, S., and Searl, Y.: TheNew Hadley Centre Climate Model (HadGEM1): evaluation of coupled simulations, J. Cli-25
mate, 19, 1327–1353, doi:10.1175/JCLI3712.1, 2006.Jungclaus, J. H., Keenlyside, N., Botzet, M., Haak, H., Luo, J., Latif, M., Marotzke, J., Mikola-
jewicz, U., and Roeckner, E.: Ocean circulation and tropical variability in the coupled modelECHAM5/MPI-OM, J. Climate, 19, 3952–3972, 2006.
Labat, D.: Recent advances in wavelet analyses: Part 1 – a review of concepts, J. Hydrol., 314,30
289–311, 2005.Labat, D.: Wavelet analysis of the annual discharge records of the world’s largest rivers, Adv.
Water Resour., 31, 109–117, doi:10.1016/j.advwatres.2007.07.004, 2008.
10137

HESSD12, 10109–10156, 2015
Impact of climatechange on
groundwater
Y. Caballero andB. Ladouche
Title Page
Abstract Introduction
Conclusions References
Tables Figures
J I
J I
Back Close
Full Screen / Esc
Printer-friendly Version
Interactive Discussion
Discussion
Paper
|D
iscussionP
aper|
Discussion
Paper
|D
iscussionP
aper|
Labat, D.: Cross wavelet analyses of continental freshwater discharge and selected climatesindices, J. Hydrol., 385, 269–278, doi:10.1016/j.jhydrol.2010.02.029, 2010.
Ladouche, B., Marechal, J.-C., and Dorfliger, N.: Semi-distributed lumped model of a karst sys-tem under active management, J. Hydrol., 509, 215–230, doi:10.1016/j.jhydrol.2013.11.017,2014.5
Lafrenière, M. and Sharp, M.: Wavelet analysis of inter-annual variability in the runoff regimesof glacial and nival stream catchments, Bow Lake, Alberta, Hydrol. Process., 17, 1093–1118,doi:10.1002/hyp.1187, 2003.
Loaiciga, H. A., Maidment, D. R., and Valdes, J. B.: Climate-change impacts in a regional karstaquifer, Texas, USA, J. Hydrol., 227, 173–194, 2000.10
Maliva, R. G., Coulibaly, K., Guo, W., and Missimer, T. M.: Confined aquifer loading:implications for groundwater management, Ground Water, 49, 1–3, doi:10.1111/j.1745-6584.2010.00776.x, 2010.
Maraun, D. and Kurths, J.: Cross wavelet analysis: significance testing and pitfalls, Nonlin.Processes Geophys., 11, 505–514, doi:10.5194/npg-11-505-2004, 2004.15
Mariotti, A., Zeng, N., Yoon, J., Artale, V., Navarra, A., Alpert, P., and Li, L. Z. X.: Mediterraneanwater cycle changes: transition to drier 21st century conditions in observations and CMIP3simulations, Environ. Res. Lett., 3, 044001, 8 pp., 2008.
Meehl, G. A., Covey, C., Delworth, T., Latif, M., McAvaney, B., Mitchell, J. F. B., Stouffer, R. J.,and Taylor, K. E.: The WCRP CMIP3 multimodel dataset: a new era in climate change re-20
search, B. Am. Meteorol. Soc., 88, 1383, doi:10.1175/BAMS-88-9-1383, 2007.Nakicenovic, N. and Swart, R.: Emissions Scenarios. A Special Report of Working Group II
of the Intergovernmental Panel on Climate Change, Publisher: Cambridge University Press,Cambridge, UK, ISBN: 0521800811, 570 pp., 2000.
Pinault, J. L.: Manuel utilisateur de TEMPO: Logiciel de traitement et de modélisation des séries25
temporelles en hydrogéologie et en hydrogéochimie, Rep. BRGM/RP-51459 -FR, 233 pp.,Project Modhydro, Bur. de Rech. Geol. et. Miner., Orleans, France, 2001.
Pinault, J. L. and Schomburgk, S.: Inverse modeling for characterizing surface wa-ter/groundwater exchanges, Water Resour. Res., 42, W08414, doi:10.1029/2005WR004587,2006.30
Pinault, J. L., Pauwels, H., and Cann, C.: Inverse modeling of the hydrological and the hydro-chemical behavior of hydrosystems: application to nitrate transport and denitrification, WaterResour. Res., 37, 2179–2190, doi:10.1029/2001WR900017, 2001a.
10138

HESSD12, 10109–10156, 2015
Impact of climatechange on
groundwater
Y. Caballero andB. Ladouche
Title Page
Abstract Introduction
Conclusions References
Tables Figures
J I
J I
Back Close
Full Screen / Esc
Printer-friendly Version
Interactive Discussion
Discussion
Paper
|D
iscussionP
aper|
Discussion
Paper
|D
iscussionP
aper|
Pinault, J. L., Plagnes, V., Aquilina, L., and Bakalowicz, M.: Inverse modeling of the hydro-logical and the hydrochemical behavior of hydrosystems: characterization of Karst SystemFunctioning, Water Resour. Res., 37, 2191, doi:10.1029/2001WR900018, 2001b.
Pinault, J. L., Dörfliger, N., Ladouche, B., and Bakalowicz, M.: Characterizing a coastal karstaquifer using an inverse modeling approach: the saline springs of Thau, southern France,5
Water Resour. Res., 40, W08501, doi:10.1029/2003WR002553, 2004.Pinault, J. L., Amraoui, N., and Golaz, C.: Groundwater-induced flooding in macropore dom-
inated hydrological system in the context of climate changes, Water Resour. Res., 41,W05001, doi:10.1029/2004WR003169, 2005.
Portmann, F. T., Döll, P., Eisner, S., and Fl, M.: Impact of climate change on renewable10
groundwater resources: assessing the benefits of avoided greenhouse gas emissions us-ing selected CMIP5 climate projections, Environ. Res. Lett., 8, 024023-, doi:10.1088/1748-9326/8/2/024023, 2013.
Quintana-Seguí, P., Ribes, A., Martin, E., Habets, F., and Boé, J.: Comparison of three down-scaling methods in simulating the impact of climate change on the hydrology of Mediter-15
ranean basins, J. Hydrol., 383, 111–124, doi:10.1016/j.jhydrol.2009.09.050, 2010.Rivard, C., Paniconi, C., Vigneault, H., and Chaumont, D.: A watershed-scale study of cli-
mate change impacts on groundwater recharge (Annapolis Valley, Nova Scotia, Canada),Hydrolog. Sci. J., 59, 1437–1456, doi:10.1080/02626667.2014.887203, 2014.
Roeckner, E., Brokopf, R., Esch, M., Giorgetta, M., Hagemann, S., Kornblueh, L., Manzini, E.,20
Schlese, U., and Schulzweida, U.: Sensitivity of simulated climate to horizontal and verticalresolution in the ECHAM5 atmosphere model, J. Climate, 19, 3771–3791, 2006.
Salas-Mélia, D., Chauvin, F., Déqué, M., Douville, H., Gueremy, J. F., Marquet, P., Planton, S.,Royer, J. F., and Tyteca, S.: Description and validation of the CNRM-CM3 global cou-pled model, CNRM working note 103, available at: http://www.cnrm.meteo.fr/scenario2004/25
references_eng.html, (last access: 17 July 2014), 2005.Scibek, J. and Allen, D. M.: Modeled impacts of predicted climate change on recharge and
groundwater levels, Water Resour. Res., 42 doi:10.1029/2005WR004742, 2006, 2006.Seiler, K. P., Gu, W. Z., and Stichler, W.: Transient response of groundwater systems to climate
changes, Geol. Soc. Spec. Publ., 288, 111–119, doi:10.1144/SP288.9, 2008.30
Sen, Z.: Applied Hydrogeology for Scientists and Engineers, 464 pp., CRC Press, Boca Raton,Lewis Publishers, USA, ISBN 9781566700917, 1995.
10139

HESSD12, 10109–10156, 2015
Impact of climatechange on
groundwater
Y. Caballero andB. Ladouche
Title Page
Abstract Introduction
Conclusions References
Tables Figures
J I
J I
Back Close
Full Screen / Esc
Printer-friendly Version
Interactive Discussion
Discussion
Paper
|D
iscussionP
aper|
Discussion
Paper
|D
iscussionP
aper|
Serrat-Capdevila, A., Valdes, J. B., González-Pérez, J., Baird, K., Mata, L. J., and Mad-dock, T.: Modeling climate change impacts – and uncertainty – on the hydrology ofa riparian system: the San Pedro Basin (Arizona/Sonora), J. Hydrol., 347, 48–66,doi:10.1016/j.jhydrol.2007.08.028, 2007.
Terrasson, I., Chazot, S., Maton, L., Rinaudo, J., and Caballero, Y.: Les Pyrénées Orientales5
face aux changements globaux: comparaison des effets des changements climatique et an-thropique sur les besoins en eau, La Houille Blanche, n 3, p. 53–63, 2014.
Terray, L. and Boé, J.: Quantifying 21st-century France climate change and related uncertain-ties, CR Geosci., 345, 136–149, doi:10.1016/j.crte.2013.02.003, 2013.
Thomsen, R.: Effect of climate variability and change in groundwater in Europe, Nord. Hydrol.,10
21, 185–194, 1990.Tikhonov, A. and Arsenine, V.: Méthodes de Résolution de Problèmes mal Posés, MIR,
Moscow, 1976.Tikhonov, A. N. and Goncharsky, A. V. (Eds.): Ill-Posed Problems in the Natural Sciences, MIR,
Moscow, 1987.15
Torrence, C. and Compo, G. P.: A practical guide for wavelet analysis, B. Am. Meteorol. Soc.,79, 1, 61–78, 1998.
Torrence, C. and Webster, P. J.: Interdecadal changes in the ENSO–monsoon system, J. Cli-mate, 12, 2679–2690, doi:10.1175/1520-0442(1999)012<2679:ICITEM>2.0.CO;2, 1999.
Van Roosmalen, L., Christensen, B. S. B., and Sonnenborg, T. O.: Regional differences in20
climate change impacts on groundwater and stream discharge in Denmark, Vadose Zone J.,6, 554, doi:10.2136/vzj2006.0093, 2007.
Vidal, J. P., Martin, E., Franchistéguy, L., Baillon, M., and Soubeyroux, J. M.: A 50 year high-resolution atmospheric reanalysis over France with the Safran system, Int. J. Climatol., 30,1627–1644, doi:10.1002/joc.2003, 2010.25
Wada, Y. and Bierkens, M. F. P.: Sustainability of global water use: past reconstruction and fu-ture projections, Environ. Res. Lett., 9, 104003, doi:10.1088/1748-9326/9/10/104003, 2014.
Wilkinson, W. B. and Cooper, D. M.: The response of idealized aquifer/river systems to climatechange/Reponse de systemes aquifere-riviere schematiques aux modifications climatiques,Hydrolog. Sci. J., 38, 379–390, doi:10.1080/026266693099492688, 1993.30
Woldeamlak, S. T., Batelaan, O., and De Smedt, F.: Effects of climate change on the ground-water system in the Grote-Nete catchment, Belgium, Hydrogeol. J., 15, 891–901, 2007.
10140

HESSD12, 10109–10156, 2015
Impact of climatechange on
groundwater
Y. Caballero andB. Ladouche
Title Page
Abstract Introduction
Conclusions References
Tables Figures
J I
J I
Back Close
Full Screen / Esc
Printer-friendly Version
Interactive Discussion
Discussion
Paper
|D
iscussionP
aper|
Discussion
Paper
|D
iscussionP
aper|
Xu, C.-Y.: From GCMs to river flow: a review of downscaling methods and hydrologic modellingapproaches, Prog. Phys. Geog., 23, 229–249, 1999.
Yan, Z. and Jones, P. D.: Detecting inhomogeneity in daily climate series using wavelet analysis,Adv. Atmos. Sci., 25, 157–163, doi:10.1007/s00376-008-0157-7, 2008
10141

HESSD12, 10109–10156, 2015
Impact of climatechange on
groundwater
Y. Caballero andB. Ladouche
Title Page
Abstract Introduction
Conclusions References
Tables Figures
J I
J I
Back Close
Full Screen / Esc
Printer-friendly Version
Interactive Discussion
Discussion
Paper
|D
iscussionP
aper|
Discussion
Paper
|D
iscussionP
aper|
Table 1. Main characteristics of the modeling for the Argelès and Perpignan piezometers. τis the normalized impulse response of the recharge from effective rainfall; τ1 is the normal-ized impulse response of the SP; τ2 is the normalized impulse response of the PP; τ3 is thenormalized impulse response of the Têt river contribution.
Parameter Argelès Perpignan
Nash index for the calibration period 0.82 0.85Nash index for the validation period 0.71 0.66Relative contribution of effective recharge to water level changes From +0.5 to +0.8 m < 0.5 mLength of the normalized impulse response of the effective rainfall (τ) 520 days 300 daysMean transit time (Tm) of the normalized impulse response of (τ) 220 days 89 daysLag for the maximum response of the normalized impulse response (τ) 30 days 60 daysRelative contribution of the seasonal pumping (SP) to water level changes −1 m From −1.8 m to 3 mDate for the maximum contribution of the seasonal pumping (calculated from τ1) Mid-Aug End of JunRelative contribution of permanent pumping (PP) to water level changes −0.6 m over 17 years −0.9 m over 33 yearsRelative contribution of the river to water level changes – From +0.2 to 0.8 mLag for the maximum response of the normalized impulse response (τ3) – 70–80 daysDate for the maximum contribution of the river (calculated from τ3) – End of Jul
10142

HESSD12, 10109–10156, 2015
Impact of climatechange on
groundwater
Y. Caballero andB. Ladouche
Title Page
Abstract Introduction
Conclusions References
Tables Figures
J I
J I
Back Close
Full Screen / Esc
Printer-friendly Version
Interactive Discussion
Discussion
Paper
|D
iscussionP
aper|
Discussion
Paper
|D
iscussionP
aper|
Figure 1. Geological context and piezometric network locations for monitoring the RoussillonPlio–Quaternary aquifer. Two specific piezometers (Perpignan and Argelès) are highlighted,over which modeling has been performed. Dashed outlines show the boreholes that were takeninto account for each piezometer.
10143

HESSD12, 10109–10156, 2015
Impact of climatechange on
groundwater
Y. Caballero andB. Ladouche
Title Page
Abstract Introduction
Conclusions References
Tables Figures
J I
J I
Back Close
Full Screen / Esc
Printer-friendly Version
Interactive Discussion
Discussion
Paper
|D
iscussionP
aper|
Discussion
Paper
|D
iscussionP
aper|
Figure 2. Groundwater level time series recorded over the last 15 years with the piezometernetwork of the Pliocene aquifer.
10144

HESSD12, 10109–10156, 2015
Impact of climatechange on
groundwater
Y. Caballero andB. Ladouche
Title Page
Abstract Introduction
Conclusions References
Tables Figures
J I
J I
Back Close
Full Screen / Esc
Printer-friendly Version
Interactive Discussion
Discussion
Paper
|D
iscussionP
aper|
Discussion
Paper
|D
iscussionP
aper|
Figure 3. Daily piezometric data (ma.s.l.) at Perpignan (a) and Argelès (b) (see Fig. 1 forlocation) showing the long-term depletion trend, the effect of recharge by net rainfall, and theeffect of summer water withdrawals. Pumping cumulated at the yearly time scale for the 1998–2007 period is also shown. The thin dashed line represents the permanent pumping equivalentof pumping during the winter period (October to March).
10145

HESSD12, 10109–10156, 2015
Impact of climatechange on
groundwater
Y. Caballero andB. Ladouche
Title Page
Abstract Introduction
Conclusions References
Tables Figures
J I
J I
Back Close
Full Screen / Esc
Printer-friendly Version
Interactive Discussion
Discussion
Paper
|D
iscussionP
aper|
Discussion
Paper
|D
iscussionP
aper|
Figure 4. Wavelet-filtered time series of water levels (Perpignan and Argelès) computed withthe Paul wavelet.
10146

HESSD12, 10109–10156, 2015
Impact of climatechange on
groundwater
Y. Caballero andB. Ladouche
Title Page
Abstract Introduction
Conclusions References
Tables Figures
J I
J I
Back Close
Full Screen / Esc
Printer-friendly Version
Interactive Discussion
Discussion
Paper
|D
iscussionP
aper|
Discussion
Paper
|D
iscussionP
aper|
Figure 5. Fourier squared coherence calculated with Paul wavelet (m = 4) between pumpingdata (input) and water level (output) for the Perpignan piezometer (a) and Argelès piezometer(b) The dashed line is the 95 % confidence level.
10147

HESSD12, 10109–10156, 2015
Impact of climatechange on
groundwater
Y. Caballero andB. Ladouche
Title Page
Abstract Introduction
Conclusions References
Tables Figures
J I
J I
Back Close
Full Screen / Esc
Printer-friendly Version
Interactive Discussion
Discussion
Paper
|D
iscussionP
aper|
Discussion
Paper
|D
iscussionP
aper|
Figure 6. (a, b) Scale–Averaged Wavelet Power (SAWP) over the 120–371 day band for waterlevels measured in the Perpignan (a) and Argelès (b) piezometers using the Paul wavelet (m =4). The dashed line is the 95 % confidence level. The thin solid line is the SAWP correctedto the 95 % confidence level, calculated for the month of August. This function is called the“comb function”. (c, d): SAWP over the 120–371 day band for pumping in the Perpignan area(c) and Argelès area (d) using the Paul wavelet (m = 4). The dashed line is the 95 % confidencelevel. (e, f): cross SAWP over the 120–371 day band with pumping data (input) and water level(output) calculated with the Paul wavelet (m = 4) for Perpignan (e) and Argelès (f). The dashedline is the 95 % confidence level.
10148

HESSD12, 10109–10156, 2015
Impact of climatechange on
groundwater
Y. Caballero andB. Ladouche
Title Page
Abstract Introduction
Conclusions References
Tables Figures
J I
J I
Back Close
Full Screen / Esc
Printer-friendly Version
Interactive Discussion
Discussion
Paper
|D
iscussionP
aper|
Discussion
Paper
|D
iscussionP
aper|
Figure 7. Changes in the volume of PP (1998–2007 period) based on the long-term trend.
10149

HESSD12, 10109–10156, 2015
Impact of climatechange on
groundwater
Y. Caballero andB. Ladouche
Title Page
Abstract Introduction
Conclusions References
Tables Figures
J I
J I
Back Close
Full Screen / Esc
Printer-friendly Version
Interactive Discussion
Discussion
Paper
|D
iscussionP
aper|
Discussion
Paper
|D
iscussionP
aper|
Figure 8. Variation of pumped volumes observed between 1998 and 2007 and reconstitutedvolumes for the preceding period. The permanent pumping was estimated from the long-termtrend deduced from the Wavelet-filtered time series. The seasonal pumping volume (combfunction) was estimated from the maximum SAWP (corrected to the 95 % confidence level)calculated for the month of August.
10150

HESSD12, 10109–10156, 2015
Impact of climatechange on
groundwater
Y. Caballero andB. Ladouche
Title Page
Abstract Introduction
Conclusions References
Tables Figures
J I
J I
Back Close
Full Screen / Esc
Printer-friendly Version
Interactive Discussion
Discussion
Paper
|D
iscussionP
aper|
Discussion
Paper
|D
iscussionP
aper|
Figure 9. Architecture of the model used to simulate the water levels in the Perpignan andArgelès piezometers located on the PQ aquifer.
10151

HESSD12, 10109–10156, 2015
Impact of climatechange on
groundwater
Y. Caballero andB. Ladouche
Title Page
Abstract Introduction
Conclusions References
Tables Figures
J I
J I
Back Close
Full Screen / Esc
Printer-friendly Version
Interactive Discussion
Discussion
Paper
|D
iscussionP
aper|
Discussion
Paper
|D
iscussionP
aper|
Figure 10. Inverse modeling of Pliocene confined aquifer (Argelès Piezometer) with a 10 daystep. The measured and simulated piezometry is shown (a) as well as the relative contributionof the components (b), the impulse response of recharge (c) and of the SP (d).
10152

HESSD12, 10109–10156, 2015
Impact of climatechange on
groundwater
Y. Caballero andB. Ladouche
Title Page
Abstract Introduction
Conclusions References
Tables Figures
J I
J I
Back Close
Full Screen / Esc
Printer-friendly Version
Interactive Discussion
Discussion
Paper
|D
iscussionP
aper|
Discussion
Paper
|D
iscussionP
aper|
Figure 11. Inverse modeling of Pliocene confined aquifer (Perpignan Piezometer) with a 10 daystep. The measured and simulated piezometry is shown (a) as well as the relative contributionsof the recharge, pumping, and Têt river components (b) and their impulse responses (c).
10153

HESSD12, 10109–10156, 2015
Impact of climatechange on
groundwater
Y. Caballero andB. Ladouche
Title Page
Abstract Introduction
Conclusions References
Tables Figures
J I
J I
Back Close
Full Screen / Esc
Printer-friendly Version
Interactive Discussion
Discussion
Paper
|D
iscussionP
aper|
Discussion
Paper
|D
iscussionP
aper|
Figure 12. Sensitivity test of the model constructed for the Argelès piezometer for variousconditions: variation of the piezometry calculated by the model in the absence of pumping [a]and for two precipitation situations, taking pumping into account: [b] = 50 % of the computedrain for the period 2008–2017 and [c] = 10 % of the computed rain for the period 2008–2017(SP and PP pumping conditions identical to those of 2008).
10154
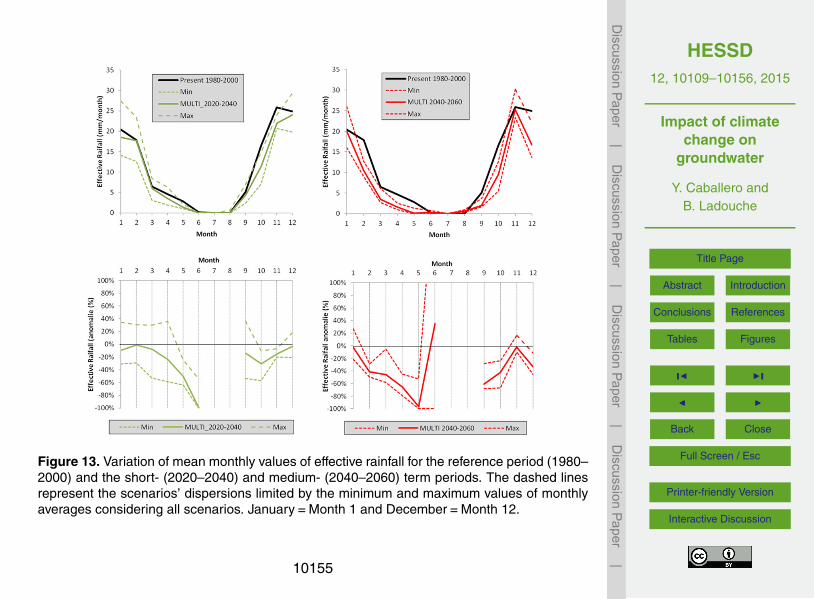
HESSD12, 10109–10156, 2015
Impact of climatechange on
groundwater
Y. Caballero andB. Ladouche
Title Page
Abstract Introduction
Conclusions References
Tables Figures
J I
J I
Back Close
Full Screen / Esc
Printer-friendly Version
Interactive Discussion
Discussion
Paper
|D
iscussionP
aper|
Discussion
Paper
|D
iscussionP
aper|
Figure 13. Variation of mean monthly values of effective rainfall for the reference period (1980–2000) and the short- (2020–2040) and medium- (2040–2060) term periods. The dashed linesrepresent the scenarios’ dispersions limited by the minimum and maximum values of monthlyaverages considering all scenarios. January=Month 1 and December=Month 12.
10155

HESSD12, 10109–10156, 2015
Impact of climatechange on
groundwater
Y. Caballero andB. Ladouche
Title Page
Abstract Introduction
Conclusions References
Tables Figures
J I
J I
Back Close
Full Screen / Esc
Printer-friendly Version
Interactive Discussion
Discussion
Paper
|D
iscussionP
aper|
Discussion
Paper
|D
iscussionP
aper|
Figure 14. Variation of interannual monthly means of the piezometric levels simulated for theArgelès piezometer: reference period (1980–2000), short- (2020–2040) and medium- (2040–2060) term. The minimum and maximum envelope curves correspond to the extreme valuesacross all scenarios. January=Month 1 and December=Month 12. Three different situationsare simulated: (top) no pumping; (middle) with PP and without SP (SC1); and (bottom) with PPand SP (SC2).
10156