impact of a free trade agreement between ukraine s most important export commodities representing...
TRANSCRIPT

1
ImpactofaFreeTradeAgreementbetweenUkraineandtheEuropeanUniononUkraine’sAgriculturalSector
Jean‐PierreChauffour, MarosIvanic,David Laborde, MarylaMaliszewska,and WillMartin
December2010
Abstract
Some key Ukrainian agricultural production (i.e., wheat, barley, maize, sunflower seeds, and sunflower oil) could
potentially benefit from a preferential trade agreement with the European Union. In the first part, we assess the
economic burden of the current agricultural protection regime of the EU on Ukraine for selected agricultural
products. We find that the costs to Ukraine of the existing highly‐volatile EU protection regime for cereals are
substantial. In all, a well‐engineered preferential trade agreement with the EU could significantly expand Ukraine’s
key agricultural sector output and exports with a total (net) welfare gains exceeding US$200 million a year or 0.4
percent of Ukraine’s GDP. The bulk of these gains would originate from the liberalization of the EU’s cereal
imports. These gains would shrink to less than US$50 million if the EU were able to negotiate exclusion of some
key agricultural commodities. Yet, gains in the agricultural sector would only be one of the positive effects
expected from a deep and comprehensive preferential trade agreement with the EU.

2
1. Introduction
Protection of the European Union (EU) agricultural market has historically represented a significant trade barrier
for some of Ukraine's key agricultural commodities. With import tariffs changing on a biweekly basis between zero
and 40 percent ad valorem, EU protection has been especially detrimental to Ukraine’s cereals sector; a key sector
that represented almost one‐third of Ukraine's agricultural exports in 2008.1 Additionally, relatively low yet
persistent protection of some processed agricultural products, such as sunflower oil, combined with zero
protection on the respective raw inputs, such as sunflower seeds, has been another impediment for Ukrainian
producers and processors. While it is clear that the current agricultural trade regime between Ukraine and the EU
impose unnecessary costs for both trading partners, the magnitude of these costs and how effectively they might
be addressed by a bilateral preferential trade agreement (PTA) is less clear. The purpose of this paper is to shed
some light on these issues.
Economic theory suggests that protecting the EU market from Ukrainian imports through tariffs affects a
wide range of economic activities in the EU, Ukraine and the rest of the world. Obviously, a tariff imposes a burden
on producers in Ukraine and consumers in the EU. Conversely, protection generally benefits domestic producers
whose output price is likely to rise to the higher domestic price level. Besides these direct impacts, unevenly
distributed duties among different sectors also negatively affects producers in more protected sectors at the
expense of those facing lower protection. Finally, trade barriers between Ukraine and the EU help producers in
third countries, whose products become relatively cheaper in the EU market. At the same time they hurt third‐
country consumers, who have to compete for these products as they leave for the EU. While the directions of
these individual welfare changes are generally unambiguous, their precise magnitudes depend on various
parameters that describe the level of substitutability of products from different sources, and their respective
demand and supply elasticities.
In addition to transfers of welfare, protection reduces economic efficiency by increasing production that
could be more efficiently produced elsewhere and by eventually reducing total consumption. Economic theory is
unambiguous that, absent interactions with major domestic distortions, complete trade liberalization will benefit
the world. However, the impact of partial liberalization on individual countries requires careful empirical
examination. This is especially true for agriculture where farmers are largely unable to adjust the quantity of their
production readily, once their crops have been sown. Francois and Martin (2004) illustrate the welfare costs
associated with the instability of protection. Our analysis explores this concept by focusing on the stochastic
aspects of the EU trade regime in selected agricultural products which are subject to substantial variability as
opposed to looking merely at fixed policy instruments such as the average level of tariffs.
1 Source: WITS

3
In comparison to previous empirical studies on Ukraine’s accession to the WTO and impact of a potential EU‐
Ukraine PTA, this paper seeks to provide new insights by (1) carefully incorporating Ukraine’s WTO commitments;
(2) analyzing in greater detail liberalization of trade in all agricultural and food products; and (3) looking at the
volatility of EU market protection for a few key selected agricultural commodities (i.e., wheat, barley, maize,
sunflower seeds, and sunflower oil). In previous studies, mostly based on Computable General Equilibrium (CGE)
models,2 all agricultural commodities have been aggregated to one sector not allowing for any inferences on the
impact of the trade policy changes on individual commodities or for more accurate modeling of alternative trade
policy regimes. While Von Cramon‐Taubadel, Hess and Brummer (2010) analyze trade in agricultural products at
the GTAP commodity level, the stylized modeling of the EU‐Ukraine FTA does not incorporate the WTO
commitments as a benchmark. Their results are therefore not directly comparable to ours.
The implications of a deep and comprehensive free trade agreement (DCFTA) with the EU are likely to be
far reaching. Apart from the removal of tariffs and export duties, the DCFTA will involve institutional harmonization
and deep regulatory changes, which over time will improve business environment in Ukraine and are likely to lead
to substantial inflow of capital and expansion of domestic investment. Further, the reduction of tariff and non‐
tariff barriers is also likely to lead to substantial expansion of trade in goods and services. By limiting our analysis to
agricultural and food products, we are unable to evaluate the impact of the DCFTA in full. The costs and benefits
associated with the DCFTA‐induced reform processes and trade liberalization of industrial goods and services
remain outside the scope of our analysis. However, keeping the analysis focused on trade in agricultural and food
products allows for a much more thorough analysis of liberalization of trade in these sectors than has been
conducted for Ukraine so far.
The rest of the paper is structured as follows. Section 2 presents the key factors affecting agricultural
trade between Ukraine and the EU, including their structure, protection regimes and the key historical trends.
Section 3 describes the CGE model used for the stochastic simulations and the dataset. Section 4 presents the set
of simulations and Section 5 the simulation results. Section 6 concludes with a number of policy recommendations.
2. Background
2.1 OverviewofUkrainianagriculturalproductionandtradewiththeEUandtheworld
Ukraine has recently experienced impressive economic growth. During 2002–08 (the most recent period for which
comprehensive data are available), annual GDP grew on average by 27 percent despite a steady annual decline of
population by 0.7 percent in the same period. Per‐capita GDP increased from US$880 in 2002 to US$3,070 in
2 Brenton and Whalley (1999), Copenhagen Economics, IER and OEI (2005), CEPS, IFW and ICPS (2006), Ecorys and CASE‐Ukraine (2007).

4
2008.3 Ukraine's economic growth was accompanied by an increase in exports. The total value of exports reached
US$68.8 billion in 2008 up from US$14.3 billion in 2002 and the ratio of exports to GDP rose by 2 percentage
points to 35.9 during the period.4
The structure of exports also underwent several significant changes during our reference period, both in
terms of the exported commodities and their destinations. Table 1 lists the shares of exports by major commodity
groups between 2002 and 2008. The table shows that Metals, Mineral Products and Vegetable Products are
Ukraine’s most important export commodities representing together close to 60 percent of total exports by value
in 2002 and 62.1 percent in 2008 (Table 1). While most sectors retained their relative positions in the export shares
during this period, the sector of Transportation experienced significant growth in its export share from 3.2 percent
in 2002 to 7.2 percent in 2008. On the other hand, the share of exports of Textiles dropped from 4.6 percent to 1.4
percent during the reference period, mainly due to the problems of the industry to attract capital.5 The share of
agricultural and food products fell from 15.4% in 2002 down to 12% in 2005 and 2006, due to the fall in the share
of exports of vegetable products, before rebounding to 14% in 2008.
Table 1: Shares of Ukraine's exports by sectors, in percent
2002 2003 2004 2005 2006 2007 2008
Animals and animal products 2.4 2.6 2.1 2.1 1.0 1.4 0.9
Vegetable products 10.2 7.0 5.1 6.2 7.4 6.9 11.1
Foodstuffs 2.8 3.3 3.5 3.6 3.5 3.9 2.9
Mineral Products 16.9 16.4 15.6 13.9 11.6 11.0 15.7
Chemicals & Allied Industries 9.4 9.2 9.0 9.8 10.4 9.0 8.5
Plastics / Rubbers 1.4 1.3 1.3 1.6 1.9 1.7 1.3
Raw Hides, Skins, Leather, & Furs 1.0 0.9 0.8 0.7 0.6 0.5 0.4
Wood & Wood Products 3.3 3.4 3.3 3.1 3.2 3.4 2.8
Textiles 4.6 4.0 3.2 2.8 2.5 2.0 1.8
Footwear / Headgear 0.5 0.4 0.3 0.2 0.3 0.2 0.2
Stone / Glass 1.6 1.5 1.2 0.9 1.0 1.0 1.0
Metals 32.6 35.6 41.4 41.4 41.4 39.3 37.2
Machinery / Electrical 7.7 7.4 6.9 7.7 8.0 9.3 8.6
Transportation 3.2 4.4 4.9 4.6 5.2 6.1 6.1
Miscellaneous 1.3 1.3 1.0 1.1 1.3 1.2 1.0
Services 1.2 1.2 0.4 0.2 0.5 3.4 0.5
Total 100.0 100.0 100.0 100.0 100.0 100.0 100.0
Source: WITS
Along with the changes in the structure of exports, the destinations of Ukraine's exports changed too over the
reference period (Table 2). While the EU remained the most important destination for Ukraine's exports between
3 Source: WDI database, figures in current US dollars 4 Source: WITS 5 http://www.just‐style.com/analysis/ukrainian‐apparel‐industry‐seeks‐foreign‐investment_id92481.aspx

5
2002 and 2008, its value share dropped from 39.8 percent to 29.1 percent. However, with the overall expansion of
total exports, the volume of exports to the EU increased from US$5.7 billion USD in 2002 to US$20 billion in 2008.
Notwithstanding a peak in 2007, the share of Russia, the second most important destination has remained broadly
constant at around 23.5 percent since the early 2000s. Several other countries have emerged as important trade
partners during the reference period, including Kazakhstan, Egypt and India reaching the share of about three
percent each in 2008 up from zero in 2002. The volume of exports to these three destinations in total reached
US$5.5 billion USD in 2008.
Table 2: Shares of Ukraine's exports by destination, in percent
2002 2003 2004 2005 2006 2007 2008
EU‐27 39.8 37.0 32.9 28.6 30.1 31.0 29.1
Russia 22.3 23.5 21.0 22.4 23.7 26.0 23.5
Turkey 6.8 7.1 8.7 7.7 7.9 8.8 8.9
USA 3.2 1.7 3.2 3.5 4.6 2.6 3.6
Belarus 2.0 1.9 1.9 2.6 3.2 3.0 3.1
Kazakhstan 0.0 0.0 2.5 2.4 2.5 3.0 3.1
Egypt 0.0 0.0 0.0 0.0 0.0 0.0 2.9
India 0.0 1.2 1.3 2.5 2.4 1.8 2.0
China 4.9 6.7 3.6 2.3 1.1 1.3 1.7
Rest of the world 21.0 21.0 24.8 27.9 24.5 22.5 22.2
Total 100.0 100.0 100.0 100.0 100.0 100.0 100.0
Source: WITS
The correlation between Ukraine's export and economic growth is consistent with exports playing an important
part in Ukraine’s take off in the 2000s. The observed growth and changing structure of exports reflect the changing
structure of Ukraine's economy—some sectors becoming more prominent than others. For that reason, it is
important for Ukraine to consider—as part of any PTA—the future potential and needs of the emerging sectors as
well as to properly account for the reduced potential of the declining sectors. As already noted, the data show that
Ukraine's trade partners have become more diverse recently, shadowing the importance of the EU as the recipient
of Ukraine's exports. Ukraine's exports, unlike eight years ago, have expanded to the emerging parts of Asia and
Africa, making these countries of interest to any future potential PTAs. This also raises the risk of increased trade
diversion from any bilateral agreement with the EU in the absence of further MFN liberalization.
Table 3 displays Ukrainian production, consumption, imports and exports in 2007 for the key unprocessed
crops. The most prominent crop of Ukraine is potatoes which is almost exclusively produced and consumed
domestically. With the exception of barley and apples, most of the other crops show only minuscule levels of
exports, which could mean that these products have export potential once they meet the sanitary and
phytosanitary (SPS) requirements and provided that they could be competitive on the EU market.

6
Table 3: Ukraine’s production, exports and imports in 2007 for top agricultural commodities (excluding live animals
and processed crops), in millions of USD
Production Imports Exports Consumption Imp/Cons Exp/Prod
Potatoes 3,896.80 18.5 0.5 3,914.80 0.5% 0.0%
Wheat 2,188.20 60.6 294.3 1,954.50 3.1% 13.4%
Sunflower seed 1,569.60 3.9 125.6 1,447.90 0.3% 8.0%
Maize 1,224.50 4.6 143.1 1,086.00 0.4% 11.7%
Barley 1,052.60 24.4 450.7 626.30 3.9% 42.8%
Tomatoes 558.6 29.9 27.1 561.40 5.3% 4.9%
Sugar Beet 526.3 0.8 ‐ 527.10 0.2% 0.0%
Apples 191 54.5 42.3 203.20 26.8% 22.1%
Grapes 152.5 52.8 1.9 203.40 26.0% 1.2%
Rye 93.4 3.9 5 92.30 4.2% 5.4%
Oats 80 0.5 0.3 80.20 0.6% 0.4%
Millet 16.9 ‐ 1.5 15.40 0.0% 8.9%
Sorghum 13.2 0.1 1.1 12.20 0.8% 8.3%
Source: FAO
2.2 Ukraine’sagriculturalpoliciesandprogressinEU‐Ukraineintegration
Priceandincomesupport6
Ukraine has adopted a variety of domestic measures that affect key agricultural commodities. The government
sets official minimum prices for grains and oilseeds and subsidizes livestock products. To keep prices within the
limit set by the government, the state agency Agrarian Fund intervenes in the market of grains through direct spot
purchases into the State Food Reserve or forward‐contracting and lending against pledged commodities. Although
its scale of interventions does not usually exceed 2 percent of seasonal grain consumption, the Agrarian Fund
spent US$57 million in 2006 and US$108 million in 2007 on grain interventions. Its budget has been more than
doubled to US$258 million in the marketing season 2008/09. In the 2009/2010 season, the government planned to
continue interventions on the grain markets, namely wheat and rye, but state budget constraints might lead to
lack of funds for intervention purchases.
Since 2000 Ukraine has also maintained a sugar quota regime with marketing quotas for sugar from sugar
beets and minimum in‐quota prices for sugar beets and sugar set annually. Following Ukraine’s WTO accession in
2008, only the quota covering sugar produced for domestic market has been maintained, where producers in
addition to minimum prices also receive direct payments per sown hectare. The quotas on sugar destined outside
Ukraine under intergovernmental agreements, as well as the quota on exported sugar have been abolished with
the WTO accession as quantitative restrictions on exports.
The government regularly announces minimum prices for several products such as raw milk, cream,
cattle, live pigs, poultry and eggs. Effectively, these minimum prices are only used as a basis for calculation of per
6 This section relies heavily on OECD (2009).

7
ton payments for livestock products. Some producers are also receiving direct payments per ton of animal
delivered for processing in the case of cattle, pigs and poultry, while the producers of sheep, wool, organic milk,
honey and silkworms receive specific per ton payments. The government provides payments for breeding cows
and pedigree cows as well as for breeding ewes and yearling sheep. In 2006 payments for production of grain,
rapeseed, hops and flax have been introduced, with the bulk of the financing directed to wheat growers. In
addition to the above policies an array of other support policies is in place to assist domestic producers such as
concessional credit, subsidies for a variety of purchased inputs or tax concessions (for details see e.g. OECD, 2009).
Exportmeasures
In recent years, Ukraine has introduced export measures with the stated aim of containing domestic food price
increases during episodes of spikes in world food prices. The government imposed quotas on exports of wheat,
barley, maize and rye throughout most of the 2006/2007 and 2007/2008 marketing seasons. As a result exports of
grained fell from 13.2 million in 2005/2006 to 9.6 million in 2006/2007 and further to 3.7 million tons in
2007/2008. The history of wheat quotas is presented in Figure 1. In the second quarter of 2008, the quota has
allowed only a very limited amount of exports. There was also an attempt to impose export restrictions on
sunflower seeds and sunflower oil in May 2008; however this decision was abrogated by the President two months
later as being inconsistent with Ukraine’s WTO commitments.
At the time of WTO accession, Ukraine maintained several export restrictions such as export duties on
oilseeds, live animals, hides and skins. As a result of the WTO commitments, export duties on flax seeds, sunflower
and false flax are being reduced from the original 17 percent in 2008 by annual cuts of 1 percentage point to
eventually reach 10 percent. The reductions of export duties on cattle, hides and skins started in 2009. The export
duty on "live bovine animals" and "live sheep and goats" was reduced to 50 percent upon WTO accession and is
being reduced to 10 percent, through five percentage points annual reductions; while the export duty on hides
(cattle hides, sheep and lamb skin, pigskin) is being brought down from 30 to 20 percent, through one percentage
point annual reductions. These export duties are likely to be abolished in a future FTA with the EU. In negotiating a
DCFTA, the EU might request that Ukraine abolishes its duties on exports to the EU. This would create additional
gains for EU consumers, EU producers and Ukrainian producers. Analyzing the impact of the removal of these
export duties is beyond the scope of our study, but it is an important issue that could be explored in further
research.

8
Figure 1 Ukrainian wheat export quota and wholesale wheat prices in 2006‐08
Source: Kobouta, 2008 based on Ukraine’s State Customs Service data.
WTOAccession
Ukraine became a member of the WTO in April 2008. Through its protocol of Accession, Ukraine committed to
implement scheduled import tariff reductions, eliminate specific tariffs and maintain only ad valorem rates.
Ukraine also committed to lower export duties, and to eliminate obligatory minimum export prices and export
subsidies. The trade distorting support has been limited to US$600 million.
Prior to the start of WTO negotiations in 2005 Ukraine maintained a relatively high level of tariffs, but it
has been substantially reduced as the WTO negotiations intensified (Figure 2). In particular, with WTO accession
the protection of several agricultural commodities has been substantially reduced (Table 4). Agricultural products
400
600
800
1,000
1,200
1,400
1,600
U AH/tonne
Milling wheat, 3rd class Milling wheat, 4th class Feed wheat
28 September, 2006: licensing of export and import of wheatand wheat‐rye mix (meslin)introduced
New export quota from 1 January 2007 to 30 June2007 introduced (3 000 t)
16 May 2007 export quota for wheat cancelled
New export quota from 1 July 2007 to 31 December 2007 introduced (3 000 t)
New export quota from 1 January 2008 to 31 March 2008 introduced (200 000 t)
New export quotas introduced until 1 July 2008 (1 200 000 t)
1 July 2008 export quota for wheat cancelled
11 October, 2006: export quota introduced until 31 December 2006 (400 000 t)

9
such as pork, poultry and sugar have been subject to stronger import competition. The remaining sectors are
export‐oriented and unlikely to be significantly affected by tariff reductions.
Figure 2: Ukrainian applied import tariffs for selected agricultural commodities (ad valorem equivalents).
Source: Kobouta, 2008 based on Ukraine’s State Customs Service data.
Table 4: Ukrainian tariffs before and bound after the WTO accession.
Product and code Applied import tariff in Ukraine before accession to WTO as of July 1, 2007
Bound tariff rate after Ukraine's accession to
the WTO as of May 16, 2008
official statutory rate ad valorem equivalent1
Wheat (1001909930) EUR 40 for 1 ton 30% 10% Barley (100300) EUR 20 for 1 ton 15% 5% Fresh apricots (809100000) EUR 0.5 for 1 kg 66% 5% White sugar (1701991000) 50%, but not less than EUR 300 per ton 79% 50% Sunflower seeds (1206009900) 15% 15% 10% Beef, frozen (202100000) 10%, but not less than EUR 0.6 per 1 kg 29% 15% Pork, fresh or frozen (203000000) 10%, but not less than EUR 0.6 for 1 kg 42% 10-12% Poultry (0207) 10%, but not less than EUR 0.4 for 1 kg 31% 5-15% Yoghurts (403109100) EUR 0.5 for 1 kg 20% 10% Butter (405101100) EUR 1.5 for 1 kg 28% 10%
1. Specific rates are converted into ad valorem equivalents using the customs value of goods in 2006.
Source: Kobouta, 2008 based on Ukraine’s State Customs Service data.
As part of its WTO commitments Ukraine has undertaken to establish a quota for imports of raw sugar of 263
thousand tons in 2009 and 267 thousand tons in 2010 with in‐quota tariff rate (TRQ) of 2 percent. Ukraine used to
have sugar TRQ’s until 2004 and chose to reintroduce this measure with a decree in 2008. Several products are
also subject to import (and export) licensing. In 2006 the list of products covered included live animals, wheat and
meat; and the list was extended to include several food byproducts, sugar and sugar syrup and food products with
cocoa in 2008.
0
50
100
150
200
250
300
350
2003 2004 2005 2006 2007 2008
Ad valorem equivalents
Ukrainian applied import tariffs
Wheat
Sunflower Seeds
Sugar
Pigmeat
Poultry

10
TradeagreementsandnegotiationswiththeEU
Ukraine faces tariff free access to all CIS markets and vice versa. Ukraine has bilateral free trade agreements with
Armenia, Azerbaijan, Belarus, Georgia, Kazakhstan, Kyrgyz Republic, Moldova, Russian Federation, Tajikistan and
Uzbekistan, as well as GUAM7 along with Azerbaijan, Georgia, Moldova and Uzbekistan and it belongs to the Single
Economic Space along with Belarus, Kazakhstan and Russia. There are only a few exemptions from a free trade
area in relations with Belarus, the Russian Federation, Georgia and Moldova (sugar and sugar syrup). With Russia,
Ukraine’s biggest single trade partner, Ukraine has a simple bilateral free trade regime dating from 1993.There are
exceptions from free trade such as sugar (import tariffs applied) or energy materials (export duties applied by
Russia). Besides, bilateral trade is distorted by Russia’s quantitative restrictions on Ukrainian metal products and
discriminatory SPS measures by Russia. All PTAs with CIS countries suffer from weak dispute settlement
procedures and mechanisms.
Ukraine has engaged in the negotiations of a Deep and Comprehensive FTA (DCFTA) with the EU, its
biggest trading partner. The negotiations were launched in February 2008. This DCFTA is intended as an instrument
to create a stable and prosperous European neighborhood through closer economic ties. This agreement, the first
of this kind to be negotiated between the EU and a country covered under the European Neighborhood Policy
(ENP) has the potential to become a benchmark for future EU relations with other ENP countries. The DCFTA will
cover a wide range of issues in trade in goods and services (“comprehensive”) and will tackle the behind‐the‐
border obstacles to trade through regulatory approximation (“deep”). Therefore the DCFTA will offer Ukraine a
stake in the EU internal market. Due to the importance of the ties with the EU both in terms of trade and
investment and the extent of regulatory reforms associated with the PTA, the agreement is likely to have a
substantial impact on the Ukrainian economy.
The trade relations between Ukraine and the EU are very asymmetrical. While the EU is Ukraine’s first
trading partner, accounting for 29 percent of total exports and 33 percent of imports in 2008, Ukraine accounted
for only 2 percent of extra‐EU exports and 1 percent of extra‐EU imports. EU‐Ukraine trade reached 39.5bn EUR in
2008 and has been growing steadily in recent years. Ukraine’s main exports to the EU include agricultural products,
energy, chemicals, iron and steel. It imports machinery, transport equipment, chemicals, textile and clothing, and
agricultural products from the EU.
Ukraine has been enjoying preferential access to the EU market thanks to the Generalized System of
Preferences (GSP) granted to Ukraine since 1993. In 2008 the utilization rate reached 85 percent of eligible
products (mainly chemicals, plant oils, minerals, base metals, machinery and mechanical appliances).8 In addition
42 percent of Ukrainian exports of agricultural products can be sold duty‐free on the EU market (at MFN zero
rates). However, significant barriers to trade in selected agricultural products remain.
7 Georgia, Uzbekistan, Azerbaijan and Moldova 8 CARIS (2010).

11
2.3 ProtectionoftheEU'sagriculturalmarket
Agricultural output and food protection in the EU, expressed in term of the applied ad valorem import duty
equivalent, stood relatively high among developed countries at the average of 13.8 percent for all agricultural
output and food commodities in 2007. For comparison, the overall level of taxation of agricultural imports into
North America was 6.0 percent, and 5.4 percent into Australia and New Zealand.9
In addition to a relatively high overall level, the EU's agricultural protection also featured significant
variation amount commodities (Table 5). For example cattle meat faced a tariff of 160.5 percent, while wheat
faced an average 10.4 percent rate in 2006, maize a 7.4 percent duty and barley a 6.6 percent duty. Some other
important agricultural crops, such as sunflower seeds, faced zero duty. The details of EU’s import regimes for
wheat, maize and barley are as follows:
Wheat
Since 2007, the EU import duty on wheat imports has been set at 148€/t for durum wheat and 95€/t for common
wheat.10 The bulk (80 percent in 2008) of wheat imports into the EU is in the form of common wheat and nearly all
of the rest is durum wheat (Figure 4). Seed imports represented a negligible share of wheat imports in 2008.
While the duty on low‐quality common wheat is fixed, the actual duties on high‐ and medium‐quality common and
on all durum wheat imports primarily depend on the intervention price, set at 101.31€/t since 2003. The
intervention price could be seasonally raised by an additional 3.22€/t following the monthly schedule added to the
regulation.11 The applied duties also depend on the quality of wheat, the world price of wheat and the shipping
route.12 In the calculation of EU duties, the price of low quality wheat is assumed to be higher by 30€/t and the
price of medium quality wheat by 10€/t.13 Instead of calculating tariffs for each shipment, the EU regularly
(biweekly) publishes the observed world prices (Minneapolis) along with any price premiums/discounts and
shipping route discounts. The observed applied tariffs since 2003 are shown in Figure 4.
9 The tariff rates of protection as reported by the GTAP database (2004) 10 Council Regulation 2658/87 amended by 1214/2007
11 Regulations 1784/2003 and 1234/2007
12 The actual applied rate of protection is calculated as 1.55 x intervention price less the CIF price of wheat imports and less the applicable
discount for routing of the shipment and surcharges for any market premiums. 13 Regulation 1249/96

12
Table 5: Applied import tariff ad valorem equivalents for Ukraine's exports to the EU in 2008
Applied rate Amount of imports millions of USD
Share of agricultural output and food trade
Rice 14.3 0.0 0.0%
Wheat 10.4 316.2 19.6%
Maize 7.4 96.6 6.0%
Barley 6.6 183.8 11.4%
Other grains 10.4 2.9 0.2%
Fruits and vegetables 2.8 65.6 4.1%
Sunflower seeds 0.0 132.5 8.2%
Other oil seeds 10.4 2.4 0.1%
Sugar cane and beets 1.8 1.4 0.1%
Plant‐based fibers 0.0 2.9 0.2%
Other crops 1.4 14.8 0.9%
Cattle 4.4 1.8 0.1%
Other animal products 2.0 60.4 3.7%
Raw milk 0.0 10.1 0.6%
Wool 0.3 0.2 0.0%
Forestry products 0.0 82.7 5.1%
Fishing 1.7 0.7 0.0%
Cattle meat 160.5 2.0 0.1%
Other meat 6.6 0.6 0.0%
Sunflower oil 6.4 348.2 21.6%
Other oils and fats 1.8 0.4 0.0%
Dairy 4.0 116.2 7.2%
Processed rice 48.8 1.1 0.1%
Processed sugar 29.1 16.4 1.0%
Other food 17.4 105.7 6.6%
Beverages and tobacco 25.1 45.5 2.8%
Source: GTAP database, Eurostat
In addition to the established duties, certain amount of wheat enters EU market duty free thus raising the volatility
of protection for importers. The EU regulation14 provides for duty free access for 0.3 Mt of all wheat combined for
all countries, and 0.015 Mt of cereal imports for ACP countries with a 50 percent reduction of the MFN duty.
Additionally, a tariff‐rate quota of 12 €/t for nearly 3.0 Mt had been in place during the period we study (between
2000 and 2008) with minor modifications. Total wheat imports into the EU substantially exceeded this tariff‐rate
quota and amounted to 6.8 Mt in 2008. Finally, autonomous rate suspension took place in 2008, allowing duty free
importation of wheat at times of high world prices.
14 2133/2001

13
Figure 3: Composition of wheat imports into the EU
Source: Eurostat
Figure 4: Observed tariffs on wheat imports from Ukraine into the EU
Source: European Union's customs website, using Eurostat's trade and preference data
Maize
Protection of maize in the EU market is governed by the general approach that applies to wheat. In this case, the
level of duties depends on the intervention price of 101.31€/t. The actually applied duties are periodically
calculated and officially fixed by the EU executive along with tariffs for wheat. Unlike wheat, maize is not divided
0
0.2
0.4
0.6
0.8
1
1.2
01‐2000
05‐2000
09‐2000
01‐2001
05‐2001
09‐2001
01‐2002
05‐2002
09‐2002
01‐2003
05‐2003
09‐2003
01‐2004
05‐2004
09‐2004
01‐2005
05‐2005
09‐2005
01‐2006
05‐2006
09‐2006
01‐2007
05‐2007
09‐2007
01‐2008
05‐2008
09‐2008
Durum wheat Common wheat
0
50
100
150
200
250
300
0
10
20
30
40
50
60
70
80
90
100
Jul/98 Dec/99 Apr/01 Sep/02 Jan/04 May/05 Oct/06 Feb/08 Jul/09
Tariff (EUR/t)
Ad valorem equivalent (percentagepoints)
Price (EUR/t) [secondary axis]

14
into different categories according to its quality but its end‐use into seed and other. Other maize receives an
additional reduction in tariff by 24€/t.15 Historical level of protection of maize is shown in Figure 5. Similarly to the
case of wheat, in 2008 the EU suspended tariffs on maize imports, resulting in duty‐free importation of this
commodity.
Figure 5: Observed tariffs on maize imports from Ukraine into the EU
Source: European Union's customs website, using Eurostat's trade and preference data
Barley
Protection of barley in the EU market sets the import duty at 93€/t.16 Unlike wheat and maize, the regulation does
not allow replacement of this duty with intervention duties, and therefore the duty has been fixed since 2007.
However, as in the case of wheat, the EU operates a tariff rate quota with the rate of 16€/t for 0.35 Mt of barley
imports, a relatively large concession given that total imports were 0.54 Mt in 2008. Furthermore, duties were
suspended in 2008.
Sunflowerseedsandoil
Since 1999, sunflower seeds (in any form) enter the EU tariff‐free while the importation of sunflower oil has been
subject to a 6.4 percent duty.17
15 Following the provisions of Article 2(5) of Regulation 1249/96.
16 Protection of barley in the EU market is also governed by Council Regulation 2658/87 as amended by 1214/2007. 17 Regulation 2204/1999
0
50
100
150
200
250
0
10
20
30
40
50
60
Jul‐98 Dec‐99 Apr‐01 Sep‐02 Jan‐04 May‐05 Oct‐06 Feb‐08 Jul‐09
Tariff (EUR/t)
Ad valorem equivalent (in percentage points)
Price (EUR/t) [secondary axis]

15
Figure 6: Observed tariffs on barley imports from Ukraine into the EU18
Source: European Union's customs website, using Eurostat's trade and preference data
3. ModelandData
We perform our analysis using a general equilibrium model which allows us to consider all relevant intra‐ and
inter‐economy impacts of the simulated policy changes. Our model is based on the standard GTAP model (Hertel
1997) that links together production, consumption, savings and trade among a number of regions under several
key assumptions: production is modeled by a nested CES production function and exhibits constant returns to
scale;19 regional consumption is modeled by a representative agent with preferences described by a CDE demand
function;20 and international trade is modeled to follow Armington's assumption on differentiation of products by
source by a nested CES import function.21
In order to make the model a better representation of Ukraine's economy, we made two minor
modifications in its assumptions. First, given the vast amounts of land available in Ukraine that has not been
utilized after the fall of the Soviet Union, we assumed that the amount of available land in Ukraine can change
freely while its returns remain constant. FAO‐EBRD study (2008) suggests that in the medium run the land use in
Ukraine could increase by up to 21 percent. Also, to better represent the long‐run nature of many of our
simulations, we assumed that capital stock can be moved in search of higher returns across borders.
18 Observed from the European Union's customs website, using Eurostat's trade and preference data
19 A CES production function represents a well‐behaved production that is able to describe production behavior of firms with a small number of
estimated parameters 20 A CDE demand function represents a globally well‐behaved and parsimonious demand function well suited for computer modeling work 21 Armington assumption states that imports from different countries are only imperfect substitutes of each other, resulting in bilateral trade of seemingly identical commodities.
0
50
100
150
200
250
300
350
400
450
500
0
2
4
6
8
10
12
14
16
18
20
Dec‐99 Apr‐01 Sep‐02 Jan‐04 May‐05 Oct‐06 Feb‐08 Jul‐09
Tariff (EUR/t)
Ad valorem equivalent (in percentage points)
Price (EUR/t) [secondary axis]

16
One limitation of the proposed model is the level of aggregation which does not allow to distinguish between
different types of wheat, all of which face different protection. Instead, we work with the "average" wheat, which
takes into account the observed shares of durum and common wheat and their quality levels. By assuming that
wheat from each country is different, it takes into account—in a rough and ready manner—the differences in the
distribution of wheat output by quality type between countries. If we assume that countries consistently produce
the same types of wheat, this limitation has no serious impacts on the results. However, if countries are able to
choose different mix of wheat output in terms of its variety, the model results may overstate the cost of
protection, since it would not take into account such cost‐saving reductions in the production mix.
3.1 Welfareimplicationoftradeliberalization
We consider the two key determinants of whether a PTA improves the welfare of a particular member: the impact
of improved market access on the terms of trade, and the effects of own‐liberalization on welfare through trade
creation and diversion effects. Improvements in access to a market like the EU shift out the export demand curve
facing Ukrainian exporters. Given the large size of the EU market relative to Ukraine, this is likely to benefit Ukraine
by raising the prices received for exports. As noted in the previous section, the EU rate of protection on some key
commodities is highly variable. If this protection tends to be high when exports from Ukraine are large, the average
rate of protection may underestimate the adverse impacts of EU protection on Ukraine.
To assess whether the variability of protection influences the welfare impact of EU protection on Ukraine,
we develop a framework with stochastic protection. On the import side, the direct welfare impact of a reduction
in protection through trade creation is represented in Figure 7. If the tariff on imports of a good is initially t, raising
the internal price from p to p+t, then abolition of this tariff will result in a direct welfare gain measured by the area
abc.
The favorable welfare impacts of trade creation need to be considered relative to the costs associated
with trade diversion. While the reduction in tariffs on imports from the EU will increase imports from the EU, it is
likely to reduce imports of the same good (or substitute goods) from other countries. If these goods are subject to
tariffs, while those from the EU are not, there will be a trade diversion effect with adverse impacts for economic
efficiency and for tariff revenue collections. These impacts are represented in Figure 8 by showing the inward shift
in the import demands for these goods from D0 to D1 at a constant tariff. The resulting decline in tariff revenues
given by area abcd is a measure both of tariff revenue loss and of economic welfare. This is because each unit of a
good imported subject to a tariff of t has a marginal value of p+t inside the country but costs only p.

17
Figure 7: Welfare impacts of trade creation
Figure 8: Costs of Trade Diversion
p+t
p a
b c
d
D0
D1
p+t
p a
b
c

18
3.2 Stochasticsimulations
Because agricultural protection of the EU is volatile, the model is set up to capture its stochastic nature. To run a
stochastic model in the most efficient way, the change in protection relative to the average is simulated using
Gaussian quadrature. This procedure is described in Arndt and Pearson (2000). In a nutshell, it substitutes the need
to run a large number of Monte Carlo‐type simulations with random changes in agricultural protection by a small
number of simulations with a strategically selected set of changes in the yields that allow inferring the mean and
standard deviation of the underlying model variables. The stochastic model simulates not only the observed
variation in the protection of the three cereal crops but also their co‐variation. The latter is necessary due to high
observed correlations between the protection of various crops, especially maize and barley as discussed earlier.
3.3 Armingtonelasticities
To describe the impacts of the EU and Ukraine’s own trade policy on Ukraine's exports and welfare, a set of
Armington elasticities corresponding to the five agricultural commodities discussed above have been estimated
using the Comtrade data for the regional groups and countries specified in the model. These regions include the
major regional blocks as well as most Ukraine’s immediate neighbors for which data are available. The elasticities
of substitution among the imports from various sources play a key role in determining the impacts of trade policy
on changes in exports, welfare and bilateral trade prices. However, to our best knowledge the estimates of such
elasticities for the EU market are not available. The estimates available in the GTAP data base are based on the US
data and do not include the Armington elasticites for sunflower seed and sunflower oil. Hence a set of Armington
elasticities has been estimated for the purpose of this paper. The details are provided in the Appendix: Estimation
of Armington elasticities.
Our estimated elasticities of substitution are of the similar order of magnitude as the parameters
available in the GTAP database. They imply a significant source substitution as a result of price changes (Table 6).
For example in the case of wheat, we estimate that a reduction of price by one percent relative to other sources
will raise imports from that source by 7.9 percent. Our estimation suggests that the level of import substitution is
very similar for all cereals (in the range of ‐7.8–‐8.0). We find that sunflower seeds and sunflower oil are even more
substitutable, perhaps due to their more homogenous nature.
Table 6: Estimated Armington elasticities
Wheat Barley Maize Sunflower seed
Sunflower oil
Estimate ‐7.9 ‐7.8 ‐8.0 ‐8.7 ‐10.7
Standard deviation 0.1 0.1 0.1 0.1 0.1
Number of observations 2772.0 1488.0 1748.0 2531.0 1735.0

19
4. Simulations
Using the general equilibrium model described earlier, we run a set of stylized simulations to illustrate the effects
of some key policy decisions regarding a potential DCFTA with the EU on Ukraine’s agricultural sector. In the first
set of simulations we address the issue of welfare costs borne by Ukraine due to the agricultural protection of the
EU. We separately explore the aspects of the volatility of protection. Finally, we simulate the implementation of a
stylized FTA agreement between the EU and Ukraine covering all agricultural output and processed food, with or
without exceptions for sensitive products.
4.1 EvaluationoftheremovalofEU'sagriculturalprotectiononUkraine'simports
In the first set of simulations, we model the complete removal of the EU's agricultural protection from Ukrainian
imports. We initially ignore the consequences of the volatility of tariffs and only focus on their mean values. We
measure the cost of protection by removing the existing average agricultural tariffs imposed on Ukraine's exports
to the EU. In running the simulation, we also take advantage of the model's ability to attribute the final results to
individual crops, in order to assess the importance of each crop for each trading partner.
4.2 Costofcerealprotectionvolatility
In the baseline simulation, we also assess the impact of the observed volatility in the EU cereal protection on
Ukraine. In formulating the scenario, we consider the observed monthly volatility of EU's cereal protection from its
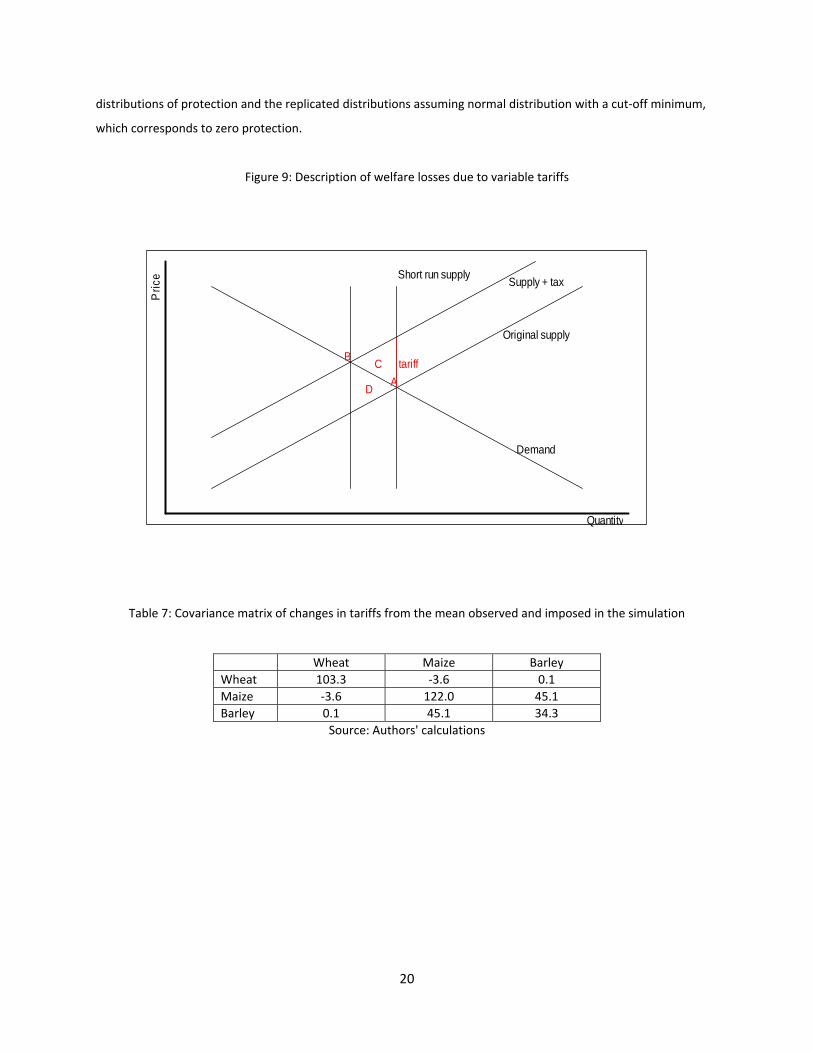
mean over the period of 2000–08. In this scenario, we assume that Ukrainian farmers are unable to adjust their
annual planting decisions in response to changing tariffs. Because farmers cannot adjust their export supply to a
different tariff in a short run (Figure 9), their supply is essentially fixed: instead of shifting to equilibrium point B,
exports remain in the original point A. At this level of production, however, the imposition of the tariff represents
an economic cost represented by area C as production costs exceed benefits. It is worth noting though that for
small changes, area D is equivalent to area C, which represents the welfare loss of a domestic subsidy that would
bring the long‐run supply curve to the original equilibrium point A. We use this property in our simulation to
measure the short‐run loss due to variable tariffs as the welfare loss of the import tariff in the long‐run setting.
To insulate the costs linked to the EU protection volatility, the simulation is run with the mean protection set to
zero (so as to ignore, at least temporarily, the costs of the average protection) allowing protection to vary from
the mean as observed in the data from the period 2000–08. In the stochastic simulation we assume that the
variation in protection is normally distributed (with a minimum). We also assume that protection level can never
reach a negative value (no subsidization of imports). The covariance matrix of changes in tariffs from the mean
observed and imposed in the simulation is presented in Table 7. This table of covariances suggests that maize and
barley are somewhat correlated and almost uncorrelated with wheat. In Figure 10, we show the observed
20
distributions of protection and the replicated distributions assuming normal distribution with a cut‐off minimum,
which corresponds to zero protection.
Figure 9: Description of welfare losses due to variable tariffs
Table 7: Covariance matrix of changes in tariffs from the mean observed and imposed in the simulation
Wheat Maize Barley
Wheat 103.3 ‐3.6 0.1
Maize ‐3.6 122.0 45.1
Barley 0.1 45.1 34.3
Source: Authors' calculations
Original supply
Supply + tax
Demand
Short run supply
A
Btariff
D
C
Quantity
Pri
ce

21
Figure 10: Observed and recovered changes in tariffs relative to mean
Source: Authors' calculations
4.3 EstablishmentofaFTAagreementbetweenUkraineandtheEU
In the fifth and final simulation we explore the implications of a DCFTA with the EU, which would bring import
protection to zero for all agricultural and processed food imports. We consider two options—one in which the
liberalization between the two countries covers all agricultural and processed food commodities and brings their
protection to zero, and another one in which the EU preserves the current level of protection for a key set of
sensitive commodities, including poultry meat, eggs, wheat, barley, maize and chocolate (Table 8).
Table 8: Agricultural products assumed to be sensitive by the EU
Product HS6 classifications
Poultry meat and poultry meat preparations 020711, 020712, 020713, 020714, 020724, 020725, 020726, 020727, 020732, 020733, 020735, 020736, 021099, 160231, 160232, 160239
Eggs and albumins 040700, 040811, 040819, 040891, 040899, 350211,350219,350220
Common wheat, flours, and pellets 100190, 110100, 110290, 110311, 110320
Barley, flour and pellets 100300, 110290,110320
Maize, flour and pellets 100590,110220,110313,110320,110423
Chocolate processed products 180620, 180631, 180632, 180690
W h e a t ( o b s e r v e d )
Fre
quen
cy
- 1 0 0 1 0 2 0 3 0 4 0 5 0
010
2030
4050
B a r l e y ( o b s e r v e d )
Fre
quen
cy
- 5 0 5 1 0 1 5 2 0 2 5
010
2030
40
M a i z e ( o b s e r v e d )
Fre
quen
cy
0 1 0 2 0 3 0 4 0 5 0
010
2030
4050
60
W h e a t ( r e c o v e r e d )
Fre
quen
cy
- 1 0 0 1 0 2 0 3 0 4 0 5 0
010
020
030
040
0
B a r l e y ( r e c o v e r e d )
Fre
quen
cy
- 5 0 5 1 0 1 5 2 0 2 5
010
020
030
0M a i z e ( r e c o v e r e d )
Fre
quen
cy
0 1 0 2 0 3 0 4 0 5 0
010
020
030
040
050
060
0

22
5. Results
In this section we describe the results of our CGE model for a set of scenarios described in the previous section.
Most of the results are presented as percentage change (from the base of 2010). As indicated, some of the results,
especially those related to the changes in welfare, are presented in millions of US dollars valued at 2004, the base
year of the GTAP database.
5.1 RemovaloftheEU'stariffsonUkraine'sexports
Removal of agricultural protection by the EU may result in significant welfare gains to Ukraine. We measure these
welfare gains as equivalent variation, which shows in dollar terms how much income Ukrainian economy would
have to receive as a compensation for not liberalization in order to be indifferent between the two options. A
positive welfare change of a certain policy means that Ukraine would have to receive that amount of income in
order to be equally well off without that policy.
The precise value of these gains will depend on the set of commodities that will be included in
liberalization and the size of the tariff reduction. In the case of complete liberalization of agricultural and
processed food products, the total welfare gain to Ukraine may reach US$362 million annually (equivalent to 0.6
percent of Ukraine's GDP) as shown in Table 9. About sixty percent of these gains (US$213 million) would accrue
from the liberalization of cereal exports—especially from the exports of wheat (US$137 million), sunflower oil
(US$60 million), barley (US$45 million), other food (US$34 million) and maize (US$31 million).It is important to
note that no sector would be hurt by the removal of the EU's tariffs.

23
Table 9: Change in Ukraine's welfare due to the removal of EU's agricultural protection, millions of USD
Change in Ukraine's EV
Rice 0.0
Wheat 137.3
Maize 30.7
Barley 44.7
Other grains 0.4
Fruits and vegetables 3.6
Sunflower seeds 0.0
Other oil seeds 0.5
Sugar cane and beets 0.1
Plant‐based fibers 0.0
Other crops 0.6
Cattle 0.1
Other animals 1.5
Raw milk 0.0
Wool 0.0
Forestry 0.0
Fishing 0.0
Cattle meat 0.2
Other meat 0.2
Sunflower oil 60.5
Other fats and oils 0.0
Dairy 15.5
Processed rice 2.8
Sugar 17.2
Other food 33.9
Beverages and tobacco 12.2
Total 361.9
Source: Authors’ calculations
In terms of output, the removal of all EU's protection with regard to Ukraine's agricultural exports would represent
an increase of agricultural output by 5.8 percent and an increase of agricultural and food production by 5.3
percent. The increase agricultural output would also raise the amount of land used in agriculture by 6.6 percent—
because agricultural output is expected to rise at a lower rate, a greater increase in land use will result in overall
reduction in yields. In addition to using more land, Ukraine would also attract a 0.8 percent increase in capital,
mainly for the use growing wheat and processing of sunflower oil.
In Table 10, we show the particular changes in output and exports for the agricultural and food sectors.
One key Ukrainian sector benefiting most from the reduction in the EU's protection is wheat production, whose
output rises by 19.8 percent, exports by 43.9 percent and exports into the EU by 72.1 percent. The sector of
sunflower oil is also likely to grow (by 11.2 percent), its exports by 17.7 percent and exports into the EU by 43.7
percent.

24
Table 10: Change in output and export resulting from the removal of EU's protection, percentage changes
Output Land use
Exports Exports to EU
Rice 5.0 5.4 ‐2.7 155.9
Wheat 19.8 18.1 43.9 72.1
Maize 9.2 9.0 24.9 61.5
Barley 8.3 8.2 12.7 48.6
Other grains 8.5 8.4 8.5 26.8
Fruits and vegetables 1.8 2.7 6.1 10.8
Sunflower seeds 4.0 4.5 ‐1.3 ‐1.5
Other oil seeds 27.0 24.4 27.1 42.4
Sugar cane and beets 4.2 4.7 3.6 8.0
Plant‐based fibers 0.6 1.6 1.2 1.2
Other crops 3.5 4.1 4.1 8.3
Cattle 0.9 1.9 5.8 17.9
Other animals 1.9 2.7 1.2 4.0
Raw milk 2.8 3.5 ‐2.1 ‐2.2
Wool ‐1.3 ‐0.1 2.0 2.2
Forestry ‐1.0 n/a ‐1.3 ‐1.4
Fishing 1.0 n/a ‐4.1 ‐1.8
Cattle meat 1.1 n/a ‐2.2 115,743.222
Other meat ‐0.3 n/a ‐2.3 68.1
Sunflower oil 12.5 n/a 17.7 43.2
Other fats and oils ‐2.1 n/a ‐2.1 9.5
Dairy 2.7 n/a 4.0 29.1
Processed rice 5.1 n/a 293.8 664.7
Sugar 14.0 n/a 74.7 287.3
Other food 4.1 n/a 9.9 86.3
Beverages and tobacco 2.9 n/a 8.1 65.7
Source: Authors’ calculations
5.2 ImpactofthevolatilityoftheEU'sprotectiononcereals
As noted above, Ukrainian exporters are facing the volatility of tariffs of major agricultural commodities to the EU.
Using the methodology described above, we measure the impact of the volatility of the EU's protection on
Ukraine's economy. In this simulation we shift our focus from the average tariffs, which we assume to be constant
and equal to the existing tariffs, and instead measure the impacts of the EU's tariff volatility in the cereal market
on Ukraine's welfare and its main components: the allocative losses due to misallocation of resources and terms of
trade due to higher export prices over import prices.
We report the results of this exercise in Table 11, which suggests that the observed protection volatility—
changes in protection around the existing mean—creates a gain of US$11 million for Ukraine with an extreme
standard deviation of US$63.3 million. Because in this simulation we only measure the welfare cost of the volatility
22 The huge increase in the exports in percentage terms reflects little change in the value of exports given that the original exports of beef from Ukraine to the European Union are nearly zero
25
of tariffs imposed on cereals around their means and not the cost of the mean tariff (which we did in the previous
simulation), the sets of results presented in Table 11 are not directly comparable to the results in Table 9—as the
level of volatility becomes smaller, so will the associated gains or losses; the welfare loss of the mean tariff will
however remain the same.
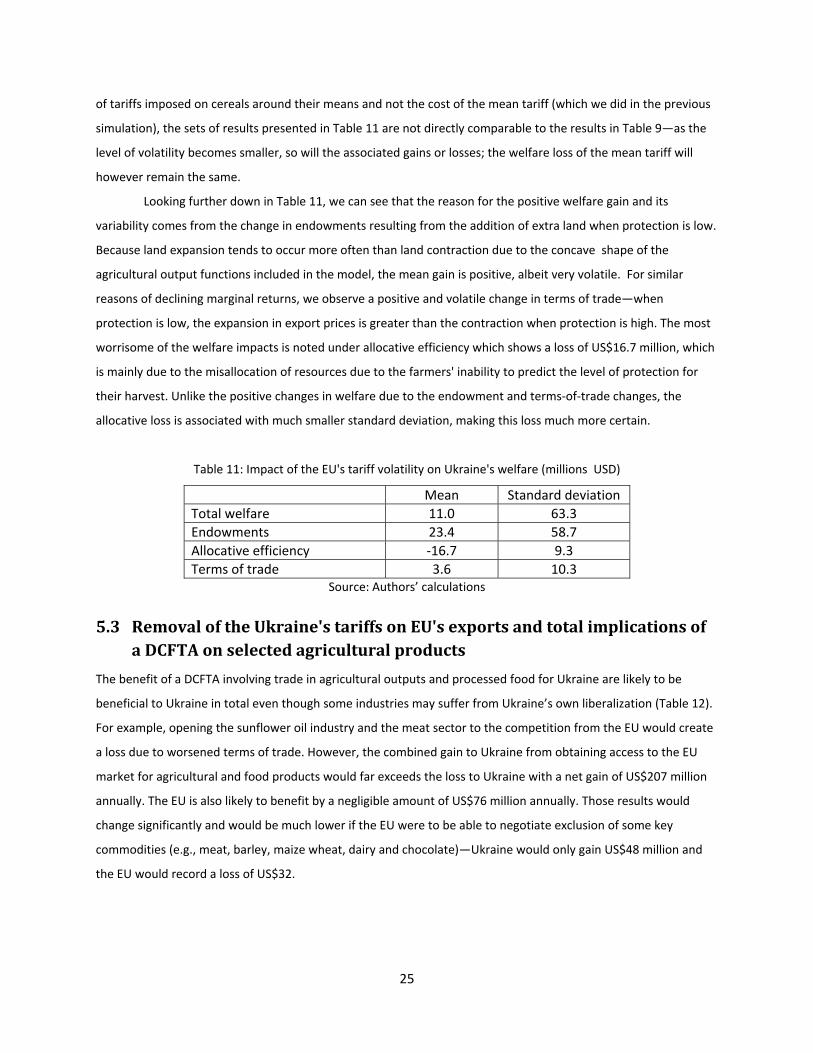
Looking further down in Table 11, we can see that the reason for the positive welfare gain and its
variability comes from the change in endowments resulting from the addition of extra land when protection is low.
Because land expansion tends to occur more often than land contraction due to the concave shape of the
agricultural output functions included in the model, the mean gain is positive, albeit very volatile. For similar
reasons of declining marginal returns, we observe a positive and volatile change in terms of trade—when
protection is low, the expansion in export prices is greater than the contraction when protection is high. The most
worrisome of the welfare impacts is noted under allocative efficiency which shows a loss of US$16.7 million, which
is mainly due to the misallocation of resources due to the farmers' inability to predict the level of protection for
their harvest. Unlike the positive changes in welfare due to the endowment and terms‐of‐trade changes, the
allocative loss is associated with much smaller standard deviation, making this loss much more certain.
Table 11: Impact of the EU's tariff volatility on Ukraine's welfare (millions USD)
Mean Standard deviation
Total welfare 11.0 63.3
Endowments 23.4 58.7
Allocative efficiency ‐16.7 9.3
Terms of trade 3.6 10.3 Source: Authors’ calculations
5.3 RemovaloftheUkraine'stariffsonEU'sexportsandtotalimplicationsofaDCFTAonselectedagriculturalproducts
The benefit of a DCFTA involving trade in agricultural outputs and processed food for Ukraine are likely to be
beneficial to Ukraine in total even though some industries may suffer from Ukraine’s own liberalization (Table 12).
For example, opening the sunflower oil industry and the meat sector to the competition from the EU would create
a loss due to worsened terms of trade. However, the combined gain to Ukraine from obtaining access to the EU
market for agricultural and food products would far exceeds the loss to Ukraine with a net gain of US$207 million
annually. The EU is also likely to benefit by a negligible amount of US$76 million annually. Those results would
change significantly and would be much lower if the EU were to be able to negotiate exclusion of some key
commodities (e.g., meat, barley, maize wheat, dairy and chocolate)—Ukraine would only gain US$48 million and
the EU would record a loss of US$32.

26
Table 12: Implications of an an FTA between Ukraine and the EU (welfare changes for Ukraine)
FTA FTA with exceptions
Total change in the EU's welfare 75.7 ‐32.1
Total change in Ukraine's welfare 206.7 47.8
—From the liberalization of access to the EU market 361.3 148.7
—From the liberalization of access to Ukraine's market ‐100.6 ‐101.8
—sunflower oil ‐48.5 ‐48.5
—sugar ‐16.2 ‐16.2
—other food ‐16.2 ‐16.2
—other meat ‐10.0 ‐10.0
Authors' calculations
6. Policyrecommendations
The current agriculture trade regime between Ukraine and the EU represents considerable economic costs to the
Ukrainian economy. These costs arise as a result of the high level and volatile protection of key cereal sectors.
Using a global computable model, we identify the level of the existing tariffs imposed on imports from Ukraine into
the EU as contributing most to Ukraine's welfare loss. If Ukraine were to secure free access of its agricultural and
food products to the EU—and assuming that Ukrainian exports are not constrained by SPS and other technical
requirements—Ukraine’s welfare would rise by US$362 million, which represents 0.6 percent of Ukraine's GDP
annually. We also find that while the volatility of tariffs is likely to increase the welfare of Ukraine by raising its
average land use, it is also likely to result in a loss of US$16.7 million annually due to allocation losses, reflecting
the farmers' inability to plan ahead and allocate the proper amount of inputs for production.
Finally, we find that establishing a free trade agreement between Ukraine and the EU would benefit
Ukraine despite inflicting a sizeable cost on some of Ukraine's key industries, such as sunflower oil processing and
meat processing. The expected net gain to Ukraine would be in the order of US$206.7 million on annual basis. Even
if the EU excluded some of the key agricultural commodities such as e.g. wheat, barley, maize from the agreement,
Ukraine would benefit from such an agreement, even though the gains would be significantly lower.
In the light of these findings, the government of Ukraine should seek the fullest possible liberalization of
its agricultural and food trade with the EU in its DCFTA negotiations. This would involve lowering tariffs to the
lowest extent possible for all agricultural products and achieving more stability and predictability in the EU
remaining tariff regime during the transition period. Additionally, it may be in the interest of Ukraine to then
maintain a preferential access to the EU's agricultural markets, as this would provide additional welfare gains to
the Ukrainian economy due to some trade diversion effect at the expense of third countries.

27
Bibliography
Arndt, Channing, and Ken Pearson. "Implementing Systematic Sensitivity Analysis Using GEMPACK."
GTAP Technical Paper, 2000.
Brenton, P., and J. Whalley. Evaluating a Ukraine‐EU Free Trade Agreement using a Numerical General
Equilibrium Trade Model. Report prepared for the European Commission as a part of the EES Project
UK26 Study on the Economic feasibility, General Ec, 1999.
CARIS, Mid‐term Evaluation of the EU’s Generalised System of Preferences: Final Report submitted by: Michael Gasiorek, CARIS, University of Sussex ,2010, http://trade.ec.europa.eu/doclib/docs/2010/may/tradoc_146196.pdf CEPS, IFW and ICPS. The prospect of deep free trade between the European Union and Ukraine. Centre
for European Policy Studies, Brussels; Institut fur Weltwirtschaft, Kiel and International Centre for Policy
Studies, Kiev, 2006.
Copenhagen Economics, IER and OEI. Analysis of the Economic Impacts of Ukraine’s Accession to the
WTO. Copenhagen Economics, Institute for Economic Research and Policy Consulting, Institute for East
European Studies Munich. Presented at World Bank on December, 2005, 2005.
Ecorys and CASE‐UkraineTrade Sustainability Impact Assessment of the FTA between the EU and Ukraine
within the Enhanced Agreement. DG Trade, EC, 2007.
FAO‐EBRD, Fighting food inflation through sustainable investment, March 2008. Francois, Joseph, F., and Will Martin. "Commercial policy variability, bindings, and market access."
European Economic Review 48, no. 3 (2004): 665‐679.
Hertel, Thomas. Global Trade Analysis: Modeling and Applications. New York: Cambridge University
Press, 1997.
OECD. "Agricultural Policies in Emerging Economies 2009: Monitoring and Evaluation." 2009.
Von Cramon‐Taubadel, Stephan, Sebastian Hess, and Bernhard Brummer. A Preliminary Analysis of the
Impact of a Ukraine‐EU Free Trade Agreement on Agriculture. World Bank Policy Research Working
Paper Series, 2010.

28
7. Appendix:ObservedmonthlyimportdutiesimposedonUkraine'sgrainintheEuropeanUnion
7.1 Wheat
Month Tariff €/t
Price €/t
Tariff rate percentage
points
Quantity t
Month Tariff€/t
Price €/t
Tariff rate percentage
points
Quantity t
Jan‐00 12.0 140.4 8.5 2,241.0 Jun‐05 10.8 108.9 9.9 155148.4
Feb‐00 12.0 138.1 8.7 4,003.0 Jul‐05 11.6 112.3 10.3 129959.9
Mar‐00 12.0 157.6 7.6 7,375.1 Aug‐05 10.5 110.3 9.5 206695.2
Nov‐00 12.0 210.3 5.7 5,255.7 Sep‐05 1.5 104.4 1.4 24295
Dec‐00 12.0 222.1 5.4 1,963.2 Oct‐05 11.4 103.5 11 260494.2
Jan‐01 12.0 210.1 5.7 6,457.7 Nov‐05 11.2 107.6 10.4 271354.6
Feb‐01 0.0 218.3 0 5,148.8 Dec‐05 0.0 104.6 0 14668.8
Mar‐01 12.0 194.6 6.2 10,735.8 Jan‐06 0.6 109.4 0.5 12776.3
Apr‐01 0.0 235.1 0 5,051.0 Feb‐06 8.0 110.7 7.2 84382.3
May‐01 12.0 237.8 5 4,388.5 Mar‐06 3.7 115.3 3.2 56265
Aug‐01 12.0 107.2 11.2 17,740.4 Apr‐06 9.2 115.8 7.9 57798.6
Sep‐01 11.3 110.5 10.2 152,737.5 May‐06 6.7 120.2 5.5 72610.4
Oct‐01 12.0 117.4 10.2 114,440.6 Jun‐06 8.8 110.2 8 35892.2
Nov‐01 20.8 113.2 18.4 528,128.2 Jul‐06 9.0 109.5 8.2 23622.6
Dec‐01 90.1 117.2 76.9 300,589.2 Aug‐06 12.0 119.8 10 105522.8
Jan‐02 12.0 118.0 10.2 437,077.8 Sep‐06 28.0 120.6 23.2 296025
Feb‐02 72.1 121.5 59.3 402,252.8 Oct‐06 10.0 136.6 7.3 38661.5
Mar‐02 63.4 127.9 49.5 178,653.0 Dec‐06 10.2 154.2 6.6 41214.2
Apr‐02 12.0 119.2 10.1 273,925.9 Jan‐07 12.0 185.7 6.5 7010.2
May‐02 27.3 122.2 22.3 186,840.5 Mar‐07 10.0 147.4 6.8 34977
Jun‐02 95.0 134.0 70.9 6,553.0 Apr‐07 8.6 151.7 5.7 21280.8
Jul‐02 12.0 105.8 11.3 31,585.4 May‐07 8.8 159.0 5.6 31520.9
Aug‐02 7.4 99.4 7.4 112,425.8 Jun‐07 12.0 159.9 7.5 88183.3
Sep‐02 71.4 99.7 71.7 758,834.3 Jul‐07 6.8 176.4 3.9 28961
Oct‐02 0.2 101.1 0.2 794,416.0 Mar‐08 0.0 221.8 0 1994.8
Nov‐02 0.0 105.9 0 530,698.1 Apr‐08 0.0 270.0 0 32547.9
Dec‐02 0.0 106.8 0 786,184.9 May‐08 0.0 246.4 0 19681.4
Jan‐03 0.0 119.6 0 60,169.3 Jun‐08 0.0 199.6 0 95441.6
Feb‐03 12.0 110.0 10.9 70,190.1 Jul‐08 0.0 210.4 0 156129.6
Mar‐03 12.0 157.0 7.6 38,422.0 Aug‐08 0.0 189.1 0 372474.5
Apr‐03 12.0 106.0 11.3 21,922.9 Sep‐08 0.0 177.2 0 503050.6
May‐03 10.7 124.3 8.6 7,071.3 Oct‐08 0.0 181.6 0 499155.3
Jul‐03 12.0 106.8 11.2 14,905.4 Nov‐08 0.0 173.7 0 349528.9
Nov‐03 12.0 117.4 10.2 2,791.8 Dec‐08 0.0 132.8 0 729073.1
Aug‐04 12.0 110.0 10.9 31,992.3
Sep‐04 11.3 105.9 10.6 180,092.0
Oct‐04 12.0 104.6 11.5 176,362.5
Nov‐04 11.5 104.8 11 126,089.9
Dec‐04 11.4 105.7 10.8 158,414.5
Jan‐05 9.9 99.4 10 147,321.5
Feb‐05 9.8 107.2 9.2 159,394.3
Mar‐05 11.4 109.3 10.5 124,352.3
Apr‐05 11.0 110.0 10 248,101.5
May‐05 12.0 108.5 11.1 181,810.0

29
7.2 Barley
Month Tariff €/t
Price €/t
Tariff rate percentage
points
Quantity t
Month Tariff€/t
Price €/t
Tariff rate percentage
points
Quantityt
Sep‐00 0.0 112.5 0.0 1,500.0 Oct‐07 16.0 360.0 4.4 1.5
Oct‐00 0.0 112.5 0.0 1,496.6 Feb‐08 0.0 450.0 0.0 1.0
Oct‐01 12.4 119.3 10.4 6,300.0 Mar‐08 0.0 238.7 0.0 25,596.9
Nov‐01 6.4 113.7 5.6 54,131.3 Apr‐08 0.0 238.9 0.0 19,629.2
Dec‐01 0.0 104.4 0.0 21,988.5 May‐08 0.0 232.8 0.0 6,561.1
Jan‐02 0.0 113.3 0.0 57,340.3 Jun‐08 0.0 210.9 0.0 24,263.6
Feb‐02 0.0 115.6 0.0 94,900.9 Jul‐08 0.0 206.7 0.0 38,990.6
Mar‐02 0.0 129.2 0.0 2,200.0 Aug‐08 0.0 199.0 0.0 59,997.1
Apr‐02 0.0 118.5 0.0 89,981.9 Sep‐08 0.0 196.9 0.0 27,556.9
Sep‐02 4.1 98.1 4.2 300.0 Oct‐08 0.0 213.2 0.0 9,821.9
Oct‐02 4.1 107.3 3.9 16,611.5 Nov‐08 0.0 251.5 0.0 936.8
Nov‐02 0.0 109.9 0.0 8,481.4 Dec‐08 0.0 136.1 0.0 964.8
Dec‐02 0.0 116.3 0.0 35,693.2
Jan‐03 16.0 134.3 11.9 20.1
Jun‐03 16.0 96.9 16.5 11,918.6
Jan‐04 16.0 132.1 12.1 7,908.0
Apr‐04 16.0 224.0 7.1 2.5
May‐04 16.0 137.6 11.6 14,185.6
Jun‐04 16.0 150.0 10.7 17,346.3
Aug‐04 16.0 92.0 17.4 28,891.7
Jan‐05 16.0 95.9 16.7 19,215.4
Feb‐05 16.0 122.0 13.1 24,884.0
Mar‐05 16.0 118.7 13.5 9,087.5
Apr‐05 16.0 114.7 13.9 9,707.1
May‐05 16.0 109.5 14.6 7,292.8
Aug‐05 16.0 136.4 11.7 4.4
Sep‐05 16.0 200.0 8.0 1.0
Oct‐05 16.0 292.0 5.5 2.5
Dec‐05 16.0 282.9 5.7 3.5
Jan‐06 16.0 127.0 12.6 575.2
Feb‐06 16.0 122.0 13.1 5,063.2
Apr‐06 16.0 273.3 5.9 3.0
Jul‐06 16.0 237.5 6.7 1.6
Aug‐06 16.0 107.3 14.9 2,914.8
Sep‐06 16.0 142.4 11.2 14,774.9
Oct‐06 16.0 147.0 10.9 9,595.1
Nov‐06 16.0 180.5 8.9 3,286.7
Jan‐07 16.0 244.8 6.5 2.9
Mar‐07 16.0 154.4 10.4 2,928.4
Apr‐07 16.0 166.9 9.6 4,137.3
May‐07 16.0 193.6 8.3 8,857.9
Jun‐07 16.0 203.2 7.9 2,827.0
Jul‐07 16.0 340.0 4.7 1.0
Sep‐07 16.0 260.6 6.1 2,704.5

30
7.3 Maize
Month Tariff €/t
Price €/t
Tariff rate percentage
points
Quantity t
Month Tariff€/t
Price €/t
Tariff rate percentage
points
Quantityt
Jan‐00 0.0 128.3 0.0 1,730.6 Mar‐08 0.0 217.1 0.0 166,795.3
Dec‐02 9.0 124.8 7.2 3,437.4 Apr‐08 0.0 217.0 0.0 185,259.4
Jan‐03 16.6 122.2 13.6 35,000.0 May‐08 0.0 203.2 0.0 210,320.1
Mar‐03 26.3 166.7 15.8 1,048.9 Jun‐08 0.0 203.2 0.0 233,200.1
Nov‐03 8.5 136.2 6.2 1,575.0 Jul‐08 0.0 203.2 0.0 153,846.1
Dec‐03 12.4 137.9 9.0 14,274.7 Aug‐08 0.0 212.8 0.0 72,370.4
Jan‐04 16.3 138.3 11.8 39,357.9 Sep‐08 0.0 230.1 0.0 52,549.6
Feb‐04 11.5 154.0 7.4 38,044.3 Oct‐08 0.0 209.8 0.0 4,429.5
Mar‐04 2.0 142.4 1.4 17,665.2 Nov‐08 0.0 153.8 0.0 5,073.0
Apr‐04 0.0 149.4 0.0 9,709.7 Dec‐08 0.0 126.2 0.0 76,344.5
May‐04 0.0 190.8 0.0 3,839.3
Jun‐04 10.0 127.3 7.9 2,767.8
Aug‐04 34.0 104.8 32.5 4,003.8
Sep‐04 28.7 111.5 25.8 7,963.4
Oct‐04 26.1 109.9 23.7 2,954.3
Jan‐05 31.5 82.5 38.2 40.0
Feb‐05 32.2 105.8 30.5 36,792.0
Mar‐05 32.6 102.5 31.8 24,016.4
Apr‐05 27.6 93.6 29.5 112,062.7
May‐05 32.7 97.8 33.4 57,909.3
Jun‐05 34.3 104.6 32.8 11,419.7
Jul‐05 32.5 106.5 30.5 71,934.5
Aug‐05 37.6 104.1 36.1 15,678.7
Oct‐05 31.3 116.4 26.9 824.3
Dec‐05 32.2 102.5 31.4 9,000.1
Jan‐06 29.4 96.1 30.5 152,439.6
Feb‐06 35.7 72.2 49.4 13,790.1
Mar‐06 28.5 101.6 28.1 204,744.9
Apr‐06 31.3 124.4 25.2 1,620.3
Jul‐06 17.9 106.7 16.8 4,587.3
Aug‐06 26.3 118.6 22.1 819.2
Oct‐06 4.9 120.2 4.1 24.3
Nov‐06 0.0 105.6 0.0 113.4
Feb‐07 0.0 153.0 0.0 2,957.8
Mar‐07 0.0 146.8 0.0 1,797.7
Apr‐07 0.0 172.2 0.0 10,864.2
May‐07 0.0 159.3 0.0 22,065.8
Jun‐07 0.0 155.9 0.0 8,980.9
Jul‐07 0.0 182.2 0.0 23,936.5
Aug‐07 0.0 174.2 0.0 7,671.3
Sep‐07 0.0 195.2 0.0 210.0
Oct‐07 0.0 206.1 0.0 3,083.2
Nov‐07 0.0 178.3 0.0 205.8
Feb‐08 0.0 223.6 0.0 16,835.6

31
8. Appendix:EstimationofArmingtonelasticities
In the estimation, we assume that bilateral imports , of commodity from source are imperfect substitutes
driven by a CES function so that
Equation 1 , ,,
,
where is the total quantity of imported with price index and , is a parameter with the restriction
∑ , 1 . Combining Equation 1 for two sources and , we obtain an equation (in logs) that may be estimated:
Equation 2 , , , ,
To properly estimate Equation 2, we must take into account the nature of errors in our observations of
import prices and quantities. We assume that trade quantities are observed with a random error . Since trade
data only provide us with trade values and quantities from which unit prices are calculated, the error in the
observation of import prices is a composite of the error in the observation of trade value and the negative of
the error in the observation of the quantity . The equation that we estimate is therefore:
Equation 3 , , , , , , , , , ,
where we assume that all errors in observations and the error in specification are independently distributed.