impact fee facilities plan - springville.org · an important element of the iffp is the...
TRANSCRIPT
Impact Fee Facilities Plan
2016

i
TABLE OF CONTENTS Introduction ............................................................................................................................................... 1
Existing Level of Service (11-36a-302.1.a.i) .............................................................................................. 1
Intersection Standards .......................................................................................................................... 2
Trips ....................................................................................................................................................... 2
System Improvements and Project Improvements .............................................................................. 3
Proposed Level of Service (11-36a-302.1.a.ii) .......................................................................................... 3
Existing Capacity to Accommodate Future Growth (11-36a-302.1.a.iii) .................................................. 4
Demands Placed on Facilities by New Development (11-36a-302.1.a.iv) ................................................ 4
Existing Roadway Network Conditions ................................................................................................. 4
Future Roadway Network Conditions ................................................................................................... 9
10-Year Improvement Plan ................................................................................................................. 11
Infrastructure Required to Meet Demands of New Development (11-36a-302.1.a.v) .......................... 11
Project Cost Attributable to Future Growth ....................................................................................... 11
Project Cost Attributable to 10-Year Growth ..................................................................................... 15
Proposed Means to Meet Demands of New Development (11-36a-302.2) ........................................... 18
Federal Funding .................................................................................................................................. 18
State/County Funding ......................................................................................................................... 19
City Funding ........................................................................................................................................ 19
Interfund Loans ................................................................................................................................... 20
Developer Dedications and Exactions ................................................................................................. 20
Developer Impact Fees ....................................................................................................................... 20
Necessity of Improvements to Maintain Level of Service ...................................................................... 20
Impact Fee Certification (11-36a-306) .................................................................................................... 21
Appendix A – Cost Estimates ................................................................................................................... 22
ii
IMPACT FEE FACILITIES PLAN
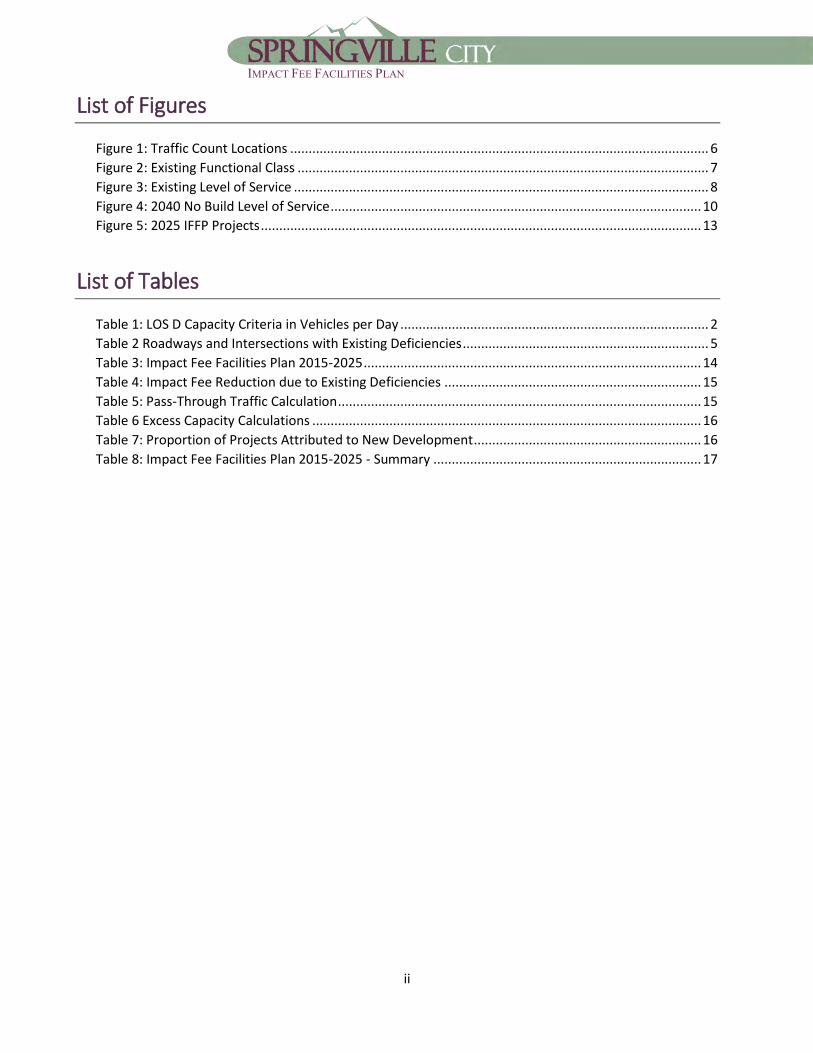
List of Figures
Figure 1: Traffic Count Locations .................................................................................................................. 6
Figure 2: Existing Functional Class ................................................................................................................ 7
Figure 3: Existing Level of Service ................................................................................................................. 8
Figure 4: 2040 No Build Level of Service ..................................................................................................... 10
Figure 5: 2025 IFFP Projects ........................................................................................................................ 13
List of Tables
Table 1: LOS D Capacity Criteria in Vehicles per Day .................................................................................... 2
Table 2 Roadways and Intersections with Existing Deficiencies ................................................................... 5
Table 3: Impact Fee Facilities Plan 2015-2025 ............................................................................................ 14
Table 4: Impact Fee Reduction due to Existing Deficiencies ...................................................................... 15
Table 5: Pass-Through Traffic Calculation ................................................................................................... 15
Table 6 Excess Capacity Calculations .......................................................................................................... 16
Table 7: Proportion of Projects Attributed to New Development .............................................................. 16
Table 8: Impact Fee Facilities Plan 2015-2025 - Summary ......................................................................... 17

1
IMPACT FEE FACILITIES PLAN Introduction
The purpose of an Impact Fee Facilities Plan (IFFP) is to identify public facilities that are needed to
accommodate development and to determine which projects may be funded with impact fees. Utah law
requires communities to prepare an IFFP prior to preparing an impact fee analysis and establishing an
impact fee. According to Title 11, Chapter 35a-302 of the Utah Code, the IFFP is required to identify the
following:
The existing level of service (LOS)
A proposed LOS Any excess capacity to accommodate future growth beyond the IFFP horizon year at
the proposed LOS
The demands placed on existing public facilities by new development
A proposed means by which the local political subdivision will meet those demands
A general consideration of all potential revenue sources to finance the impacts on system improvements
This analysis incorporates the information provided in the 2016 Springville Transportation Master Plan
(TMP) regarding the upcoming demands on the existing infrastructure facilities that will require
improvements to accommodate future growth and provide an acceptable LOS. The TMP provides
additional detail regarding the methodology used to determine the future travel demand.
This document focuses on the improvements that are projected to be needed over the next ten years.
Utah law requires that any impact fees collected for those improvements be spent within six years of
being collected. Only capital improvements are included in this plan; all other maintenance and operation
costs are assumed to be covered through the City’s General Fund as tax revenues increase as a result of
additional development.
Existing Level of Service (11-36a-302.1.a.i)
According to the Impact Fee Act, level of service is defined as “the defined performance standard or unit
of demand for each capital component of a public facility within a service area.” The LOS of a roadway
segment or intersection is used to determine if capacity improvements are necessary. LOS is measured
on a roadway segment using its daily traffic volume and at an intersection based on the average delay per
vehicle. A standard of LOS D is a generally accepted LOS standard for urban areas and is used as the
standard for Springville City. This allows for speeds at or near free-flow speeds, but with some congestion
during the peak times of the day. At intersections, LOS D means that vehicles should not have to wait
more than one cycle to proceed through the intersection and experience delays less than 35 seconds,

2
IMPACT FEE FACILITIES PLAN
according to the Highway Capacity Manual 2010. Table 1 below summarizes the maximum capacities for
roadway segments used by the City of Springville.
Table 1: LOS D Capacity Criteria in Vehicles per Day
Lanes Arterial Collector
2 NA 5,000
3 NA 11,500
5 30,500 NA
7 46,000 NA
Intersection Standards
The performance of intersections has a large effect on the level of service of the roadway network.
Intersections have different stop controls such as: no control, stop control, signal, roundabout, or yield.
The level of service for each type of intersection is calculated depending on its control type. Intersection
improvements will be necessary in order to maintain the desired level of service. One method to reduce
costs is to coordinate the placement of signal wiring, foundations, and other features, with roadway
construction before the placement of the actual traffic signals and other elements are needed. The costs
of these intersection improvements have been included in the roadway network cost estimates in Table
3. The total costs for the full installation of these intersection improvements may be postponed depending
on the specific needs of the intersections in the future.
Trips
The unit of demand for transportation impact is the PM peak hour trip. A PM peak hour trip is defined by
the Institute of Transportation Engineers (ITE) as a single or one-directional vehicle movement to or from
a site between the hours of 4 PM and 6 PM. The total traffic impact of a new development can be
determined by the sum of the total number of trips generated by a development during the PM peak
hour. This trip generation number or impact can be estimated for an individual development using the
ITE Trip Generation Manual (currently 9th edition). This publication uses national data studied over
decades to assist traffic engineering professionals to determine the likely impact of new development on
transportation infrastructure.
There is a minor discrepancy in the way ITE calculates trips and the way trips or roadway volumes are
calculated in the travel demand model used in the Springville TMP. This discrepancy is explained by the
model roadway volumes and capacities being calculated using daily traffic volumes rather than trips on
the roadway. Essentially, this means that a travel demand model “trip” or unit of volume is counted once
as a vehicles leaves home, travels on the road network, and then arrives at work. This vehicles will only
be counted as it travels on the roadway network. The ITE Trip Generation method uses driveway counts
as its measure of a trip. Therefore, a vehicle making the same journey will be counted once as it leaves
home and once again as it arrives at work for a total of two trips. This can be rectified simply by adjusting
the ITE Trip Generation rates by one half, this calculation will be evident in the IFA.
An additional consideration is that certain developments do not generate primary trips or trips that
originated for the sole purpose of visiting that development. An example of a primary trip is a home based
work trip where someone leaves their house with the express purpose of going to work. This primary trip
has been generated by a combination of the home the trip originated in and the place of occupation where

3
IMPACT FEE FACILITIES PLAN
the trip is terminated. Thus, it is easily understood that the impact of this trip should be attributed to the
housing development and workplace development since without either of these locations, the trip doesn’t
happen. Some trips are not primary trips, they are defined as pass-by trips. This means that the trip
(crossing the driveway of a development) was generated by a driver deciding to make a stop on their way
to their primary destination. Good examples of pass-by trips are someone that stops at the gas station
on their way to work (a gas station is a pass-by trip) or a driver that is enticed to stop at a fast food
restaurant as they drive by because the “HOT DONUTS” sign is illuminated (the fast food restaurant is a
pass-by trip). Pass-by trips do not add traffic to the roadway and, therefore, do not create additional
impact. Each land use type in the ITE Trip Generation Manual has a suggested reduction for pass-by trips
where applicable. In each case, the trip reduction rate will be applied to the trip generation rate used in
this IFA.
System Improvements and Project Improvements
As described in the TMP, there are four primary classifications of roads, which include local streets,
collectors, arterials, and freeways/expressways. The City of Springville classifies street facilities based on
the relative amounts of through and land-access service they provide. Local streets primarily serve land-
access functions, while freeways and expressways are primarily meant for mobility. Each classification
may have a variable amount of lanes, which is a function of the expected traffic volume and serves as the
greatest measure of roadway capacity.
Improvements to collectors and arterials are considered “system improvements” according to the Utah
Impact Fee Law, as these streets serve users from multiple developments. System improvements may
include anything within the roadway, such as curb and gutter, asphalt, road base, lighting, and signing for
collectors and arterials. These projects are eligible to be funded with impact fees and are included in this
IFFP.
Proposed Level of Service (11-36a-302.1.a.ii)
The proposed level of service provides a standard of evaluation for future roadway conditions. This
standard will determine whether or not a roadway will need improvements. According to the Utah Impact
Fee Law, the proposed level of service may:
1. Diminish or equal the existing level of service 2. Exceed the existing level of service if, independent of the use of impact fees, the political
subdivision or private entity provides, implements, and maintains the means to increase the existing level of service for existing demand within six years of the date on which new growth is charged for the proposed level of service; or
3. Establish a new public facility if, independent of the use of impact fees, the political subdivision or private entity provides, implements, and maintains the means to increase the existing level of service for existing demand within six years of the date on which new growth is charged for the proposed level of service.
This IFFP will not make any changes to the existing level of service, and LOS D will be the standard by
which the impacts of future growth will be evaluated.

4
IMPACT FEE FACILITIES PLAN
Existing Capacity to Accommodate Future Growth (11-36a-
302.1.a.iii)
An important element of the IFFP is the determination of excess capacity on the roadway network. Excess
capacity is defined as the amount of available capacity on any given street in the roadway network under
existing conditions. This capacity is available for new development in the city before additional
infrastructure will be needed. This represents a buy-in component from the City as the existing
residents/property owners have already paid for these improvements. New roads do not have any excess
capacity and roads which are not under City jurisdiction have their capacity information removed from
the calculations.
Demands Placed on Facilities by New Development (11-36a-
302.1.a.iv)
To meet the requirements of the Utah Impact Fee law, to “identify demands placed upon existing public
facilities by new development activity at the proposed level of service” and to “identify the means by
which the political subdivision or private entity will meet those growth demands”, the following steps
were completed and are explained in further detail in the following sections:
1. Existing Demand- The traffic demand at the present time was estimated using traffic counts and population data.
2. Existing Capacity- The capacity of the current roadway network was estimated using the calculated LOS.
3. Existing Deficiencies- The deficiencies in the current network were identified by comparing the LOS of the roadways to the LOS standard.
4. Future Demand- The future demand on the network was estimated using development projections.
5. Future Deficiencies- The deficiencies in the future network were identified by comparing the calculated future LOS with the LOS standard.
6. Recommended Improvements- Recommendations were made that will help meet future demands.
Existing Roadway Network Conditions
Conversions of Growth and Development Projections to Trip Generations The basis of the future travel demand was projected using the Mountainland Association of Governments
(MAG) Travel Demand Model. The inputs to the model consist of socio-economic and land use data
provided by MAG and the City. The outputs from the model include peak hour trips and daily traffic
volumes on each of the roadways in the network. The MAG Travel Demand Model was calibrated to
existing traffic conditions in the City of Springville. Traffic counts for state roads were collected from UDOT
and include annual average daily traffic (AADT) volumes as defined in Traffic on Utah Highways. On City
owned roadways, traffic counts were either provided by the City of Springville or were manually counted
as part of the TMP. Figure 1 shows the count locations throughout the City used for model calibration.

5
IMPACT FEE FACILITIES PLAN
Existing Functional Classification and Level of Service The existing functional classification used in the MAG Travel Demand Model is shown in Figure 2. The LOS
was calculated for each roadway according to the guidelines explained in the Level of Service section and
a LOS map is included in Figure 3
Using LOS D as the threshold for roadway improvements in Figure 3 (Indicated by red lines), the following
shows the roadways that have existing capacity deficiencies:
Roadway Elements at or below LOS E:
400 South (Main Street to Brookside Drive)
400 South & Main Street (Traffic Signal)
In most cases, roadway capacity improvements are achieved by adding travel lanes. In some cases
additional capacity can be gained by striping additional lanes where the existing pavement width will
accommodate it. This can be accomplished by eliminating on street parking, creating narrower travel
lanes, and adding two-way left turn lanes where they don’t currently exist. For all roadway capacity
improvements, it is recommended to investigate other mitigation methods before widening the roadway.
Impact Fees cannot be used to mitigate existing deficiencies. As such, the projects listed in Table 2 are
the projects included in the IFFP, but the impact fee eligible portion collected may be reduced to mitigate
the existing deficiency.
Table 2 Roadways and Intersections with Existing Deficiencies
Project # Location Existing Capacity
Existing Volume
10 400 South – Main Street to 400 E. 11,500 15,600
24 400 South & Main Street Traffic Signal LOS E or Worse

2162 West Grove ParkwaySuite 400Pleasant Grove, UT 84062(801) 763-5100
DATE
DRAWN
900
100200
4097
5900
5000
62008300
6700
8100
556651005500
3900
3300
4400
6200
7500
1400
1400
6500
1900
8400
2600
1556
24100
15000
10800
25200
26600
28500
30500
13600
15600
28100 25400 15600
10000
14700
10/29/2015Springville Transportation Master Plan
O:\!2
01
4\P
G-1
03-1
40
9 S
pri
ng
vill
e T
MP
CIP
IF
FP
IF
A\P
roje
ct D
ata
\GIS
\Ho
rro
cks\M
xd
\01
_T
raffic
Cou
nts
.mxd
, 10
/29
/20
15 3
:09
:32
PM
, kevin
c
Figure 1
KJCTraffic Count Locations
LegendCounts
XYHorrocks
XYUDOT
CityBoundary
400 South
1400 North
Canyon Road
1750
Wes
t
950 W
est
Slant
Road
Main
Stre
et
Numbers Shown are Average Daily Traffic (24 Hours)
0.5 0 0.5
Miles
E

2162 West Grove ParkwaySuite 400Pleasant Grove, UT 84062(801) 763-5100
DATE
DRAWN
9/29/2016Springville Transportation Master Plan
O:\!2
01
4\P
G-1
03-1
40
9 S
pri
ng
vill
e T
MP
CIP
IF
FP
IF
A\P
roje
ct D
ata
\GIS
\Ho
rro
cks\M
xd
\04
_E
xis
tin
g_
Roa
ds.m
xd,
9/2
9/2
016
9:4
7:1
9 A
M,
ke
vin
c
Figure 2KJC
Existing Functional Class
400 South
1400 North
950 W
est
Canyon Road
1750
Wes
t
Slant
Road
Main
Stre
et
LegendIntersections
))!!!!!!
Signalized Intersection
>?@ Interchange
Roundabout
¹º»¼ Existing, RR Crossing
Existing Roadway NetworkPrincipal Arterial
Major Arterial
Minor Collector
Commercial Local
Interstate
CityBoundary
0.5 0 0.5
Miles
E

2162 West Grove ParkwaySuite 400Pleasant Grove, UT 84062(801) 763-5100
DATE
DRAWN
3,200 4,200
4,400
10,000
24,100
14,700
8,4006,600
4,100
25,400
8,700
3,000
4,000
3,800
12,900
9,600
28,100 10,900
31,80
0
6,400
6,700
8,300
15,60
0
30,50
0
8,1005,1005,500
22,300
3,900
5,900
26,60
028
,500
13,600
6,200 15,000
5,600
6,500
14,100
3,300
5,700
< 3,000
5,000
< 3,00
0
< 3,0003,0
00 5,000
3,300
< 3,000
< 3,00
0
8,700
4,200
14,100
< 3,000
< 3,000
3,300
< 3,000
< 3,000
< 3,000
< 3,00
0
< 3,00
0
24,100
< 3,000
< 3,00
0
15,600
< 3,000
< 3,00
0
5,900
< 3,00
0
< 3,00
0
< 3,00
0
3,300
3,200
3,300
< 3,00
0
< 3,00
0
< 3,000
< 3,00
0
5,600
< 3,00
0
< 3,000
< 3,000
< 3,00
0
< 3,00
0
< 3,000
9/29/2016Springville Transportation Master Plan
O:\!2
01
4\P
G-1
03-1
40
9 S
pri
ng
vill
e T
MP
CIP
IF
FP
IF
A\P
roje
ct D
ata
\GIS
\Ho
rro
cks\M
xd
\05
_E
xis
tin
g_
LO
S.m
xd
, 9
/29
/20
16 9
:49
:07
AM
, kevin
c
Figure 3KJC
Existing Level of Service
400 South
1600 South
1400 North
950 W
est
Canyon Road
1750
Wes
t
State
Road 5
1
Main
Stre
et
Legend))!!!!
!!
Signalized Intersection))!!!!
!!
Unacceptable Signalized Intersection
>?@ Interchange
Acceptable (LOS C or Better)
Acceptable (LOS D)
Unacceptable (LOS E or F)
CityBoundary
Numbers Shown are Average Daily Traffic (24 Hours)
0.5 0 0.5
Miles
E

9
IMPACT FEE FACILITIES PLAN
Future Roadway Network Conditions
By calibrating the MAG Travel Demand Model to the existing traffic conditions in the City of Springville,
the model is prepared to project traffic volumes into the future. Two modeling scenarios were analyzed.
The first identified potential capacity deficiencies by projecting traffic conditions assuming no roadway
improvements are made (no-build condition). The second scenario includes proposed projects that will
mitigate the deficiencies identified in scenario one.
No Build Level of Service A no-build scenario is intended to show what the roadway network would be like in the future if no action
is taken to improve the City roadway network. The travel demand model was again used to predict this
condition by applying the future growth and travel demand to the existing roadway network. As shown
in Figure 4, the following roadway elements will perform at LOS E or worse if no action is taken to improve
the roadway network:
1400 North (I-15 to 1100 West)
1200 West (Northern Border to Spring Creek Road)
Main Street (1400 North to 700 South)
950 West (550 North to Center Street)
400 South (2600 West to I-15 & 1750 West to 800 East)
1600 South (1750 West to Wallace Drive)
State Street (SR-51) (1600 South to 5400 South)
1400 North (SR-75) & 1750 West (Traffic Signal)
1400 North (SR-75) & 1100 West (Traffic Signal)
Center Street & 400 East (Stop Controlled Intersection)
400 South & 2600 West (Stop Controlled Intersection)
400 South & 950 West (Traffic Signal)
400 South & Main Street (Traffic Signal)
400 South & 400 East (Traffic Signal)
1600 South & State Street (Stop Controlled Intersection)
State Street & Evergreen Drive (Stop Controlled Intersection)
Canyon Road & 620 South (Stop Controlled Intersection)
900 South & 1300 East (Stop Controlled Intersection)
900 South & 800 East (Stop Controlled Intersection)

2162 West Grove ParkwaySuite 400Pleasant Grove, UT 84062(801) 763-5100
DATE
DRAWN
6,200 4,500
12,80
0
7,100
14,700
6,900
< 3,000
12,500
44,300
8,20010,500
18,20
05,000
21,400
4,700
6,10038,000
4,000
18,300
6,700
3,500
10,00
0
5,900
31,700
4,600
6,000
15,000
3,400
14,90
0
11,100
3,300
37,80
0
5,200
3,000
7,600
21,00
0
39,40
0
7,000
7,800
5,700
10,400
39,600 11,00
0
5,500
8,000
17,20028,60
028
,500
12,100
22,90
0
13,200
16,800
3,100
5,100
17,000
3,800
7,300
12,000 9,600
4,800
37,700
1,400
17,50
0
4,300
38,40
0
6,500
3,000
8,200
< 3,00
0
< 3,00
0
7,100
4,500
3,400
< 3,000
6,200
< 3,000< 3
,000
< 3,000
12,800
10,50
0
< 3,00
0
5,900
< 3,00
0
9/29/2016Springville Transportation Master Plan
O:\!2
01
4\P
G-1
03-1
40
9 S
pri
ng
ville
TM
P C
IP I
FF
P IF
A\P
roje
ct D
ata
\GIS
\Ho
rrocks\M
xd
\07
_2
040
_N
B_
LO
S.m
xd
, 9/2
9/2
01
6 3
:50
:46
PM
, ke
vin
w
Figure 4KJC
2040 No Build Level of Service
Legend!( Unacceptable Intersection
Acceptable (LOS C or Better)
Acceptable (LOS D)
Unacceptable (LOS E or F)
CityBoundary
0.5 0 0.5
Miles
E

11
IMPACT FEE FACILITIES PLAN
10-Year Improvement Plan
Although projects will be completed as growth and development occurs throughout the City, the existing
and no build scenarios are used as a basis to predict the necessary projects to include in the IFFP. For the
purposes of this IFFP, only projects that will be completed within the next ten years will be considered.
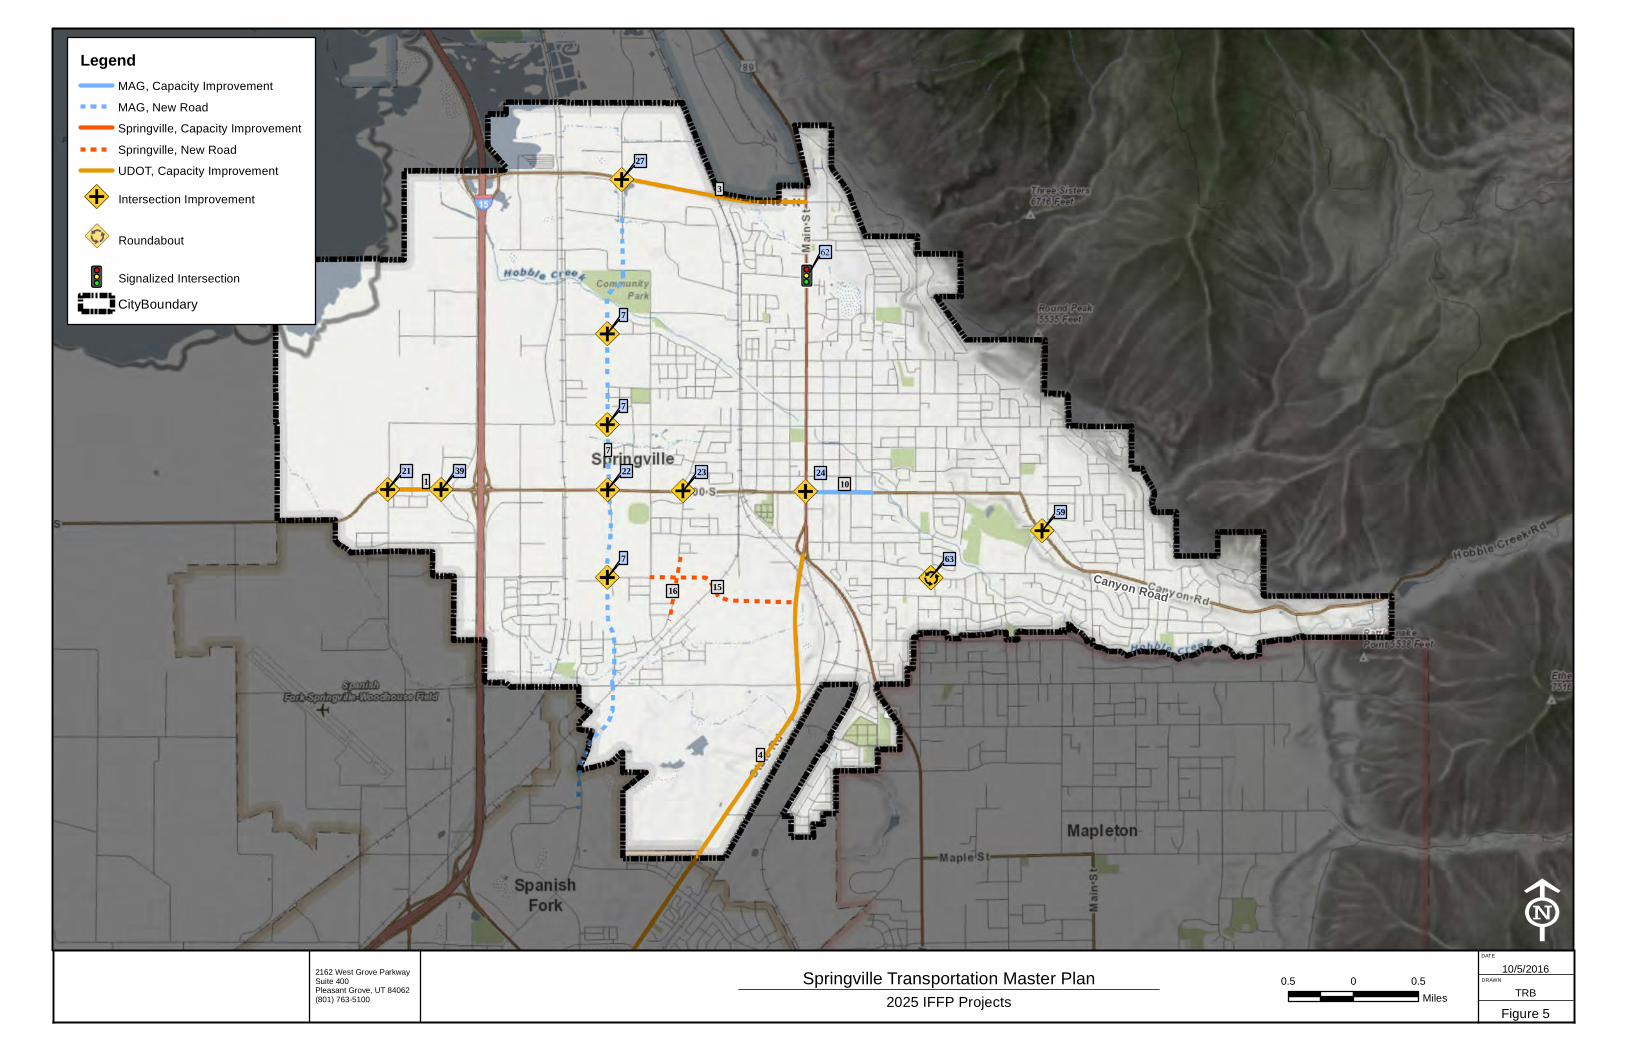
Table 3 shows the projects that are forecasted to be needed in the next ten years. Table 3 includes all of
the projects regardless of their eligibility for impact fee expenditure. The portion of the project that is
impact fee eligible is indicated in the Impact Fee Eligible and Springville Total columns. Figure 5 shows
the projects needed between now and 2025 to meet the demands placed on the roadway network by
new development.
Infrastructure Required to Meet Demands of New Development
(11-36a-302.1.a.v)
Project Cost Attributable to Future Growth
Table 3 shows the project costs attributable to new growth as a percentage of the total project costs, as
defined in the previous section. Each project in Table 3 would be needed due to future growth but the
cost that should be shared by new development through the assessment of impact fees varies depending
on the road jurisdiction, the funding available, and the roadway classification. There are roadways in
Springville included in MAG’s transportation Improvement Program (TIP). For those projects, a 6.77%
match is required to receive funding assistance. If Springville receives funding assistance, only the 6.77%
match is impact fee eligible. UDOT projects will be funded entirely with state funds and are therefore not
eligible for impact fee expenditure. Road widening projects are considered 100% impact fee eligible, as
any work on these roads will only be needed as traffic increases as a result of new development. New
city-owned roads are variable depending on the road classification. The cost attributable to new growth
and potentially impact fee eligible is defined as the portion of the roadway cross section in excess of the
minimum standards for both a local and commercial local street (the determination of local versus
commercial local is based on the Land Use Plan). This is based on the premise that a local or commercial
local cross section serves the needs of the localized development which directly access the new road. This
portion will be paid for by the individual development, which accesses the new road. Any improvement
due to growth that requires a cross section beyond a local street would be considered a system
improvement and is therefore impact fee eligible. The City responsibility cost for each new road is
determined as the percentage of the total project cost beyond a local street classification. For example,
a Minor Collector Street is 15% and 6% more costly than a local street and commercial local street
respectively so the City responsible (impact fee eligible) portion of a new Minor Collector is 15% or 6%
based on the Land Use plan. Detailed cost estimates can be found in Appendix A – Cost Estimates.
There are additional costs included in each cost estimate based on a percentage of the construction costs.
The four additional costs are contingency, mobilization, preconstruction engineering, and construction
engineering. The percentages used for the additional costs may vary as these values are estimated for
each individual project. These estimates are based on the concept cost estimate values used by UDOT.
Contingency accounts for the items not estimated during the concept cost estimate. Examples include
utility placement and surveying. Contingency costs can range up to 15% based on the number of items
not estimated. Mobilization is the preparation made by the contractor before construction begins on a
12
IMPACT FEE FACILITIES PLAN
project. Springville will use the UDOT recommended mobilization value for local projects at 10% of the
construction cost. Preconstruction engineering is based on the complexity of the project as well as the
construction costs. For local projects the preconstruction costs can range up to 16% of the construction
costs based on UDOT cost estimating. For the cost estimates included in this IFFP, a value of 8% was used.
Construction engineering includes the construction management and additional design necessary during
construction. Recommended costs for local projects are up to 16% and a value of 8% was used for the
cost estimates included in the IFFP.
7
4
3
15
1 10
16
7
7
7
63
59
39 23 242221
27
10/5/2016Springville Transportation Master Plan
Figure 5
TRB2025 IFFP Projects
Canyon Road
LegendMAG, Capacity Improvement
MAG, New Road
Springville, Capacity Improvement
Springville, New Road
UDOT, Capacity Improvement
89:D Intersection Improvement
Roundabout
))!!!!!!
Signalized Intersection
CityBoundary
0.5 0 0.5
Miles
E
62
DATE
DRAWN
2162 West Grove ParkwaySuite 400Pleasant Grove, UT 84062(801) 763-5100

14
IMPACT FEE FACILITIES PLAN
Table 3: Impact Fee Facilities Plan 2015-2025
Project Location Total Price Funding Source Impact Fee
Eligible Springville City Total
1 400 South Widening: I-15 to Spanish Fork Main Street
$3,095,000 UDOT 0% $0
3 1400 North Widening: I-15 to Main Street $29,783,000 UDOT 0% $0
4 SR-51 Widening: Main Street to Southern Border
$16,861,000 UDOT 0% $0
7 1200 West: 1400 North to Southern Border $40,035,000 Springville/MAG 6.77% $2,711,000
10 400 South Widening: Main Street to 400 East $2,768,000 Springville/MAG 6.77% $188,000
15 900 South Extension to SR-51 $5,188,000 Springville 16% $855,000
16 Connection of Mattea Lane & 750 West $2,097,000 Springville 16% $346,000
21 Intersection Improvement: 400 South & 2060 West
$254,000 UDOT 0% $0
22 Intersection Improvement: 400 South & 1200 West
$254,000 UDOT 0% $0
23 Intersection Improvement: 400 South & Wood Springs Dr.
$254,000 UDOT 0% $0
24 Intersection Improvement: 400 South & Main Street
$254,000 UDOT 0% $0
27 Intersection Improvement: 1400 North & 1200 West
$254,000 UDOT 0% $0
39 Intersection Improvement: West of 400 South Interchange
$254,000 UDOT 0% $0
59 Roundabout: Canyon Road and 620 South $705,000 Springville 100% $705,000
62 Traffic Signal: Main Street & 900 North $254,000 UDOT 0% $0
63 Roundabout: 900 South and 800 East $705,000 Springville 100% $705,000
Total $103,015,000 $5,510,000
15
IMPACT FEE FACILITIES PLAN
Project Cost Attributable to 10-Year Growth
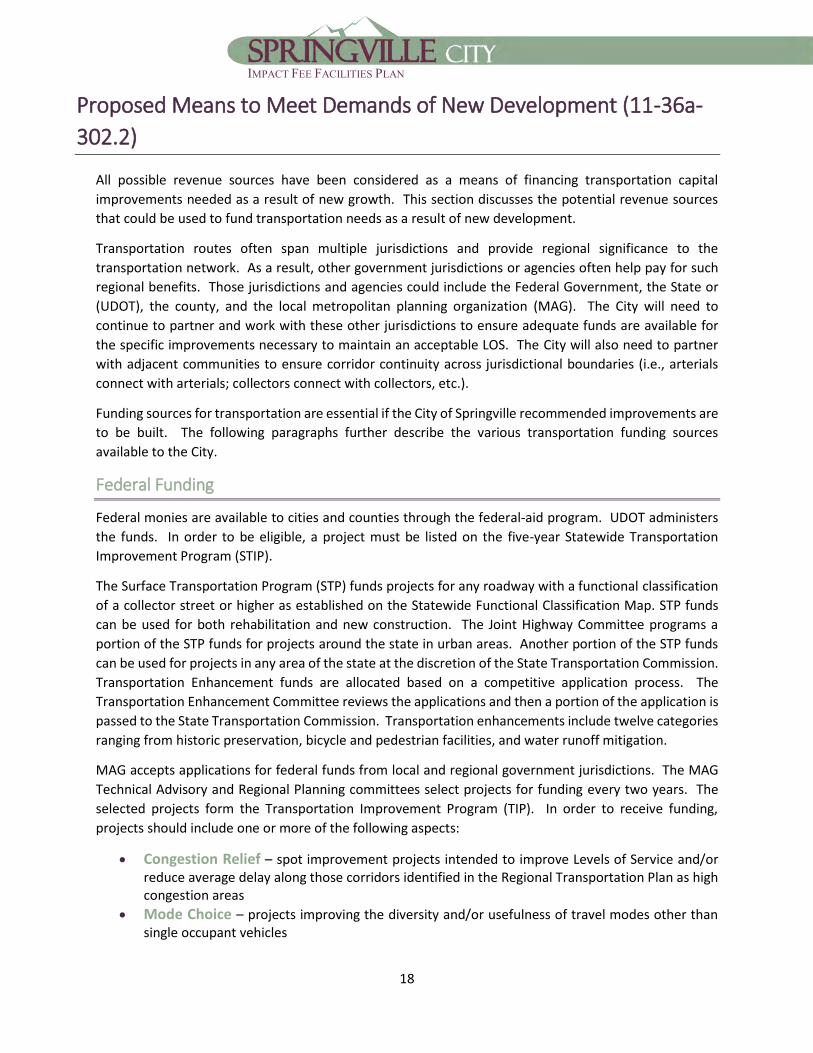
Using the travel demand model mentioned in previous chapters, it is possible to estimate the number of
PM trips originating or terminating in Springville for the existing and future conditions. The difference
between the future PM trips and the existing PM trips (the number of new trips in the City) becomes the
denominator in the equation used to calculate the impact fee cost per PM peak hour trip for new
development. The City of Springville currently generates approximately 11,396 one-way PM peak hour
trips. In 2040, this number is expected to increase to 20,394, an increase of 79%. The projected 2025 PM
peak hour trip number for the City of Springville is 14,927, a 31% increase on today’s value.
Table 4 includes the calculations to determine the reduction in the impact fee for existing roadways due
to existing deficiencies. The reduction is based on the percentage of the added capacity already filled by
the existing traffic volume. This proportion of the existing over capacity volume of the added capacity
cannot be funded using Impact Fees.
Table 4: Impact Fee Reduction due to Existing Deficiencies
Project Location Added
Capacity
Volume Over Existing Capacity
Impact Fee Reduction%
10 400 South Widening: Main Street to 400 East
19,000 4,100 22%
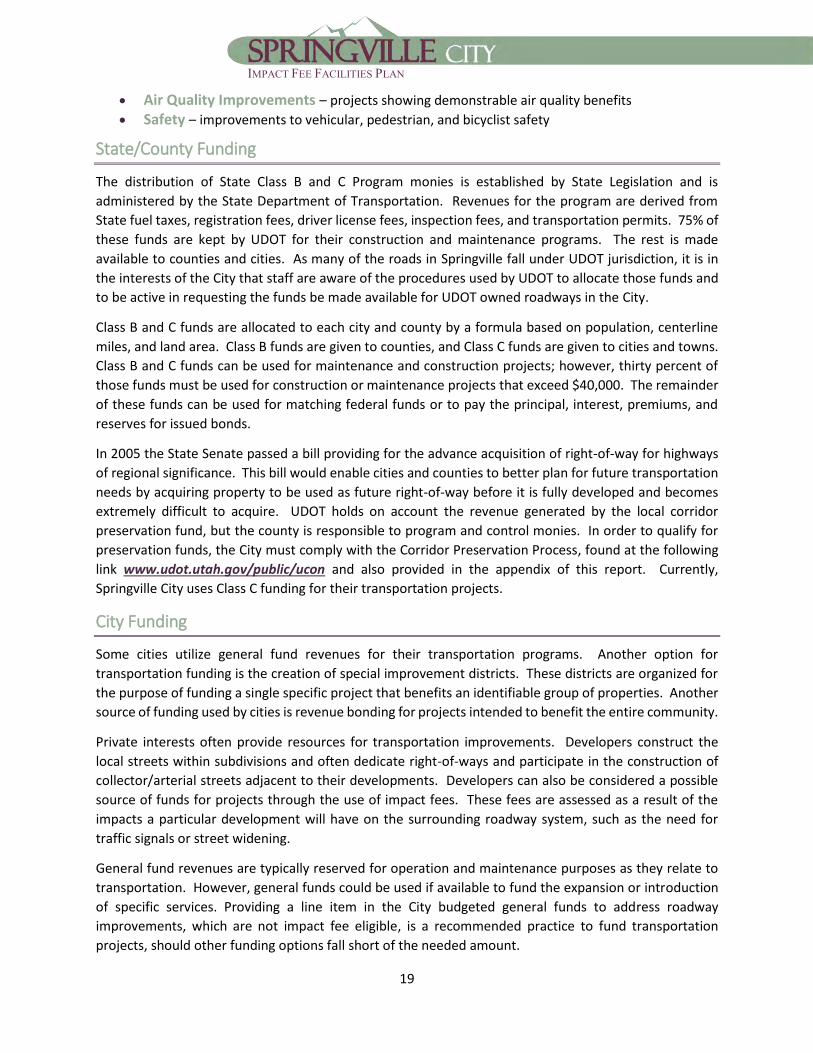
Included in Table 5 is the percent Pass-Through traffic for all project roadways. A vehicle trip is considered
pass-through when the origin and the destination for a specific trip occurs outside the city limits. For all
growth within Springville, there is a certain percentage of new trips which are considered pass-through.
This percentage is determined using the MAG Travel Demand Model. The Travel Demand Model
determines pass-through traffic by keeping track of the origin, destination and path for each vehicle trip
generated. When the vehicle trip uses a roadway in Springville and the origin and destination of that trip
is located outside of Springville, that trip is considered a pass-through trip. Since a pass-through trip does
not originate for terminate within the city, it cannot be paid for with impact fees. The proportion of pass-
through traffic not attributable to impact fees is the proportion of pass-through traffic to the added
capacity of the roadway.
Table 5: Pass-Through Traffic Calculation
Project Location Added
Capacity
Pass-Through Volume
Impact Fee Reduction%
7 1200 West: 1400 North to Southern Border
30,500 1,296 5%
10 400 South Widening: Main Street to 400 East
19,000 55 1%
15 900 South Extension to SR-51 11,500 138 2%
16 Connection of Mattea Lane & 750 West 11,500 135 2%

16
IMPACT FEE FACILITIES PLAN
Included in Table 6 is the calculated excess capacity remaining in 2025. The excess capacity is the
proportion of the added capacity that is not used in 2025. Since this capacity is not used by 2025, it
cannot be paid using impact fees.
Table 6 Excess Capacity Calculations
Project Location Existing Capacity
2025 Capacity
2025 Volume
Excess Capacity
Excess Capacity
%
7 1200 West: 1400 North to Southern Border
NA 30,500 14,400 16,100 53%
10 400 South Widening: Main Street to 400 East
11,500 30,500 16,700 13,800 46%
15 900 South Extension to SR-51 NA 11,500 4,600 6,900 60%
16 Connection of Mattea Lane & 750 West
NA 11,500 4,500 7,000 61%
Impact fees can only be collected for the proportion of the added capacity which is used by new
development. This can be found by reducing the Springville total cost by each of the reduction
percentages found in Table 4 – Table 6. Table 7 is a summary table for existing deficiencies, pass-through
as well as excess capacity used to calculate the impact fee eligible proportion that will be attributed to
each project. According to the Impact Fee law, impact fees cannot be collected on improvements where
level of service is improved. For existing roadways where LOS is improved, the impact fee eligible
percentage is reduced to 0 percent.
Table 7: Proportion of Projects Attributed to New Development
Project Location Reduction for Existing Deficiencies
Reduction for Pass-Through
Reduction for Excess Capacity
Impact Fee Eligible
Proportion
7 1200 West: 1400 North to Southern Border
0% 5% 53% 42%
10 400 South Widening: Main Street to 400 East
22% 1% 46% 31%
15 900 South Extension to SR-51 0% 2% 60% 38%
16 Connection of Mattea Lane & 750 West
0% 2% 61% 37%
Using the Impact Fee eligible proportions from Table 7, the impact fee eligible cost for each project is
included in Table 8. The City can collect Impact Fee’s for the actual project costs incurred up to the impact
fee eligible portion of the total roadway cost based on functional classification. For MAG funded projects,
the impact fees collected in order to meet the 6.77 percent required by MAG is lower than the impact fee
eligible costs for each functional classification and is therefore 100 percent impact fee eligible. Also
included in Table 8 is the impact fee eligible cost for traffic signals. Traffic signals are implemented based
on the traffic signal warrants found in Chapter 4C of the Utah Manual on Uniform Traffic Control Devices
(MUTCD). Included in the MUTCD are warrants based of traffic volumes, pedestrian volumes, safety, as

17
IMPACT FEE FACILITIES PLAN
well as the roadway network in proximity to the intersection. A traffic signal is not installed without
meeting one of the signal warrants included in the Utah MUTCD. Therefore, a reduction in the impact fee
due to excess capacity is not included.
Table 8: Impact Fee Facilities Plan 2015-2025 - Summary
Project Location Total Price Springville City Total
Impact Fee Eligible Portion
Impact Fees Eligible Cost
1 400 South Widening: I-15 to Spanish Fork Main Street
$3,095,000 $0 0% $0
3 1400 North Widening: I-15 to Main Street $29,783,000 $0 0% $0
4 SR-51 Widening: Main Street to Southern Border
$16,861,000 $0 0% $0
7 1200 West: 1400 North to Southern Border $40,035,000 $2,711,000 100% $2,711,000
10 400 South Widening: Main Street to 400 East $2,768,000 $188,000 100% $188,000
15 900 South Extension to SR-51 $5,188,000 $855,000 38% $325,000
16 Connection of Mattea Lane & 750 West $2,097,000 $346,000 37% $128,000
21 Intersection Improvement: 400 South & 2060 West
$254,000 $0 0% $0
22 Intersection Improvement: 400 South & 1200 West
$254,000 $0 0% $0
23 Intersection Improvement: 400 South & Wood Springs Dr.
$254,000 $0 0% $0
24 Intersection Improvement: 400 South & Main Street
$254,000 $0 0% $0
27 Intersection Improvement: 1400 North & 1200 West
$254,000 $0 0% $0
39 Intersection Improvement: West of 400 South Interchange
$254,000 $0 0% $0
59 Roundabout: Canyon Road and 620 South $705,000 $705,000 100% $705,000
62 Traffic Signal: Main Street & 900 North $254,000 $0 100% $0
63 Roundabout: 900 South and 800 East $705,000 $705,000 100% $705,000
Total $103,015,000 $5,510,000 $4,762,000
18
IMPACT FEE FACILITIES PLAN
Proposed Means to Meet Demands of New Development (11-36a-
302.2)
All possible revenue sources have been considered as a means of financing transportation capital
improvements needed as a result of new growth. This section discusses the potential revenue sources
that could be used to fund transportation needs as a result of new development.
Transportation routes often span multiple jurisdictions and provide regional significance to the
transportation network. As a result, other government jurisdictions or agencies often help pay for such
regional benefits. Those jurisdictions and agencies could include the Federal Government, the State or
(UDOT), the county, and the local metropolitan planning organization (MAG). The City will need to
continue to partner and work with these other jurisdictions to ensure adequate funds are available for
the specific improvements necessary to maintain an acceptable LOS. The City will also need to partner
with adjacent communities to ensure corridor continuity across jurisdictional boundaries (i.e., arterials
connect with arterials; collectors connect with collectors, etc.).
Funding sources for transportation are essential if the City of Springville recommended improvements are
to be built. The following paragraphs further describe the various transportation funding sources
available to the City.
Federal Funding
Federal monies are available to cities and counties through the federal-aid program. UDOT administers
the funds. In order to be eligible, a project must be listed on the five-year Statewide Transportation
Improvement Program (STIP).
The Surface Transportation Program (STP) funds projects for any roadway with a functional classification
of a collector street or higher as established on the Statewide Functional Classification Map. STP funds
can be used for both rehabilitation and new construction. The Joint Highway Committee programs a
portion of the STP funds for projects around the state in urban areas. Another portion of the STP funds
can be used for projects in any area of the state at the discretion of the State Transportation Commission.
Transportation Enhancement funds are allocated based on a competitive application process. The
Transportation Enhancement Committee reviews the applications and then a portion of the application is
passed to the State Transportation Commission. Transportation enhancements include twelve categories
ranging from historic preservation, bicycle and pedestrian facilities, and water runoff mitigation.
MAG accepts applications for federal funds from local and regional government jurisdictions. The MAG
Technical Advisory and Regional Planning committees select projects for funding every two years. The
selected projects form the Transportation Improvement Program (TIP). In order to receive funding,
projects should include one or more of the following aspects:
Congestion Relief – spot improvement projects intended to improve Levels of Service and/or reduce average delay along those corridors identified in the Regional Transportation Plan as high congestion areas
Mode Choice – projects improving the diversity and/or usefulness of travel modes other than single occupant vehicles
19
IMPACT FEE FACILITIES PLAN
Air Quality Improvements – projects showing demonstrable air quality benefits
Safety – improvements to vehicular, pedestrian, and bicyclist safety
State/County Funding
The distribution of State Class B and C Program monies is established by State Legislation and is
administered by the State Department of Transportation. Revenues for the program are derived from
State fuel taxes, registration fees, driver license fees, inspection fees, and transportation permits. 75% of
these funds are kept by UDOT for their construction and maintenance programs. The rest is made
available to counties and cities. As many of the roads in Springville fall under UDOT jurisdiction, it is in
the interests of the City that staff are aware of the procedures used by UDOT to allocate those funds and
to be active in requesting the funds be made available for UDOT owned roadways in the City.
Class B and C funds are allocated to each city and county by a formula based on population, centerline
miles, and land area. Class B funds are given to counties, and Class C funds are given to cities and towns.
Class B and C funds can be used for maintenance and construction projects; however, thirty percent of
those funds must be used for construction or maintenance projects that exceed $40,000. The remainder
of these funds can be used for matching federal funds or to pay the principal, interest, premiums, and
reserves for issued bonds.
In 2005 the State Senate passed a bill providing for the advance acquisition of right-of-way for highways
of regional significance. This bill would enable cities and counties to better plan for future transportation
needs by acquiring property to be used as future right-of-way before it is fully developed and becomes
extremely difficult to acquire. UDOT holds on account the revenue generated by the local corridor
preservation fund, but the county is responsible to program and control monies. In order to qualify for
preservation funds, the City must comply with the Corridor Preservation Process, found at the following
link www.udot.utah.gov/public/ucon and also provided in the appendix of this report. Currently,
Springville City uses Class C funding for their transportation projects.
City Funding
Some cities utilize general fund revenues for their transportation programs. Another option for
transportation funding is the creation of special improvement districts. These districts are organized for
the purpose of funding a single specific project that benefits an identifiable group of properties. Another
source of funding used by cities is revenue bonding for projects intended to benefit the entire community.
Private interests often provide resources for transportation improvements. Developers construct the
local streets within subdivisions and often dedicate right-of-ways and participate in the construction of
collector/arterial streets adjacent to their developments. Developers can also be considered a possible
source of funds for projects through the use of impact fees. These fees are assessed as a result of the
impacts a particular development will have on the surrounding roadway system, such as the need for
traffic signals or street widening.
General fund revenues are typically reserved for operation and maintenance purposes as they relate to
transportation. However, general funds could be used if available to fund the expansion or introduction
of specific services. Providing a line item in the City budgeted general funds to address roadway
improvements, which are not impact fee eligible, is a recommended practice to fund transportation
projects, should other funding options fall short of the needed amount.
20
IMPACT FEE FACILITIES PLAN
General obligation bonds are debt paid for or backed by the City’s taxing power. In general, facilities paid
for through this revenue stream are in high demand amongst the community. Typically, general obligation
bonds are not used to fund facilities that are needed as a result of new growth because existing residents
would be paying for the impacts of new growth. As a result, general obligation bonds are not considered
a fair means of financing future facilities needed as a result of new growth.
Certain areas might have different needs or require different methods of funding than traditional revenue
sources. A Special Assessment Area (SAA) can be created for infrastructure needs that benefit or
encompass specific areas of the City. Creation of the SAA may be initiated by the municipality by a
resolution declaring public health, convenience, and necessity require the creation of a SAA. The
boundaries and services provided by the district must be specified and a public hearing held prior to
creation of the SAA. Once the SAA is created, funding can be obtained from tax levies, bonds, and fees
when approved by the majority of the qualified electors of the SAA. These funding mechanisms allow the
costs to be spread out over time. Through the SAA, tax levies and bonding can apply to specific areas in
the City needing to benefit from the improvements.
Interfund Loans
Since infrastructure must generally built ahead of growth, it must sometimes be funded before expected
impact fees are collected. Bonds are the solution to this problem in some cases. In other cases, funds from
existing user rate revenue will be loaned to the impact fee fund to complete initial construction of the
project. As impact fees are received, they will be reimbursed. Consideration of these loans will be included
in the impact fee analysis and should be considered in subsequent accounting of impact fee expenditures.
Developer Dedications and Exactions
Developer dedications and exactions can both be credited against the developer’s impact fee analysis. If
the value of the developer dedications and/or extractions are less than the developer’s impact fee liability,
the developer will owe the balance of the liability to the City. If the dedications and/or extractions of the
developer are greater than the impact fee liability, the City must reimburse the developer the difference.
Developer Impact Fees
Impact fees are a way for a community to obtain funds to assist in the construction of infrastructure
improvements resulting from and needed to serve new growth. The premise behind impact fees is that if
no new development occurred, the existing infrastructure would be adequate. Therefore, new
developments should pay for the portion of required improvements that result from new growth. Impact
fees are assessed for many types of infrastructures and facilities that are provided by a community, such
as roadway facilities. According to state law, impact fees can only be used to fund growth related system
improvements.
Necessity of Improvements to Maintain Level of Service
According to State statute, impact fees must only be used to fund projects that will serve needs caused
by future development. They are not to be used to address present deficiencies. Only projects that
address future needs are included in this IFFP. This ensures a fair fee since developers will not be expected
to address present deficiencies.

21
IMPACT FEE FACILITIES PLAN
Impact Fee Certification (11-36a-306)
This report has been prepared in accordance with Utah Code Title 11 Chapter 36 titled “Impact Fees Act”.
This report relies upon the planning, engineering, land use and other source data provided by the City and
their designees and all results and projections are founded upon this information.
In accordance with Utah Code Annotate, 11-36a-306(1), Horrocks Engineers, certifies that this impact fee
facilities plan:
1. Includes only the cost of public facilities that are: a. Allowed under the Impact Fees Act; and b. Actually incurred; or c. Are projected to be incurred or encumbered within six years of the day on which each
impact fee is paid; 2. Does not include:
a. Costs of operation and maintenance of public facilities b. Cost of qualifying public facilities that will raise the level of service for the facilities,
through impact fees, above the level of service supported by existing residents; c. An expense for overhead, unless the expense is calculated pursuant to a methodology
that is consistent with generally accepted cost accounting practices and the methodological standards set forth by the federal Office of Management and Budget for federal grant reimbursement; and
3. Complies in each and every relevant respect with the Impact Fees Act. This certification is made with the following limitations:
1. All of the recommendations for implementing this IFFP of IFA are followed in their entirety by the City.
2. If any portion of the IFFP is modified or amended in any way, this certification is no longer valid. 3. All information presented and used in the creation of this IFFP is assumed to be complete and
correct, including any information received from the City or other outside sources.

22
APPENDIX A – COST ESTIMATES

Project Location Total Price Funding Source Range (Yr)Springville
City %Springville City Total
1 400 South Widening: I-15 to Spanish Fork Main Street $3,095,000 UDOT 2025 0% $03 1400 North Widening: I-15 to Main Street $29,783,000 UDOT 2025 0% $04 SR-51 Widening: Main Street to Southern Border $16,861,000 UDOT 2025 0% $07 1200 West: 1400 North to Southern Border $40,035,000 Springville/MAG 2025 6.77% $2,711,000
10 400 South Widening: Main Street to 400 East $2,768,000 Springville/MAG 2025 6.77% $188,00015 900 South Extension to SR-51 $5,188,000 Springville 2025 16% $855,00016 Connection of Mattea Lane & 750 West $2,097,000 Springville 2025 16% $346,00021 Intersection Improvement: 400 South & 2060 West $254,000 UDOT 2025 0% $022 Intersection Improvement: 400 South & 1200 West $254,000 UDOT 2025 0% $023 Intersection Improvement: 400 South & Wood Springs Dr. $254,000 UDOT 2025 0% $024 Intersection Improvement: 400 South & Main Street $254,000 UDOT 2025 0% $027 Intersection Improvement: 1400 North & 1200 West $254,000 UDOT 2025 0% $039 Intersection Improvement: West of 400 South Interchange $254,000 UDOT 2025 0% $059 Roundabout: Canyon Road and 620 South $705,000 Springville 2025 100% $705,00062 Traffic Signal: Main Street & 900 North $254,000 UDOT 2025 0% $063 Roundabout: 900 South and 800 East $705,000 Springville 2025 100% $705,000
Total $103,015,000 $5,510,000
Project Summary (IFFP)

Project Location Total Price Funding SourceSpringville
City %Funded by Others
Springville City Total
Impact Fee Eligible
Impact Fee Collected
1 400 South Widening: I-15 to Spanish Fork Main Street $3,095,000 UDOT 0% $3,095,000 $0 0% $03 1400 North Widening: I-15 to Main Street $29,783,000 UDOT 0% $29,783,000 $0 0% $04 SR-51 Widening: Main Street to Southern Border $16,861,000 UDOT 0% $16,861,000 $0 0% $07 1200 West: 1400 North to Southern Border $40,035,000 Springville/MAG 6.77% $37,324,000 $2,711,000 100% $2,711,000
10 400 South Widening: Main Street to 400 East $2,768,000 Springville/MAG 6.77% $2,580,000 $188,000 100% $188,00015 900 South Extension to SR-51 $5,188,000 Springville 16% $4,333,000 $855,000 38% $325,00016 Connection of Mattea Lane & 750 West $2,097,000 Springville 16% $1,751,000 $346,000 37% $128,00021 Intersection Improvement: 400 South & 2060 West $254,000 UDOT 0% $254,000 $0 0% $022 Intersection Improvement: 400 South & 1200 West $254,000 UDOT 0% $254,000 $0 0% $023 Intersection Improvement: 400 South & Wood Springs Dr. $254,000 UDOT 0% $254,000 $0 0% $024 Intersection Improvement: 400 South & Main Street $254,000 UDOT 0% $254,000 $0 0% $027 Intersection Improvement: 1400 North & 1200 West $254,000 UDOT 0% $254,000 $0 0% $039 Intersection Improvement: West of 400 South Interchange $254,000 UDOT 0% $254,000 $0 0% $059 Roundabout: Canyon Road and 620 South $705,000 Springville 100% $0 $705,000 100% $705,00062 Traffic Signal: Main Street & 900 North $254,000 UDOT 0% $254,000 $0 100% $063 Roundabout: 900 South and 800 East $705,000 Springville 100% $0 $705,000 100% $705,000
Total $103,015,000 $97,505,000 $5,510,000 $4,762,000
Project Summary (10 Years)

Project Location Added CapacityVolume Over
Existing CapacityImpact Fee Reduction%
10 400 South Widening: Main Street to 400 East 19,000 4,100 22%
Project Location Added CapacityPass-Through
VolumeImpact Fee Reduction%
7 1200 West: 1400 North to Southern Border 30,500 1,296 5%8 1600 South Widening: 300 West to Southwestern Border 19,000 2470 13%9 1600 South Extension to US-89 30,500 2,470 8%
10 400 South Widening: Main Street to 400 East 19,000 55 1%15 900 South Extension to SR-51 11,500 138 2%16 Connection of Mattea Lane & 750 West 11,500 135 2%
Project Location Existing Capacity 2025 Capacity 2025 Volume Excess Capacity Excess Capacity %
7 1200 West: 1400 North to Southern Border NA 30,500 14,400 16,100 53%8 1600 South Widening: 300 West to Southwestern Border 11,500 30,500 4,100 18,000 60%9 1600 South Extension to US-89 NA 30,500 NA 9,666 32%
10 400 South Widening: Main Street to 400 East 11,500 30,500 16,700 13,800 46%15 900 South Extension to SR-51 NA 11,500 4,600 6,900 60%16 Connection of Mattea Lane & 750 West NA 11,500 4,500 7,000 61%
Project LocationReduction for
Existing DeficienciesReduction for Pass-
ThroughReduction for
Excess CapacityImpact Fee Eligible
Proportion7 1200 West: 1400 North to Southern Border 0% 5% 53% 42%8 1600 South Widening: 300 West to Southwestern Border 0% 13% 60% 27%9 1600 South Extension to US-89 0% 8% 32% 60%
10 400 South Widening: Main Street to 400 East 22% 1% 46% 31%15 900 South Extension to SR-51 0% 2% 60% 38%16 Connection of Mattea Lane & 750 West 0% 2% 61% 37%
Summary
IFFP Reduction Calculations
Existing Deficiencies
Pass Through
Excess Capacity

Item Unit Unit CostParkstrip S.F. $4.00Removal of Existing Asphalt S.Y. $4.00Clearing and Grubbing Acre $2,000.00Roadway Excavation C.Y. $10.50HMA Concrete Ton $85.00Untreated Base Course C.Y. $10.00Granular Borrow C.Y. $40.00Curb and Gutter (2' width) L.F. $22.50Sidewalk (5' width) L.F. $25.00Drainage L.F. $45.00Right of Way S.F. $4.00Removal of Existing Curb and Gutter L.F. $5.00Grind Existing Asphalt S.F. $5.00Restriping L.F. $5.00Roundabout Each $500,000Traffic Signal Each $180,000
Contingency
Mobilization
Preconstruction EngineeringConstruction Engineering 8%
Springville CityTransportation Improvement Program (TIP)
Unit Costs
15%
10%
8%

Item Unit Unit Cost Quantity CostParkstrip S.F. $4.00 38,980 $155,922Removal of Existing Asphalt S.Y. $4.00 11,640 $46,560Clearing and Grubbing Acre $2,000.00 2 $4,810Roadway Excavation C.Y. $10.50 5,233 $54,952HMA Concrete Ton $85.00 3,855 $327,666Untreated Base Course C.Y. $10.00 1,744 $17,445Granular Borrow C.Y. $40.00 3,925 $157,004Curb and Gutter (2' width) L.F. $22.50 4,873 $109,632Sidewalk (5' width) L.F. $25.00 4,873 $121,814Drainage L.F. $45.00 4,873 $219,265Right of Way S.F. $4.00 104,760 $419,039Removal of Existing Curb and Gutter L.F. $5.00 4,873 $24,363Grind Existing Asphalt S.F. $5.00 104,760 $523,799Restriping L.F. $5.00 2,436 $12,181Roundabout Each $500,000 0 $0Traffic Signal Each $180,000 0 $0
$2,194,453
15% $329,168
10% $219,445
8% $175,5568% $175,556
$3,095,000
0%$0
Overall Assumptions:HMA Pavement Density (pcf) = 155 Project No.
HMA Thickness (in) = 4 Funding:Untreated Base Course Thickness (in) = 8 Type:
Granual Borrow Thickness (in) = 18 Cost from 2040 RTPRoadway Excavation Depth (ft) = 2
Number of Sidewalks (No.) = 2Overlay HMA Thickness (in) = 3
Total Project Costs
Construction Engineering
Springville CityTransportation Master Plan
400 South Widening: I-15 to Spanish Fork Main Street
Mobilization
Preconstruction Engineering
Springville City's Responsibility
1UDOT
Capacity Improvement
Contingency
Major Arterial
Costs
Subtotal

Item Unit Unit Cost Quantity CostParkstrip S.F. $4.00 411,213 $1,644,853Removal of Existing Asphalt S.Y. $4.00 77,103 $308,410Clearing and Grubbing Acre $2,000.00 25 $50,741Roadway Excavation C.Y. $10.50 85,669 $899,529HMA Concrete Ton $85.00 43,322 $3,682,367Untreated Base Course C.Y. $10.00 28,556 $285,565Granular Borrow C.Y. $40.00 64,252 $2,570,083Curb and Gutter (2' width) L.F. $22.50 25,701 $578,269Sidewalk (5' width) L.F. $25.00 25,701 $642,521Drainage L.F. $45.00 51,402 $2,313,075Right of Way S.F. $4.00 1,105,136 $4,420,543Removal of Existing Curb and Gutter L.F. $5.00 25,701 $128,504Grind Existing Asphalt S.F. $5.00 693,923 $3,469,613Restriping L.F. $5.00 25,701 $128,504Roundabout Each $500,000 0 $0Traffic Signal Each $180,000 0 $0
$21,122,578
15% $3,168,387
10% $2,112,258
8% $1,689,8068% $1,689,806
$29,783,000
0%$0
Overall Assumptions:HMA Pavement Density (pcf) = 155 Project No.
HMA Thickness (in) = 4 Funding:Untreated Base Course Thickness (in) = 8 Type:
Granual Borrow Thickness (in) = 18 Cost from 2040 RTPRoadway Excavation Depth (ft) = 2
Number of Sidewalks (No.) = 2Overlay HMA Thickness (in) = 3
UDOTCapacity Improvement
Mobilization
Construction Engineering
Total Project Costs
Springville City's Responsibility
3
Preconstruction Engineering
Springville CityTransportation Master Plan
1400 North Widening: I-15 to Main Street
Major Arterial
Costs
Subtotal
Contingency

Item Unit Unit Cost Quantity CostParkstrip S.F. $4.00 218,000 $872,000Removal of Existing Asphalt S.Y. $4.00 43,903 $175,611Clearing and Grubbing Acre $2,000.00 13 $26,900Roadway Excavation C.Y. $10.50 43,398 $455,681HMA Concrete Ton $85.00 22,791 $1,937,205Untreated Base Course C.Y. $10.00 14,466 $144,660Granular Borrow C.Y. $40.00 32,549 $1,301,944Curb and Gutter (2' width) L.F. $22.50 27,250 $613,125Sidewalk (5' width) L.F. $25.00 27,250 $681,250Drainage L.F. $45.00 27,250 $1,226,250Right of Way S.F. $4.00 585,875 $2,343,500Removal of Existing Curb and Gutter L.F. $5.00 27,250 $136,250Grind Existing Asphalt S.F. $5.00 395,125 $1,975,625Restriping L.F. $5.00 13,625 $68,125Roundabout Each $500,000 0 $0Traffic Signal Each $180,000 0 $0
$11,958,127
15% $1,793,719
10% $1,195,813
8% $956,6508% $956,650
$16,861,000
0%$0
Overall Assumptions:HMA Pavement Density (pcf) = 155 Project No.
HMA Thickness (in) = 4 Funding:Untreated Base Course Thickness (in) = 8 Type:
Granual Borrow Thickness (in) = 18Roadway Excavation Depth (ft) = 2
Number of Sidewalks (No.) = 2Overlay HMA Thickness (in) = 3
UDOTCapacity Improvement
Mobilization
Construction Engineering
Total Project Costs
Springville City's Responsibility
4
Preconstruction Engineering
Springville CityTransportation Master Plan
SR-51 Widening: Main Street to Southern Border
Major Arterial
Costs
Subtotal
Contingency

Item Unit Unit Cost Quantity CostParkstrip S.F. $4.00 665,882 $2,663,529Removal of Existing Asphalt S.Y. $4.00 0 $0Clearing and Grubbing Acre $2,000.00 46 $91,719Roadway Excavation C.Y. $10.50 132,560 $1,391,879HMA Concrete Ton $85.00 46,230 $3,929,572Untreated Base Course C.Y. $10.00 44,187 $441,866Granular Borrow C.Y. $40.00 99,420 $3,976,797Curb and Gutter (2' width) L.F. $22.50 83,235 $1,872,794Sidewalk (5' width) L.F. $25.00 83,235 $2,080,882Drainage L.F. $45.00 83,235 $3,745,587Right of Way S.F. $4.00 1,997,647 $7,990,586Removal of Existing Curb and Gutter L.F. $5.00 0 $0Grind Existing Asphalt S.F. $5.00 0 $0Restriping L.F. $5.00 41,618 $208,088Roundabout Each $500,000 0 $0Traffic Signal Each $180,000 0 $0
$28,393,299
15% $4,258,995
10% $2,839,330
8% $2,271,4648% $2,271,464
$40,035,000
6.77%$2,711,000
Overall Assumptions:HMA Pavement Density (pcf) = 155 Project No.
HMA Thickness (in) = 4 Funding:Untreated Base Course Thickness (in) = 8 Type:
Granual Borrow Thickness (in) = 18 Costs apportioned from 2040 RTPRoadway Excavation Depth (ft) = 2
Number of Sidewalks (No.) = 2Overlay HMA Thickness (in) = 3
Springville/MAGNew Road
Mobilization
Construction Engineering
Total Project Costs
Springville City's Responsibility
7
Preconstruction Engineering
Springville CityTransportation Master Plan
1200 West: 1400 North to Southern Border
Major Arterial with Trail
Costs
Subtotal
Contingency

Item Unit Unit Cost Quantity CostParkstrip S.F. $4.00 34,928 $139,712Removal of Existing Asphalt S.Y. $4.00 10,187 $40,749Clearing and Grubbing Acre $2,000.00 2 $4,310Roadway Excavation C.Y. $10.50 4,851 $50,937HMA Concrete Ton $85.00 3,468 $294,801Untreated Base Course C.Y. $10.00 1,617 $16,170Granular Borrow C.Y. $40.00 3,638 $145,533Curb and Gutter (2' width) L.F. $22.50 4,366 $98,235Sidewalk (5' width) L.F. $25.00 4,366 $109,150Drainage L.F. $45.00 4,366 $196,470Right of Way S.F. $4.00 93,869 $375,476Removal of Existing Curb and Gutter L.F. $5.00 4,366 $21,830Grind Existing Asphalt S.F. $5.00 91,686 $458,430Restriping L.F. $5.00 2,183 $10,915Roundabout Each $500,000 0 $0Traffic Signal Each $180,000 0 $0
$1,962,718
15% $294,408
10% $196,272
8% $157,0178% $157,017
$2,768,000
7%$188,000
Overall Assumptions:HMA Pavement Density (pcf) = 155 Project No.
HMA Thickness (in) = 4 Funding:Untreated Base Course Thickness (in) = 8 Type:
Granual Borrow Thickness (in) = 18 Cost from 2040 RTPRoadway Excavation Depth (ft) = 2
Number of Sidewalks (No.) = 2Overlay HMA Thickness (in) = 3
Springville/MAGCapacity Improvement
Mobilization
Construction Engineering
Total Project Costs
Springville City's Responsibility
10
Preconstruction Engineering
Springville CityTransportation Master Plan
400 South Widening: Main Street to 400 East
Major Arterial
Costs
Subtotal
Contingency

Item Unit Unit Cost Quantity CostParkstrip S.F. $4.00 78,400 $313,600Removal of Existing Asphalt S.Y. $4.00 0 $0Clearing and Grubbing Acre $2,000.00 8.10 $16,198Roadway Excavation C.Y. $10.50 15,244 $160,067HMA Concrete Ton $85.00 3,987 $338,927Untreated Base Course C.Y. $10.00 5,081 $50,815Granular Borrow C.Y. $40.00 11,433 $457,333Curb and Gutter (2' width) L.F. $22.50 9,800 $220,500Sidewalk (5' width) L.F. $25.00 9,800 $245,000Drainage L.F. $45.00 9,800 $441,000Right of Way S.F. $4.00 352,800 $1,411,200Removal of Existing Curb and Gutter L.F. $5.00 0 $0Grind Existing Asphalt S.F. $5.00 0 $0Restriping L.F. $5.00 4,900 $24,500Roundabout Each $500,000 0 $0Traffic Signal Each $180,000 0 $0
$3,679,140
15% $551,871
10% $367,914
8% $294,3318% $294,331
$5,188,000
16%$855,000
Overall Assumptions:HMA Pavement Density (pcf) = 155 Project No.
HMA Thickness (in) = 3 Funding:Untreated Base Course Thickness (in) = 8 Type:
Granual Borrow Thickness (in) = 18Roadway Excavation Depth (ft) = 2
Number of Sidewalks (No.) = 2Overlay HMA Thickness (in) = 3
SpringvilleNew Road
Mobilization
Construction Engineering
Total Project Costs
Springville City's Responsibility
15
Preconstruction Engineering
Springville CityTransportation Master Plan
900 South Extension to SR-51
Minor Collector
Costs
Subtotal
Contingency

Item Unit Unit Cost Quantity CostParkstrip S.F. $4.00 31,680 $126,720Removal of Existing Asphalt S.Y. $4.00 0 $0Clearing and Grubbing Acre $2,000.00 3 $6,545Roadway Excavation C.Y. $10.50 6,160 $64,680HMA Concrete Ton $85.00 1,611 $136,954Untreated Base Course C.Y. $10.00 2,053 $20,533Granular Borrow C.Y. $40.00 4,620 $184,800Curb and Gutter (2' width) L.F. $22.50 3,960 $89,100Sidewalk (5' width) L.F. $25.00 3,960 $99,000Drainage L.F. $45.00 3,960 $178,200Right of Way S.F. $4.00 142,560 $570,240Removal of Existing Curb and Gutter L.F. $5.00 0 $0Grind Existing Asphalt S.F. $5.00 0 $0Restriping L.F. $5.00 1,980 $9,900Roundabout Each $500,000 0 $0Traffic Signal Each $180,000 0 $0
$1,486,673
15% $223,001
10% $148,667
8% $118,9348% $118,934
$2,097,000
16%$346,000
Overall Assumptions:HMA Pavement Density (pcf) = 155 Project No.
HMA Thickness (in) = 3 Funding:Untreated Base Course Thickness (in) = 8 Type:
Granual Borrow Thickness (in) = 18Roadway Excavation Depth (ft) = 2
Number of Sidewalks (No.) = 2Overlay HMA Thickness (in) = 3
SpringvilleNew Road
Mobilization
Construction Engineering
Total Project Costs
Springville City's Responsibility
16
Preconstruction Engineering
Springville CityTransportation Master Plan
Connection of Mattea Lane & 750 West
Minor Collector
Costs
Subtotal
Contingency

Item Unit Unit Cost Quantity CostParkstrip S.F. $4.00 0 $0Removal of Existing Asphalt S.Y. $4.00 0 $0Clearing and Grubbing Acre $2,000.00 0 $0Roadway Excavation C.Y. $10.50 0 $0HMA Concrete Ton $85.00 0 $0Untreated Base Course C.Y. $10.00 0 $0Granular Borrow C.Y. $40.00 0 $0Curb and Gutter (2' width) L.F. $22.50 0 $0Sidewalk (5' width) L.F. $25.00 0 $0Drainage L.F. $45.00 0 $0Right of Way S.F. $4.00 0 $0Removal of Existing Curb and Gutter L.F. $5.00 0 $0Grind Existing Asphalt S.F. $5.00 0 $0Restriping L.F. $5.00 0 $0Roundabout Each $500,000 0 $0Traffic Signal Each $180,000 1 $180,000
$180,000
15% $27,000
10% $18,000
8% $14,4008% $14,400
$254,000
0%$0
Overall Assumptions:HMA Pavement Density (pcf) = 155 Project No.
HMA Thickness (in) = 3 Funding:Untreated Base Course Thickness (in) = 8 Type:
Granual Borrow Thickness (in) = 18Roadway Excavation Depth (ft) = 2
Number of Sidewalks (No.) = 2Overlay HMA Thickness (in) = 3
UDOTTraffic Signal
Mobilization
Construction Engineering
Total Project Costs
Springville City's Responsibility
21
Preconstruction Engineering
Springville CityTransportation Master Plan
Intersection Improvement: 400 South & 2060 West
Minor Collector
Costs
Subtotal
Contingency

Item Unit Unit Cost Quantity CostParkstrip S.F. $4.00 0 $0Removal of Existing Asphalt S.Y. $4.00 0 $0Clearing and Grubbing Acre $2,000.00 0 $0Roadway Excavation C.Y. $10.50 0 $0HMA Concrete Ton $85.00 0 $0Untreated Base Course C.Y. $10.00 0 $0Granular Borrow C.Y. $40.00 0 $0Curb and Gutter (2' width) L.F. $22.50 0 $0Sidewalk (5' width) L.F. $25.00 0 $0Drainage L.F. $45.00 0 $0Right of Way S.F. $4.00 0 $0Removal of Existing Curb and Gutter L.F. $5.00 0 $0Grind Existing Asphalt S.F. $5.00 0 $0Restriping L.F. $5.00 0 $0Roundabout Each $500,000 0 $0Traffic Signal Each $180,000 1 $180,000
$180,000
15% $27,000
10% $18,000
8% $14,4008% $14,400
$254,000
0%$0
Overall Assumptions:HMA Pavement Density (pcf) = 155 Project No.
HMA Thickness (in) = 3 Funding:Untreated Base Course Thickness (in) = 8 Type:
Granual Borrow Thickness (in) = 18 Springville City Paying 10%Roadway Excavation Depth (ft) = 2 Currently two sidewalks
Number of Sidewalks (No.) = 2Overlay HMA Thickness (in) = 3
UDOTTraffic Signal
Mobilization
Construction Engineering
Total Project Costs
Springville City's Responsibility
22
Preconstruction Engineering
Springville CityTransportation Master Plan
Intersection Improvement: 400 South & 1200 West
Minor Collector
Costs
Subtotal
Contingency

Item Unit Unit Cost Quantity CostParkstrip S.F. $4.00 0 $0Removal of Existing Asphalt S.Y. $4.00 0 $0Clearing and Grubbing Acre $2,000.00 0 $0Roadway Excavation C.Y. $10.50 0 $0HMA Concrete Ton $85.00 0 $0Untreated Base Course C.Y. $10.00 0 $0Granular Borrow C.Y. $40.00 0 $0Curb and Gutter (2' width) L.F. $22.50 0 $0Sidewalk (5' width) L.F. $25.00 0 $0Drainage L.F. $45.00 0 $0Right of Way S.F. $4.00 0 $0Removal of Existing Curb and Gutter L.F. $5.00 0 $0Grind Existing Asphalt S.F. $5.00 0 $0Restriping L.F. $5.00 0 $0Roundabout Each $500,000 0 $0Traffic Signal Each $180,000 1 $180,000
$180,000
15% $27,000
10% $18,000
8% $14,4008% $14,400
$254,000
0%$0
Overall Assumptions:HMA Pavement Density (pcf) = 155 Project No.
HMA Thickness (in) = 4 Funding:Untreated Base Course Thickness (in) = 8 Type:
Granual Borrow Thickness (in) = 18 Springville City Paying 10%Roadway Excavation Depth (ft) = 2
Number of Sidewalks (No.) = 2Overlay HMA Thickness (in) = 3
Preconstruction EngineeringConstruction Engineering
Total Project Costs
Springville City's Responsibility
23UDOT
Traffic Signal
Subtotal
Contingency
Mobilization
Costs
Springville CityTransportation Master Plan
Intersection Improvement: 400 South & Wood Springs Dr.
Major Arterial

Item Unit Unit Cost Quantity CostParkstrip S.F. $4.00 0 $0Removal of Existing Asphalt S.Y. $4.00 0 $0Clearing and Grubbing Acre $2,000.00 0 $0Roadway Excavation C.Y. $10.50 0 $0HMA Concrete Ton $85.00 0 $0Untreated Base Course C.Y. $10.00 0 $0Granular Borrow C.Y. $40.00 0 $0Curb and Gutter (2' width) L.F. $22.50 0 $0Sidewalk (5' width) L.F. $25.00 0 $0Drainage L.F. $45.00 0 $0Right of Way S.F. $4.00 0 $0Removal of Existing Curb and Gutter L.F. $5.00 0 $0Grind Existing Asphalt S.F. $5.00 0 $0Restriping L.F. $5.00 0 $0Roundabout Each $500,000 0 $0Traffic Signal Each $180,000 1 $180,000
$180,000
15% $27,000
10% $18,000
8% $14,4008% $14,400
$254,000
0%$0
Overall Assumptions:HMA Pavement Density (pcf) = 155 Project No.
HMA Thickness (in) = 4 Funding:Untreated Base Course Thickness (in) = 8 Type:
Granual Borrow Thickness (in) = 18Roadway Excavation Depth (ft) = 2
Number of Sidewalks (No.) = 2Overlay HMA Thickness (in) = 3
Preconstruction EngineeringConstruction Engineering
Total Project Costs
Springville City's Responsibility
24UDOT
Traffic Signal
Subtotal
Contingency
Mobilization
Costs
Springville CityTransportation Master Plan
Intersection Improvement: 400 South & Main Street
Major Arterial

Item Unit Unit Cost Quantity CostParkstrip S.F. $4.00 0 $0Removal of Existing Asphalt S.Y. $4.00 0 $0Clearing and Grubbing Acre $2,000.00 0 $0Roadway Excavation C.Y. $10.50 0 $0HMA Concrete Ton $85.00 0 $0Untreated Base Course C.Y. $10.00 0 $0Granular Borrow C.Y. $40.00 0 $0Curb and Gutter (2' width) L.F. $22.50 0 $0Sidewalk (5' width) L.F. $25.00 0 $0Drainage L.F. $45.00 0 $0Right of Way S.F. $4.00 0 $0Removal of Existing Curb and Gutter L.F. $5.00 0 $0Grind Existing Asphalt S.F. $5.00 0 $0Restriping L.F. $5.00 0 $0Roundabout Each $500,000 0 $0Traffic Signal Each $180,000 1 $180,000
$180,000
15% $27,000
10% $18,000
8% $14,4008% $14,400
$254,000
0%$0
Overall Assumptions:HMA Pavement Density (pcf) = 155 Project No.
HMA Thickness (in) = 4 Funding:Untreated Base Course Thickness (in) = 8 Type:
Granual Borrow Thickness (in) = 18Roadway Excavation Depth (ft) = 2
Number of Sidewalks (No.) = 2Overlay HMA Thickness (in) = 3
Preconstruction EngineeringConstruction Engineering
Total Project Costs
Springville City's Responsibility
27UDOT
Traffic Signal
Subtotal
Contingency
Mobilization
Costs
Springville CityTransportation Master Plan
Intersection Improvement: 1400 North & 1200 West
Major Arterial

Item Unit Unit Cost Quantity CostParkstrip S.F. $4.00 0 $0Removal of Existing Asphalt S.Y. $4.00 0 $0Clearing and Grubbing Acre $2,000.00 0 $0Roadway Excavation C.Y. $10.50 0 $0HMA Concrete Ton $85.00 0 $0Untreated Base Course C.Y. $10.00 0 $0Granular Borrow C.Y. $40.00 0 $0Curb and Gutter (2' width) L.F. $22.50 0 $0Sidewalk (5' width) L.F. $25.00 0 $0Drainage L.F. $45.00 0 $0Right of Way S.F. $4.00 0 $0Removal of Existing Curb and Gutter L.F. $5.00 0 $0Grind Existing Asphalt S.F. $5.00 0 $0Restriping L.F. $5.00 0 $0Roundabout Each $500,000 0 $0Traffic Signal Each $180,000 1 $180,000
$180,000
15% $27,000
10% $18,000
8% $14,4008% $14,400
$254,000
0%$0
Overall Assumptions:HMA Pavement Density (pcf) = 155 Project No.
HMA Thickness (in) = 4 Funding:Untreated Base Course Thickness (in) = 8 Type:
Granual Borrow Thickness (in) = 18Roadway Excavation Depth (ft) = 2
Number of Sidewalks (No.) = 2Overlay HMA Thickness (in) = 3
Preconstruction EngineeringConstruction Engineering
Total Project Costs
Springville City's Responsibility
39UDOT
Traffic Signal
Subtotal
Contingency
Mobilization
Costs
Springville CityTransportation Master Plan
Intersection Improvement: West of 400 South Interchange
Principal Arterial

Item Unit Unit Cost Quantity CostParkstrip S.F. $4.00 0 $0Removal of Existing Asphalt S.Y. $4.00 0 $0Clearing and Grubbing Acre $2,000.00 0 $0Roadway Excavation C.Y. $10.50 0 $0HMA Concrete Ton $85.00 0 $0Untreated Base Course C.Y. $10.00 0 $0Granular Borrow C.Y. $40.00 0 $0Curb and Gutter (2' width) L.F. $22.50 0 $0Sidewalk (5' width) L.F. $25.00 0 $0Drainage L.F. $45.00 0 $0Right of Way S.F. $4.00 0 $0Removal of Existing Curb and Gutter L.F. $5.00 0 $0Grind Existing Asphalt S.F. $5.00 0 $0Restriping L.F. $5.00 0 $0Roundabout Each $500,000 1 $500,000Traffic Signal Each $180,000 0 $0
$500,000
15% $75,000
10% $50,000
8% $40,0008% $40,000
$705,000
100%$705,000
Overall Assumptions:HMA Pavement Density (pcf) = 155 Project No.
HMA Thickness (in) = 3 Funding:Untreated Base Course Thickness (in) = 8 Type:
Granual Borrow Thickness (in) = 18Roadway Excavation Depth (ft) = 2
Number of Sidewalks (No.) = 2Overlay HMA Thickness (in) = 3
Springville CityTransportation Master Plan
Roundabout: Canyon Road and 620 South
Minor Collector
Costs
59
Subtotal
Contingency
Mobilization
Preconstruction EngineeringConstruction Engineering
Total Project Costs
Springville City's Responsibility
SpringvilleRoundabout

Item Unit Unit Cost Quantity CostParkstrip S.F. $4.00 0 $0Removal of Existing Asphalt S.Y. $4.00 0 $0Clearing and Grubbing Acre $2,000.00 0 $0Roadway Excavation C.Y. $10.50 0 $0HMA Concrete Ton $85.00 0 $0Untreated Base Course C.Y. $10.00 0 $0Granular Borrow C.Y. $40.00 0 $0Curb and Gutter (2' width) L.F. $22.50 0 $0Sidewalk (5' width) L.F. $25.00 0 $0Drainage L.F. $45.00 0 $0Right of Way S.F. $4.00 0 $0Removal of Existing Curb and Gutter L.F. $5.00 0 $0Grind Existing Asphalt S.F. $5.00 0 $0Restriping L.F. $5.00 0 $0Roundabout Each $500,000 0 $0Traffic Signal Each $180,000 1 $180,000
$180,000
15% $27,000
10% $18,000
8% $14,4008% $14,400
$254,000
0%$0
Overall Assumptions:HMA Pavement Density (pcf) = 155 Project No.
HMA Thickness (in) = 3 Funding:Untreated Base Course Thickness (in) = 8 Type:
Granual Borrow Thickness (in) = 18Roadway Excavation Depth (ft) = 2
Number of Sidewalks (No.) = 2Overlay HMA Thickness (in) = 3
Springville CityTransportation Master Plan
Traffic Signal: Main Street & 900 North
Minor Collector
Costs
62
Subtotal
Contingency
Mobilization
Preconstruction EngineeringConstruction Engineering
Total Project Costs
Springville City's Responsibility
UDOTTraffic Signal
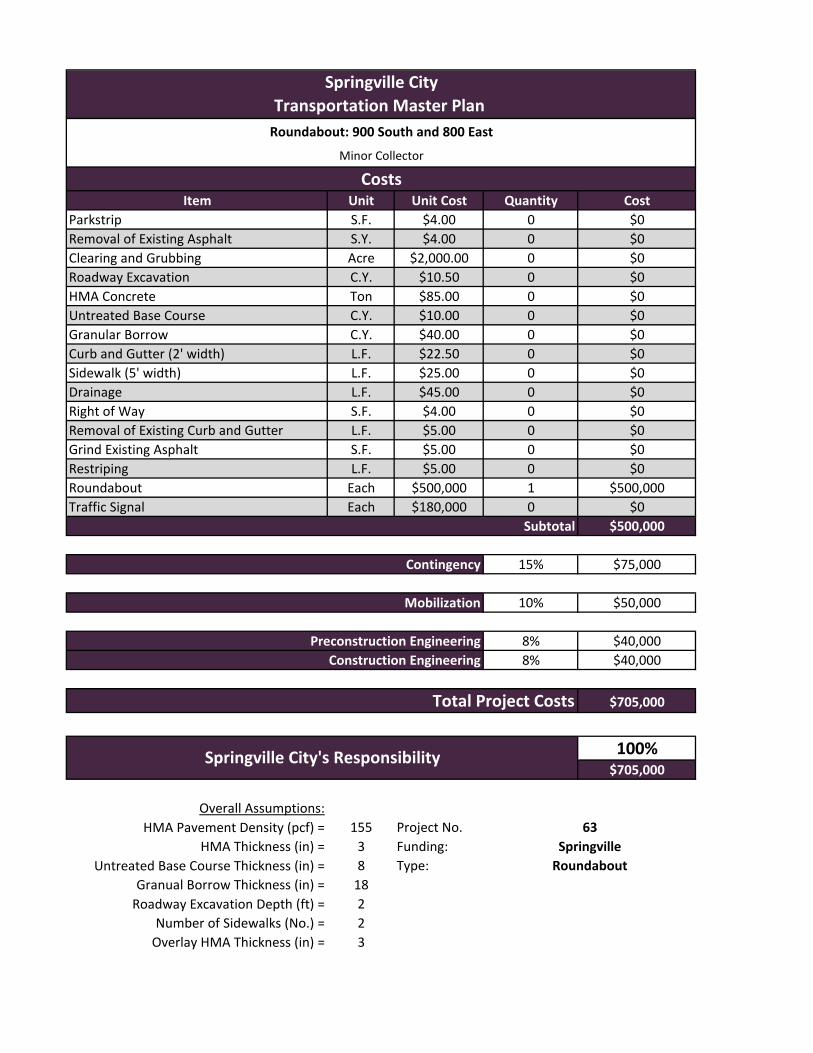
Item Unit Unit Cost Quantity CostParkstrip S.F. $4.00 0 $0Removal of Existing Asphalt S.Y. $4.00 0 $0Clearing and Grubbing Acre $2,000.00 0 $0Roadway Excavation C.Y. $10.50 0 $0HMA Concrete Ton $85.00 0 $0Untreated Base Course C.Y. $10.00 0 $0Granular Borrow C.Y. $40.00 0 $0Curb and Gutter (2' width) L.F. $22.50 0 $0Sidewalk (5' width) L.F. $25.00 0 $0Drainage L.F. $45.00 0 $0Right of Way S.F. $4.00 0 $0Removal of Existing Curb and Gutter L.F. $5.00 0 $0Grind Existing Asphalt S.F. $5.00 0 $0Restriping L.F. $5.00 0 $0Roundabout Each $500,000 1 $500,000Traffic Signal Each $180,000 0 $0
$500,000
15% $75,000
10% $50,000
8% $40,0008% $40,000
$705,000
100%$705,000
Overall Assumptions:HMA Pavement Density (pcf) = 155 Project No.
HMA Thickness (in) = 3 Funding:Untreated Base Course Thickness (in) = 8 Type:
Granual Borrow Thickness (in) = 18Roadway Excavation Depth (ft) = 2
Number of Sidewalks (No.) = 2Overlay HMA Thickness (in) = 3
SpringvilleRoundabout
63
Subtotal
Contingency
Mobilization
Preconstruction EngineeringConstruction Engineering
Total Project Costs
Springville City's Responsibility
Springville CityTransportation Master Plan
Roundabout: 900 South and 800 East
Minor Collector
Costs