impact and progress … what’s next? · impact and progress … what’s next? 2017 fluid forum...
TRANSCRIPT

35 Years of Positive Impact and Progress …
What’s Next?
2017 Fluid Forum
Paul Fixen and Dale Leikam IPNI & FFF
Why 35 years?
Millennials: a life time
1982 Today
Baby Boomers: a career

What we
have not
solved
What we
solved
We tend to focus on the half empty glass … on not being
perfect
Predicting needs for individual
fields in individual years is hard!
Why focus on impact & progress??

Life in 1982
27
Commercial
cell phone
The Wave of The Future

Progress in crop yields
Crop 1982 2016 Change, %
Corn, bu/A 101 172 70
Soybean, bu/A 29.3 49.3 69
Wheat, bu/A 36.5 46.6 28
Cotton, lb/A 547 808 481982 = avg of 81-83; 2016 = avg of 14-16.
Data: USDA-NASS
Data: USDA-NASS
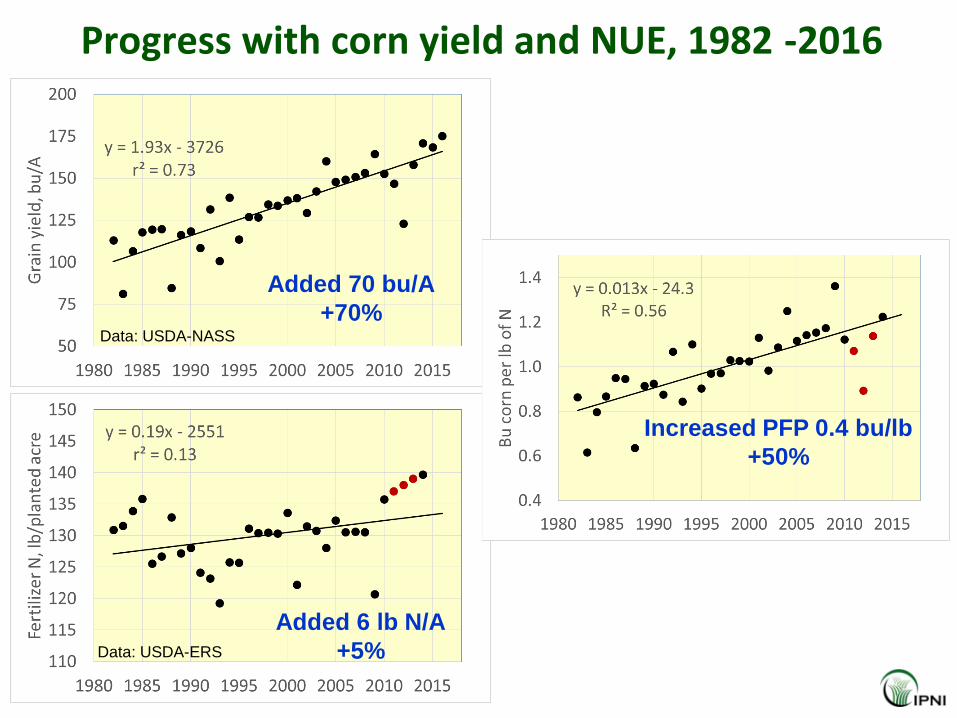
Progress with corn yield and NUE, 1982 -2016
Added 70 bu/A
+70%
Data: USDA-ERS
Added 6 lb N/A
+5%
Increased PFP 0.4 bu/lb
+50%

US Average Corn Yields
1.8 bu/A/yr
Double-X to
single-X hybrids
Expansion of irrigated area,
increased N fertilizer rates
Soil testing, balanced NPK
fertilization, conservation
tillage
Transgenic (Bt)
insect resistance
Integrated pest
management
Precision, high-
speed planters
Auto-steer
Updated w/ permission: Cassman et al., 2006
70% by 2050 requires 3.2 bu/A/yr

100% Pre-plant Band
100% Fertigation
50% Pre-plant + 50% Sidedress
Pre-plant + Starter + Sidedress/V6 fertigation
Pre-plant + Starter + Side-Dress/V6 Fertigation + Brown Silk Fertigation
Step 1
Effi
cie
ncy
Rat
ing
lbs N/Bu
1.2
1.1
1.0
0.9
0.8
1.3 100% Pre-plant Broadcast Floor
Step 2
Step 3
Step 4
Step 5
Russell French
Corn Nitrogen Management Ladder (High Plains)

Ferguson, 2015 (JEQ).
Groundwater nitrate and soil nitrate in the Central Platte Natural Resources District
Groundwater
Soil
Phase 2 & 3 annual producer report database
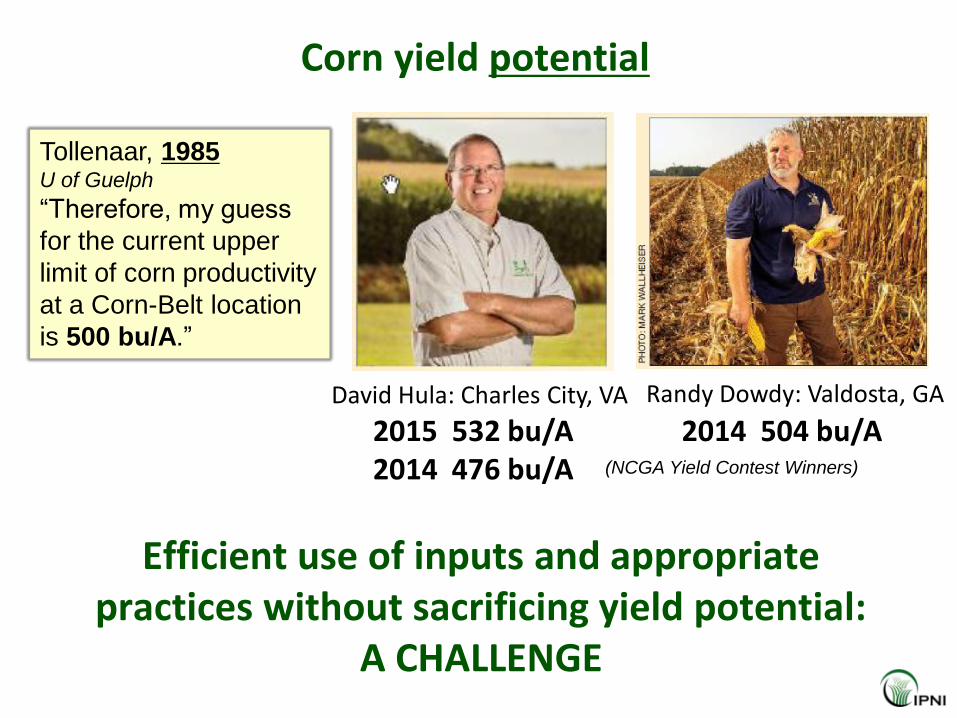
Corn yield potential
Efficient use of inputs and appropriate practices without sacrificing yield potential:
A CHALLENGE
Tollenaar, 1985 U of Guelph
“Therefore, my guess
for the current upper
limit of corn productivity
at a Corn-Belt location
is 500 bu/A.”
2015 532 bu/A 2014 476 bu/A
2014 504 bu/A David Hula: Charles City, VA Randy Dowdy: Valdosta, GA
(NCGA Yield Contest Winners)
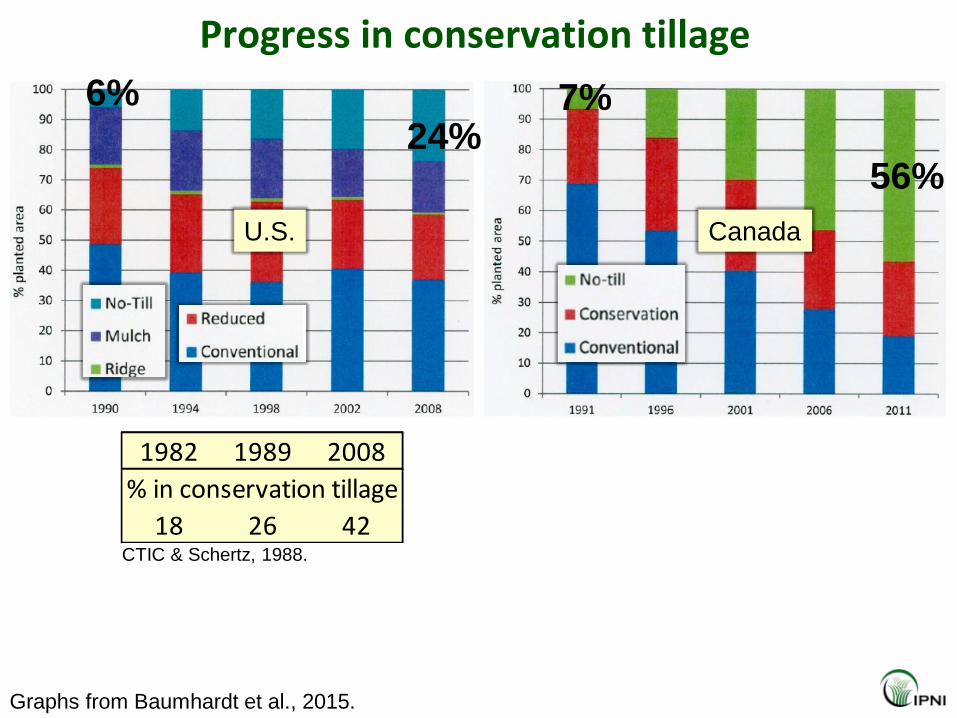
Progress in conservation tillage
Canada
7%
56%
U.S.
6% 24%
1982 1989 2008
18 26 42
% in conservation tillage
CTIC & Schertz, 1988.
Graphs from Baumhardt et al., 2015.

Progress in erosion reduction in the U.S.
Baumhardt et al., 2015.
40% reduction
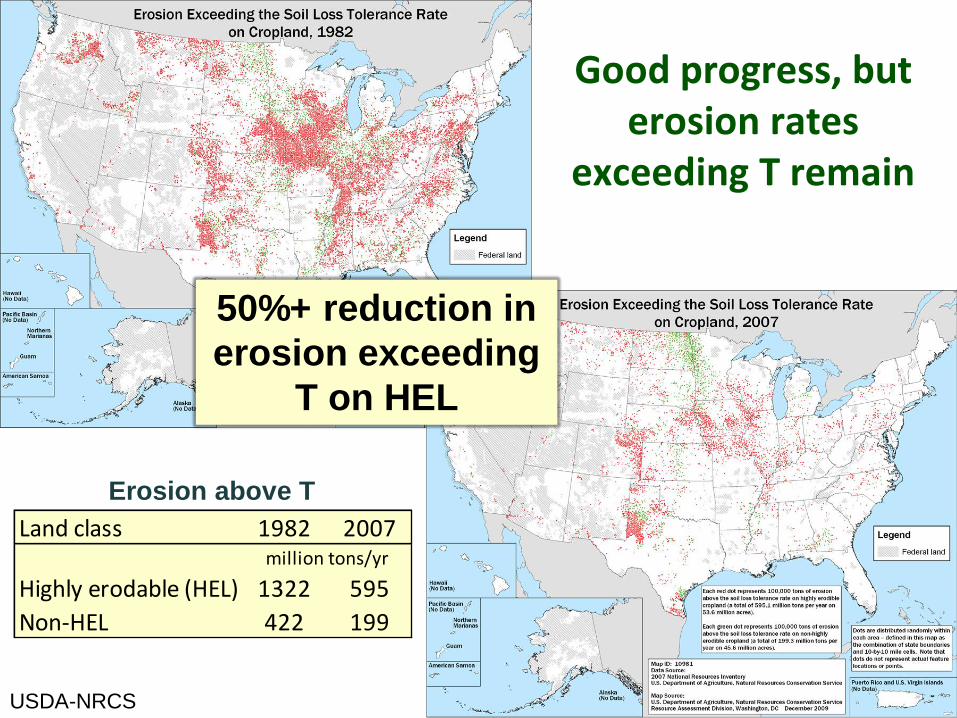
Good progress, but erosion rates
exceeding T remain
USDA-NRCS
Erosion above T
Land class 1982 2007
Highly erodable (HEL) 1322 595
Non-HEL 422 199
million tons/yr
50%+ reduction in
erosion exceeding
T on HEL
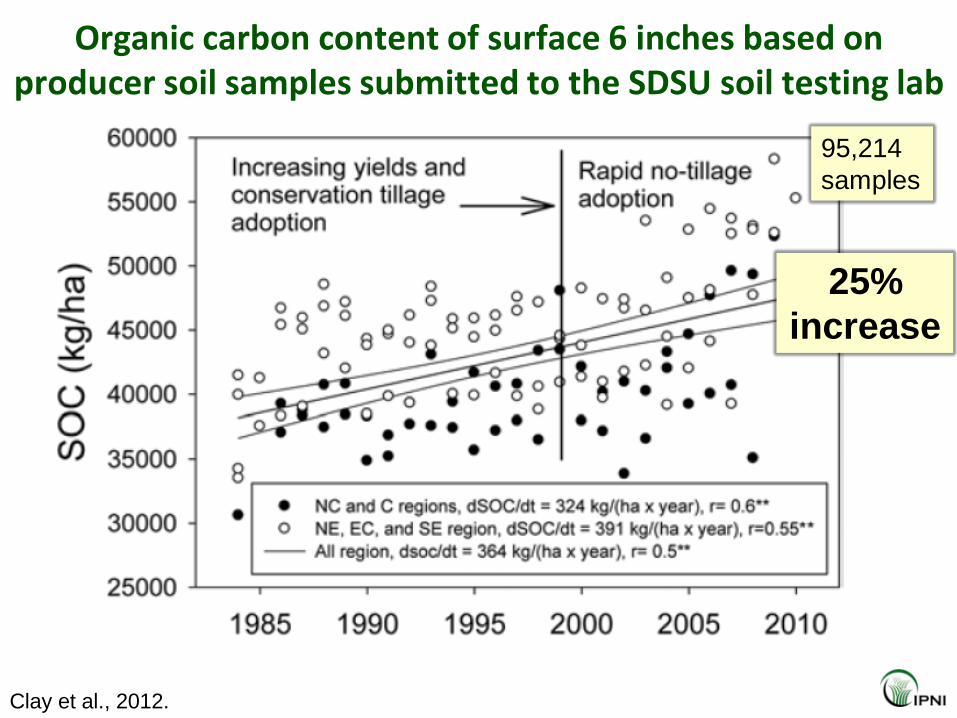
Organic carbon content of surface 6 inches based on producer soil samples submitted to the SDSU soil testing lab
95,214
samples
Clay et al., 2012.
25%
increase

Progress in soil testing in the U.S. 1949-2015
0
1
2
3
4
5
6
7
8
9
10
11
1945 1955 1965 1975 1985 1995 2005 2015
Qu
an
tity
of
sa
mp
les
, m
illi
on
s
152,000/yr
-207,000/yr 41,500/yr
831,000/yr
From <3 M/yr to 10 M/yr
Nutrient use has never been as measurement-guided as it is today
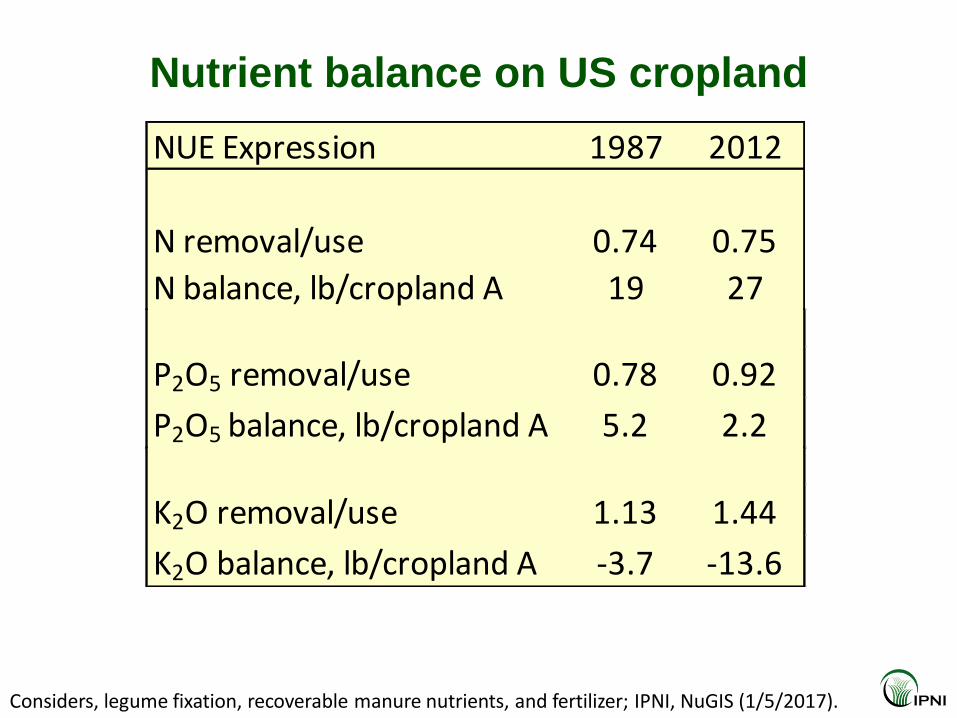
Nutrient balance on US cropland
Considers, legume fixation, recoverable manure nutrients, and fertilizer; IPNI, NuGIS (1/5/2017).
NUE Expression 1987 2012
N removal/use 0.74 0.75
N balance, lb/cropland A 19 27
P2O5 removal/use 0.78 0.92
P2O5 balance, lb/cropland A 5.2 2.2
K2O removal/use 1.13 1.44
K2O balance, lb/cropland A -3.7 -13.6
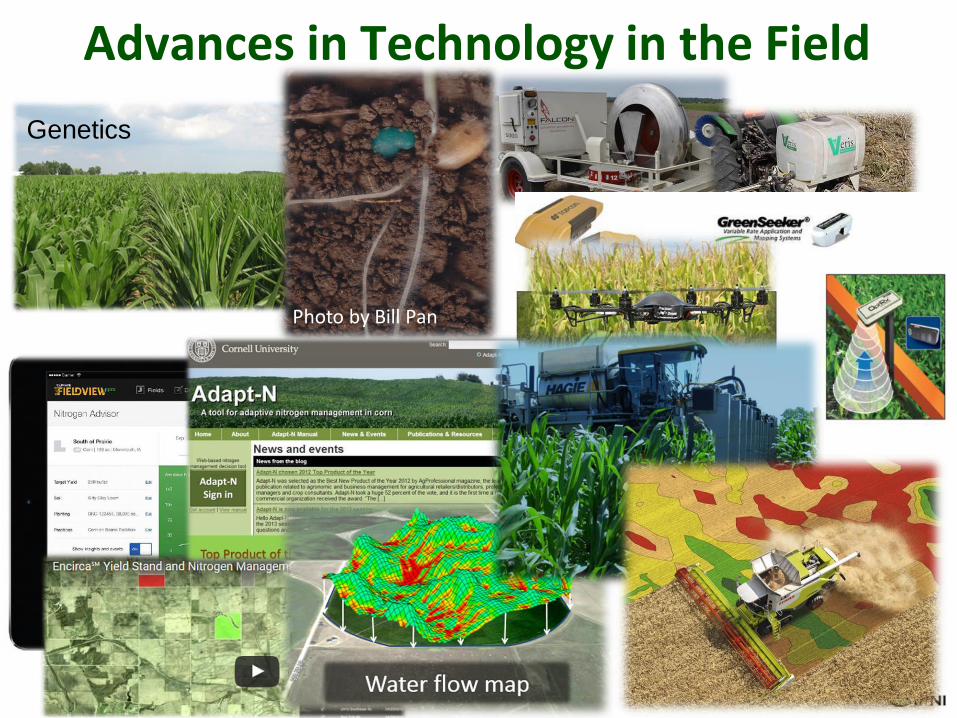
Advances in Technology in the Field
Photo by Bill Pan
Genetics
Photo by Bill Pan
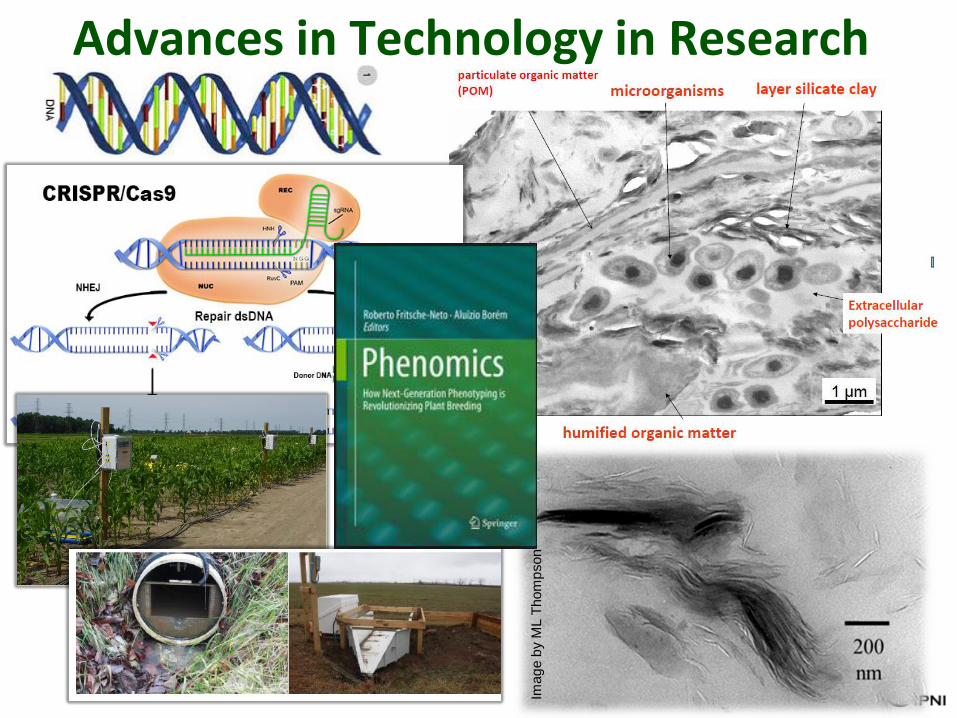
Advances in Technology in Research
Imag
e b
y M
L T
hom
pson
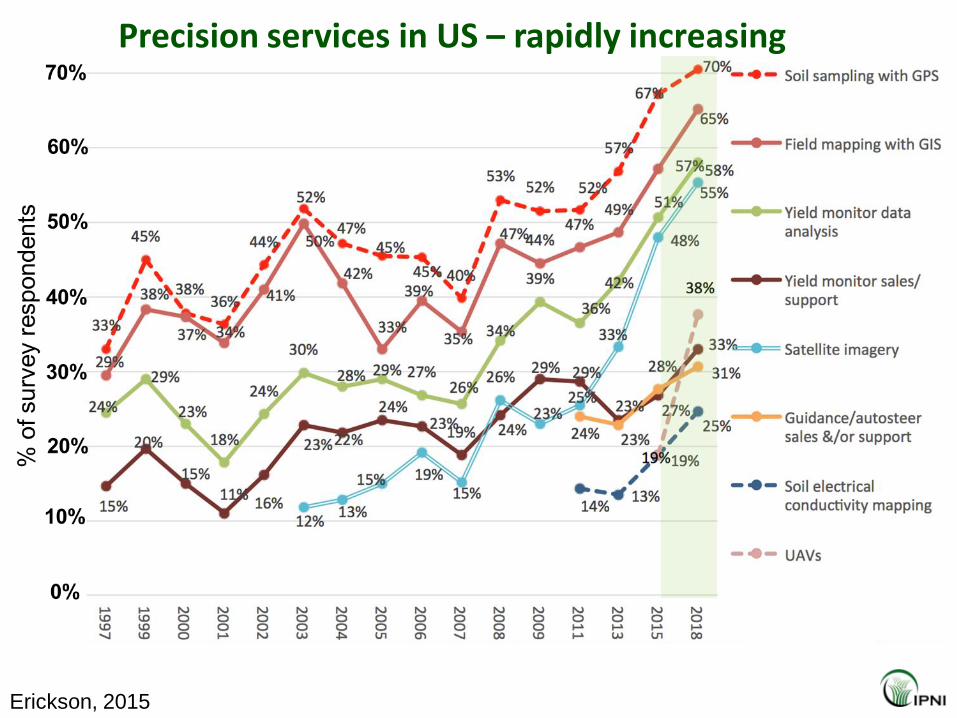
Precision services in US – rapidly increasing
Erickson, 2015

InfoAg Attendance
More than doubled
in last 5 yrs

Data: major component of precision - in 1995 & even more so today
• Data analysis in site-specific systems – Don Bullock
• Handling data for site-specific management – Craig Elliot
• Requirements for integrating maps & databases – Ted Macy
• Agronomic lessons from data analysis – Dan Frieberg
• Weather data sources – Jim Angel & Tim Marquis
• Yield data mining– Raj Khosla
• Big Data in context – Lisa Prassack & Douglas Hackney
• Data issues – Mary Kay Thatcher & Matthew Darr
• Data warehouses/exchanges – Jason Tatge & John Fulton
• Using satellite/NASA data – Phyl Speser & Munch Moulton
1995 InfoAg Topics
2015 InfoAg Topics

Data has become a huge part of agronomic practice
… and is becoming a more visible component of agronomic science

Examples of progress
in knowledge and its
application …


Potassium Application Effects On Corn Yield
K2O Rate
Croplan 599
Croplan 678
Lbs/A Yield Test Weight Yield Test Weight
0 125 56 199 61
40 170 59 208 61
80 189 58 204 61
120 179 59 203 62
Sig. Level 0.01 0.01 NS 0.25
Atchison County, Kansas June 2004
Average K Test = 153 ppm Minimum K Test = 112 ppm Maximum K Test = 229 ppm
Leikam, KSU, 2004
We ‘Know’ That Potassium Has To
Be Placed Where We Want It In The
Root Zone Since It Does Not Move
In Soil ?

Surface Unincorporated
Check Plot 120 Lbs P2O5/A
Phosphorus Application To CornStevens Co., KS - 2004
120
140
160
180
200
220
240
0 20 40 60 80 100 120 140
P Application Rate (Lb P2O5/A)
Co
rn Y
ield
(B
u/A
)
Yield
Irrigated
Surface Broadcast Application
No Incorporation
Low P Soil Test
Leikam, KSU, 2004
We ‘Know’ That Phosphorus Has To
Be Placed Where We Want It, In The
Root Zone Since It Does Not Move
In Soil ?

Surface Band,
High N Starter
Applications
We ‘Know’ That Starter Fertilizer
Has To Be Placed Where We Want It
In The Root Zone - With Or Below
The Seed?
Source: University of Choice
We ‘Know’ That Manure Should be
Credited for its Nutrient Content
which can be Estimated from
Tabular Values?

A classical fertilizer recommendation paradigm
Soil test level
Yield goal
(Soil type)
(Placement)
Application
rate
Calibration data
Other data
Data manipulation
Tradition & philosophy
Assumptions
Concealed in the box:
Fixen, 1992

Evidence-based Soil Test Calibration in Australia
• Searchable data repository
• 6,000 trial treatment series
• N,P,K,S for multiple crops
• Nation wide, shared work & funding
“Better Fertilizer Decisions for Cropping Systems (BFDC)”
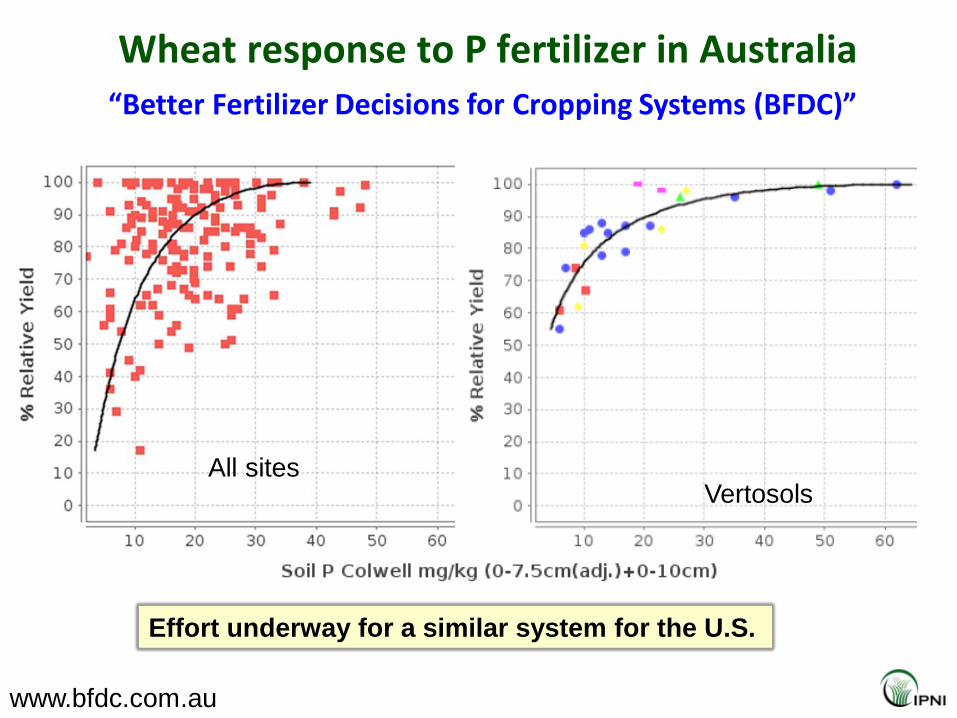
Wheat response to P fertilizer in Australia
www.bfdc.com.au
All sites Vertosols
“Better Fertilizer Decisions for Cropping Systems (BFDC)”
Effort underway for a similar system for the U.S.
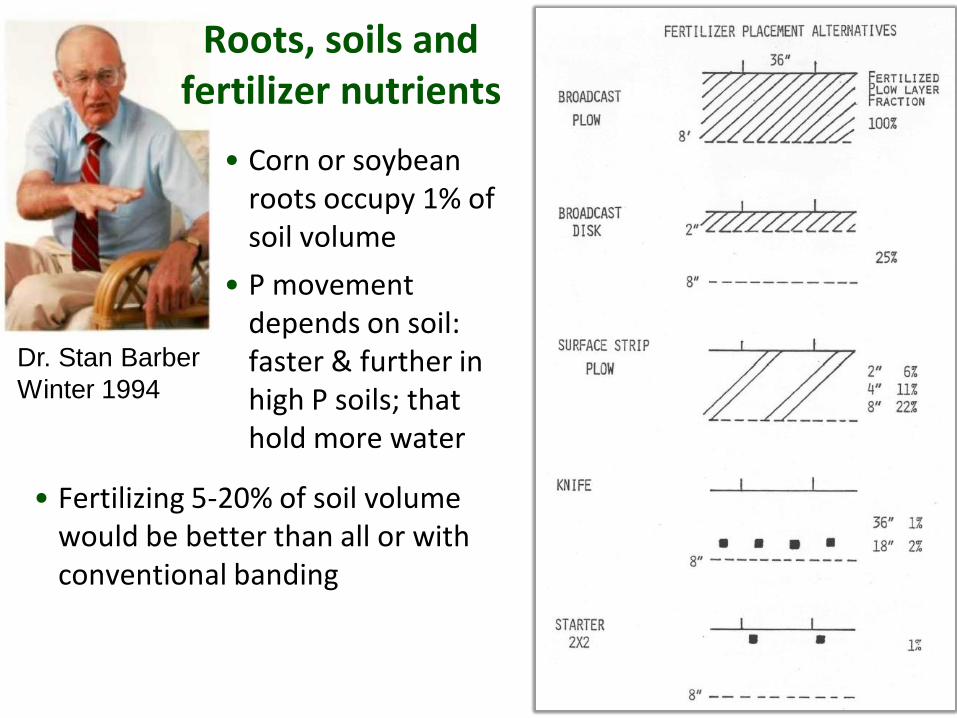
• Fertilizing 5-20% of soil volume would be better than all or with conventional banding
Dr. Stan Barber
Winter 1994
Roots, soils and fertilizer nutrients
• Corn or soybean roots occupy 1% of soil volume
• P movement depends on soil: faster & further in high P soils; that hold more water
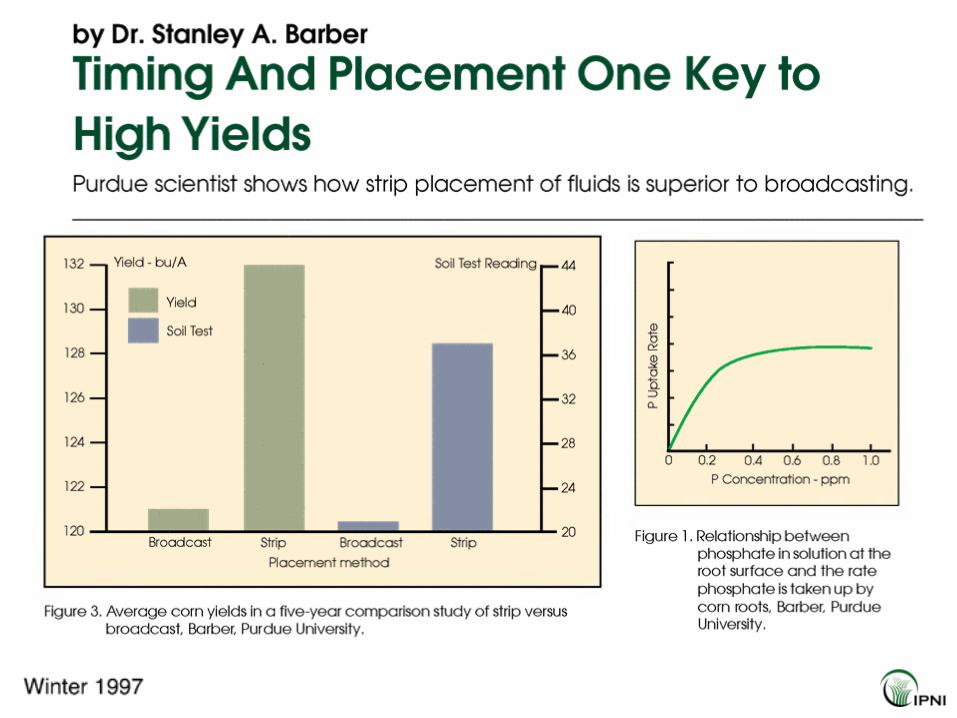

McLaughlin
Increasing movement … a placement effect

Belleville, KS (1993-94)
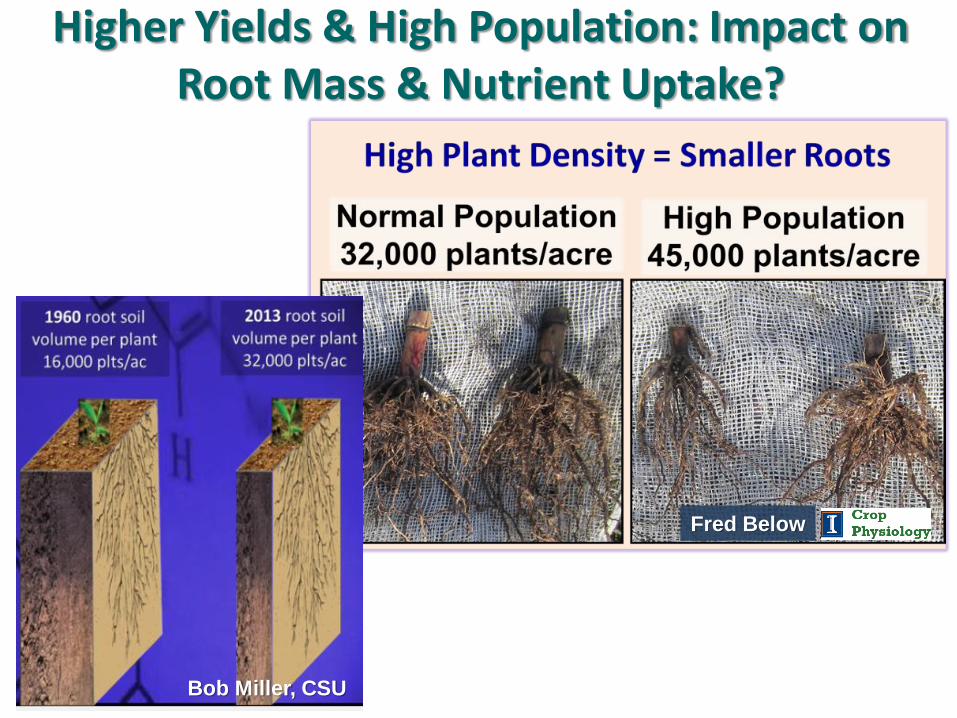
Higher Yields & High Population: Impact on Root Mass & Nutrient Uptake?
Bob Miller, CSU
Fred Below

Meeting nutrient demand through entire
increasingly variable growing seasons
Bender et al., 2013.

Photo by Alyssa Abbott, DuPont/Pioneer Account Manager;
NE IL
0 N Post Tassel 90 N Post Tassel


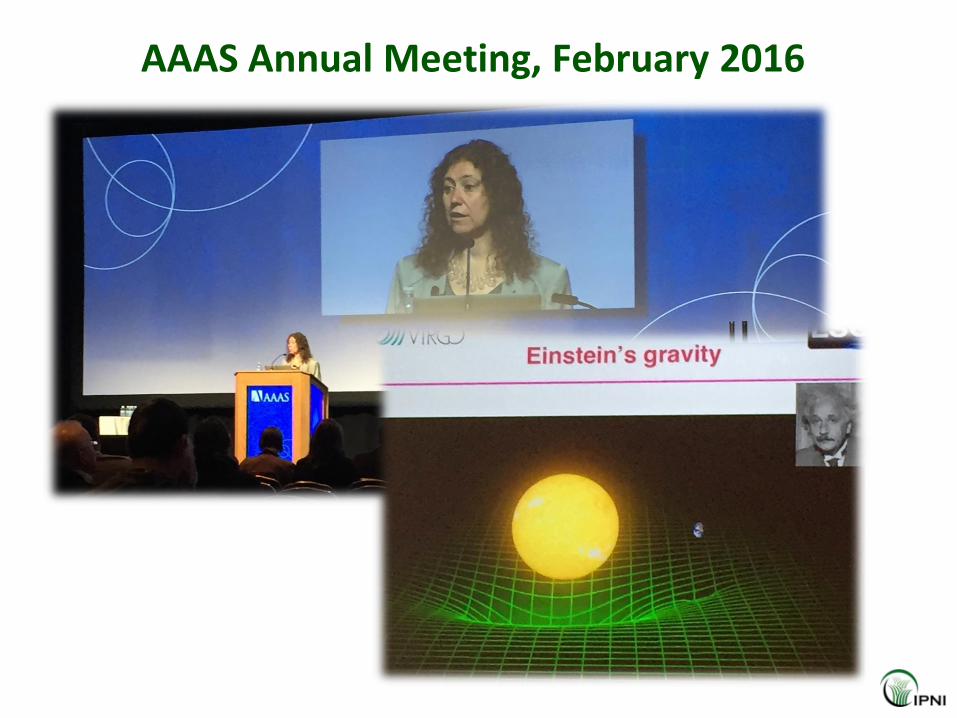
AAAS Annual Meeting, February 2016
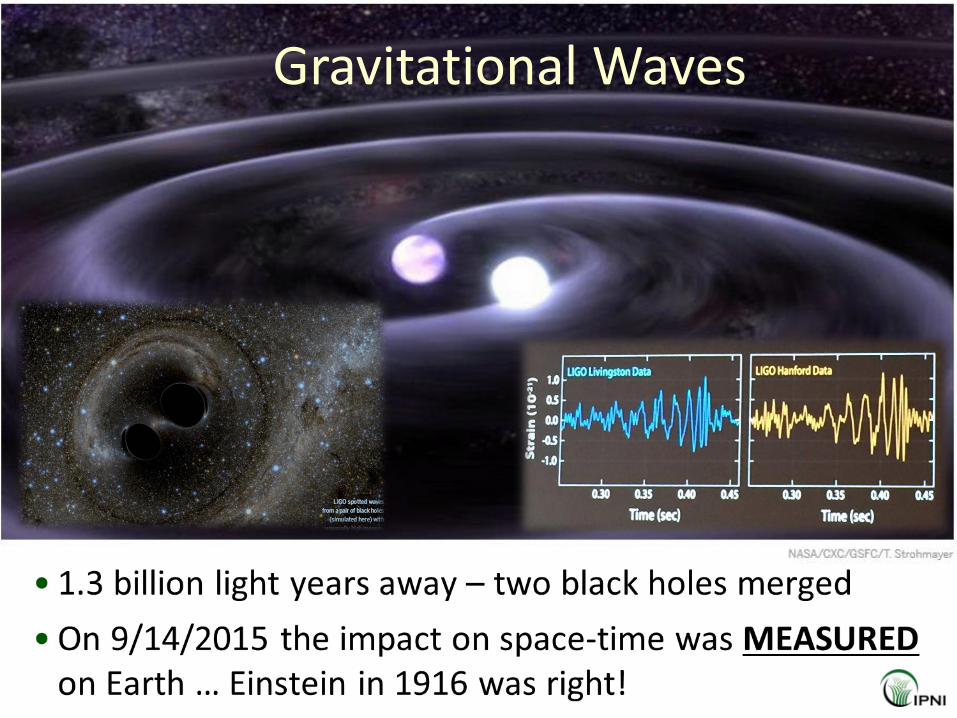
Gravitational Waves

1,000 authors collaborating …
sharing ideas, resources & data
• Meeting pre-competitive needs
• To focus resources on common science-based needs – short & long term
– 1977 Potash & Phosphate Institute (PPI)
– 1980 Foundation for Agronomic Research (FAR)
– 1982 Fluid Fertilizer Foundation (FFF)
– 1992 Certified Crop Adviser program (CCA)
– 2007 International Plant Nutrition Institute (IPNI)
– 2013 4R Research Fund
Collaboration in Agronomy
• Launched in 1992 … 1st exam in 2/93 (Passing rate <50%)
• Requested by and led by the industry
• 13,000+ certified professionals providing science based guidance to producers
– Instrumental in the progress made in nutrient stewardship & agronomic practice
– Even more so in the future
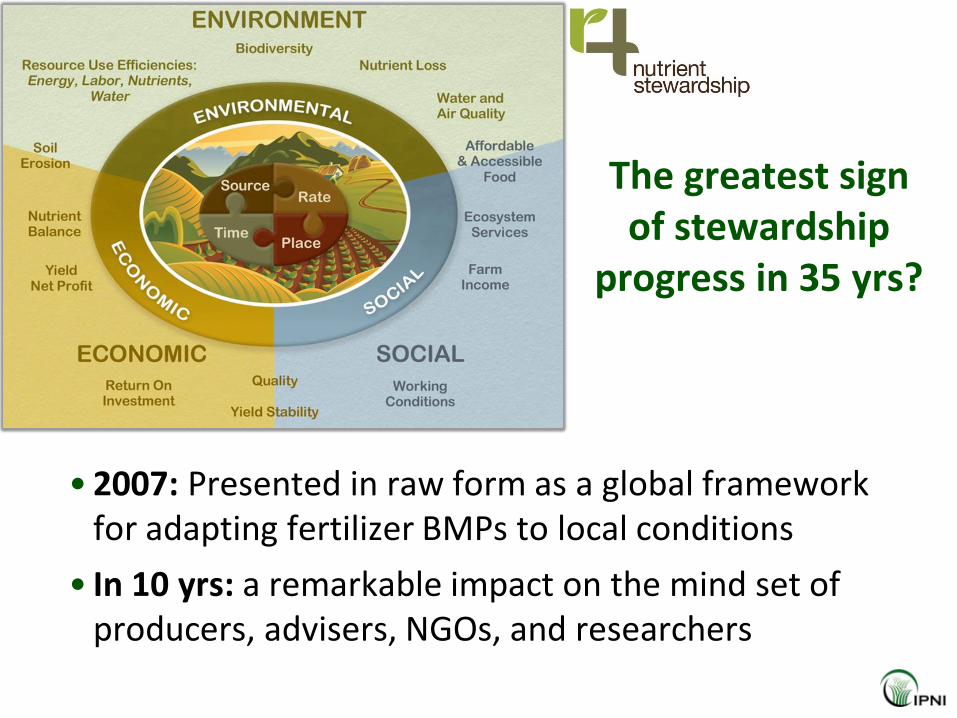
The greatest sign of stewardship
progress in 35 yrs?
• 2007: Presented in raw form as a global framework for adapting fertilizer BMPs to local conditions
• In 10 yrs: a remarkable impact on the mind set of producers, advisers, NGOs, and researchers

What’s next?
•Fluids and 4Rs
•Genetic improvement
•Nutrient sources
•Soil fertility
•Evidence
•Communication
We do not know!

Fluids and 4Rs – great opportunity (right source, place, time … and rate)
Meeting crop needs Reducing nutrient losses
Requires evidence for adoption

Accelerated genetic improvement? Negative impacts of climate change?
? Elevated nutrient demand
Increased emphasis on stress tolerance
In either case ... the role of crop nutrition increases
Requires evidence for acceptance

Advances in nutrient sources?
Whether investing, purchasing or advising:
Insist on reliable data … look for evidence … evaluate cost/benefit
… beware of miracles ... consider long-term impacts
MICROBIAL-BASED
PRODUCTS
BIODEGRADABLE SENSORS
See next topic …
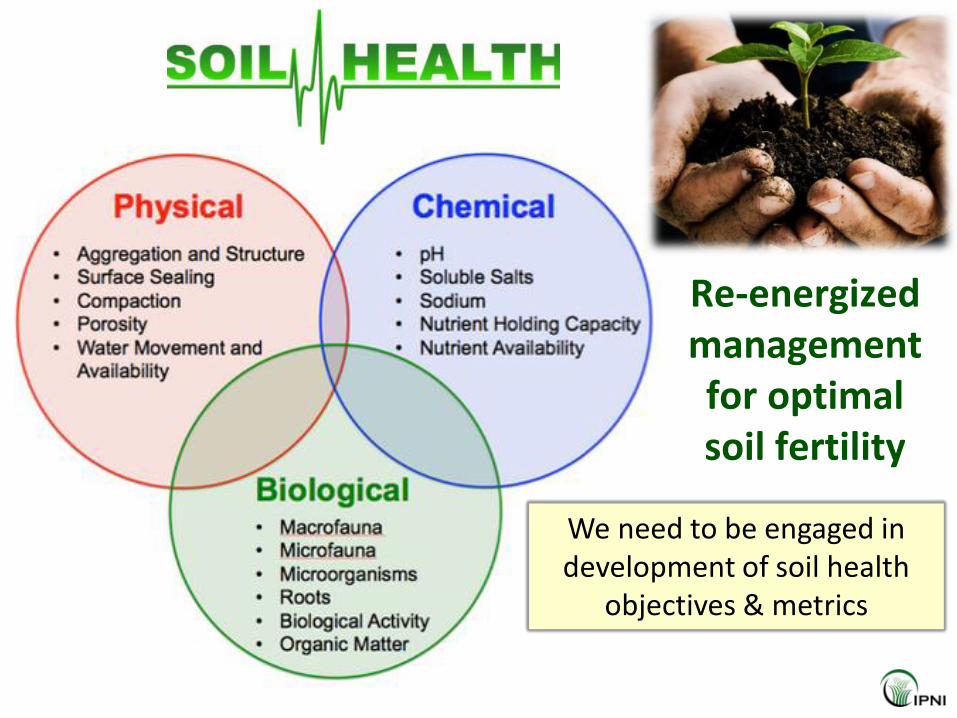
Re-energized management for optimal soil fertility
We need to be engaged in development of soil health
objectives & metrics

Soil testing enhancements:
• Sampling • Validation • Refinement • Recommendations
“Learning Blocks”
“Sentinel strips”

Changes in soil test P levels in four states
• Samples testing in high & very high categories are declining
• Samples testing in responsive categories are increasing
IL
IN
OH
KY
0-5 11-15 31-35 41-45 >50
Bray P1 equivalent P, ppm
20
10
0
Rela
tive f
req
uen
cy,
%
21-25
30
20
10
0
20
10
0
20
10
0
30
2015
Median
25
15
21
24
Increasing
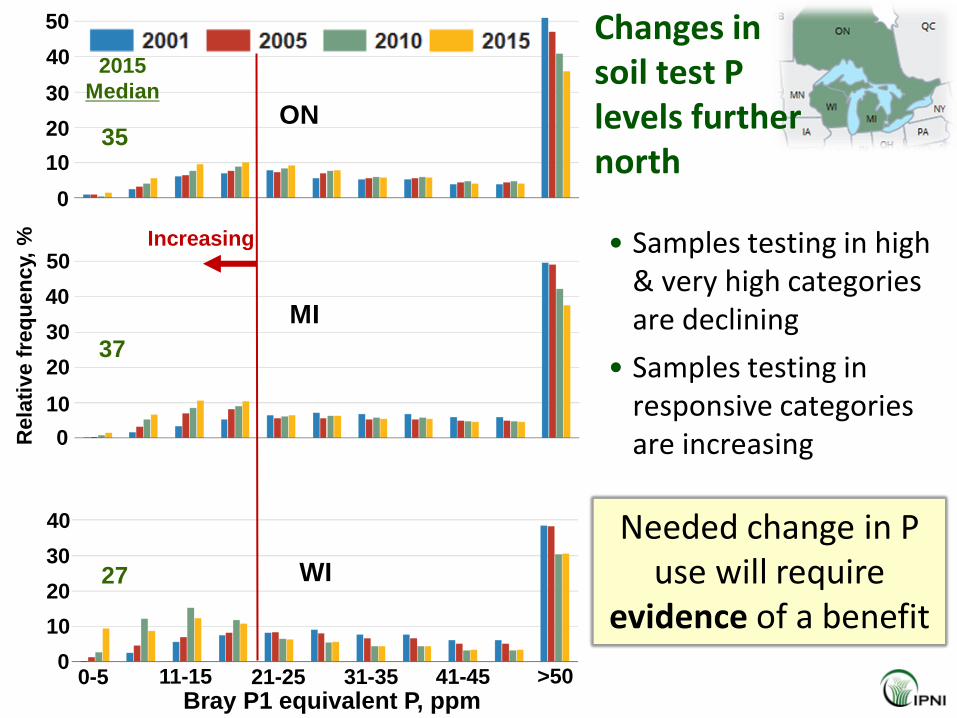
• Samples testing in high & very high categories are declining
• Samples testing in responsive categories are increasing
WI
MI
ON
0-5 11-15 31-35 41-45 >50
Bray P1 equivalent P, ppm
20
10
0
Rela
tive f
req
uen
cy,
%
Needed change in P use will require
evidence of a benefit
21-25
30
40
50
20
10
0
30
40
20
10
0
30
40
50
2015
Median
35
27
37
Increasing
Changes in soil test P levels further north

Changes in soil K levels in 4 western states
• Samples testing in very high category are declining
• Samples testing in responsive categories are increasing
SD
NE
CO
KS
0-40 81-120 161-200 241-280 >320
Soil test K, ppm
60
40
20
0
40
20
0
40
20
0
40
20
0
Rela
tive f
req
uen
cy,
%
41-80
Increasing
2015
Median
241
208
289
306

AB
ON
KY
MS 30
10
0 0-40 81-120 161-200 241-280 >320
Soil test K, ppm 41-80
20
30
10
0
20
30
10
0
20
30
10
0
20
Rela
tive f
req
ue
ncy,
%
Changes in soil K levels in 4 states & provinces
• Samples testing in intermediate categories are declining
• Samples testing in responsive categories are increasing
Declining Increasing
Needed change in K use will require
evidence of a benefit
2015 Median 158
127
112
115

Change in median soil test K
levels from 2010 to 2015 (ppm)
10
00
sh
ort
to
ns K
2O
Research provided evidence of a
benefit to changing K use in IA

Evidence-based agronomy
On the farm
• Data as a valued product of the farm … part of its legacy
• Using data/metrics for learning, selling, and communicating
In ag research • Publishing and curating high
quality, open-access data sets
• Systematic reviews of literature and meta-analyses

What’s next? A communication challenge …
• Great progress in agronomy in the last 35 years
• But challenges remain … to continue efforts to:
– Increase productivity & profitability for producers
– Reduce nutrient loss to surface & ground water
– Reduce loss of nitrous oxide, ammonia, & other N forms to air
– Capture more nutrients in the crop rather than risk loss to environment
• Biggest challenge is to tell our story
– Help the public appreciate:
• The remarkable progress of the last 35 years
• Our dedication to accelerating that progress in the future
• Progress based on science-based technologies & hard facts
• Focus on credible education rather than questioning motives

An example of our challenge …
One cannot question the motives of such a man, but we can use these statements to inspire us to better communicate our own motives and dedication to future progress.
We have an evidence-rich story worth telling
Recent letter to the Director General of FAO, Pope Francis criticized modern agriculture for its: • “production at any cost” • “improperly modifying various animal
and plant species” • model that “despite all its science,
allows around 800 million people to continue to go hungry.”

What’s next?
The future that we create
The Wave of The Future