impact analysis for integration of wind … · ewea european wind energy association ......
TRANSCRIPT
IMPACT ANALYSIS FOR INTEGRATION
OF WIND POWER GENERATION IN
COLOMBIA
PROJECT REPORT
NOVEMBER 2014

IMPACT ANALYSIS FOR INTEGRATION
OF WIND POWER GENERATION IN
COLOMBIA
PROJECT REPORT
NOVEMBER 2014
ADDRESS COWI A/S
Parallelvej 2
2800 Kongens Lyngby
Denmark
TEL +45 56 40 00 00
FAX +45 56 40 99 99
WWW cowi.com
PROJECT NO. A-038811
DOCUMENT NO. PS-01
VERSION 0
DATE OF ISSUE 29 November 14
PREPARED ANIJ, NA, FLSJ, TEP, KELA
CHECKED MANO
APPROVED KELA
IMPACT ANALYSIS FOR INTEGRATION OF WIND POWER GENERATION IN COLOMBIA
PROJECT REPORT
O:\A035000\A038811\3_Pdoc\DOC\Project Report\38811-Project Report Rev 0 29Nov14.docx
5
CONTENTS
1 Introduction 9
1.1 Background 9
1.2 Objective 9
1.3 Methodology and preconditions 10
2 Conclusions and Recommendations 12
2.1 Power System Impact 12
2.2 Wind Resource and Financial Viability 12
2.3 Market & Regulatory Aspects 13
3 Power System Infrastructure Study 16
3.1 Objective 16
3.2 Wind turbine types 16
3.3 Grid Code Assumptions/Recommendations 18
3.4 Wind Farms Investigated 22
3.5 Power system analysis findings 23
4 AEP & Financial Feasibility Analysis 39
4.1 Introduction 39
4.2 Wind resource 39
4.3 Annual Energy Production (AEP) 41
4.4 Investment and operation budget 43
4.5 Income 43
4.6 Operating Costs 44
4.7 Financial analysis 45
4.8 Levelized cost of energy 49
5 Market and Regulatory Aspects 50
5.1 Wind/Hydro Correlation and complementarity 50
5.2 Analysis of Firm Energy Factor, ENFICC 66
5.3 Wind Energy Integration Strategies 73

6 IMPACT ANALYSIS FOR INTEGRATION OF WIND POWER GENERATION IN COLOMBIA PROJECT REPORT
O:\A035000\A038811\3_Pdoc\DOC\Project Report\38811-Project Report Rev 0 29Nov14.docx
6 List of references 75
APPENDICES
Appendix A Normalised Hydro Production
Appendix B Favourable Wind Months Tables
Appendix C Favourable Wind Months – Graphs

IMPACT ANALYSIS FOR INTEGRATION OF WIND POWER GENERATION IN COLOMBIA
PROJECT REPORT
O:\A035000\A038811\3_Pdoc\DOC\Project Report\38811-Project Report Rev 0 29Nov14.docx
7
List of Abbreviations
AEP Annual Energy Production
CAPEX Capital Expenditures
CDM Clean Development Mechanism
CER Certified Emission Reduction
CERE Real equivalent Cost of the Capacity Charge
COP Colombian Peso
E East
ENE East-NorthEast
ENFICC Energía Firme para el Cargo por Confiabilidad – Firm Energy Factor
EPC Engineering, Procurement and Construction
EUR EURO
EWEA European wind energy association
GWh Giga Watt hour
IRR Internal Rate of Return
kV Kilo Volt
LCoE Levelized Cost of energy
LEC Levelized Energy Cost
MCP Measure Correlate Predict
m/s meter per second
MW Mega Watt
NPV Net Present Value
O&M Operation and Maintenance
OPEX Operational Expenditures
PPA Power Purchase Agreement
US$ United States Dollars
WTG Wind Turbine Generator
y Year
Exchange rate: US$/EUR: 1.38
COP/US$: 1,880

IMPACT ANALYSIS FOR INTEGRATION OF WIND POWER GENERATION IN COLOMBIA
PROJECT REPORT
O:\A035000\A038811\3_Pdoc\DOC\Project Report\38811-Project Report Rev 0 29Nov14.docx
9
1 Introduction
1.1 Background
Given the growing interest of public and private investors to develop medium and large scale renewable power generation projects in Colombia, from energy sources such as wind, solar, biomass and geothermal, and being aware of the country’s large potential, the Mining and Energy Planning Unit (UPME), along with the Inter-American Development Bank (IDB), have been developing the project "Catalytic Investments for Geothermal Power", which includes the identification of barriers for development of renewable energy and mechanisms for its removal.
In order to increase the diversification on the energy mix, and to exploit the potential of renewable resources (such as wind energy) available in the country, it is required to identify the main aspects of their integration in the electricity supply in Colombia.
1.2 Objective
The objective of the assignment is to analyse the integration of wind power generation in Colombia by analysing the following topics:
› Annual energy production (AEP) - Wind data analysis - AEP estimate
› Modelling of wind power generation technologies
› Electrical studies of 400MW and 100MW Wind farm impact on the power grid in relation to: - Normal and faulty operation - Transient/dynamic behaviour of the wind farm - Harmonic distortion - Recommended power grid reinforcements

10 IMPACT ANALYSIS FOR INTEGRATION OF WIND POWER GENERATION IN COLOMBIA PROJECT REPORT
O:\A035000\A038811\3_Pdoc\DOC\Project Report\38811-Project Report Rev 0 29Nov14.docx
› Regulatory and Market Analysis - Current regulatory frame - Wind/Hydro Complementarity - Firm Energy Factor - El-Niño impact - Wind/Hydro portfolio impact - Barriers & wind energy integration strategies - Review of international experience
1.3 Methodology and preconditions
This present report makes up the project report summarising the complete study. The full study is reported in the following documents:
› Project Report
› Study Report 01: Power System Technical Analysis – Neplan
› Study Report 02: AEP & Financial Feasibility Analysis
› Study Report 03: Market & Regulatory Aspects
› Study Report 04: NEPLAN Training Package
The objective is reached by an inception mission to Colombia in April 2013 focusing on fact finding and collection of data and electrical system models for the existing power grid in Colombia.
Preliminary review and clarification questions were submitted to UMPE/IDB in May 2013.
UMPE provided wind data series from existing meteorological measurements mast for the Northern site and suitable models of power grid in the Neplan software in June – August 2013. Reliable wind data from the southern site at Santander have not been established consequently the annual energy production and the financial feasibility studies have been limited to the Northern site in the La Guajira area.
Desk studies, analysing and draft reporting for the various topics was implemented in July – November 2013.
Review and final revision of the study reports was completed by February 2013.
The findings and recommendations made by the Consultant were presented during a presentation and NEPLAN workshop held in Colombia during 17th – 21st March 2014.
Study report 02 & 03 were updated in April-May to consider the comments addressed by UMPE and IDB during the presentation in March 2014.

IMPACT ANALYSIS FOR INTEGRATION OF WIND POWER GENERATION IN COLOMBIA
PROJECT REPORT
O:\A035000\A038811\3_Pdoc\DOC\Project Report\38811-Project Report Rev 0 29Nov14.docx
11
Final revision of the Study Report 02 & 03 and this project report was issued in October 2014 based on the comments received.
12 IMPACT ANALYSIS FOR INTEGRATION OF WIND POWER GENERATION IN COLOMBIA PROJECT REPORT
O:\A035000\A038811\3_Pdoc\DOC\Project Report\38811-Project Report Rev 0 29Nov14.docx
2 Conclusions and Recommendations
2.1 Power System Impact
The impact on the power grid by introducing wind farm generation in three steps (100MW in 2013, 500MW in 2019, 1000 MW in 2025) has been investigated. Grid reinforcements imposed by the new wind farms in addition to the already anticipated in the prevailing grid reinforcement plan 2012-2025 are suggested for each scenario.
The power system study verifies that harmonic and transient impact from even the large wind farms not will cause grid instability or inacceptable voltage quality when the largest grid connected unit is kept below 200 MW (as per today).
It is established that wind farms with modern wind turbine design (Type 3 & Type 4) will support the power grid during fault conditions and not as the existing presently in operation at the Jepirachi windfarm (Type 1) cause difficulties for grid stability.
It is observed that no Grid Code is established for connection of large wind farms is in place for the Colombian power grid. Consequently, Consultant has established his own assumptions and general recommendations for such a future grid code as a basis for the power system analysis
2.2 Wind Resource and Financial Viability
Based on the analyses carried out for the site in the La Guajira area, it is found that with a mean wind speed of 8.2 m/s at 50 m above ground and estimated mean wind speed at 78 m hub height of 9.4 m/s and at 84 m hub height of 9.6 m/s, the area can be characterised as a medium-to-high wind area. Based on this it is concluded that from a wind resource point of view the area is suitable for further development of wind power projects.
For development of specific projects it is strongly recommended that a met mast of 60-80m is installed at the given site, and that data is measured for a period of no

IMPACT ANALYSIS FOR INTEGRATION OF WIND POWER GENERATION IN COLOMBIA
PROJECT REPORT
O:\A035000\A038811\3_Pdoc\DOC\Project Report\38811-Project Report Rev 0 29Nov14.docx
13
less than 12 months. This will provide a sound basis on which a wind study of bankable quality can be elaborated.
The financial analyses performed on the two wind farm scenarios (200 x2MW and 134 x 3MW units), based on information gathered from Colombian developers show that the project in the base case is considered financially viable. This applies to both wind type scenarios and to all cases investigated; pure investment (i.e. no financing included), base case market financing and alternative case market financing.
Sensitivity analyses show that the projects are very sensitive to changes in the tariff and in the investment cost. A change in the ENFICC also affects the financial viability, but to a lesser extent than the other two parameters.
Levelized cost of energy for the project has also been estimated. In order to reach the expectation of 10% IRR, the required tariff for the different cases would be:
Case USD/per MWh - 2MW USD/per MWh – 3 MW Pure investment 92.29 88.06 Base case market
financing 77.75 74.33
Alternative market financing
76.53 73.18
This shows that the tariff 89.7 USD per MWh (from the current average of the spot market price in 2013) is sufficient, in order to reach an IRR of 10%.
It is recommended to investigate the financial viability further in relation to a specific project for which specific wind data is available. This would provide a more firm basis for drawing firm conclusions.
2.3 Market & Regulatory Aspects
The Colombian electricity market
The high reliance of hydro power in the Colombian system poses challenges with regard to reliability during El Niño periods where drought substantially reduces hydroelectric generation with potentially serious consequences. This underlines the importance of having backup generation to replace hydro during El Niño periods. In addition to this, the expected increase in electricity demand of 2.8 - 3.8 % per year, together with the phasing out of existing power plants when they reach their end of lifetime implies that there will be a need for new power generation facilities.
Current framework for wind power
According to the current framework for wind power, wind turbines in Colombia receive, in addition to the revenue from electricity sale, also revenue from reliability charge and revenue from CERs (Certified Emission Reductions). They also have a fifteen-year tax-exemption period for power generated assuming that

14 IMPACT ANALYSIS FOR INTEGRATION OF WIND POWER GENERATION IN COLOMBIA PROJECT REPORT
O:\A035000\A038811\3_Pdoc\DOC\Project Report\38811-Project Report Rev 0 29Nov14.docx
they receive carbon emission certificates and assuming that 50 % of the income from this is invested locally in social benefit programs.
On the cost-side, wind turbines pay CERE (Real equivalent Cost of the Capacity Charge) and transmission/grid charges.
The current framework for wind power has not triggered any large-scale development of wind power in Colombia. For the specific wind sites analysed in this project, the financial analyses have also shown that these projects are not financially viable. The estimated IRR becomes far below the rate that developers expect.
Correlation and complementarity between wind and hydro
The analyses of the correlation and complementarity between wind and hydro in this study confirm that a complementarity between the Hydro and Wind resources exists. This report supports the findings already presented in studies completed in 2010 and 2012 (Ref. 4 & 5).
Three months (Jan/Feb/Mar) in general have normalised wind speed above its yearly average and normalised hydro inflow below the yearly average. (Apr having a high number of months being favourable wind months could also in general be considered as a favourable wind month as discussed later).
The study verifies that the average monthly wind energy production in general is higher during the El-Niño months compared with all months and the wet months "not El-Niño months". The complementarity reconfirmed could justify a changed methodology for the ENFICC.
Analysis of firm energy factor, ENFICC
CREG's present approach for determining the firm energy factor for wind energy does not consider the complementarity between the hydro and wind energy production. The findings in this report indicates:
› that the EFICC for the wind generation plants could be increased when the complementarity is taken into consideration
› that larger wind turbine units (compared with existing 1,3MW at Jepirachi) could justify an increase ≈ +5% of the ENFICC95%
› that an increased ENFICC95% (≈ +7%) could be justified based on the relatively higher wind energy production during the El-Niño months
The study has not been able to confirm the findings in previous reports (Ref. 4 & 5) that indicated higher ENFICC for a Wind/Hydro portfolio compared with two isolated Wind and Hydro generation plants

IMPACT ANALYSIS FOR INTEGRATION OF WIND POWER GENERATION IN COLOMBIA
PROJECT REPORT
O:\A035000\A038811\3_Pdoc\DOC\Project Report\38811-Project Report Rev 0 29Nov14.docx
15
Wind energy integration strategies
A key issue with regard to wind power in Colombia, and a barrier for large-scale deployment, is the financial viability of the wind projects.
The wind power development in Colombia could possibly be boosted if either a premium feed-in tariff of 10-20 % of the sales price or an investment grant of 10-20 % of the investment is being introduced. As the costs related to transmission and grid connection may correspond to app. 10 % of the total investment budget (CAPEX), wind projects would also be much more profitable if these costs were not born by the wind developer.
In addition to the financial aspects, it is important to remove barriers related to administration and grid access. Furthermore, it is important to ensure an effective operation of the power system in order to make the system more adaptable to larger shares of variable renewable power.
16 IMPACT ANALYSIS FOR INTEGRATION OF WIND POWER GENERATION IN COLOMBIA PROJECT REPORT
O:\A035000\A038811\3_Pdoc\DOC\Project Report\38811-Project Report Rev 0 29Nov14.docx
3 Power System Infrastructure Study
3.1 Objective
The objective of the power system study is to analyse the integration of wind power generation in Colombia and its impact on the power grid. The study comprises:
• Electrical modelling of wind turbines
• Electrical studies of two wind power projects connected to the Colombian power system.
The analysis has been performed on different schemes, such as the power system structure: large-scale projects connected to the transmission network.
• Guajira region 100 MW wind farm connected to power grid in year 2013 400 MW wind farm connected to power grid in year 2019 800 MW wind farm connected to power grid in year 2025
• Norte de Santander region 100 MW wind farm connected to power grid in year 2019 200 MW wind farm connected to power grid in year 2025
3.2 Wind turbine types
Wind turbines are electrically generally divided into two main technological categories being defined in IEC 61400 International standards series for wind turbines:
• Constant speed wind turbines, (Type 1 and 2) The constant speed wind turbines were installed used in 70s, 80s and 90s, and are built with squirrel cage (asynchronous) induction generators directly connected to the grid a simple, cheap and robust design. They have some disadvantage on supporting the grid and especially when the LVRT

IMPACT ANALYSIS FOR INTEGRATION OF WIND POWER GENERATION IN COLOMBIA
PROJECT REPORT
O:\A035000\A038811\3_Pdoc\DOC\Project Report\38811-Project Report Rev 0 29Nov14.docx
17
(low voltage right through) criteria are required and when reactive demands are imposed to the wind turbines. The blade control is often stall regulated wings. The LVRT criteria defines that the wind farm/turbines shall be able to stay connected to the grid during a voltage drop to 0% of the nominal voltage during at fault, of a typical duration 100-500 ms and within few seconds to resume to the pre fault power production.
Figure 1 Principle diagrams of the type 1 induction generator and type 2 Variable Rotor resistance
Induction generator wind turbine generator
• Variable speed turbines, (Type 3 and 4) The variable speed wind turbines are based on converters that began to be economical mid 90s and supported by the development of the modern computer for regulation of the power control. The wind turbines have a rotor speed that varies significant according to the prevailing wind conditions. The aerodynamic control of variable speed machines is based on blade pitch control. Two types of variable speed wind turbines are available on the marked today:
Figure 2a Principle diagram of the type 3 DFIG Double Fed Induction generator
DFIG wind turbine generator (Type 3) utilizing a Doubly-Fed Induction Generator (DFIG) and a rotor converter cascade of reduced rating. This wind turbine type was introduced in approximately 1995, when the converters were much more expensive than today. The design aimed at satisfying the more demanding power grid requirement on the wind turbines that were introduced by the transmission system operators.

18 IMPACT ANALYSIS FOR INTEGRATION OF WIND POWER GENERATION IN COLOMBIA PROJECT REPORT
O:\A035000\A038811\3_Pdoc\DOC\Project Report\38811-Project Report Rev 0 29Nov14.docx
Figure 3b Principle diagrams of the type 4 Full Scale converter generator wind turbine
The full scale power converter (Type 4) utilizing a synchronous or induction generator effectively separated from the grid via a full-power converter. This type is especially useful when connected to a weak power grid or when the wind turbine size is above 2.3 MW and uses gearbox.
3.3 Grid Code Assumptions/Recommendations
When wind turbines are installed in large scale a grid code defining specific requirements on the wind turbines is recommended to secure an optimal operation of the power grid and to minimize the overall system costs.
The grid code should as a minimum regulate the following operational aspects:
› Terminology and definitions
› Voltage and frequency operating range
› Electricity quality
› Reactive power control and voltage regulation
› Active power and frequency control
› Fault ride through requirements, LVRT
› Requirements for reactive current supply during voltage dips
› Protection
› Data communication and exchange of signals
› Verification and documentation
The basic assumptions made in the study is that the wind turbines can produce at a power factor 1 and that the wind farm will stay connected to the grid during grid failures (LVRT criteria).
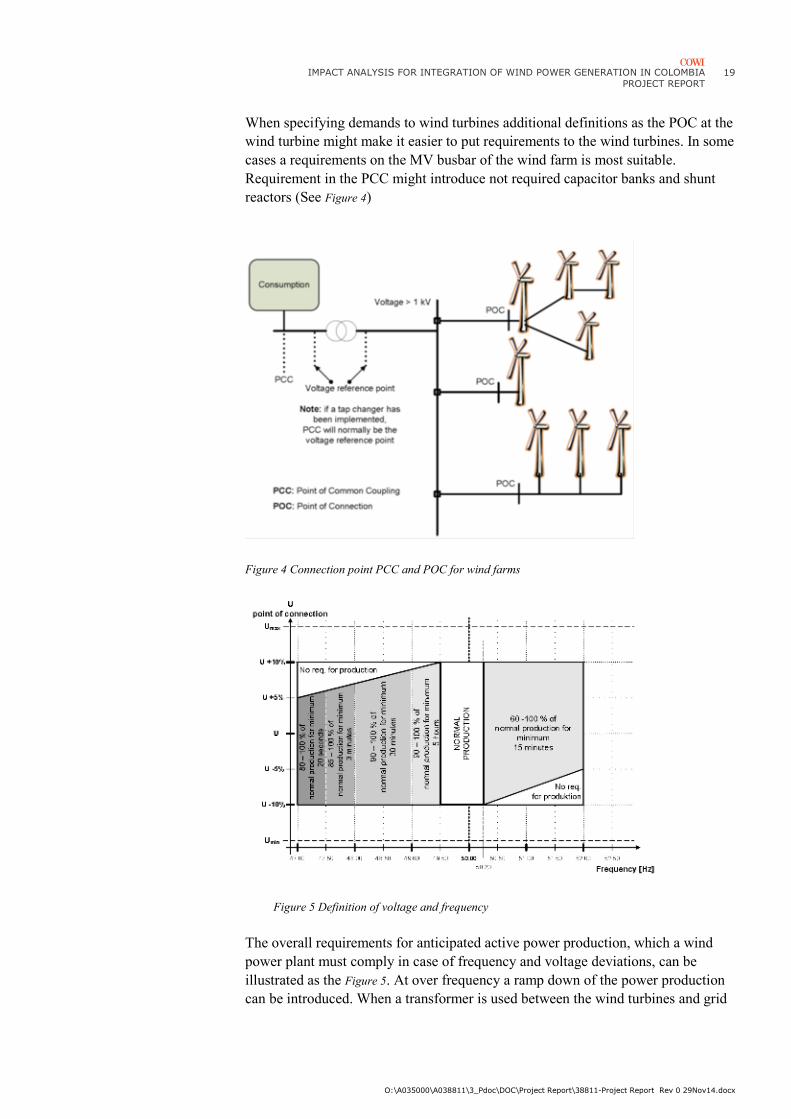
3.3.1 The connection of the wind farm at the PCC point
The PCC point is defined on the HV side of the wind farm substation transformer. Determining the PCC is important and must be clearly defined prior to the design and planning of any wind farm development. The PCC constitutes the reference point for the grid code requirements for the wind farm.
The PCC point could also be at the metering point on the busbar where the wind farm is connected.
IMPACT ANALYSIS FOR INTEGRATION OF WIND POWER GENERATION IN COLOMBIA
PROJECT REPORT
O:\A035000\A038811\3_Pdoc\DOC\Project Report\38811-Project Report Rev 0 29Nov14.docx
19
When specifying demands to wind turbines additional definitions as the POC at the wind turbine might make it easier to put requirements to the wind turbines. In some cases a requirements on the MV busbar of the wind farm is most suitable. Requirement in the PCC might introduce not required capacitor banks and shunt reactors (See Figure 4)
Figure 4 Connection point PCC and POC for wind farms
Figure 5 Definition of voltage and frequency
The overall requirements for anticipated active power production, which a wind power plant must comply in case of frequency and voltage deviations, can be illustrated as the Figure 5. At over frequency a ramp down of the power production can be introduced. When a transformer is used between the wind turbines and grid
20 IMPACT ANALYSIS FOR INTEGRATION OF WIND POWER GENERATION IN COLOMBIA PROJECT REPORT
O:\A035000\A038811\3_Pdoc\DOC\Project Report\38811-Project Report Rev 0 29Nov14.docx
PCC a tap changer often adjusts the voltage level on the MV/wind turbine side and larger voltage variations might be possible.
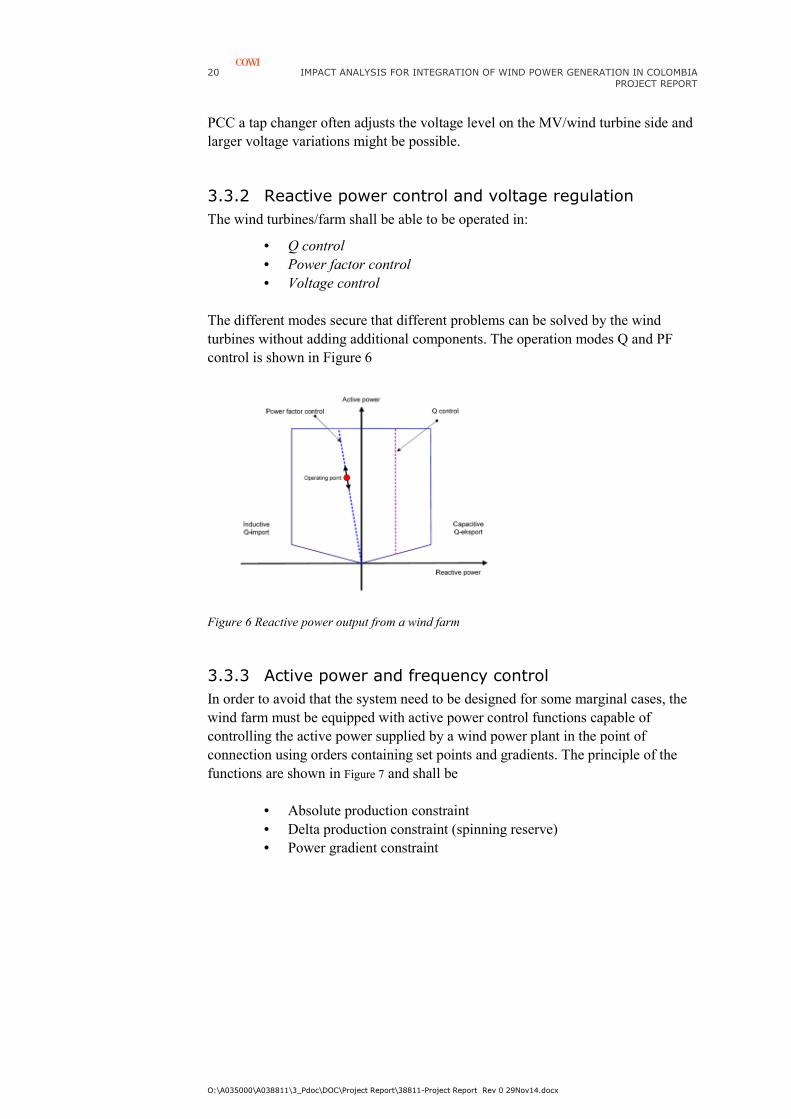
3.3.2 Reactive power control and voltage regulation
The wind turbines/farm shall be able to be operated in:
• Q control • Power factor control • Voltage control
The different modes secure that different problems can be solved by the wind turbines without adding additional components. The operation modes Q and PF control is shown in Figure 6
Figure 6 Reactive power output from a wind farm
3.3.3 Active power and frequency control
In order to avoid that the system need to be designed for some marginal cases, the wind farm must be equipped with active power control functions capable of controlling the active power supplied by a wind power plant in the point of connection using orders containing set points and gradients. The principle of the functions are shown in Figure 7 and shall be
• Absolute production constraint • Delta production constraint (spinning reserve) • Power gradient constraint

IMPACT ANALYSIS FOR INTEGRATION OF WIND POWER GENERATION IN COLOMBIA
PROJECT REPORT
O:\A035000\A038811\3_Pdoc\DOC\Project Report\38811-Project Report Rev 0 29Nov14.docx
21
Figure 7 Definition of power control action
3.3.4 Requirements for LVRT during voltage dips
In order to rely on wind farms as a system component it shall stay connected when a failure occurs in the power grid. The wind turbines shall be designed to withstand voltage drops, as shown in Figure 8 also called the LVRT capability.
• Area A is normal operation area. • Area B is the voltage dip for the wind turbines where the wind turbines
shall maintain reactive power support. • Area C is the area where the wind turbine is allowed to disconnect.
Figure 8 LVRT definition
22 IMPACT ANALYSIS FOR INTEGRATION OF WIND POWER GENERATION IN COLOMBIA PROJECT REPORT
O:\A035000\A038811\3_Pdoc\DOC\Project Report\38811-Project Report Rev 0 29Nov14.docx
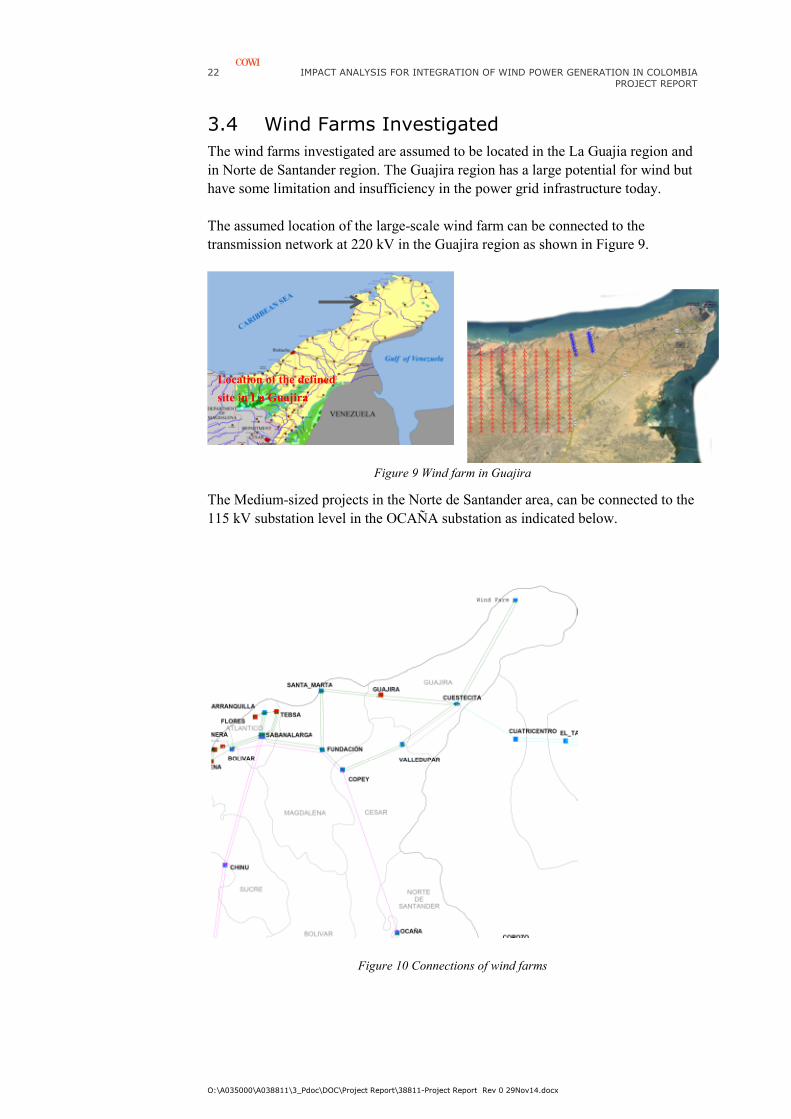
3.4 Wind Farms Investigated
The wind farms investigated are assumed to be located in the La Guajia region and in Norte de Santander region. The Guajira region has a large potential for wind but have some limitation and insufficiency in the power grid infrastructure today.
The assumed location of the large-scale wind farm can be connected to the transmission network at 220 kV in the Guajira region as shown in Figure 9.
Figure 9 Wind farm in Guajira
The Medium-sized projects in the Norte de Santander area, can be connected to the 115 kV substation level in the OCAÑA substation as indicated below.
Figure 10 Connections of wind farms
Location of the defined
site in La Guajira

IMPACT ANALYSIS FOR INTEGRATION OF WIND POWER GENERATION IN COLOMBIA
PROJECT REPORT
O:\A035000\A038811\3_Pdoc\DOC\Project Report\38811-Project Report Rev 0 29Nov14.docx
23
3.5 Power system analysis findings
3.5.1 Recommended Grid Reinforcement Plan
o Wind farm Scenario, year 2013, see Figure 11 The steady state analysis for year 2013 do not reveal reinforcement need of the network except for the grid connection of the wind farm to the Cuestecita busbar. The Grid connection of wind farms comprises of
� A new substation at wind farm � A new 150 km 230 kV overhead line (Single system)) to
the existing Cuestercita substation � One new 230 kV line bay in Cuestercita
o Power Grid Reinforcement: None
Figure 11 Wind farm scenario 2013
• Wind farm Scenario, year 2019
o The steady state analysis for year 2019 Grid connection of Wind farms
� Extension of wind farm substation � 230 kV overhead line to Cuestercita upgraded double
system � One new 230 kV line bay in Cuestercita

24 IMPACT ANALYSIS FOR INTEGRATION OF WIND POWER GENERATION IN COLOMBIA PROJECT REPORT
O:\A035000\A038811\3_Pdoc\DOC\Project Report\38811-Project Report Rev 0 29Nov14.docx
� Five 34.5 kV overhead lines and switchgear in Ocaña substation
o Power Grid Reinforcement The steady state analysis 2019 identifies the following grid reinforcement
� two additional 116 km 230 kV power lines from Valledupar SS to Cuestecita SS
� one additional 39 MVAr reactor and 39 MVAr capacitor shall be installed in Cuestecita SS when 400 MW wind farm generation is connected to the Cuestecita SS
� the general need for reactive power in the area could justify an SVC in the COPEY SS 500kV station and a second 500/230 kV transformer is required.
� A 230 kV second circuit Guajira-Santa Marta is required, and with additional MVAr support in Santa Marta SS. Thus a 60 MVAr capacitor bank is suggested in Santa Marta SS. Alternatively the reactive power to Santa Marta SS could be secured by a new parallel 230 kV circuit between Santa-Marta SS and Termocol SS.
Figure 12 Wind farm scenario 2019
o Wind farm Scenario, 2025Grid connection of Wind farms
Connecting 400+400 MW to the Cuestecita SS will demand � one additional 39 MVAr reactor and 58 MVAr capacitor
in Cuestecita SS.
IMPACT ANALYSIS FOR INTEGRATION OF WIND POWER GENERATION IN COLOMBIA
PROJECT REPORT
O:\A035000\A038811\3_Pdoc\DOC\Project Report\38811-Project Report Rev 0 29Nov14.docx
25
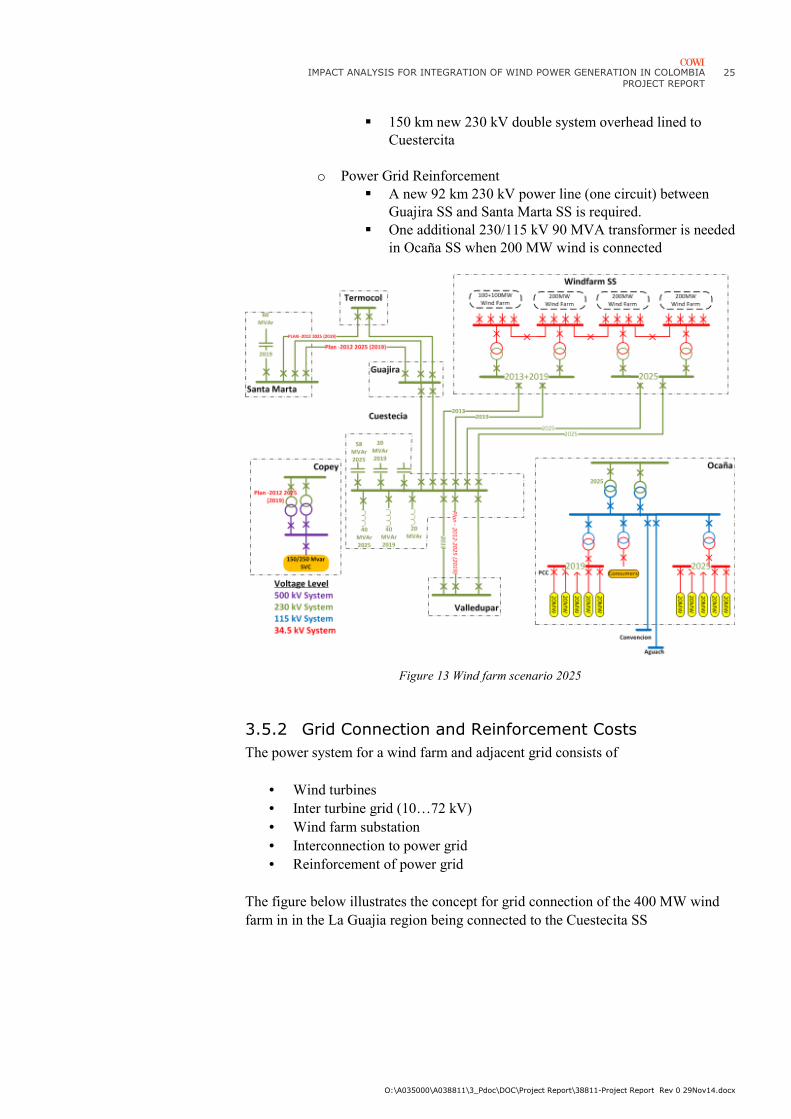
� 150 km new 230 kV double system overhead lined to Cuestercita
o Power Grid Reinforcement � A new 92 km 230 kV power line (one circuit) between
Guajira SS and Santa Marta SS is required. � One additional 230/115 kV 90 MVA transformer is needed
in Ocaña SS when 200 MW wind is connected
Figure 13 Wind farm scenario 2025
3.5.2 Grid Connection and Reinforcement Costs
The power system for a wind farm and adjacent grid consists of
• Wind turbines • Inter turbine grid (10…72 kV) • Wind farm substation • Interconnection to power grid • Reinforcement of power grid
The figure below illustrates the concept for grid connection of the 400 MW wind farm in in the La Guajia region being connected to the Cuestecita SS

26 IMPACT ANALYSIS FOR INTEGRATION OF WIND POWER GENERATION IN COLOMBIA PROJECT REPORT
O:\A035000\A038811\3_Pdoc\DOC\Project Report\38811-Project Report Rev 0 29Nov14.docx
Figure 14 Principles of wind farm grid connection
The smaller wind farms connected to Ocaña SS will only have the cost to connect to the 34,5 kV grid, and to some extent the 34,5/110 kV transformer, while the transmission system operator shall be responsible for the upgrade of the power grid and the substation.
The larger wind farms in the Guajira region have the costs for the new wind farm substation and transmission lines to the Cuestecita substation. Costs of all additional equipment in Cuestecita and the grid are covered by the transmission system operator.
The table below summarises the cost budget for the wind farm grid interconnection components (paid by the wind farm developer and the power grid reinforcements components paid by the TSO).

IMPACT ANALYSIS FOR INTEGRATION OF WIND POWER GENERATION IN COLOMBIA
PROJECT REPORT
O:\A035000\A038811\3_Pdoc\DOC\Project Report\38811-Project Report Rev 0 29Nov14.docx
27
Table 1 Cost estimate on grid connection wind
The individual costs are divided so new adjustments on the cost can be made when UPME decides the exact spilt of cost for these wind projects
• Wind farm scenario, year 2013 The 100 MW wind farm in the Guajira region will in 2013 only have grid connection costs for the connection in Cuestecita . (Ref. Figure 11)
• Wind Farm Scenario, year 2019 The additional 300 MW in Guajira (+100 MW in 2013) + 5x20 MW in Ocaña will have the transmission related costs as shown in Table 1. The 400 MW wind in Guajira will also result in an additional double circuit transmission line between Cuestecita and Valledupar. In the Plan de Expansión de Referencia Generación – Transmisión 2012-2025 a single circuit was assumed already, so the additional costs on upgrading the
28 IMPACT ANALYSIS FOR INTEGRATION OF WIND POWER GENERATION IN COLOMBIA PROJECT REPORT
O:\A035000\A038811\3_Pdoc\DOC\Project Report\38811-Project Report Rev 0 29Nov14.docx
transmission line from single system to double system is related to the wind integration.
The lack of reactive power support in the north observed in the Plan de Expansión de Referencia Generación – Transmisión 2012-2025 have been addressed. This study suggest the Copey station as a suitable place for the expansion with a SVC.
From 2019 to 2025 the wind 400MW+100MW is doubled to a total of 1000 MW + Jepirachi wind farm. Since the load also increases in the area the most of the grid is sufficient.
3.5.3 400 MW Wind farm - La Guajia Region
The steady state load flow has been carried out for 2013 with 100 MW wind, for 2019 with 400 MW wind and for 2025 with 800 MW wind. The study carried out for the three years are similar, but in this summary the 400 MW in 2019 is discussed in detail.
3.5.3.1 Steady state load flow
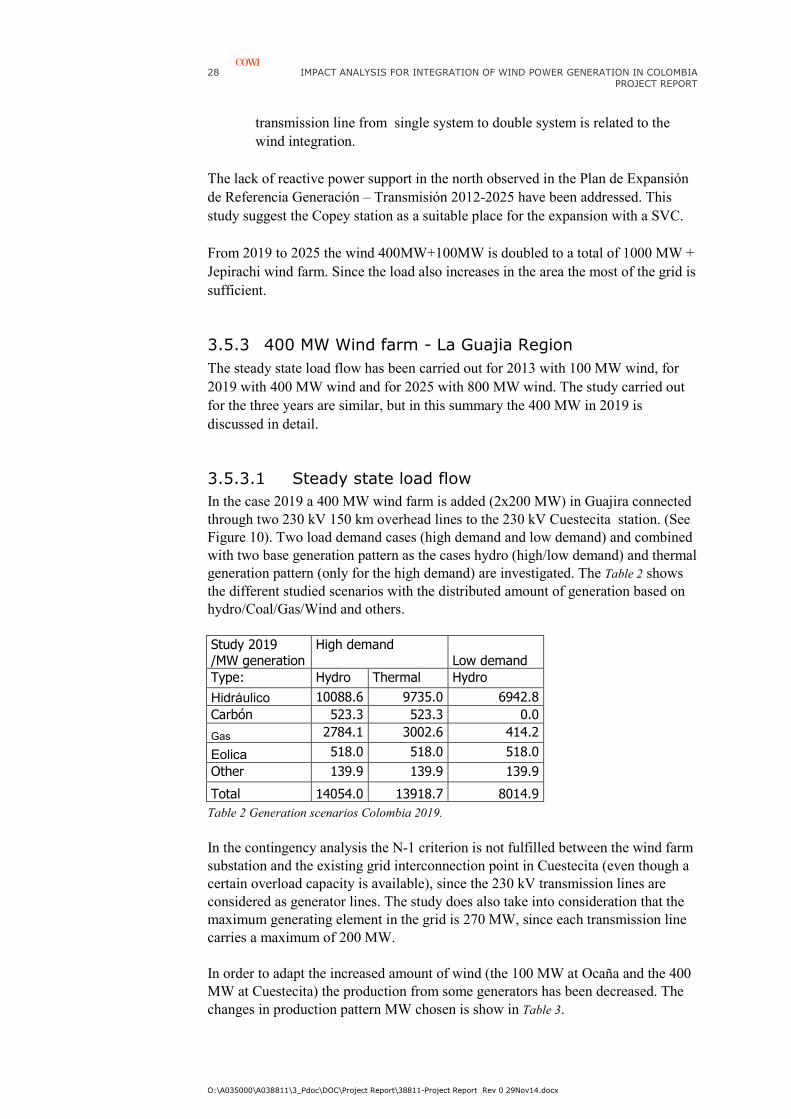
In the case 2019 a 400 MW wind farm is added (2x200 MW) in Guajira connected through two 230 kV 150 km overhead lines to the 230 kV Cuestecita station. (See Figure 10). Two load demand cases (high demand and low demand) and combined with two base generation pattern as the cases hydro (high/low demand) and thermal generation pattern (only for the high demand) are investigated. The Table 2 shows the different studied scenarios with the distributed amount of generation based on hydro/Coal/Gas/Wind and others. Study 2019 /MW generation
High demand Low demand
Type: Hydro Thermal Hydro
Hidráulico 10088.6 9735.0 6942.8 Carbón 523.3 523.3 0.0
Gas 2784.1 3002.6 414.2
Eolica 518.0 518.0 518.0
Other 139.9 139.9 139.9
Total 14054.0 13918.7 8014.9 Table 2 Generation scenarios Colombia 2019.
In the contingency analysis the N-1 criterion is not fulfilled between the wind farm substation and the existing grid interconnection point in Cuestecita (even though a certain overload capacity is available), since the 230 kV transmission lines are considered as generator lines. The study does also take into consideration that the maximum generating element in the grid is 270 MW, since each transmission line carries a maximum of 200 MW. In order to adapt the increased amount of wind (the 100 MW at Ocaña and the 400 MW at Cuestecita) the production from some generators has been decreased. The changes in production pattern MW chosen is show in Table 3.

IMPACT ANALYSIS FOR INTEGRATION OF WIND POWER GENERATION IN COLOMBIA
PROJECT REPORT
O:\A035000\A038811\3_Pdoc\DOC\Project Report\38811-Project Report Rev 0 29Nov14.docx
29
Table 3 Generation changes scenarios Colombia 2019
Figure 15 2019 Cuestecita maximum load, hydro generation no wind
The connecting lines to the wind farm increase the additional reactive power generation with 70 MVAr during no load conditions. Consequently, an additional reactor 39 MVAR at the Cuestecita substation is needed to control the voltage in the area.
Figure 16 2019 Cuestecita maximum load, hydro generation wind
Two additional power lines between Cuestecita and Valledupar (22+23) are necessary at full wind production to evacuate the power at high load to fulfil the N-1 criterion on these lines. When the wind farm is at full production the transmission lines consumes reactive power and demand an installation of one additional capacitor bank sized 39 MVAr in Cuestecita.
GENERACIÓN ELECTRICA 2019 NEPLANChanges is production Large demand Low demand
Base Wind Base Wind Base WindCENTRAL COMBUSTIBLE Hydro Hydro Thermal Thermal Hydro Hydro
SAN CARLOS GENERADOR H 108 374 163 130 447 111
GUAVIO GENERADOR H 1085 868 1067 853 808 646CHIVOR GENERADOR H 888 666 880 660 0 0TERMO SIERRA G 269 163 269 269 0 0TERMOFLORES GENERA. G 132 20 132 132 0 0
MENOR JEPIRACHI EOLICA 11 18 11 18 11 18Wind farm HONDA EOLICA 0 400 0 400 0 400Wind farm OCAÑA EOLICA 0 100 0 100 0 100
Total 13939 14054 13878 13919 8006 8015
Guajira 21+22 Valledupar 21+22+23
30 IMPACT ANALYSIS FOR INTEGRATION OF WIND POWER GENERATION IN COLOMBIA PROJECT REPORT
O:\A035000\A038811\3_Pdoc\DOC\Project Report\38811-Project Report Rev 0 29Nov14.docx
Figure 17 2019 Cuestecita maximum load, thermal generation, wind
The thermal generation case as well indicates that two overhead lines from Cuestecita to Valledupar are needed.
The detailed report the 2013 load flows study includes the four cases with hydro and thermal generation both with high and low load and for 2025 for one case with hydro generation and high load.
3.5.3.2 Contingency analysis
The contingency analysis is based on the effects of outages on lines/elements, which are most influenced by the major wind farm in Guajira. The contingency analysis identifies line/elements that are violated primarily in the Guajira-CESAR-Magdalena area and Bolivar area. The concern in the analysis is the voltage and the load at 230 and 500 kV voltage level.
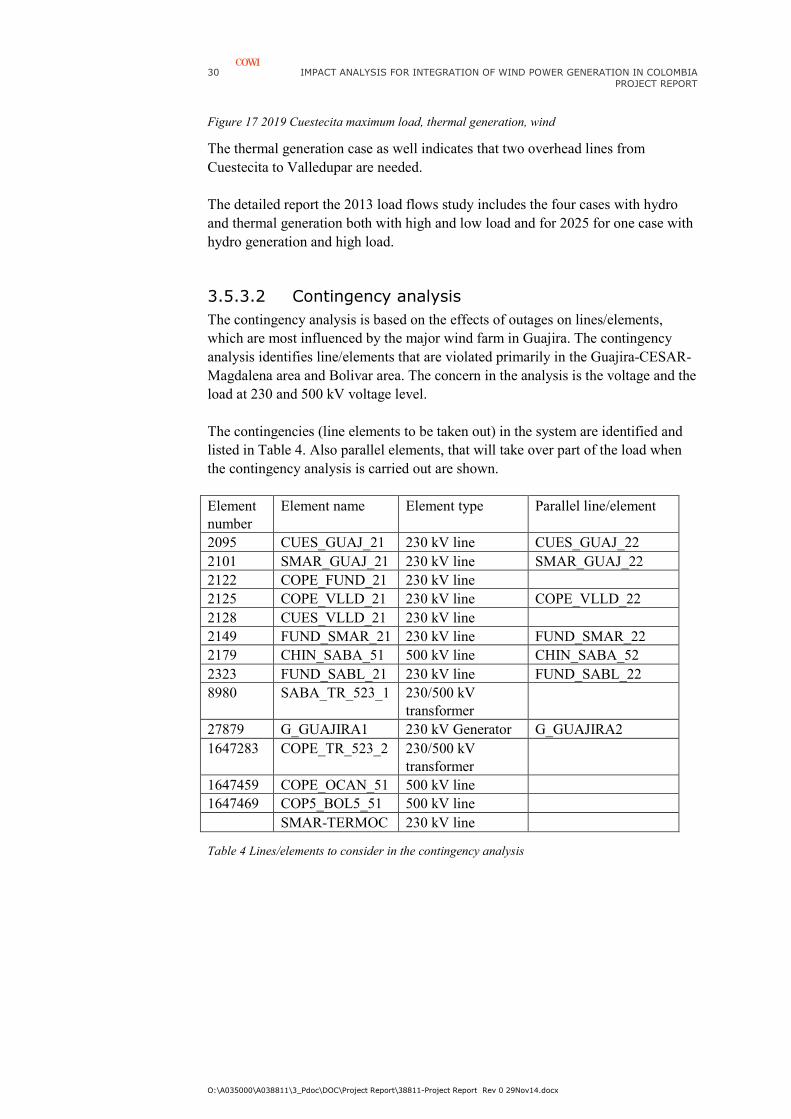
The contingencies (line elements to be taken out) in the system are identified and listed in Table 4. Also parallel elements, that will take over part of the load when the contingency analysis is carried out are shown.
Element number
Element name Element type Parallel line/element
2095 CUES_GUAJ_21 230 kV line CUES_GUAJ_22 2101 SMAR_GUAJ_21 230 kV line SMAR_GUAJ_22 2122 COPE_FUND_21 230 kV line 2125 COPE_VLLD_21 230 kV line COPE_VLLD_22 2128 CUES_VLLD_21 230 kV line 2149 FUND_SMAR_21 230 kV line FUND_SMAR_22 2179 CHIN_SABA_51 500 kV line CHIN_SABA_52 2323 FUND_SABL_21 230 kV line FUND_SABL_22 8980 SABA_TR_523_1 230/500 kV
transformer
27879 G_GUAJIRA1 230 kV Generator G_GUAJIRA2 1647283 COPE_TR_523_2 230/500 kV
transformer
1647459 COPE_OCAN_51 500 kV line 1647469 COP5_BOL5_51 500 kV line SMAR-TERMOC 230 kV line
Table 4 Lines/elements to consider in the contingency analysis

IMPACT ANALYSIS FOR INTEGRATION OF WIND POWER GENERATION IN COLOMBIA
PROJECT REPORT
O:\A035000\A038811\3_Pdoc\DOC\Project Report\38811-Project Report Rev 0 29Nov14.docx
31
Table 5 Contingency 2019 high load, thermal generation, wind and selected elements
Table 5 shows the load element in the cotingency analysis and the amount the criteria is violated 100 is rated load or voltage. Not all investigated contingency cases in Table 5 were converted. 34 violations as most for one outage were reported. No violation on 230 kV and 500 kV power grid elements is identified. The COPE_TR_523_2 500/230 kV transformer did not convert in the Neplan study implemented with the model provided. Consequently, it is not shown in the table. The non-conversion indicates the need of an additional 50/230 kV transformer in COPE wich is included in the Plan, Generation – Transmission, 2012-2025.
Table 6 Contingency 2019 low load, hydro generation, wind and selected elements
Not all investigated contingency cases in Table 6 were converted. 241 violations most for one outage were reported. No violation on 230 kV and 500 kV level were identified. In many cases the wind production lowers the load in the power grid compared with the base case without wind. Only a few additional grid components are required.
3.5.3.3 Dynamic analysis
The dynamic analysis investigating if the wind farm turbines are able to stay connected after a failure, if the wind farm is oscillating with any of the existing generators and if the oscillation is damped. The dynamic analysis is also used to investigate the voltage variations due to loss of the wind farm and variations in voltage and reactive power consumption.
1 2 3 4 5 6 7 8 9 10 11
Disconnect
Element\
Voltage
kV Area Type
Without
wind
With
wind
CUES_GUAJ
_21
COPE_FUND
_21
FUND_SAB
L_21
CUES_VLLD
_21
FUND_SMAR_
21
CHIN_SABA_
51
COPE_
VLLD_
21
SABA_
TR_523
_1
COPE_
OCAN
_51
COP5_
BOL5_5
1
G_GUA
JIRA1
SABL_TR_211 230/110 COSTA-ATLANTICO3W Transformer NA 124.2 124.1 124.6 124.4 124.3 124.2 124.1 124.2 124.3 124.2 124.4 124.0
SABN_BARA_11 110 COSTA-ATLANTICO Line NA 113.6 113.6 114.0 113.8 113.7 113.6 113.6 113.7 113.7 113.6 113.8 113.4
FLOR_TR_13_1 110/34,5 COSTA-ATLANTICO2W Transformer NA 104.4 104.4 104.4 104.4 104.4 104.4 104.4 104.4 104.4 104.4 104.4 104.4
FLOR_TR_13_2 110/34,5 COSTA-ATLANTICO2W Transformer NA 104.4 104.4 104.4 104.4 104.4 104.4 104.4 104.4 104.4 104.4 104.4 104.4
COP_SVC11 11 COSTA-GCM Node NA 119.0 120.9 117.0 118.9 120.0 119.3 118.0 119.3 119.0 115.4 112.6 118.0
CODAZZI110 110 COSTA-GCM Node 90.6 86.9 87.1 87.0 87.0 88.2 88.0 88.9 88.1 89.0 87.4 88.4 88.4
LAJAGUA110 110 COSTA-GCM Node 85.4 78.2 78.3 78.2 78.3 79.6 79.5 80.5 79.5 80.5 78.7 79.9 79.9
LA_LOMA110 110 COSTA-GCM Node 83.4 75.0 75.2 75.1 75.1 76.6 76.4 77.5 76.4 77.5 75.6 76.9 76.9
COP_SVC_TR_511 500/11 COSTA-GCM 2W Transformer NA 127.4 146.2 108.2 126.8 136.8 130.2 118.1 130.5 127.9 118.0
CUES_RIOH_11 110 COSTA-GCM Line NA 132.3 131.7 134.2 132.2 133.4 133.3 132.2 133.5 132.2 131.9 132.7 132.8
TR2-VALLEDUP 230/115 COSTA-GCM 2W Transformer NA 127.6 128.9 129.0 127.6 128.4 127.3 125.8 131.3 125.8 126.9 126.6 125.3
CODZ_VLLD_11 110 COSTA-GCM Line NA 128.0 127.8 127.9 127.8 125.7 126.0 124.3 125.9 124.3 127.2 125.2 125.2
SALG_VLLD_31 35 COSTA-GCM Line NA 124.7 126.3 126.4 126.4 124.9 125.1 123.9 125.0 123.9 124.1 124.6 124.6
TR1-VALLEDUP_13 110/34,5 COSTA-GCM 2W Transformer NA 106.9 108.3 108.3 108.3 107.0 107.2 106.2 107.2 106.2 106.4 106.8 106.8
SMAR_TR_213_2 230/115 COSTA-GCM 3W Transformer NA 101.4 101.5 101.5 101.3 102.4 104.4 101.4 102.3 101.4 101.5 101.4
SMAR_TR_213_1 230/115 COSTA-GCM 3W Transformer NA 101.4 101.5 101.5 101.3 102.4 104.4 101.4 102.3 101.4 101.5 101.4
Base case full gridThermal max 2019
1 2 3 4 5 6 7 8 9 10 11 12
Disconnect
Element\
Voltage
kV Area Type
Without
wind
With
wind
COPE_TR_5
23_2
COPE_VLLD_
21
CUES_VLLD
_21
CUES_GUAJ
_21
SABA_TR_523
_1
FUND_SABL_
21
COPE_
FUND
FUND_
SMAR_
G_GU
AJIRA
CHIN_S
ABA_5
COPE_
OCAN
COP5_
BOL5_
TENERIFE66 66 COSTA-BOLIVAR Node 93.1 115.8 115.5 115.8 115.8 115.8 115.7 115.7 115.8 115.9 115.9 115.4 115.2 112.8
CALAMAR66 66 COSTA-BOLIVAR Node 92.8 107.4 107.1 107.4 107.4 107.4 107.3 107.3 107.4 107.5 107.5 107.0 106.8
BOLIVAR66 66 COSTA-BOLIVAR Node NA 107.0 106.8 107.0 107.0 107.0 106.9 106.9 107.0 107.0 107.0 106.7 106.5
VILLAESTRELLA66 66 COSTA-BOLIVAR Node NA 106.1 105.8 106.0 106.0 106.0 106.0 106.0 106.0 106.1 106.1 105.7 105.6
S_JACINT66 66 COSTA-BOLIVAR Node 94.9 105.4 105.1 105.4 105.4 105.4 105.3 105.3 105.4 105.4 105.5 105.0
VALLEDUPAR34.5_3 35 COSTA-GCM Node 95.6 95.4 88.2
LAJAGUA110 110 COSTA-GCM Node 85.4 83.3 74.3 77.8 81.2 80.6 83.2 83.3 83.1 82.9 84.6 83.1 82.4 83.0
LA_LOMA110 110 COSTA-GCM Node 83.4 80.9 71.6 75.3 78.9 78.2 80.9 81.0 80.8 80.6 82.3 80.7 80.1 80.7
CODZ_VLLD_11 110 COSTA-GCM Line NA 98.1 110.1 105.0 100.6 101.3
CUES_RIOH_11 110 COSTA-GCM Line NA 101.2 107.6 104.9 103.7 104.2 101.2 101.2 101.3 101.6 101.4 101.8 101.4
SALG_VLLD_31 35 COSTA-GCM Line NA 97.0 105.8 102.2
TR2-VALLEDUP 230/115 COSTA-GCM 2W Transformer NA 93.7 103.9
Base case full gridHydro min 2019

32 IMPACT ANALYSIS FOR INTEGRATION OF WIND POWER GENERATION IN COLOMBIA PROJECT REPORT
O:\A035000\A038811\3_Pdoc\DOC\Project Report\38811-Project Report Rev 0 29Nov14.docx
The dynamic studies have been done for the 2013, 2019 and 2025 cases.
For the 2019 case the discussion on the reactive power capability support (voltage) from the wind farm is important.
• Case A: 3-phase short circuit fault on 230 kV line “Cuestecita and Guajira”
Figure 18 2019 failure on the Cuestecita Guajira transmission line, voltages
A 3 phase short circuit fault at 0.1 s is applied in the middle of one of the overhead power transmission lines between Cuestecita and Guajira. The transmission line is disconnected in both ends after 250 ms at 0.35 s, see Figure 18. The power from the wind farms is restored at approximately 0.7 pu of the original power after the fault is cleared and ramped up to full power within 3 seconds.The second transmission line between Cuestecita and Guajira takes the power. It is observed that no large or fatal oscillations occur between the wind farms generators and the existing generators. It is also observed that no voltage violations occur at the observed lines.
The voltage fluctuations at Ocaña are quite small and are not expected to impose problems for the continued operation of the system. (See Figure 18 and Figure 19).
Figure 19 2019 failure on the Cuestecita Guajira transmission line, power

IMPACT ANALYSIS FOR INTEGRATION OF WIND POWER GENERATION IN COLOMBIA
PROJECT REPORT
O:\A035000\A038811\3_Pdoc\DOC\Project Report\38811-Project Report Rev 0 29Nov14.docx
33
Figure 20 2019 failure on the Cuestecita Valledupar transmission line, voltage
• Case B: 3-phase short circuit fault on 230 kV line “Cuestecita and Valledupar” A 3 phase short circuit fault at 0.1 s is applied in the middle of one of the overhead power transmission lines between Cuestecita and Valledupar and the transmission line is disconnected in both ends after 250 ms at 0.35 s, see Figure 20. The power from the wind farm is restored at approximately 0.8 pu after the fault is cleared and ramped up to full power within 1.5 second, see Figure 21. The two remaining transmission lines between Cuestecita and Valledupar increase their power. It can also be seen that no big oscillations occurs between the wind farm generators and the existing generators. See Figure 20 and Figure 21. There are inter-area oscillations on the 500 kV level.
Figure 21 2019 failure on the Cuestecita Valledupar transmission line, power
34 IMPACT ANALYSIS FOR INTEGRATION OF WIND POWER GENERATION IN COLOMBIA PROJECT REPORT
O:\A035000\A038811\3_Pdoc\DOC\Project Report\38811-Project Report Rev 0 29Nov14.docx
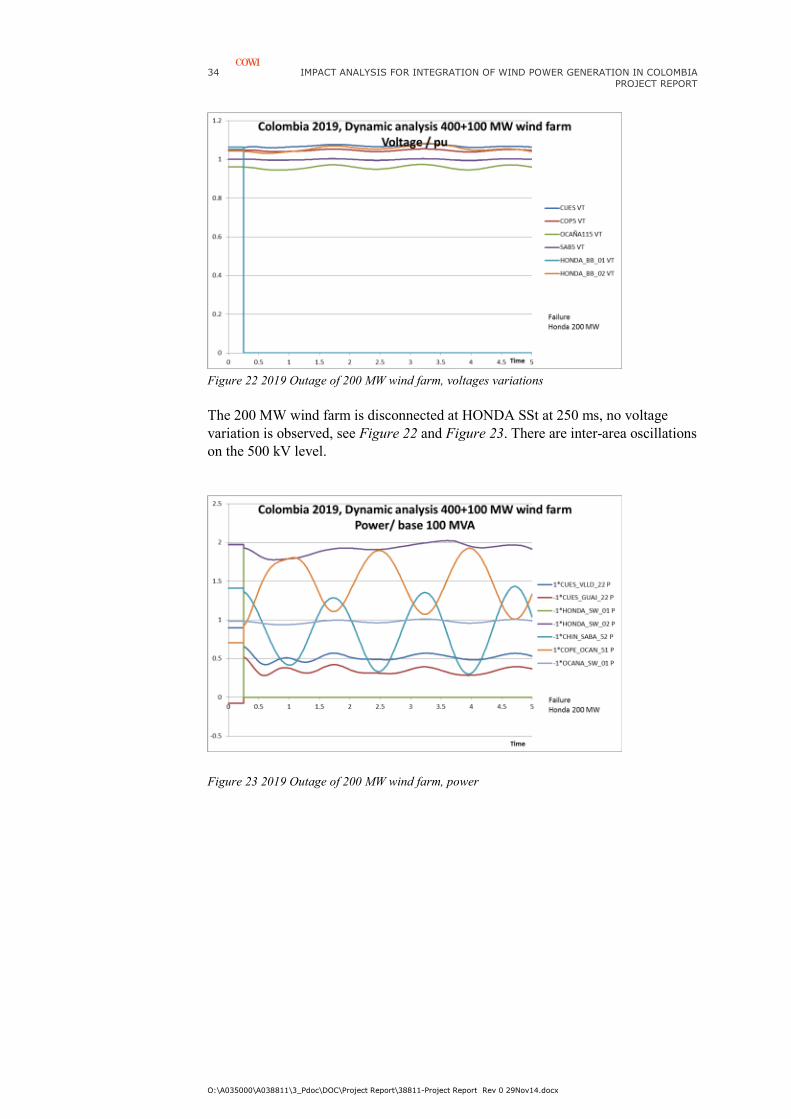
Figure 22 2019 Outage of 200 MW wind farm, voltages variations
The 200 MW wind farm is disconnected at HONDA SSt at 250 ms, no voltage variation is observed, see Figure 22 and Figure 23. There are inter-area oscillations on the 500 kV level.
Figure 23 2019 Outage of 200 MW wind farm, power
IMPACT ANALYSIS FOR INTEGRATION OF WIND POWER GENERATION IN COLOMBIA
PROJECT REPORT
O:\A035000\A038811\3_Pdoc\DOC\Project Report\38811-Project Report Rev 0 29Nov14.docx
35
3.5.3.4 Frequency analysis
The frequency analyses investigate the impact if a generating unit or a transmission line is disconnected from the power grid due to faulty operation. This study assumes that the wind farm are designed with a separate grid connection rated maximum 200MW, being smaller than the largest production unit in Colombia today.
It has not been possible to perform the frequency analysis for the complete Colombian power system, due to malfunctioning of the delivered dynamic model of the power system. Thus, the focus has been describing power variations with measurements originating from two similar and existing wind farm in the same size. The two Danish wind farms (Nysted 165 MW and Rødsand 2 207 MW) are feeding into the same grid connection point at 132 kV and only geographically separated by 4 km.
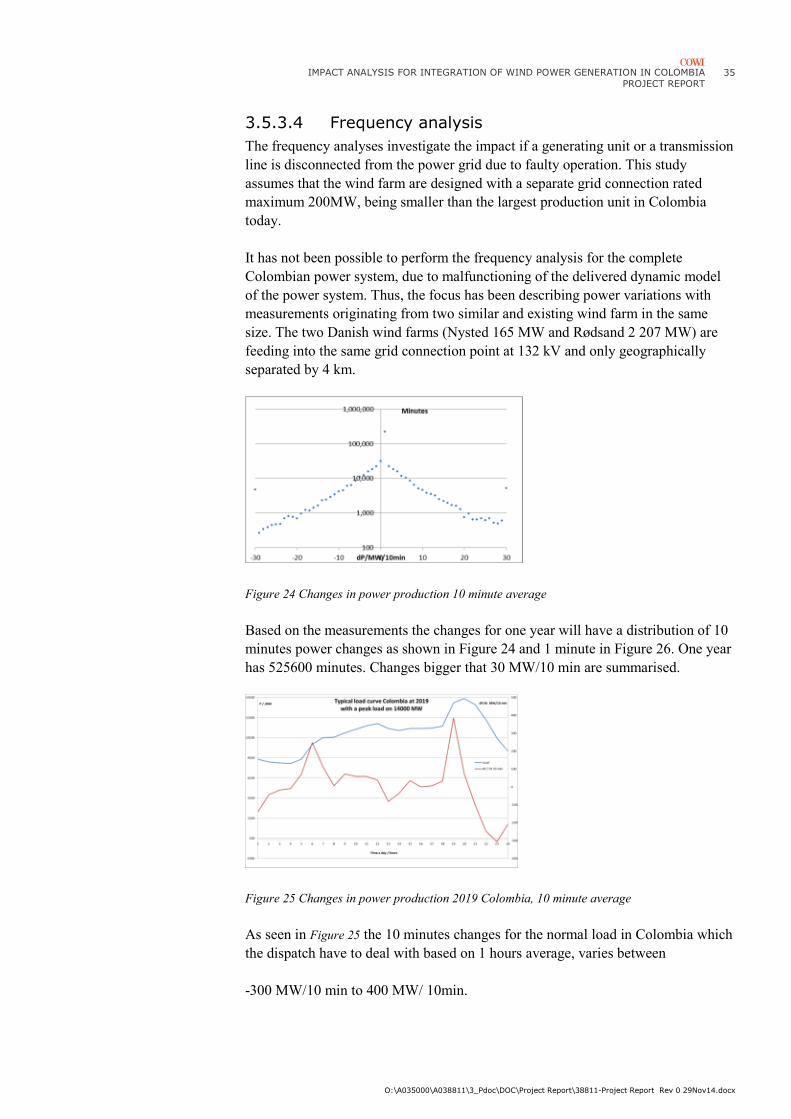
Figure 24 Changes in power production 10 minute average
Based on the measurements the changes for one year will have a distribution of 10 minutes power changes as shown in Figure 24 and 1 minute in Figure 26. One year has 525600 minutes. Changes bigger that 30 MW/10 min are summarised.
Figure 25 Changes in power production 2019 Colombia, 10 minute average
As seen in Figure 25 the 10 minutes changes for the normal load in Colombia which the dispatch have to deal with based on 1 hours average, varies between
-300 MW/10 min to 400 MW/ 10min.
36 IMPACT ANALYSIS FOR INTEGRATION OF WIND POWER GENERATION IN COLOMBIA PROJECT REPORT
O:\A035000\A038811\3_Pdoc\DOC\Project Report\38811-Project Report Rev 0 29Nov14.docx
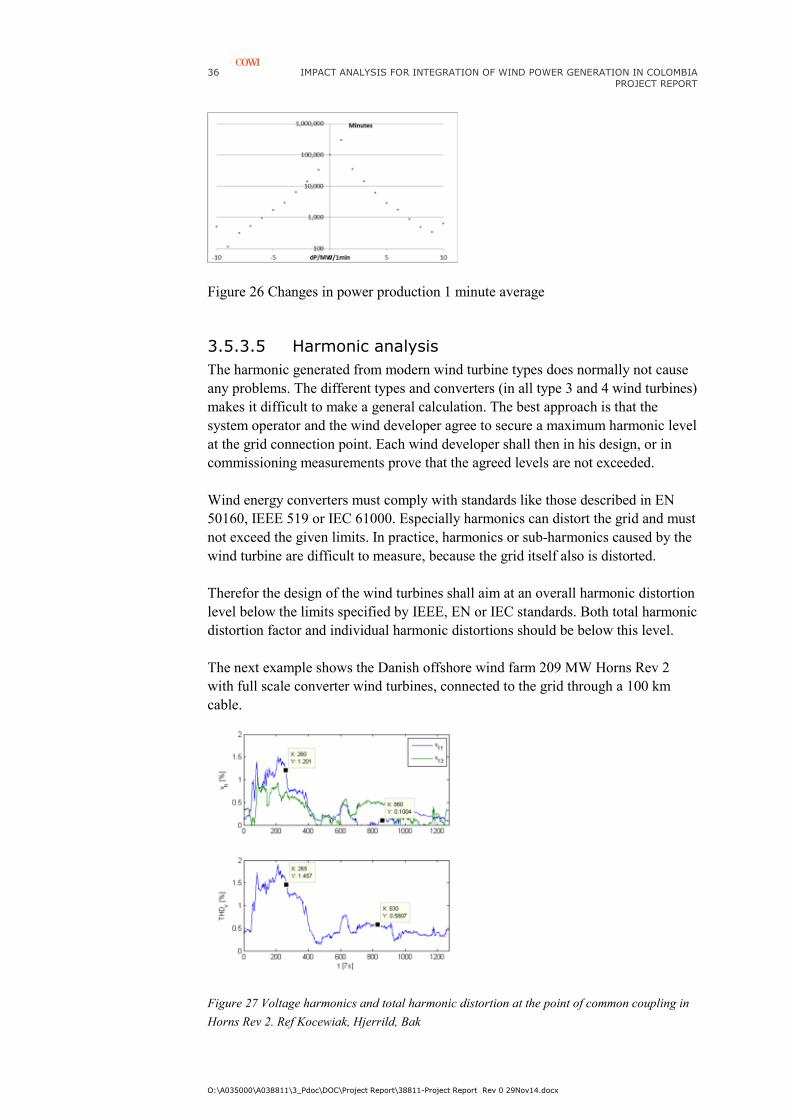
Figure 26 Changes in power production 1 minute average
3.5.3.5 Harmonic analysis
The harmonic generated from modern wind turbine types does normally not cause any problems. The different types and converters (in all type 3 and 4 wind turbines) makes it difficult to make a general calculation. The best approach is that the system operator and the wind developer agree to secure a maximum harmonic level at the grid connection point. Each wind developer shall then in his design, or in commissioning measurements prove that the agreed levels are not exceeded.
Wind energy converters must comply with standards like those described in EN 50160, IEEE 519 or IEC 61000. Especially harmonics can distort the grid and must not exceed the given limits. In practice, harmonics or sub-harmonics caused by the wind turbine are difficult to measure, because the grid itself also is distorted.
Therefor the design of the wind turbines shall aim at an overall harmonic distortion level below the limits specified by IEEE, EN or IEC standards. Both total harmonic distortion factor and individual harmonic distortions should be below this level.
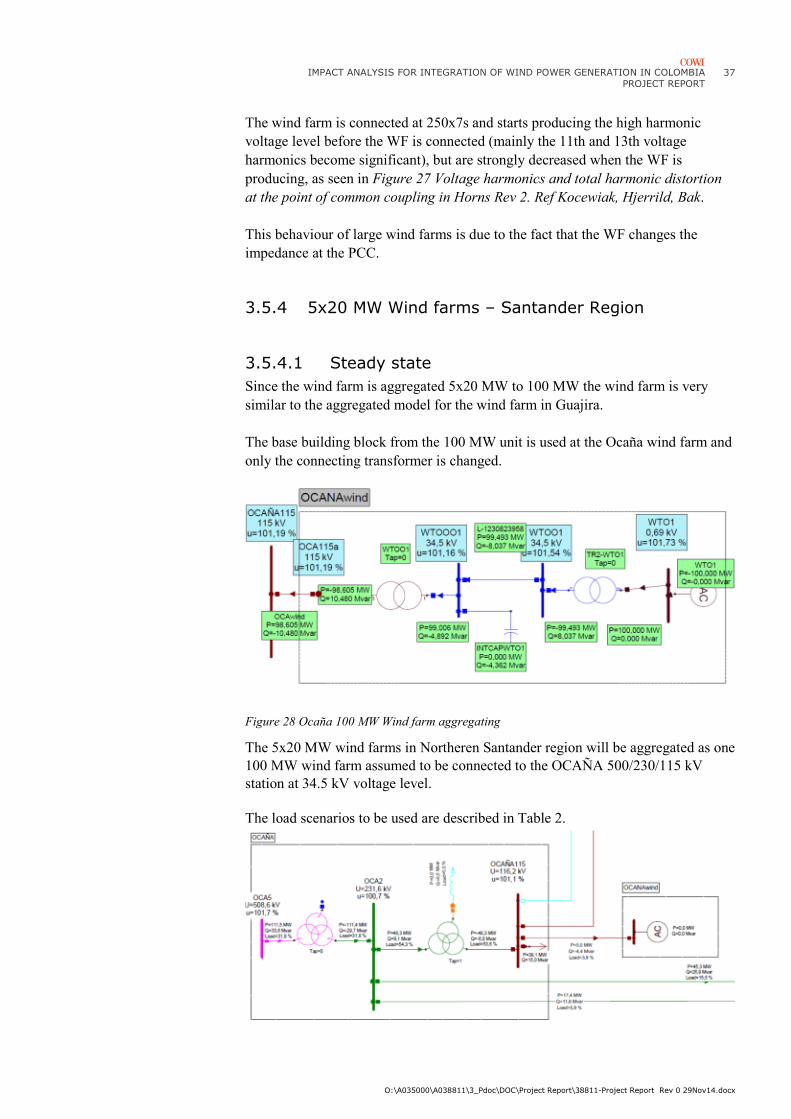
The next example shows the Danish offshore wind farm 209 MW Horns Rev 2 with full scale converter wind turbines, connected to the grid through a 100 km cable.
Figure 27 Voltage harmonics and total harmonic distortion at the point of common coupling in
Horns Rev 2. Ref Kocewiak, Hjerrild, Bak
IMPACT ANALYSIS FOR INTEGRATION OF WIND POWER GENERATION IN COLOMBIA
PROJECT REPORT
O:\A035000\A038811\3_Pdoc\DOC\Project Report\38811-Project Report Rev 0 29Nov14.docx
37
The wind farm is connected at 250x7s and starts producing the high harmonic voltage level before the WF is connected (mainly the 11th and 13th voltage harmonics become significant), but are strongly decreased when the WF is producing, as seen in Figure 27 Voltage harmonics and total harmonic distortion
at the point of common coupling in Horns Rev 2. Ref Kocewiak, Hjerrild, Bak.
This behaviour of large wind farms is due to the fact that the WF changes the impedance at the PCC.
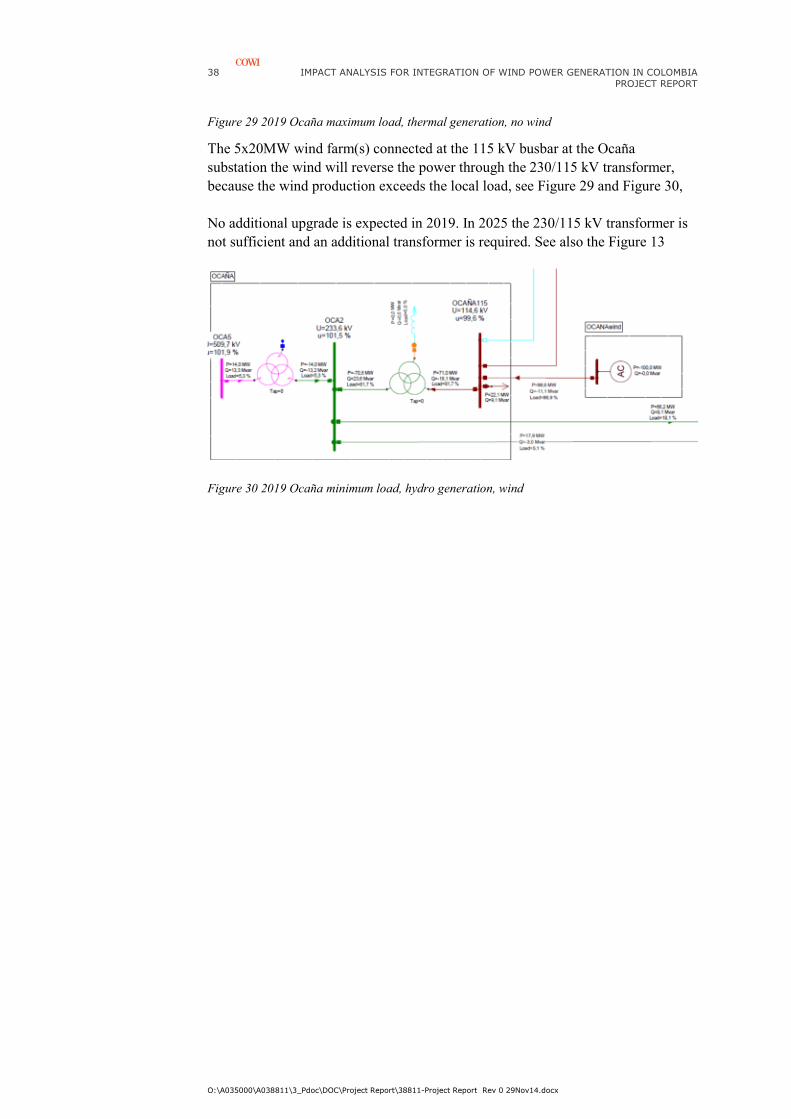
3.5.4 5x20 MW Wind farms – Santander Region
3.5.4.1 Steady state
Since the wind farm is aggregated 5x20 MW to 100 MW the wind farm is very similar to the aggregated model for the wind farm in Guajira.
The base building block from the 100 MW unit is used at the Ocaña wind farm and only the connecting transformer is changed.
Figure 28 Ocaña 100 MW Wind farm aggregating
The 5x20 MW wind farms in Northeren Santander region will be aggregated as one 100 MW wind farm assumed to be connected to the OCAÑA 500/230/115 kV station at 34.5 kV voltage level.
The load scenarios to be used are described in Table 2.
38 IMPACT ANALYSIS FOR INTEGRATION OF WIND POWER GENERATION IN COLOMBIA PROJECT REPORT
O:\A035000\A038811\3_Pdoc\DOC\Project Report\38811-Project Report Rev 0 29Nov14.docx
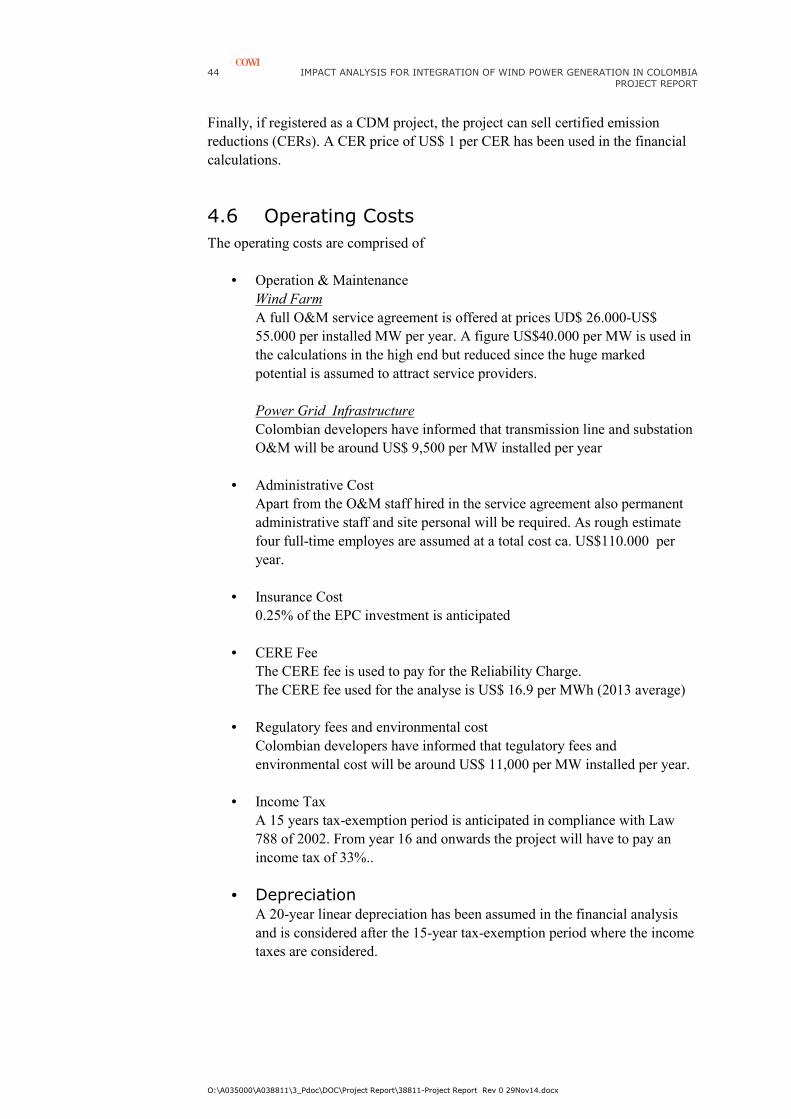
Figure 29 2019 Ocaña maximum load, thermal generation, no wind
The 5x20MW wind farm(s) connected at the 115 kV busbar at the Ocaña substation the wind will reverse the power through the 230/115 kV transformer, because the wind production exceeds the local load, see Figure 29 and Figure 30,
No additional upgrade is expected in 2019. In 2025 the 230/115 kV transformer is not sufficient and an additional transformer is required. See also the Figure 13
Figure 30 2019 Ocaña minimum load, hydro generation, wind

IMPACT ANALYSIS FOR INTEGRATION OF WIND POWER GENERATION IN COLOMBIA
PROJECT REPORT
O:\A035000\A038811\3_Pdoc\DOC\Project Report\38811-Project Report Rev 0 29Nov14.docx
39
4 AEP & Financial Feasibility Analysis
4.1 Introduction
In accordance with the terms of reference for the assignment AEP calculations for two turbine types and a cost structure and economic calculations should be carried out for the two designated regions La Guajira and Santander respectively.
However, as it has turned out to be impossible to obtain useful wind data measured on MET masts for the Santander region, calculations for this region have not been performed.
Consequently only an indicative wind study for a defined site in the La Guajira region is presented along with financial assumptions, cash flow calculations and conclusions on economic feasibility.
Based on the received information and data a wind study and financial feasibility analyses were carried out for a fictive 400 MW wind power project located in La Guajira region.
4.2 Wind resource
The wind resource and average annual energy production (AEP) for a 400 MW project in La Guajira region has been analysed. It is noted, however, that as this is merely an indicative calculation for a fictive project, specific site conditions such as extreme wind and turbulence have not been taken into account
It is also noted that the presented wind study and AEP estimate for the fictive project must not be considered as a study of bankable quality. The reason is that the available information about the measurements provided by UPME is very limited and not applicable for estimation of the uncertainty of the measured wind. Furthermore, the measurements have not been inspected by COWI and therefore, a thorough assessment of the data quality is not possible. Finally, the uncertainty of many other parameters (e.g. final location of project, selected turbine, O&M etc.), which cannot be determined at this point, will have an influence on the joint

40 IMPACT ANALYSIS FOR INTEGRATION OF WIND POWER GENERATION IN COLOMBIA PROJECT REPORT
O:\A035000\A038811\3_Pdoc\DOC\Project Report\38811-Project Report Rev 0 29Nov14.docx
uncertainty of the AEP estimate. Therefore, a joint uncertainty of the estimated AEP has not been presented.
4.2.1 Wind data
Hourly wind direction and wind speed data from a 10 m mast covering the eight and half year period from January 2001 to June 2009 and hourly wind direction and wind speed data from a 50 m mast covering the six years and seven months period from January 2007 to July 2013 has been provided. Further, production and availability data from the existing Jepirachi wind farm covering the period 2004 – 2012 has been provided. These data combined has been used as a basis for the analysis of the wind resource.
Locations of the met masts and the Jepirachi wind farm are shown in the figure below.
Figure 31: Location of 10m and 50m masts and Jepirachi Wind Farm
4.2.2 Long-term correction
MERRA data1 covering a 30-year period has been applied in the analysis for long-term correction. A correlation coefficient R2 = 0.85 based on monthly mean wind speeds has been found between the MERRA data and the 50 m mast data. This is an acceptable correlation for long-term correction.
1 NCAR and MERRA re-analysis data is based on several different meteorological sources
(satellites, balloons, meteorological stations etc.) and covers the entire world with a grid
resolution of 2.5 and 1 degrees, respectively.

IMPACT ANALYSIS FOR INTEGRATION OF WIND POWER GENERATION IN COLOMBIA
PROJECT REPORT
O:\A035000\A038811\3_Pdoc\DOC\Project Report\38811-Project Report Rev 0 29Nov14.docx
41
By comparing the 30 year annual mean wind speed with the annual mean wind speed during the 12 years based on the MERRA data, it is seen that the annual mean wind speeds during the two periods are identical. This corresponds to a long-term correction of the 12 years onsite data of 1.0.
4.2.3 Wind analyses
The 12 years on-site data covering the period July 2001 to June 2013 - long-term corrected with the 30 years MERRA data - is used as basic wind for the following wind analyses and energy production estimate for the fictive wind project.
It is found that there is a
• general high wind period during Jan-Aug and low wind period during Sep-Dec, with a maximum monthly wind of 11.0 m/s in May 2003 and a minimum monthly wind of 3.5 m/s in Oct 2007.
• a significant variation in the annual mean wind speed, which corresponds to a standard deviation of 12.5 per cent. It should be noted that this yearly variation in the wind speed is significantly higher than usually seen for other wind project sites.
The 12 year long-term corrected time series representing the wind measured at the 50 m mast are transformed into the Weibull distributions2.
The Weibull parameters 50 m above ground level are given by:
• Weibull A: 9.1 • Weibull k: 3.03 • Weibull mean wind speed: 8.2 m/s
The prevailing wind direction is E and ENE.
4.3 Annual Energy Production (AEP)
The annual energy production (AEP) estimate for a possible future 400 MW wind power project located South-West of the existing Jepirachi wind farm has been calculated based on the available wind data.
The AEP calculations are carried out in WindPro, a program which calculations are based on WAsP flow model.
The following two wind turbines have been chosen:
2 Traditionally way of presenting the wind distribution used for wind energy

42 IMPACT ANALYSIS FOR INTEGRATION OF WIND POWER GENERATION IN COLOMBIA PROJECT REPORT
O:\A035000\A038811\3_Pdoc\DOC\Project Report\38811-Project Report Rev 0 29Nov14.docx
› Gamesa G90 2 MW, hub height 78 m (200 x 2 MW)
› Vestas V112 3 MW, hub height 84 m (134 x 3 MW)
With a mean wind speed of 8.2 m/s at 50 m above ground and estimated mean wind speed at 78 m hub height of 9.4 m/s and at 84 m hub height of 9.6 m/s, the area can be characterised as a medium-to-high wind area. However, as mentioned earlier specific site conditions (e.g. extreme wind) have not been taken into account when choosing the turbine types.
In order to estimate the energy production delivered to the grid, some losses must be considered. At this stage the following losses – besides the calculated wake loss - are estimated based on experience with similar projects:
• Wind turbine availability loss: 4% • Electrical loss: 4% • Grid loss: 2% • Power curve loss: 2%
The following AEP estimates have been obtained.
200 x Gamesa G90 2 MW, hub height 78 m
AEP gross
2138 GWh/y
Wake loss3 12.2% 261 GWh/y
AEP park
1877 GWh/y
Losses:
WTG availability 4%
El Loss 4%
Grid loss 2%
Power curve loss 2%
Total loss 11.5% 216 GWh/y
AEP-net
1661 GWh/y
Net Capacity factor 47 %
Full Load hours: 4153 hours
Table 7: AEP estimate for 200 Gamesa G90 2 MW, hub height 78 m
3 Only wake loss from the new turbines is included as the location is not fixed. Possible
wake loss from Jepirachi turbines will be insignificant

IMPACT ANALYSIS FOR INTEGRATION OF WIND POWER GENERATION IN COLOMBIA
PROJECT REPORT
O:\A035000\A038811\3_Pdoc\DOC\Project Report\38811-Project Report Rev 0 29Nov14.docx
43
134 x Vestas V112 3 MW, hub height 84 m
AEP gross
2249 GWh/y
Wake loss3 11.2% 252 GWh/y
AEP park
1997 GWh/y
Losses:
WTG availability 4%
El Loss 4%
Grid loss 2%
Power curve loss 2%
Total loss 11.5% 229 GWh/y
AEP-net
1768 GWh/y
Net Capacity factor 50 %
Full Load hours: 4397 hours
Table 8: AEP estimate for 134 Vestas V112 3 MW, hub height 84 m
4.4 Investment and operation budget
Based on the information provided the selected turbine types and on the experience of COWI, the following investment budget has been established:
CAPEX item US$ EPC contract 720,000,000 Transmission & Grid connection 90,000,000 Development cost 36,000,000 CDM development cost 50,000
TOTAL 846,050,000
Table 9: CAPEX for a 400MW wind farm
Total OPEX (excl. taxes) is estimated to be approx. US$ 51.5 million per year
For further details of establishing the CAPEX and OPEX please refer to the study report 02.
4.5 Income
For a wind power project in Colombia there are different parameters related to income generation.
First of all the electricity will be sold on the market. In the calculations an average sales tariff of US$ 65 per MWh has been used.
In addition to the electricity tariff, wind power projects may receive a firm energy payment called a reliability charge. For the given project the basis for calculating the reliability charge is 6% * 8760 hours * 400 MW = 210,240 MWh. The level of the reliability charge per MWh is informed to be US$ 15.
44 IMPACT ANALYSIS FOR INTEGRATION OF WIND POWER GENERATION IN COLOMBIA PROJECT REPORT
O:\A035000\A038811\3_Pdoc\DOC\Project Report\38811-Project Report Rev 0 29Nov14.docx
Finally, if registered as a CDM project, the project can sell certified emission reductions (CERs). A CER price of US$ 1 per CER has been used in the financial calculations.
4.6 Operating Costs
The operating costs are comprised of
• Operation & Maintenance Wind Farm A full O&M service agreement is offered at prices UD$ 26.000-US$ 55.000 per installed MW per year. A figure US$40.000 per MW is used in the calculations in the high end but reduced since the huge marked potential is assumed to attract service providers. Power Grid Infrastructure Colombian developers have informed that transmission line and substation O&M will be around US$ 9,500 per MW installed per year
• Administrative Cost Apart from the O&M staff hired in the service agreement also permanent administrative staff and site personal will be required. As rough estimate four full-time employes are assumed at a total cost ca. US$110.000 per year.
• Insurance Cost 0.25% of the EPC investment is anticipated
• CERE Fee The CERE fee is used to pay for the Reliability Charge. The CERE fee used for the analyse is US$ 16.9 per MWh (2013 average)
• Regulatory fees and environmental cost Colombian developers have informed that tegulatory fees and environmental cost will be around US$ 11,000 per MW installed per year.
• Income Tax A 15 years tax-exemption period is anticipated in compliance with Law 788 of 2002. From year 16 and onwards the project will have to pay an income tax of 33%..
• Depreciation A 20-year linear depreciation has been assumed in the financial analysis and is considered after the 15-year tax-exemption period where the income taxes are considered.

IMPACT ANALYSIS FOR INTEGRATION OF WIND POWER GENERATION IN COLOMBIA
PROJECT REPORT
O:\A035000\A038811\3_Pdoc\DOC\Project Report\38811-Project Report Rev 0 29Nov14.docx
45
4.7 Financial analysis
In the financial analyses the internal rate of return has been calculated for the pure investment without financing, and for the investment with financing on market terms.
For the pure investment without financing the following results have been found:
WTG type Item Result 2 MW IRR 9,1 %
NPV net income 463.371.420 3 MW IRR 10,3%
NPV net income 562.257.588
Table 10: IRR and NPV for the base case pure investment
From this, it can be seen that based on the current situation and on the assumptions made, a 400 MW wind power project in La Guajira can be considered financially viable. Compared with the IRR expectations from developers the result is aligned with their target, and compared with the base rate from the Central Bank of Colombia of 3.25 %, the IRR is well above this rate.
For the investment with market financing:
WTG type Item Result 2 MW IRR 17,1%
NPV net income 562.082.629 3 MW IRR 19,5%
NPV net income 661.695.106
Table 11: IRR and NPV for the base case with market financing
WTG type Item Result 2 MW IRR 16,6%
NPV net income 646.733.049
3 MW IRR 18,8% NPV net income 746.723.730
Table 12: IRR and NPV for the base case with alternative market financing
With both types of market based financing the IRR in the base case improves significant
46 IMPACT ANALYSIS FOR INTEGRATION OF WIND POWER GENERATION IN COLOMBIA PROJECT REPORT
O:\A035000\A038811\3_Pdoc\DOC\Project Report\38811-Project Report Rev 0 29Nov14.docx
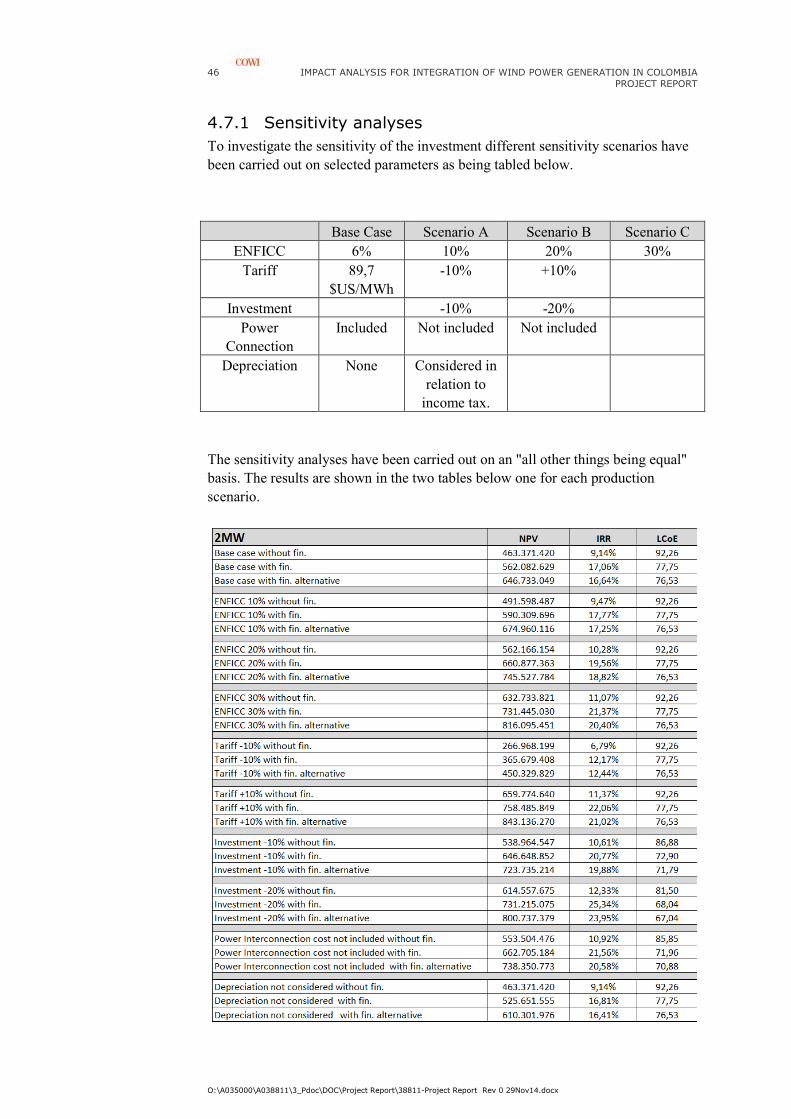
4.7.1 Sensitivity analyses
To investigate the sensitivity of the investment different sensitivity scenarios have been carried out on selected parameters as being tabled below.
The sensitivity analyses have been carried out on an "all other things being equal" basis. The results are shown in the two tables below one for each production scenario.
Base Case Scenario A Scenario B Scenario C ENFICC 6% 10% 20% 30%
Tariff 89,7 $US/MWh
-10% +10%
Investment -10% -20% Power
Connection Included Not included Not included
Depreciation None Considered in relation to
income tax.

IMPACT ANALYSIS FOR INTEGRATION OF WIND POWER GENERATION IN COLOMBIA
PROJECT REPORT
O:\A035000\A038811\3_Pdoc\DOC\Project Report\38811-Project Report Rev 0 29Nov14.docx
47
From the above tables it can be seen that the
• Tariff & investment cost IRR is very sensitive to changes in the tariff and the investment cost.
• ENFICC IRR is also sensitive to changes in the ENFICC but to a lesser extent than for the two other parameters.
• Depreciation IRR & NPV are not significantly affected by the depreciation
A more illustrative sensitivity analyse for the 2MW WTG without financing is shown in the figures below when a change in the ENFICC, Investment and Tariff is introduced. (It is noticed that the ENFICC is 6% in the base case scenario and negative ENFICCs not apply).

48 IMPACT ANALYSIS FOR INTEGRATION OF WIND POWER GENERATION IN COLOMBIA PROJECT REPORT
O:\A035000\A038811\3_Pdoc\DOC\Project Report\38811-Project Report Rev 0 29Nov14.docx
IMPACT ANALYSIS FOR INTEGRATION OF WIND POWER GENERATION IN COLOMBIA
PROJECT REPORT
O:\A035000\A038811\3_Pdoc\DOC\Project Report\38811-Project Report Rev 0 29Nov14.docx
49
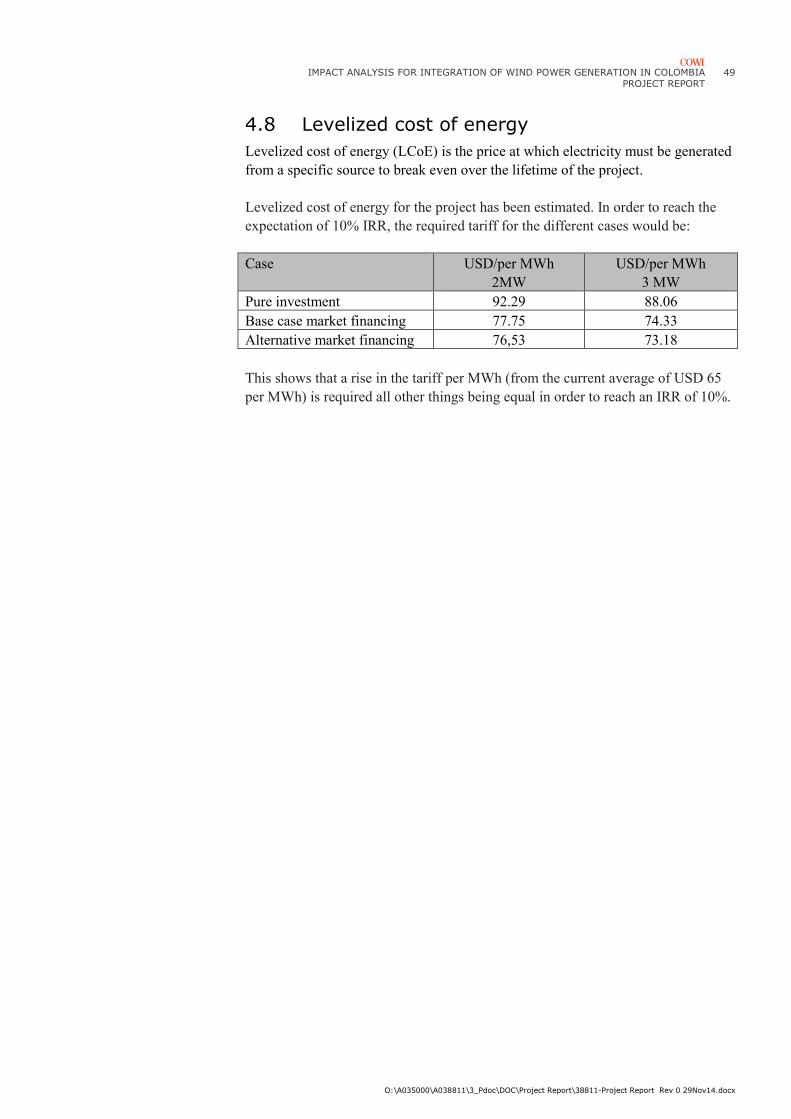
4.8 Levelized cost of energy
Levelized cost of energy (LCoE) is the price at which electricity must be generated from a specific source to break even over the lifetime of the project.
Levelized cost of energy for the project has been estimated. In order to reach the expectation of 10% IRR, the required tariff for the different cases would be:
Case USD/per MWh 2MW
USD/per MWh 3 MW
Pure investment 92.29 88.06 Base case market financing 77.75 74.33 Alternative market financing 76,53 73.18 This shows that a rise in the tariff per MWh (from the current average of USD 65 per MWh) is required all other things being equal in order to reach an IRR of 10%.
50 IMPACT ANALYSIS FOR INTEGRATION OF WIND POWER GENERATION IN COLOMBIA PROJECT REPORT
O:\A035000\A038811\3_Pdoc\DOC\Project Report\38811-Project Report Rev 0 29Nov14.docx
5 Market and Regulatory Aspects
5.1 Wind/Hydro Correlation and complementarity
The wind/hydro complementarity analyse investigates the relationship between the
› wind speed vs. river discharge
› wind energy vs. hydro energy production
The wind energy production is estimated from the wind series and the power curves of the wind turbines.
The hydro energy production is extracted from actual production data informed by UMPE.
The complementarity study considers wind energy production facilities in the Northern La Guajira province and selected hydro plants.
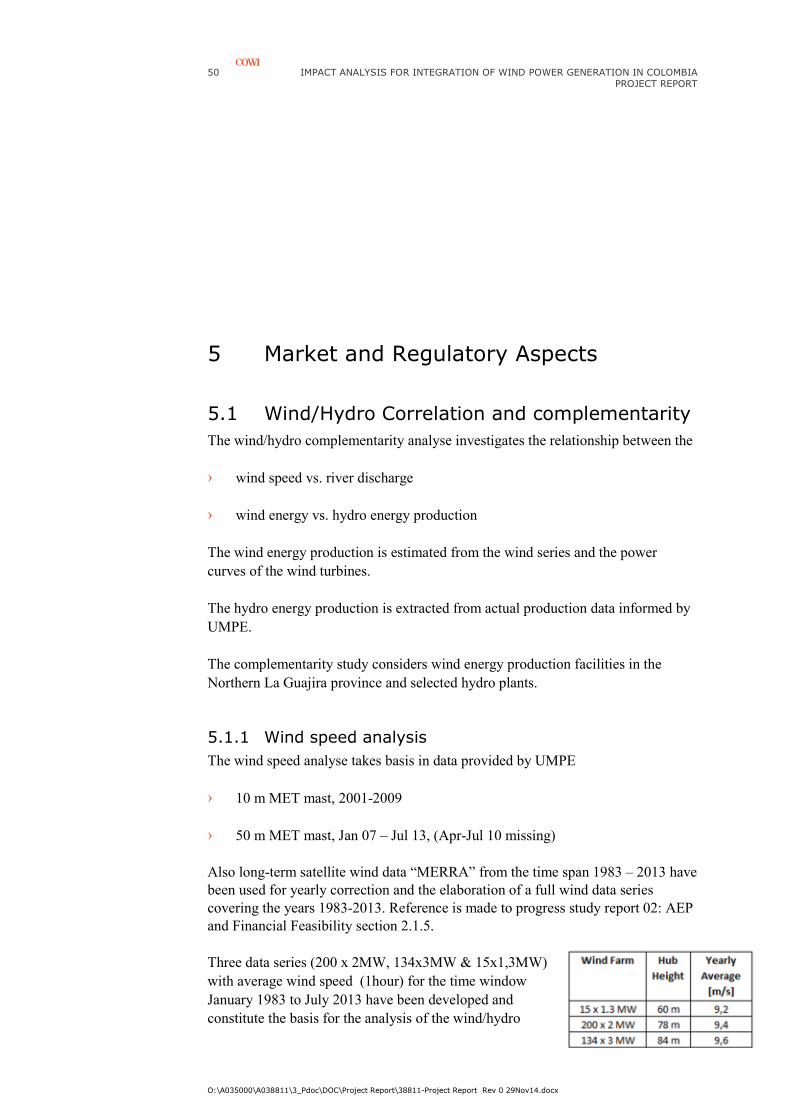
5.1.1 Wind speed analysis
The wind speed analyse takes basis in data provided by UMPE
› 10 m MET mast, 2001-2009
› 50 m MET mast, Jan 07 – Jul 13, (Apr-Jul 10 missing)
Also long-term satellite wind data “MERRA” from the time span 1983 – 2013 have been used for yearly correction and the elaboration of a full wind data series covering the years 1983-2013. Reference is made to progress study report 02: AEP and Financial Feasibility section 2.1.5. Three data series (200 x 2MW, 134x3MW & 15x1,3MW) with average wind speed (1hour) for the time window January 1983 to July 2013 have been developed and constitute the basis for the analysis of the wind/hydro

IMPACT ANALYSIS FOR INTEGRATION OF WIND POWER GENERATION IN COLOMBIA
PROJECT REPORT
O:\A035000\A038811\3_Pdoc\DOC\Project Report\38811-Project Report Rev 0 29Nov14.docx
51
energy production correlation and complementarity. The three data series have a slightly different average wind speed caused by the differences in the hub heights as indicated in the table beside. (The average wind speed increases with larger hub height).
The monthly average wind speed for the 200x2MW site when assuming a 78m hub height is indicated in the figure below and is used in the further analysis.
The standard deviation of the monthly average wind speed for the three time windows (based on different basis) and in total for all years are listed in the table below. The lower standard deviation on the MERRA based wind data is most likely explained by the analysis applied in the generation of the MERRA data and does not represent the real variation in the monthly variation in the wind.
Wind speed at 78m hub height (Jan83-Mar13)
MERRA 10m mast 50m mast All All months average 9,50 9,72 8,71 9,39 Standard Deviation 11,9% 21,6% 19,8% 16,3% El Niño months (% of all months)
9,6 (101%)
9,81 (101%)
9.37 (107,6%)
9,61 (102,4%)
“Not El Niño months” (% of all months)
9,46 (99,6%)
9,71 (100%)
8.54 (98%)
9,31 (99,2%)
It is observed that
› the average monthly wind speed for all El Niño months in general are higher that all months and the months not being El Niño months
› the average monthly wind speed for all El Niño months (13 out of 75) measured with the 50 m mast is ≈9% higher than the “not El Niño months”

52 IMPACT ANALYSIS FOR INTEGRATION OF WIND POWER GENERATION IN COLOMBIA PROJECT REPORT
O:\A035000\A038811\3_Pdoc\DOC\Project Report\38811-Project Report Rev 0 29Nov14.docx
The average monthly wind speed distribution over the years 1983- 2013 is shown beside.
Hydroflow data has been made available by UMPE for the years 1997-2012 and thus constitutes the time window for the correlation and complementarity analyse based on the wind speed [m/s] and the hydroflow [m3/s] data. Consequently the monthly average wind speed for the years 1997 – 2012 have also been analysed.
It is observed that the yearly avearge wind speed for the 1997-2013 decreases from 9,43 m/s to 9,33 m/s compared with full 1983- 2013 data serie.
The monthly average distribution of the different scenarios and for all the years 1983- 2013 is shown below. The general trend in the monthly distribution over the year is the same. Above average: Jan ���� Aug Below average: Sep ���� Dec
Above observations are relevant for the further analyse of the wind/hydro complementarity-
5.1.2 Wind Energy Analysis
The basis for the wind energy production is established from the wind series through the years 1983-2013 and raw production data (1 hour resolution) for the three wind farms located approximately at the same site.
• 400 MW “200 x 2.0 MW turbines” • 400 MW “132 x 3.0 MW turbines” • 19,5 MW “15 x 1,5 MW turbines”
The wind energy production (1 hour raw data series) is computed from wind data series recalculated to hub height by the actual power curve and the wake loss impact on the wind speed. Thus a 1 hour data series for the wind farm energy production is established and the net energy production delivered to the power grid can be computed by:
EWTG: Gross energy production from all WTGs (Wake losses & 2% power curve losses considered) - ∆P34kV: Power losses in 33kV cables within the wind farm - ∆PWTG_trans: Power losses in the WTG 0,69/33 kV transformers - ∆PSS_trans : Power losses in the 33/220 kV transformers

IMPACT ANALYSIS FOR INTEGRATION OF WIND POWER GENERATION IN COLOMBIA
PROJECT REPORT
O:\A035000\A038811\3_Pdoc\DOC\Project Report\38811-Project Report Rev 0 29Nov14.docx
53
E230kV: Energy supply to 230 kV transmission line - ∆P230kV ohl: Power losses in the 230 kV transmission line EPCC: Energy supply to the grid at the delivery point
The net energy production have been calculated for each hour taking above power losses into consideration and with the magnitude of power losses indicated in the table below
The AEP calculation assumes an overall yearly availability 96% for the wind farms being adopted for the wind/hydro complementarity analyse.
The availability is differentiated over the months in relation to the % average wind speed since the planned maintenance work should be planned in the months (May-Aug-Sep-Oct-Nov-Dec) were lowest wind speed occur.
The monthly average for the three wind farms during the months Jan83-Mar13 are shown in the graph below.

54 IMPACT ANALYSIS FOR INTEGRATION OF WIND POWER GENERATION IN COLOMBIA PROJECT REPORT
O:\A035000\A038811\3_Pdoc\DOC\Project Report\38811-Project Report Rev 0 29Nov14.docx
A significant flucturation of the monthly energy production [MWh] is observed with the extreme minimums in 20014 and 2007. A simple statistic analysis of the monthly and yearly energy production supplied to the grid at the delivery point in the Cuestecita station through a 131 km 230 kV transmission line is shown below:
15x1,3MW 200x2,0MW 134x3,0MW Installed capacity 19,5 MW 400 MW 402 MW
Effective net capacity 17,4 MW 361,6 MW 373,4 MW
Monthly Energy Production [MWh]
Maximum 9.578 229.781 242.783
Minimum 9.947 25.643 28.581
Average 5.559 141.124 152.010
Standard Deviation 1.628
29,3%
38.969
27,6%
40.936
26,9%
Yearly Energy Production [GWh]
Maximum 90 2.200 2.365
Minimum 46 1.191 1.293
Average 67 1.691 1.822
Standard Deviation 9
13,1%
203
12,0%
212
11,6%
The yearly energy production for each of the years for the two large windfarms is shown in the figure below.
4 The wind data measurements reported from Feb-May in year 2001 are faulty and not used
in this report.
IMPACT ANALYSIS FOR INTEGRATION OF WIND POWER GENERATION IN COLOMBIA
PROJECT REPORT
O:\A035000\A038811\3_Pdoc\DOC\Project Report\38811-Project Report Rev 0 29Nov14.docx
55
5.1.3 Wind Energy - Monthly Distribution
The main analysis will focus on the 400 MW wind farm consisting of 200 x 2 MW turbine units with the same characteristics as assumed for the AEP calculation.
The normalised distribution of the average energy production by the 200 x 2,0 MW wind farm is illustrated below for each year in 1983-2013 (March month inclusive).
It is observed that a general trend in the monthly distribution over the year is: Above average: Jan����Jul
Below average: Aug ����Dec
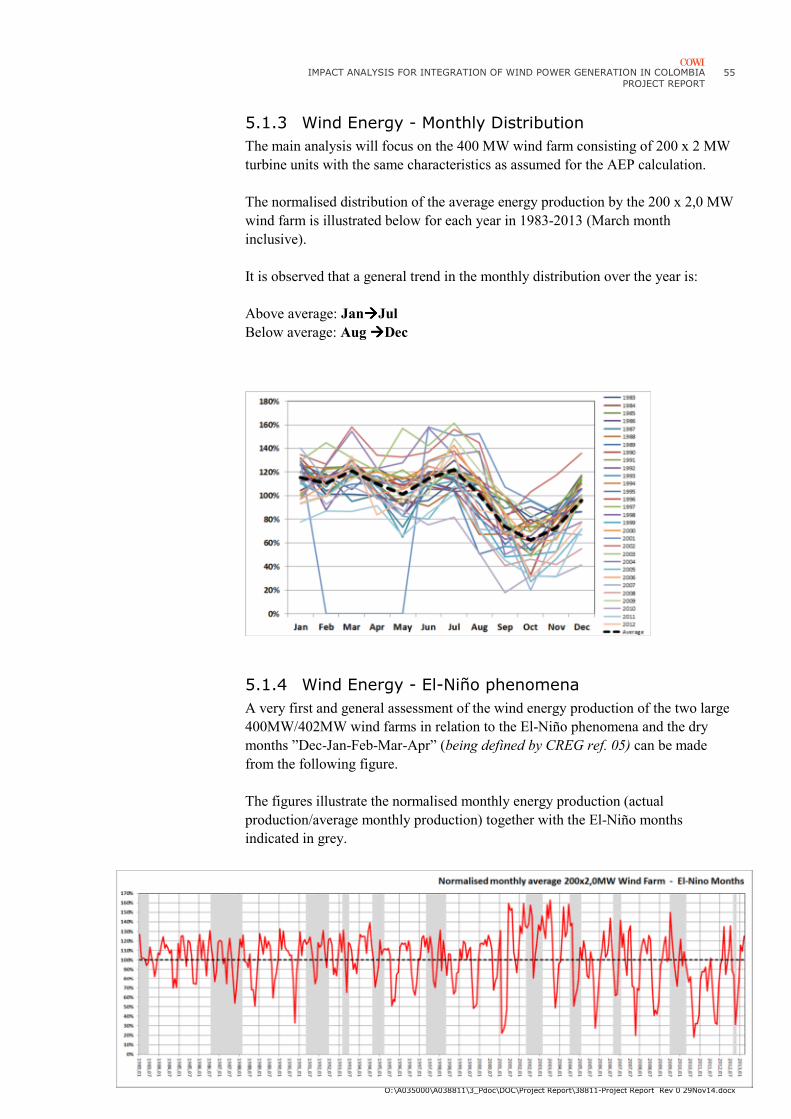
5.1.4 Wind Energy - El-Niño phenomena
A very first and general assessment of the wind energy production of the two large 400MW/402MW wind farms in relation to the El-Niño phenomena and the dry months ”Dec-Jan-Feb-Mar-Apr” (being defined by CREG ref. 05) can be made from the following figure.
The figures illustrate the normalised monthly energy production (actual production/average monthly production) together with the El-Niño months indicated in grey.

56 IMPACT ANALYSIS FOR INTEGRATION OF WIND POWER GENERATION IN COLOMBIA PROJECT REPORT
O:\A035000\A038811\3_Pdoc\DOC\Project Report\38811-Project Report Rev 0 29Nov14.docx
An analysis of the monthly energy production for the 200x2,0MW wind farm gives the statistics tabled below.
It is observed that the
1 The monthly energy production has it highest average in the CREG defined dry months
2 The minimum monthly energy production in the dry months are significant higher than the wet months
3 The maximum monthly energy production occur in the wet months
From above the assumption about a tendency with higher wind energy production during the dry months compared with the wet months generally is justified.
5.1.5 Hydro Generating Plants
The energy production from hydro power generator plants in Colombia has been reported in the time span from Jan 1995 to Mar 2013 on an hourly basis.
This study includes generating plants selected by UPME.
Six power plants were appointed by UPME. Two power plants (ALBAN & URRA) were eliminated from the study since production data for these units not are reported for all months in the timespan between 1995 and 2013.
Consequently the analyse of the hydro in-flow and energy production complementary with the wind farm is based on the four units listed below:
� SALVAJIA 285 MW // River: Cauca Saljina � BETANIA 540 MW // River: Magdalene Betania � GUATAPE 560 MW // River: Nara � GUAVIO 1200 MW // River: Guavio
200x2,0MW – (1983-2013)
All months CREG El-Niño
--- Dry Wet Dry Wet
Maximum 229.781 MWh 224.853 MWh 229.781 MWh 222.209 MWh 229.781 MWh
Minimum 25.643 MWh 58.544 MWh 25.643 MWh 43.953 MWh 25.643 MWh
Average 142.199MWh 157.289 MWh 131.368 MWh 146.158 MWh 140.754MWh
Standard Deviation
37.794 MWh 26,6%
24.195 MWh
15,4%
41.866 MWh
31,9%
34.148 MWh
23,4%
38.941 MWh
27,7%

IMPACT ANALYSIS FOR INTEGRATION OF WIND POWER GENERATION IN COLOMBIA
PROJECT REPORT
O:\A035000\A038811\3_Pdoc\DOC\Project Report\38811-Project Report Rev 0 29Nov14.docx
57
5.1.6 Hydro Data Analysis – River Discharges
The wind/hydro complementarity analysis implemented for the wind speed vs. river inflow is based on all the rivers measured and will also focus on the particular river that corresponds to the selected hydro power plants.
5.1.6.1 River Discharges – All Rivers
The monthly distribution of the water flow [m3/s] has been reported in the text file “Aportes Rios Caudal dia.txt” for the years 1997 - 2012. It contains measured water flow in a large number of rivers in Colombia, thus representing the fluctuation of a possible energy production during the years and months investigated. The data has it origin from 26 different rivers in Colombia and from an increasing number of measurement (Starting with 19 in 1997).
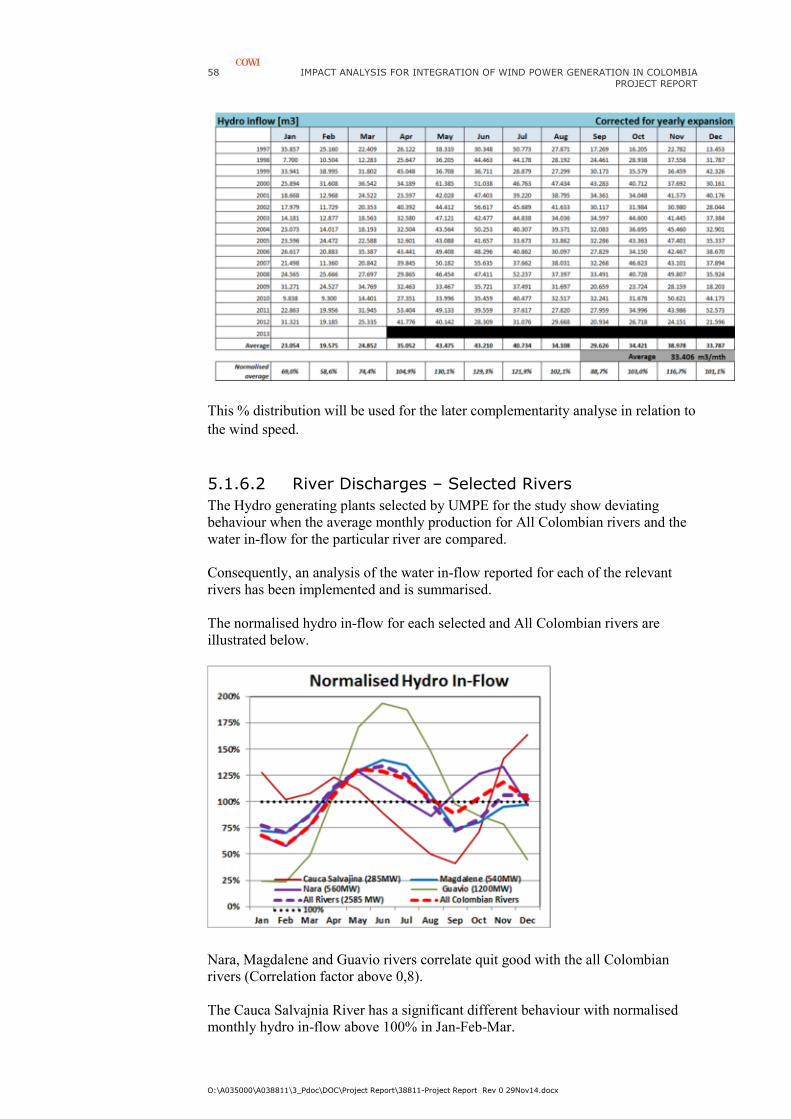
The monthly in-flow in the years 1997-2013 being corrected for the yearly increase of the number of measurements stations is shown below.
The overall (complete Colombian pool of Hydro power plants) normalised monthly average of the in-flow distribution expressed in % of the monthly average are indicated in the graph and listed in the table and below.
58 IMPACT ANALYSIS FOR INTEGRATION OF WIND POWER GENERATION IN COLOMBIA PROJECT REPORT
O:\A035000\A038811\3_Pdoc\DOC\Project Report\38811-Project Report Rev 0 29Nov14.docx
This % distribution will be used for the later complementarity analyse in relation to the wind speed.
5.1.6.2 River Discharges – Selected Rivers
The Hydro generating plants selected by UMPE for the study show deviating behaviour when the average monthly production for All Colombian rivers and the water in-flow for the particular river are compared. Consequently, an analysis of the water in-flow reported for each of the relevant rivers has been implemented and is summarised. The normalised hydro in-flow for each selected and All Colombian rivers are illustrated below.
Nara, Magdalene and Guavio rivers correlate quit good with the all Colombian rivers (Correlation factor above 0,8). The Cauca Salvajnia River has a significant different behaviour with normalised monthly hydro in-flow above 100% in Jan-Feb-Mar.

IMPACT ANALYSIS FOR INTEGRATION OF WIND POWER GENERATION IN COLOMBIA
PROJECT REPORT
O:\A035000\A038811\3_Pdoc\DOC\Project Report\38811-Project Report Rev 0 29Nov14.docx
59
(This is not the case for the other rivers). The figures for Apr�Sep also are significant lower than the other rivers. The Cauca Salvajnia River hydro in-flow does not correlate with the other rivers. This is verified by a calculated correlation factor to all Colombian rivers (-0,02) practically equal to zero. The Gavio River has maximum 200% and minimum 25% normalised water-in-flow that is significant and thus the most fluctuating river.
5.1.7 Hydro Power Production Analysis
The actual production reported for each the selected hydro power plants have been analysed on a monthly basis. Reference is given to Study Report 03 and Appendix A where more details can be found for each generation unit. The normalised monthly energy production for each of the selected hydro power plants is shown below. The normalised hydro in-flow for all Colombian rivers is also indicated for comparison.
A number of observations are listed below:
a) No consistent or clear relation between the production and the hydro in-flow seems to exist for the power plants selected
b) The normalised actual hydro production for each of the power plants does no show same behaviour
c) The 285MW & 560 MW units have normalised production less than 100% in May-Jun-Jul. This is in contradiction with the 1200MW &
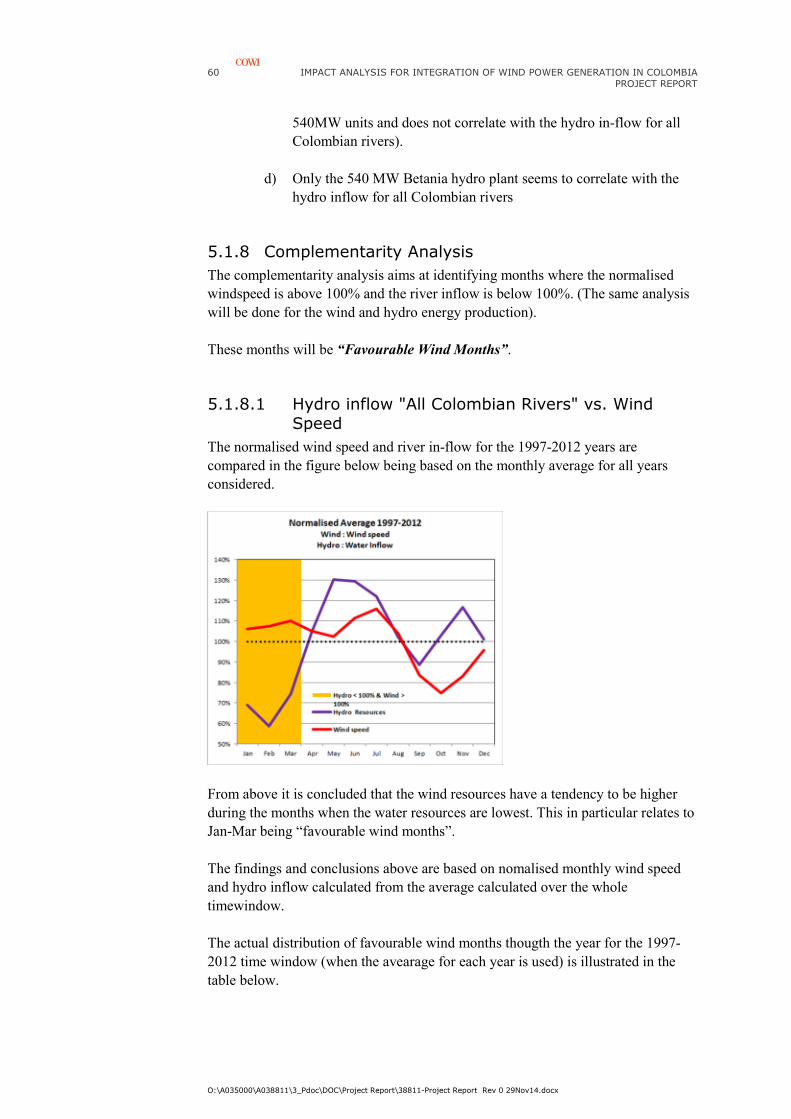
60 IMPACT ANALYSIS FOR INTEGRATION OF WIND POWER GENERATION IN COLOMBIA PROJECT REPORT
O:\A035000\A038811\3_Pdoc\DOC\Project Report\38811-Project Report Rev 0 29Nov14.docx
540MW units and does not correlate with the hydro in-flow for all Colombian rivers).
d) Only the 540 MW Betania hydro plant seems to correlate with the hydro inflow for all Colombian rivers
5.1.8 Complementarity Analysis
The complementarity analysis aims at identifying months where the normalised windspeed is above 100% and the river inflow is below 100%. (The same analysis will be done for the wind and hydro energy production).
These months will be “Favourable Wind Months”.
5.1.8.1 Hydro inflow "All Colombian Rivers" vs. Wind Speed
The normalised wind speed and river in-flow for the 1997-2012 years are compared in the figure below being based on the monthly average for all years considered.
From above it is concluded that the wind resources have a tendency to be higher during the months when the water resources are lowest. This in particular relates to Jan-Mar being “favourable wind months”.
The findings and conclusions above are based on nomalised monthly wind speed and hydro inflow calculated from the average calculated over the whole timewindow.
The actual distribution of favourable wind months thougth the year for the 1997-2012 time window (when the avearage for each year is used) is illustrated in the table below.
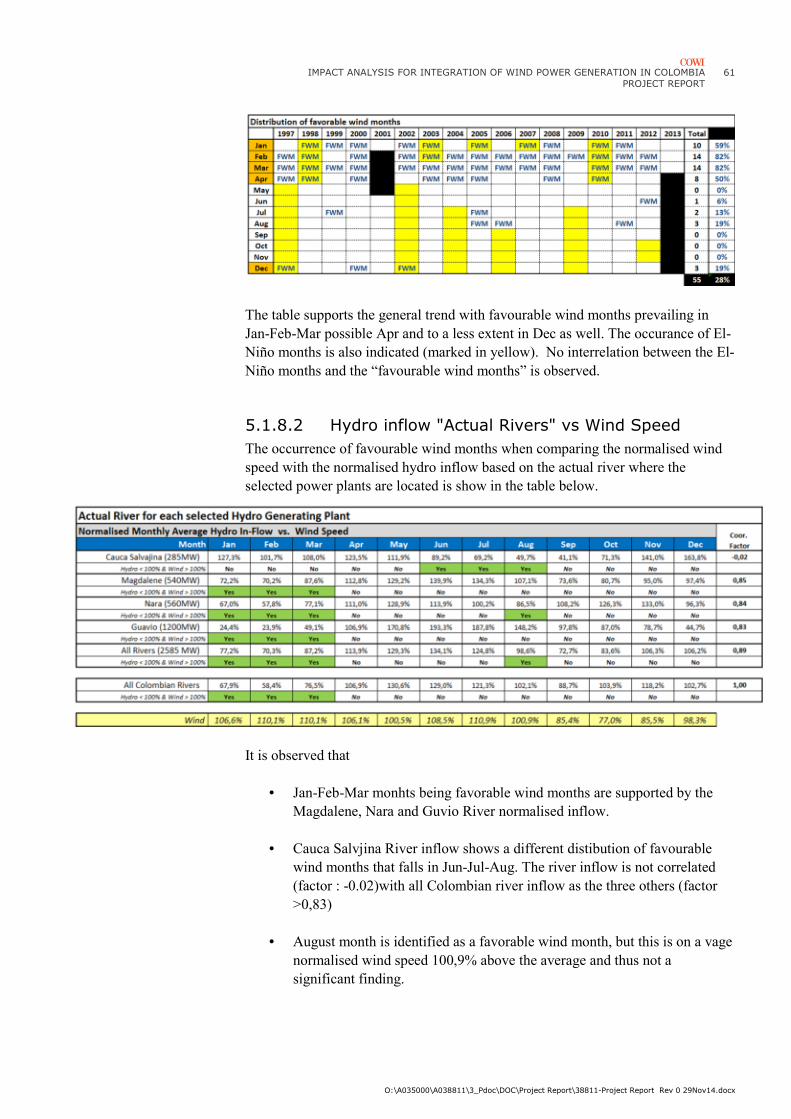
IMPACT ANALYSIS FOR INTEGRATION OF WIND POWER GENERATION IN COLOMBIA
PROJECT REPORT
O:\A035000\A038811\3_Pdoc\DOC\Project Report\38811-Project Report Rev 0 29Nov14.docx
61
The table supports the general trend with favourable wind months prevailing in Jan-Feb-Mar possible Apr and to a less extent in Dec as well. The occurance of El-Niño months is also indicated (marked in yellow). No interrelation between the El-Niño months and the “favourable wind months” is observed.
5.1.8.2 Hydro inflow "Actual Rivers" vs Wind Speed
The occurrence of favourable wind months when comparing the normalised wind speed with the normalised hydro inflow based on the actual river where the selected power plants are located is show in the table below.
It is observed that
• Jan-Feb-Mar monhts being favorable wind months are supported by the Magdalene, Nara and Guvio River normalised inflow.
• Cauca Salvjina River inflow shows a different distibution of favourable wind months that falls in Jun-Jul-Aug. The river inflow is not correlated (factor : -0.02)with all Colombian river inflow as the three others (factor >0,83)
• August month is identified as a favorable wind month, but this is on a vage normalised wind speed 100,9% above the average and thus not a significant finding.
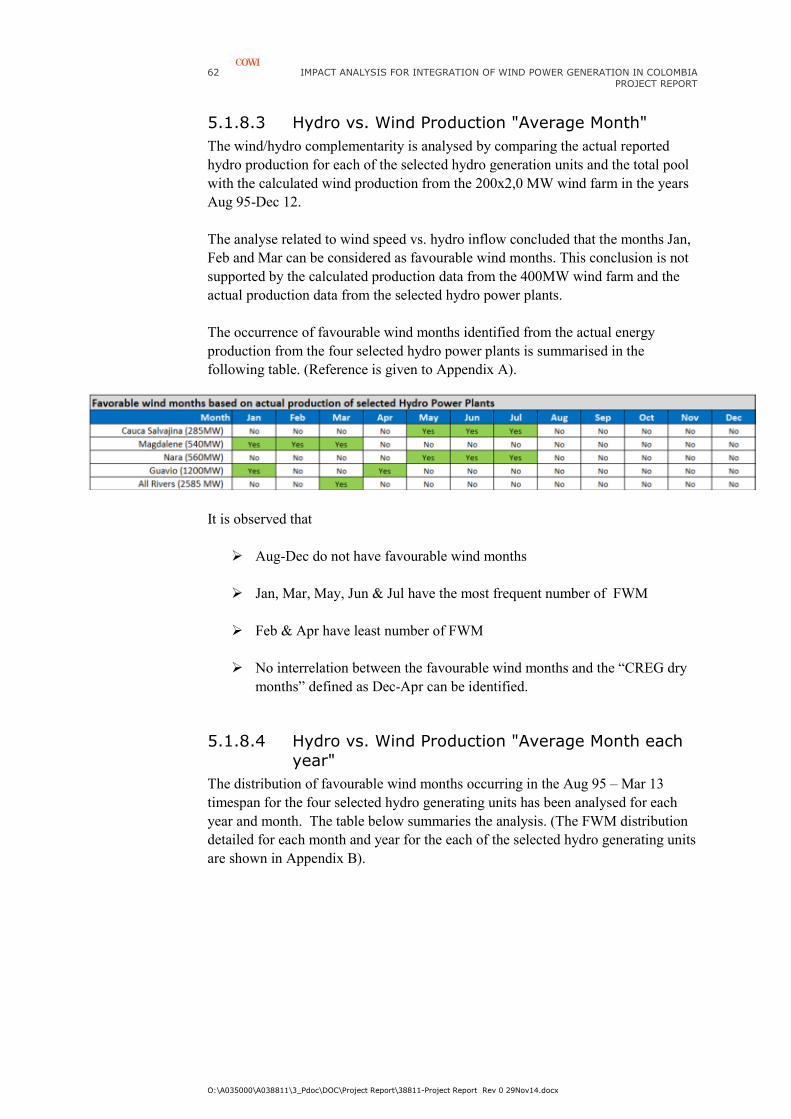
62 IMPACT ANALYSIS FOR INTEGRATION OF WIND POWER GENERATION IN COLOMBIA PROJECT REPORT
O:\A035000\A038811\3_Pdoc\DOC\Project Report\38811-Project Report Rev 0 29Nov14.docx
5.1.8.3 Hydro vs. Wind Production "Average Month"
The wind/hydro complementarity is analysed by comparing the actual reported hydro production for each of the selected hydro generation units and the total pool with the calculated wind production from the 200x2,0 MW wind farm in the years Aug 95-Dec 12.
The analyse related to wind speed vs. hydro inflow concluded that the months Jan, Feb and Mar can be considered as favourable wind months. This conclusion is not supported by the calculated production data from the 400MW wind farm and the actual production data from the selected hydro power plants.
The occurrence of favourable wind months identified from the actual energy production from the four selected hydro power plants is summarised in the following table. (Reference is given to Appendix A).
It is observed that
� Aug-Dec do not have favourable wind months
� Jan, Mar, May, Jun & Jul have the most frequent number of FWM
� Feb & Apr have least number of FWM
� No interrelation between the favourable wind months and the “CREG dry months” defined as Dec-Apr can be identified.
5.1.8.4 Hydro vs. Wind Production "Average Month each year"
The distribution of favourable wind months occurring in the Aug 95 – Mar 13 timespan for the four selected hydro generating units has been analysed for each year and month. The table below summaries the analysis. (The FWM distribution detailed for each month and year for the each of the selected hydro generating units are shown in Appendix B).
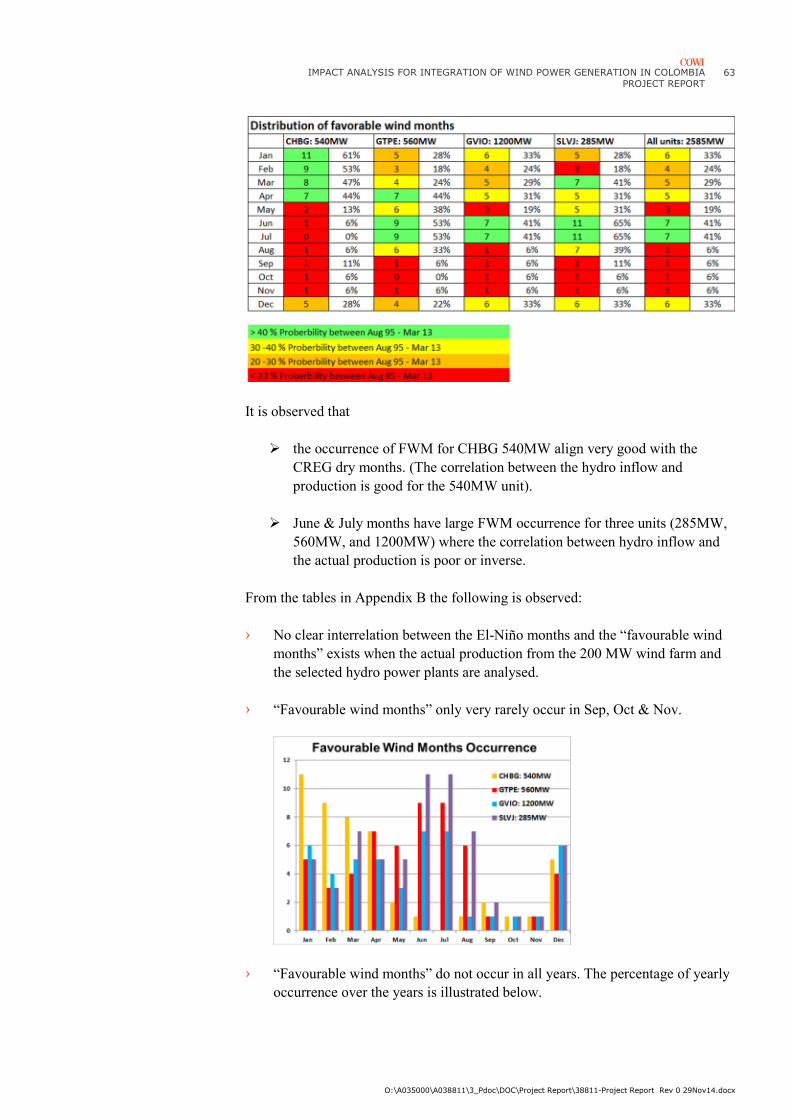
IMPACT ANALYSIS FOR INTEGRATION OF WIND POWER GENERATION IN COLOMBIA
PROJECT REPORT
O:\A035000\A038811\3_Pdoc\DOC\Project Report\38811-Project Report Rev 0 29Nov14.docx
63
It is observed that
� the occurrence of FWM for CHBG 540MW align very good with the CREG dry months. (The correlation between the hydro inflow and production is good for the 540MW unit).
� June & July months have large FWM occurrence for three units (285MW, 560MW, and 1200MW) where the correlation between hydro inflow and the actual production is poor or inverse.
From the tables in Appendix B the following is observed:
› No clear interrelation between the El-Niño months and the “favourable wind months” exists when the actual production from the 200 MW wind farm and the selected hydro power plants are analysed.
› “Favourable wind months” only very rarely occur in Sep, Oct & Nov.
› “Favourable wind months” do not occur in all years. The percentage of yearly occurrence over the years is illustrated below.

64 IMPACT ANALYSIS FOR INTEGRATION OF WIND POWER GENERATION IN COLOMBIA PROJECT REPORT
O:\A035000\A038811\3_Pdoc\DOC\Project Report\38811-Project Report Rev 0 29Nov14.docx
› Approximately 25% of all months in 1995-2012 are identified as “favourable wind months” for each hydro generation unit.
5.1.9 Complementarity -El Niño years / months
The complementarity study also considers the El-Niño months and the dry months defined by CREG. The El-Niño months are identified for the years 1950-2013 by US National Weather Service Climate Prediction Centre.
This study has wind data series from 1983, thus the occurrence of El Niño months in the same time span is analysed. The table below illustrates the number and occurrence of the El-Niño months for all months identified.
The monthly distribution over the year also is very different and will have a significant impact on the ENFICC calculations when the dry months and El-Niño months impact shall be considered and be investigated.

IMPACT ANALYSIS FOR INTEGRATION OF WIND POWER GENERATION IN COLOMBIA
PROJECT REPORT
O:\A035000\A038811\3_Pdoc\DOC\Project Report\38811-Project Report Rev 0 29Nov14.docx
65
It is observed that no general trend in the occurrence of the El-Niño months over the years or monthly distribution can be concluded.
Analysing the hydro vs wind energy production in relation to the occurrence of the El-Niño and CREG dry months takes basis in a time span Nov 00 � Mar 13, using the actual production data for the four selected hydro power plans with unchanged installed capacity for the full timespan.
The normalised energy production “% actual month/average month” for the 200x2,0MW wind farm compared with the hydro generating units is shown below.
The El-Niño months are indicated in light green and the CREG months are indicated in grey. It is observed
› that the no clear interrelation can be seen between the wind energy production and the El-Niño months
› that the wind production as a tomb rule seems to be above monthly average in the dry months defined by CREG. This is illustrated in the figure below
› that no clear interrelation can be seen between the hydro production and the El-Niño months or the CREG dry months.
The occurrence of “favourable wind months” in relation to the actual El-Niño and the CREG dry months has been analysed and is summarised in the table below.
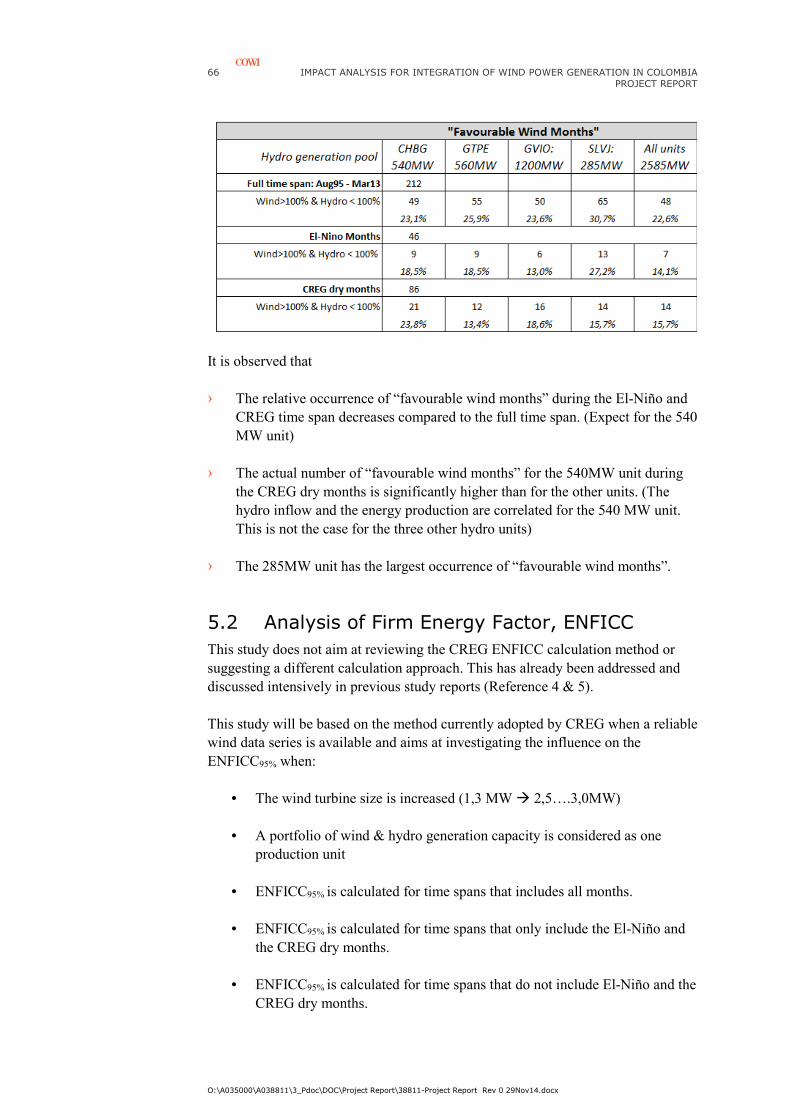
66 IMPACT ANALYSIS FOR INTEGRATION OF WIND POWER GENERATION IN COLOMBIA PROJECT REPORT
O:\A035000\A038811\3_Pdoc\DOC\Project Report\38811-Project Report Rev 0 29Nov14.docx
It is observed that
› The relative occurrence of “favourable wind months” during the El-Niño and CREG time span decreases compared to the full time span. (Expect for the 540 MW unit)
› The actual number of “favourable wind months” for the 540MW unit during the CREG dry months is significantly higher than for the other units. (The hydro inflow and the energy production are correlated for the 540 MW unit. This is not the case for the three other hydro units)
› The 285MW unit has the largest occurrence of “favourable wind months”.
5.2 Analysis of Firm Energy Factor, ENFICC
This study does not aim at reviewing the CREG ENFICC calculation method or suggesting a different calculation approach. This has already been addressed and discussed intensively in previous study reports (Reference 4 & 5).
This study will be based on the method currently adopted by CREG when a reliable wind data series is available and aims at investigating the influence on the ENFICC95% when:
• The wind turbine size is increased (1,3 MW � 2,5….3,0MW)
• A portfolio of wind & hydro generation capacity is considered as one production unit
• ENFICC95% is calculated for time spans that includes all months.
• ENFICC95% is calculated for time spans that only include the El-Niño and the CREG dry months.
• ENFICC95% is calculated for time spans that do not include El-Niño and the CREG dry months.
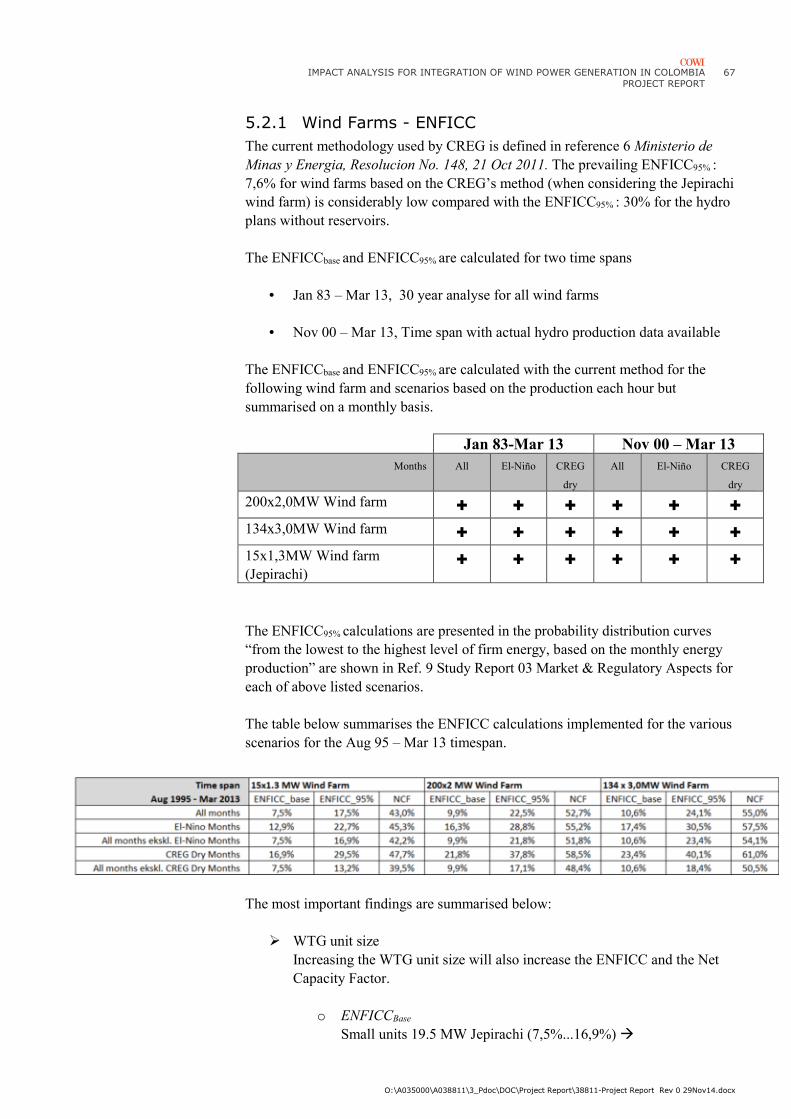
IMPACT ANALYSIS FOR INTEGRATION OF WIND POWER GENERATION IN COLOMBIA
PROJECT REPORT
O:\A035000\A038811\3_Pdoc\DOC\Project Report\38811-Project Report Rev 0 29Nov14.docx
67
5.2.1 Wind Farms - ENFICC
The current methodology used by CREG is defined in reference 6 Ministerio de
Minas y Energia, Resolucion No. 148, 21 Oct 2011. The prevailing ENFICC95% : 7,6% for wind farms based on the CREG’s method (when considering the Jepirachi wind farm) is considerably low compared with the ENFICC95% : 30% for the hydro plans without reservoirs.
The ENFICCbase and ENFICC95% are calculated for two time spans
• Jan 83 – Mar 13, 30 year analyse for all wind farms
• Nov 00 – Mar 13, Time span with actual hydro production data available
The ENFICCbase and ENFICC95% are calculated with the current method for the following wind farm and scenarios based on the production each hour but summarised on a monthly basis.
Jan 83-Mar 13 Nov 00 – Mar 13
Months All El-Niño CREG
dry
All El-Niño CREG
dry
200x2,0MW Wind farm + + + + + +
134x3,0MW Wind farm + + + + + +
15x1,3MW Wind farm (Jepirachi)
+ + + + + +
The ENFICC95% calculations are presented in the probability distribution curves “from the lowest to the highest level of firm energy, based on the monthly energy production” are shown in Ref. 9 Study Report 03 Market & Regulatory Aspects for each of above listed scenarios.
The table below summarises the ENFICC calculations implemented for the various scenarios for the Aug 95 – Mar 13 timespan.
The most important findings are summarised below:
� WTG unit size Increasing the WTG unit size will also increase the ENFICC and the Net Capacity Factor.
o ENFICCBase Small units 19.5 MW Jepirachi (7,5%...16,9%) �

68 IMPACT ANALYSIS FOR INTEGRATION OF WIND POWER GENERATION IN COLOMBIA PROJECT REPORT
O:\A035000\A038811\3_Pdoc\DOC\Project Report\38811-Project Report Rev 0 29Nov14.docx
Large units 402 MW “132x3MW” (10,6%...23,4%)
o ENFICC95% Small units 19.5 MW Jepirachi (13,2 % …. 29,5%) � Large units 402 MW “132x3MW” (18,4% …. 40,1%) First figure represent minimum of all months the second is maximum of the El Niño or CREG dry month time span only.
Above is a result of the higher hub height of the wind turbine giving an increase in the average wind speed and the larger diameter of the wings that allow the units producing more energy at low wind speed.
� Wind farm performance All months vs. El-Niño months
o ENFICC A significant increase of the ENFICCBase (≈ +6%) and ENFICC95% (≈ +6%) is observed for both the 400 MW and the 402MW wind farm when comparing the El-Niño months separate with all the months in the time range Aug 95 – Mar 13.
� Wind farm performance All months vs. CREG dry months ENFICCCREG dry months are significant higher than ENFICCall months and also higher than ENFICCEl-Niño months
o ENFICC
A significant increase of the ENFICCBase (≈ +11%) and ENFICC95% (≈ +15%) is observed for both the 400 MW and the 402MW wind farm when comparing the CREG dry months separate with all the months in the time range Aug 95 – Mar 13.
Further reference is given to study report 03.
5.2.2 Hydro Power Plans – ENFICC
ENFICC calculations for the hydro power plants based on CREG’s methodology taking the dams and reservoirs into account fall outside of this studies scope. This study aims at investigating the ENFICC for Wind/Hydro generation units in a portfolio context. Thus a similar calculation approach for the wind and hydro generating plans is selected for this study.
The ENFICCbase and ENFICC95% for each of the selected hydro generation units are calculated from the actual energy production being reported on an hourly basis in the Genera Real Hidrau Hora por central.txt provided by UMPE.

IMPACT ANALYSIS FOR INTEGRATION OF WIND POWER GENERATION IN COLOMBIA
PROJECT REPORT
O:\A035000\A038811\3_Pdoc\DOC\Project Report\38811-Project Report Rev 0 29Nov14.docx
69
The tables below summarises the ENFICC calculations for the various scenarios for each hydro generating unit:
It is noticed that the ENFICC calculated from the actual energy production for each hydro plant are in the range of (ENFICCbase 11%-17%) and (ENFICC95% 18%-27%). This is significantly less than expected since 30% and 50% currently are considered for production units with or without storage. This can partly be explained in the fact that the CEN "effective net capacity” are informed to be equal to the installed capacity. This will impose that the ENFICC figures are lower. It is also observed that the differences of the ENFICC (resulting from a comparison of the all month timespan with the El-Nino & the CREG dry months timespan) not are comparable in size or trend (both positive and negative changes occur). This study does not aim at calculating the ENFICC for hydro power plans only. The study aims at investigating the ENFICC impact from a hydro/wind portfolio compared with the separate hydro and wind generating units. Only the trend is investigated and no accurate recommendations in relation to the portfolio ENFICC are targeted. Consequently the above ENFICC figures will be used for the portfolio analyse only.
5.2.3 Portfolio analysis – ENFICC
The portfolio ENFICC study is based on a 50% wind and 50 % hydro generation mix.
The production data previously computed for the hydro generation units are used for the wind/hydro portfolio analyse in relation to the ENFICC.
The monthly energy production for the 285MW, 540MW, 560MW, 1200MW wind farm scenarios used for the portfolio ENFICC analysis are scaled in percentage from the 400MW wind farm (200x2MW) in relation to the effective net capacity “CEN”. The ENFICCbase and ENFICC95% for the wind/hydro generation portfolios are calculated from a monthly energy production by adding the monthly energy production from the wind farm and the hydro generator plant.
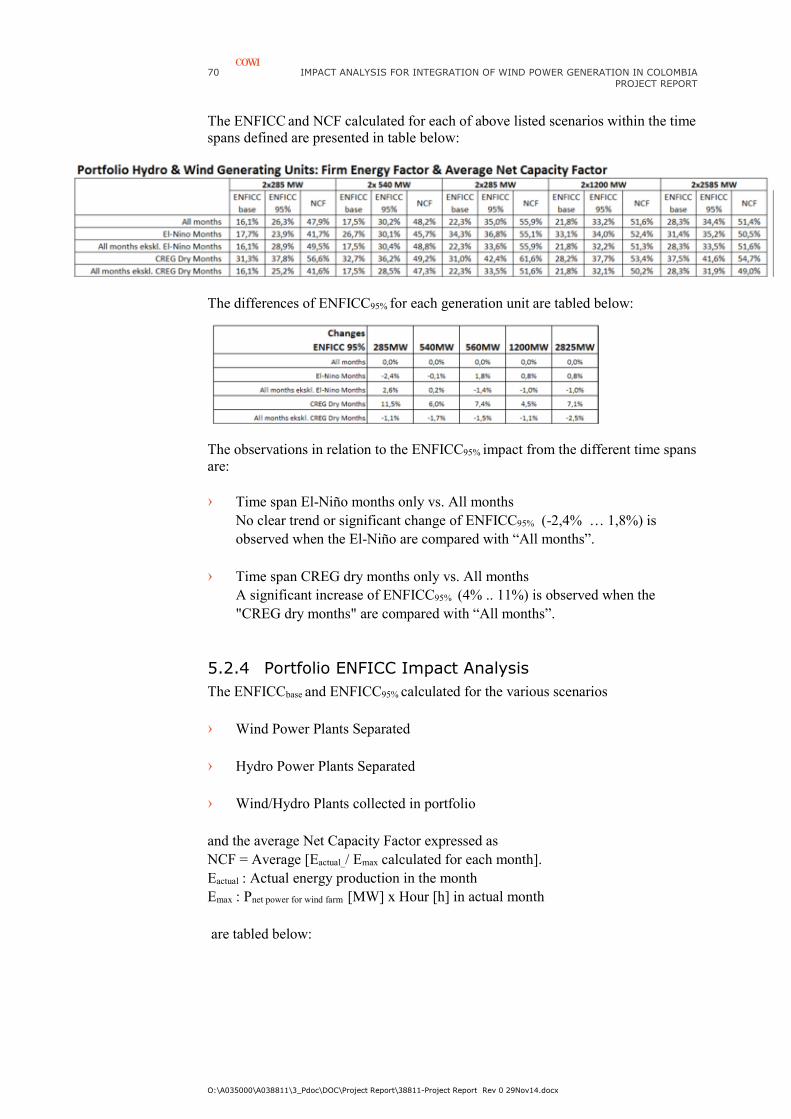
70 IMPACT ANALYSIS FOR INTEGRATION OF WIND POWER GENERATION IN COLOMBIA PROJECT REPORT
O:\A035000\A038811\3_Pdoc\DOC\Project Report\38811-Project Report Rev 0 29Nov14.docx
The ENFICC and NCF calculated for each of above listed scenarios within the time spans defined are presented in table below:
The differences of ENFICC95% for each generation unit are tabled below:
The observations in relation to the ENFICC95% impact from the different time spans are: › Time span El-Niño months only vs. All months
No clear trend or significant change of ENFICC95% (-2,4% … 1,8%) is observed when the El-Niño are compared with “All months”.
› Time span CREG dry months only vs. All months A significant increase of ENFICC95% (4% .. 11%) is observed when the "CREG dry months" are compared with “All months”.
5.2.4 Portfolio ENFICC Impact Analysis
The ENFICCbase and ENFICC95% calculated for the various scenarios
› Wind Power Plants Separated
› Hydro Power Plants Separated
› Wind/Hydro Plants collected in portfolio
and the average Net Capacity Factor expressed as NCF = Average [Eactual_/ Emax calculated for each month]. Eactual : Actual energy production in the month Emax : Pnet power for wind farm [MW] x Hour [h] in actual month are tabled below:
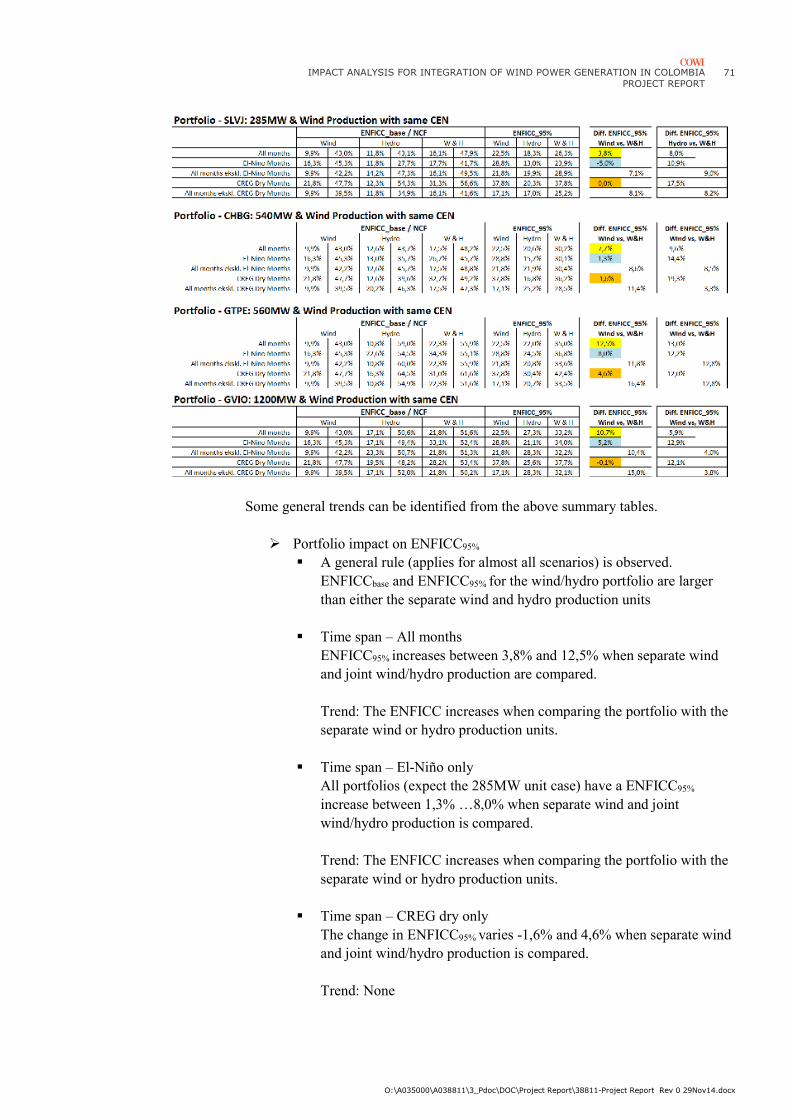
IMPACT ANALYSIS FOR INTEGRATION OF WIND POWER GENERATION IN COLOMBIA
PROJECT REPORT
O:\A035000\A038811\3_Pdoc\DOC\Project Report\38811-Project Report Rev 0 29Nov14.docx
71
Some general trends can be identified from the above summary tables.
� Portfolio impact on ENFICC95% � A general rule (applies for almost all scenarios) is observed.
ENFICCbase and ENFICC95% for the wind/hydro portfolio are larger than either the separate wind and hydro production units
� Time span – All months ENFICC95% increases between 3,8% and 12,5% when separate wind and joint wind/hydro production are compared. Trend: The ENFICC increases when comparing the portfolio with the separate wind or hydro production units.
� Time span – El-Niño only All portfolios (expect the 285MW unit case) have a ENFICC95%
increase between 1,3% …8,0% when separate wind and joint wind/hydro production is compared. Trend: The ENFICC increases when comparing the portfolio with the separate wind or hydro production units.
� Time span – CREG dry only The change in ENFICC95% varies -1,6% and 4,6% when separate wind and joint wind/hydro production is compared. Trend: None
72 IMPACT ANALYSIS FOR INTEGRATION OF WIND POWER GENERATION IN COLOMBIA PROJECT REPORT
O:\A035000\A038811\3_Pdoc\DOC\Project Report\38811-Project Report Rev 0 29Nov14.docx
5.2.5 Conclusions – ENFICC
5.2.5.1 EFICC – wind farms
CREG’s approach for determining the Firm Energy Factor for wind energy does not consider the complementarity between the hydro and wind energy production.
Based on the Firm Energy Factors (calculated in compliance with the methodology currently used by CREG with wind data series established) for all months and the months with low water resources the following conclusions can be draw up:
• The ENFICC calculated for the new and larger wind turbines indicates significant higher figures than CREG assume today (ENFICCbase = 6% and ENFICC95%=7,3%).
• ENFICC calculated All months timespan: ENFICCbase ≈10% and ENFICC95% ≈23% El-Niño months time span: ENFICCbase ≈16% and ENFICC95% ≈29% CREG dry months time span: ENFICCbase ≈22% and ENFICC95% ≈39%
• Wind turbine impact on ENFICC95% (1.3MW �3,0MW) All months time span: ≈ +6% El-Niño months time span: ≈ +8% CREG dry months time span: ≈ +10%
• El-Niño & CREG dry month impact on ENFICC95% Only El-Niño months timespan compared with All months: ≈ +5...6% Only CREG dry months timespan compared with All months: ≈ +12...16%
Based on above an adjustment (≈ +10…20%) of the ENFICC95% figures for an isolated wind farm previously being based on the Jepirachi 15x1,3MW wind farm can be augmented since:
1. The wind turbine units installed are larger today resulting in an ENFICC95%
increase ≈+6..10%.
2. ENFICC95% is higher (≈ +5…6%) during the El-Niño months with relatively less water resources.
3. ENFICC95% is higher (≈ +12…16%) during the GREC dry months with relatively less water resources.
5.2.5.2 ENFICC – wind/hydro - portfolio
No clear conclusions can be extracted from the ENFICC simulations implemented.
IMPACT ANALYSIS FOR INTEGRATION OF WIND POWER GENERATION IN COLOMBIA
PROJECT REPORT
O:\A035000\A038811\3_Pdoc\DOC\Project Report\38811-Project Report Rev 0 29Nov14.docx
73
5.3 Wind Energy Integration Strategies
5.3.1 Key barriers
In addition to the financial aspect and the need for support mechanisms if the large wind power potential in Colombia is wanted to be utilised, the following two main issues should be addressed:
› Administrative and grid access barriers
› System operation including forecasting
5.3.2 Administrative and grid access barriers
In Europe, the European wind energy association, EWEA, has carried out a study which identifies four barriers that compromise the development of wind energy, with respect to administration and grid connection.
In order to utilise the wind power potential in Colombia, the wind energy integration strategy should also deal with these factors.
Grid connection lead time
Grid connection lead time is often high because of grid connection procedures.
EWEA Recommendations: › Reduce average grid connection time › Set and adhere to strict deadlines for administration processes › Provide well-defined requirements for grid connections and capacities at
common coupling points to the public › Closer collaboration of developer and grid operators
Grid connection costs
Investment risks become high where grid cost information is not well defined or provided early enough in the development process. Different regulations on the share of grid connection costs between system operators and developers, can limit access for some developers. Reports in some EU countries show that connection costs can have significant differences depending on the distribution company, which can affect grid access for developers.
EWEA Recommendations: › System operators should cover and/or contribute to the costs of grid
connection › System operators should adapt costs to the project size › Better definition (and eventually standardization) of grid codes and connection
requirements, which are realistic and correspond with the latest technologies available to developers
74 IMPACT ANALYSIS FOR INTEGRATION OF WIND POWER GENERATION IN COLOMBIA PROJECT REPORT
O:\A035000\A038811\3_Pdoc\DOC\Project Report\38811-Project Report Rev 0 29Nov14.docx
Transparency of grid connection process
Grid connection transparency reflects greatly in standards for accessibility to grid connection data, deadlines for the grid connection process, consistency of decision making for allowing connection and collaboration between parties involved. Connections requests would benefit from better coordination between distribution and transmission companies.
Physical grid access
In many countries the grid is underdeveloped in windy areas. This causes problems with grid access where developers have to wait longer to get physical connection to the grid. This supports the need for sufficient funding by and collaboration with the grid operators or energy companies to resist such barriers and provide necessary grid reinforcements and extensions in due time.
A note should also be made on the relation between grid access and access to land for grid connections. It is often the responsibility of the developer to construct transmission lines interconnecting the wind park to the grid connection point. In many countries a parallel project with environmental impact assessment studies must be established in gaining approval for this transmission line.
5.3.3 System operation including forecasting
The unpredictability of wind power makes it necessary to have the capability to regulate both up and down to accommodate deviations in wind power forecasts.
An effective operation of the power system can make the system more adapt to larger shares of variable renewable power.
Transmission and interconnection capacity
A strong transmission and distribution grid with strong interconnections to neighbouring power systems/markets is an important element in large scale wind deployment.
Forecasting
Wind forecasts are used to calculate how much wind power the wind turbines will generate, e.g. minute by minute. With increasing amounts of wind power in the system, accurate forecasting will become more and more important.
Technical regulation and grid codes
The technical regulations help ensure the physical operation of interconnected high-voltage grids and system security. Technical regulation including the requirements that a wind farm must meet at the connection point must be in place in appropriate detail to ensure the physical grid functioning and system security.
IMPACT ANALYSIS FOR INTEGRATION OF WIND POWER GENERATION IN COLOMBIA
PROJECT REPORT
O:\A035000\A038811\3_Pdoc\DOC\Project Report\38811-Project Report Rev 0 29Nov14.docx
75
6 List of references
1. CREG 2006. "Reliability charge – Regulatory scheme to guarantee the
reliability in the supply of electric energy in Colombia, a long-term vision".
2. Isaac Dyner et. al. 2011. "An enabling framework for wind power in
Colombia: what are the lessons from Latin America?". July 2011
3. Ministry of Mines and Energy. "The Reference Expansion Plan, Generation –
Transmission, 2006-2020".
4. Oxford Institute 2012. "Private Investment in Wind Power in Colombia". A report commissioned by the UK Foreign and Commonwealth Office's Latin America Prosperity Fund. July 2012.
5. World Bank. "Wind Energy in Colombia, A framework for Market Entry". The World Bank. Washington, D.C. July 2010.
6. Ministerio de Minas y Energia, Resolucion No. 148, 21 Oct 2011
7. Study Report 01: Power System Technical Analysis – Neplan
8. Study Report 02: AEP & Financial Feasibility Analysis
9. Study Report 03: Market & Regulatory Aspects
10. Study Report 04: NEPLAN Training Package

76 IMPACT ANALYSIS FOR INTEGRATION OF WIND POWER GENERATION IN COLOMBIA PROJECT REPORT
O:\A035000\A038811\3_Pdoc\DOC\Project Report\38811-Project Report Rev 0 29Nov14.docx
Appendix A Normalised Hydro Production
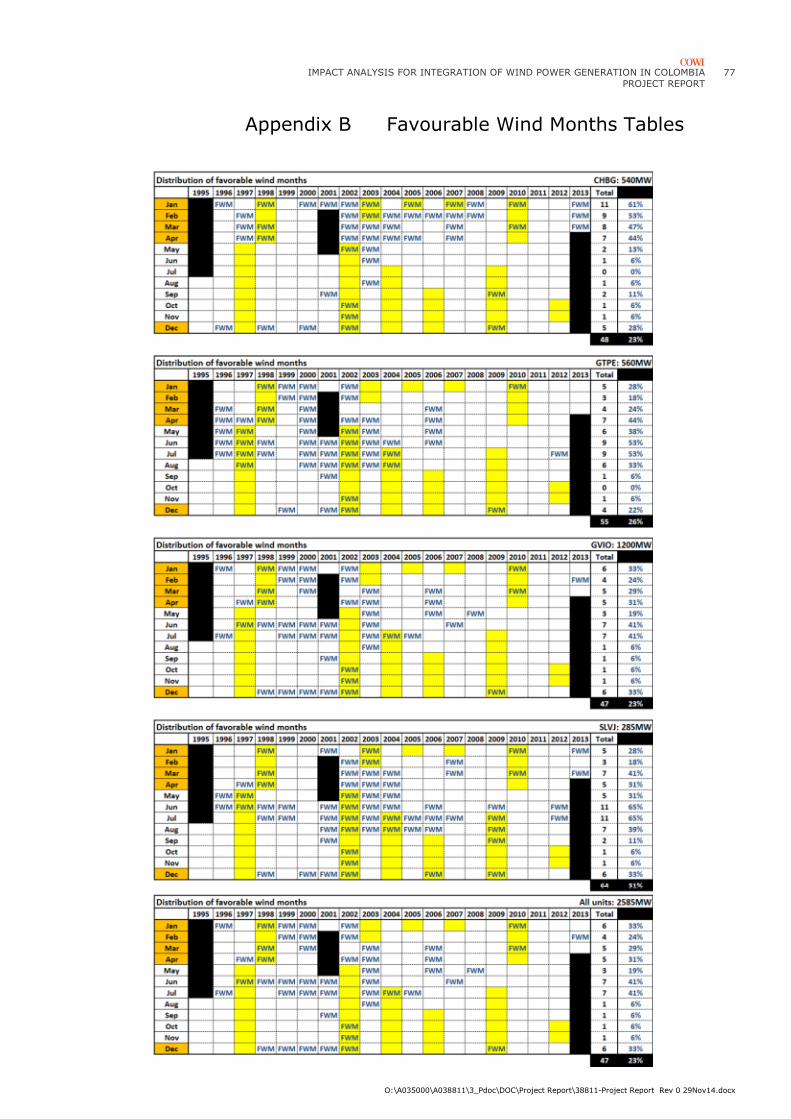
IMPACT ANALYSIS FOR INTEGRATION OF WIND POWER GENERATION IN COLOMBIA
PROJECT REPORT
O:\A035000\A038811\3_Pdoc\DOC\Project Report\38811-Project Report Rev 0 29Nov14.docx
77
Appendix B Favourable Wind Months Tables

78 IMPACT ANALYSIS FOR INTEGRATION OF WIND POWER GENERATION IN COLOMBIA PROJECT REPORT
O:\A035000\A038811\3_Pdoc\DOC\Project Report\38811-Project Report Rev 0 29Nov14.docx
Appendix C Favourable Wind Months – Graphs