immunometabolism gd t cells regulate the intestinal
TRANSCRIPT

RESEARCH ARTICLE SUMMARY◥
IMMUNOMETABOLISM
gd T cells regulate the intestinal response tonutrient sensingZuri A. Sullivan, William Khoury-Hanold, Jaechul Lim, Chris Smillie, Moshe Biton, Bernardo S. Reis,Rachel K. Zwick, Scott D. Pope, Kavita Israni-Winger, Roham Parsa, Naomi H. Philip, Saleh Rashed,Noah Palm, Andrew Wang, Daniel Mucida, Aviv Regev, Ruslan Medzhitov*
INTRODUCTION: The gastrointestinal (GI) tract isa multikingdom cellular ecosystem that facili-tates the procurement of nutrients from theenvironment. In constant contact with theexternal world, the small intestine is at once agateway for life-threatening pathogens andtoxins and the site of absorption for life-sustaining nutrients. Consequently, this tissueis tasked with the challenge of balancing itsprimary functions of nutrient uptake and hostdefense in response to a complex and constantlychanging environment.This challenge is particularly daunting for
omnivores, whose diets change on daily, sea-sonal, and developmental time scales. Thediverse diets of such generalists stand incontrast to those of specialists—animals thatconsume restricted diets—such as carnivoresand herbivores.Whereas these specialists haveevolved fixed morphologic adaptations in theorganization of the GI tract that facilitate ef-ficient nutrient uptake from their restricteddiets, generalists must constantly adapt to theshifting availability of food sources of diversenutrient composition encountered throughoutlife. These ongoing changes in diet exist along-
side encounters with ingested toxins, entericpathogens, and commensal microbes. Omniv-orous lifestyles therefore require that the GItracts of such animals dynamically adapt to thechanges in availability of different nutrients.Weexamined the molecular and cellular mecha-nisms that regulate intestinal adaptation todiverse foods.
RATIONALE:We investigated how the enzymesand transporters involved in the digestion andabsorption of macronutrients are regulated inresponse to diet. We designed special animaldiets that differed only in the ratio of protein tocarbohydrates and evaluated gene expressionchanges in the GI tract, as well as systemicmetabolism, after feeding these diets to mice.Recent discoveries pertaining to intestinal de-fenses against parasitic andmicrobial pathogenshave demonstrated that interactions betweenintestinal epithelial cells and lymphocytes—the largest population of lymphocytes in thebody—coordinate tissue responses to entericinfection. Guided by these findings, we hypoth-esized that the regulation of nutrient-handlingmachinery may involve coordination between
tissue-resident lymphocytes and intestinal epi-thelial cells. Furthermore, recent work inves-tigating mechanisms of host defense in thistissue led us to hypothesize that cellular re-modeling of the intestinal epithelium, whichoccurs in response to certain infections, mayalso underlie its adaptation to different nutrients.
RESULTS:Acarbohydrate transcriptionalprogramcomprising enzymes and transporters thatme-diate the digestion and absorption of carbohy-drateswas inducedondemand in small-intestineepithelial cells in response to carbohydrate avail-ability. The induction of this transcriptionalprogram was specifically due to the availabil-ity of carbohydrates and reflected functionalchanges in nutrient handling at the tissue andsystemic levels. Mice fed a high-carbohydratediet exhibited changes in the frequency of spe-cialized enterocyte subsets. This indicated thatfunctional specialization exists within the en-terocyte compartment, which constitutes ap-proximately 80% of the intestinal epithelium.This also suggested that the induction of thecarbohydrate transcriptional program involvedcellular remodeling of the intestinal epithelium.The induction of this program and correspond-ing epithelial remodeling occurred rapidly, afteronly 5 days of high-carbohydrate feeding. Un-expectedly, the on-demand induction of thisprogram required gd T cells, a population oflymphocytes enriched at barrier surfaces whosebiology remains poorly understood. Intestinalgd T cells were altered by diet, with changesobserved in their transcriptome, tissue localiza-tion, and behavior. The diet-dependent regu-lation of this program by gd T cells involvedsuppression of a negative regulator, interleukin-22(IL-22). Thus,we defined an epithelial-lymphocytecircuit that regulates the intestinal responseto nutrient sensing and facilitates the adap-tation to diverse diets.
CONCLUSION: Our work demonstrates a role forintestinal lymphocytes in regulating the tissueresponse to dietary nutrients. Together withother studies in the realm of host-pathogen in-teractions, our results indicate that lymphocyte-epithelial circuits and epithelial remodelingrepresent general features of how the intestineadapts to environmental change. By linkingnutrition and barrier function at both thecellular andmolecular levels, these adaptationsallow this complex tissue to adjust the balancebetween nutrient uptake and host defense inresponse to environmental change.▪
RESEARCH
Sullivan et al., Science 371, 1223 (2021) 19 March 2021 1 of 1
The list of author affiliations is available in the full article online.*Corresponding author. Email: [email protected] this article as Z. A. Sullivan et al., Science 371,eaba8310 (2021). DOI: 10.1126/science.aba8310
READ THE FULL ARTICLE AThttps://doi.org/10.1126/science.aba8310
Nutrients
Pathogens
Nutrient uptake
Host defense Epithelium
Lymphocytes
Tissue adaptationEnvironment
Lymphocyte-epithelial interactions mediate intestinal adaptation to environmental change. The smallintestine adjusts the balance between host defense and nutrient uptake in response to environmental signals,including the availability of nutrients and presence of pathogens. The ability of this tissue to adjust thebalance between its primary functions in response to environmental cues is mediated through cellularremodeling of the epithelium and lymphocyte-epithelial circuits.
on March 29, 2021
http://science.sciencem
ag.org/D
ownloaded from

RESEARCH ARTICLE◥
IMMUNOMETABOLISM
gd T cells regulate the intestinal response tonutrient sensingZuri A. Sullivan1*, William Khoury-Hanold1, Jaechul Lim1, Chris Smillie2, Moshe Biton2†,Bernardo S. Reis3, Rachel K. Zwick4, Scott D. Pope1,5, Kavita Israni-Winger1, Roham Parsa3,Naomi H. Philip1, Saleh Rashed1, Noah Palm1, Andrew Wang1,6, Daniel Mucida3,Aviv Regev2,7,8‡, Ruslan Medzhitov1,5§
The intestine is a site of direct encounter with the external environment and must consequently balancebarrier defense with nutrient uptake. To investigate how nutrient uptake is regulated in the smallintestine, we tested the effect of diets with different macronutrient compositions on epithelial geneexpression. We found that enzymes and transporters required for carbohydrate digestion and absorptionwere regulated by carbohydrate availability. The “on-demand” induction of this machinery required gdT cells, which regulated this program through the suppression of interleukin-22 production by type 3innate lymphoid cells. Nutrient availability altered the tissue localization and transcriptome of gd T cells.Additionally, transcriptional responses to diet involved cellular remodeling of the epithelial compartment.Thus, this work identifies a role for gd T cells in nutrient sensing.
Animal diets range in diversity. Specialistsrely on a restricted set of food sources,whereas generalists, such as humans andother omnivores, derive nutrition fromdiverse foods (1). For specialists, fixed
morphologic adaptations in the organizationof the gastrointestinal tract allow for efficientnutrient uptake from restricted food sources(1, 2). By contrast, generalists require dynamicadaptation to the diverse foods that are con-sumed throughout life. Several features of thesmall intestine facilitate this flexibility. Themammalian small intestine contains the mostlymphocytes of any organ and most neuronsoutside the brain (3, 4). In addition, the intes-tinal epithelium turns over every 4 to 5 daysand contains various sensory cell types thattogether make up the gastrointestinal chemo-sensory system (5, 6). The vast majority of epi-thelial cells are absorptive enterocytes, whichexpress brush border enzymes and specializednutrient transporters involved in the uptake ofluminal nutrients (7, 8). Equally important in
the digestion of dietary nutrients are enzymessecreted from the pancreas into the duodenallumen. Pancreatic amylases, lipases, and pro-teases initiate enzymatic digestion of carbohy-drates, lipids, and proteins, respectively, afterchemical and mechanical digestion in thestomach (7, 8).The elaborate sensory capacity of the small
intestine and rapid turnover of epithelial cellslikely confer omnivores with flexibility in theexpression of nutrient-handling machinery tomaximize digestive efficiency. The loss of lactaseexpression in adult humans, which gives riseto the phenomenon of lactose intolerance, in-dicates that this machinery is regulated bysubstrate availability (9). Although individualcomponents of digestive machinery have beendemonstrated to be regulated by nutrient avail-ability, whether entire programs can be regu-lated in this manner and the mechanisms bywhich these programs are regulated have notbeen elucidated (10–13).
ResultsEnteric carbohydrate transcriptional program isinduced on demand
We tested whether and how nutrient-handlingmachinery can be dynamically regulated by nu-trient availability. Mice were fed isocaloric dietshigh in either carbohydrates or protein for5 days, and small-intestine epithelial cells werethen analyzed by means of RNA-sequencing(RNA-seq). High-carbohydrate feeding resultedin the up-regulation of the enteric and pancre-atic genes involved in the digestion and absorp-tion of dietary carbohydrates (hereafter referredto as “carbohydrate transcriptional program”)(Fig. 1, A to C). This program includes pancreaticand brush border enzymes, as well as mono-
saccharide transporters expressed in absorptiveenterocytes (Fig. 1B). Expression of proteasesand amino acid transporters was less sensitiveto nutrient availability (Fig. 1A), presumablybecause unlike glucose, which can be gener-ated endogenously through gluconeogenesisand glycogenolysis, essential amino acids canonly be obtained from the diet.We next askedwhether the regulation of the
carbohydrate transcriptional programwas duespecifically to the availability of carbohydratesrather than differences in availability of pro-teins. When mice were fed diets matched forprotein that differed in the ratio of fat to car-bohydrates, we found increased expression ofthis program in mice fed a high-carbohydratediet, independent of protein abundance (Fig.1D). Animals fed a high-carbohydrate diet andtreated with acarbose—an a-glucosidase inhib-itor that would limit carbohydrate availabilityfor absorption—showed diminished expressionof this program (Fig. 1E). Thus, carbohydrateavailability drives the expression of the carbo-hydrate transcriptional program.Theon-demandinduction of this program was also preservedin germ-free mice, indicating that it does notrequire microbial colonization (fig. S1). Last,mice fed a high-carbohydrate diet for 5 daysshowed more rapid glucose uptake after gavageand increased respiratory quotient comparedwith mice fed a high-protein diet, indicatingthat the observed transcriptional changes re-flect functional changes in nutrient handling(Fig. 1, F to H).Two non–mutually exclusive mechanisms
could explain the transcriptional changes weobserved in response to diet. These changescould arise from direct induction of this tran-scriptional program in differentiated enterocytesor could involve differentiation of specializedenterocytes that express this program. Althoughspecialized enterocyte subsets have not beenpreviously described, recent reports investigat-ing the intestinal response to infection suggestthat epithelial remodeling can underlie tran-scriptional responses to environmental changein this tissue (14–18). The induction kinetics ofthe carbohydrate transcription program weresuggestive of epithelial remodeling. In “pulse-chase” experiments, in which mice were fed ahigh-carbohydrate diet and switched to a high-protein diet for 1 or 5 days, 5-day exposure tothe high-protein diet was required for reductionof the carbohydrate transcriptional program(Fig. 2A). Given the 4- to 5-day time scale ofsmall-intestine epithelial turnover, we hypothe-sized that these kineticsmay reflect remodelingof the epithelial compartment in response tonutrient availability. Single-cell RNA-seq (scRNA-seq) of small-intestine epithelial cells frommice that were fed a high-carbohydrate orhigh-protein diet indicated that a number ofepithelial subsets were altered in frequencyafter 5-day exposure to either of these diets.
RESEARCH
Sullivan et al., Science 371, eaba8310 (2021) 19 March 2021 1 of 12
1Department of Immunobiology, Yale University School ofMedicine, New Haven, CT, USA. 2Klarman Cell Observatory,Broad Institute, Cambridge, MA, USA. 3Laboratory ofMucosal Immunology, The Rockefeller University, New York,NY, USA. 4Program in Craniofacial Biology and Departmentof Orofacial Sciences, University of California, San Francisco,CA, USA. 5Howard Hughes Medical Institute, New Haven, CT,USA. 6Division of Rheumatology, Department of Medicine,Yale University School of Medicine, New Haven, CT, USA.7The David H. Koch Institute for Integrative Cancer Researchat MIT, Department of Biology, Massachusetts Institute ofTechnology (MIT), Cambridge, MA, USA. 8Howard HughesMedical Institute, Cambridge, MA, USA.*Present address: Department of Molecular and Cellular Biology,Harvard University, Cambridge, MA, USA. †Present address:Department of Biological Regulation, Weizmann Institute ofScience, 7610001, Rehovot, Israel. ‡Present Address: Genentech,1 DNA Way, South San Francisco, CA, USA.§Corresponding author. Email: [email protected]
on March 29, 2021
http://science.sciencem
ag.org/D
ownloaded from

Sullivan et al., Science 371, eaba8310 (2021) 19 March 2021 2 of 12
Amylase
Starch
Sucrose
Maltotriose
Maltose
Lactose Lactase
Sucrase-isomaltase
Maltase-glucoamylase
SGLT1
GLUT5
GLUT2
GLUT2
High carb High protein1000
1100
1200
1300
1400
1500
AU
C
Respiratory exchange ratio
****
0 12 24 36 48 60 72 84 96 1080.6
0.8
1.0
1.2
1.4
Time (hours)
RE
R (
VC
O2/
VO
2)
Respiratory exchange ratio
High proteinHigh carb
0 5 10 15 200
200
400
600
minutes
bloo
d gl
ucos
e (m
g/dL
)
Glucose uptake
high carb
high prot
30mg glucose gavage
**
A B
C
D E
F G
H
−3 −2 −1 0 1 2 3
6
5
4
3
2
1
0n = 10,651
Others
Carb (5)Prot (16)Fat (6)
Log2 (Fold change)(Carb/ Prot)
-Log
10 (
P-v
alue
)
Sis
Mga
m
Slc2a2
Slc2a5
Slc5a1
0
2000
4000
6000
8000
***
***
*** ******
rela
tive
expr
essi
ion
vs. R
pl13
* 1
03
Small intestine epithelium
Amy2
a1
Amy2
a2
Amy2
a3
Amy2
a4
Amy2
a5
Amy2
bPnli
pPrs
s10
2040
100000
300000
500000high carb
high protein
*** ***
*
**
Pancreas
Sis
Mga
m
Slc2a2
Slc2a5
Slc5a1
0
2000
4000
6000
8000
rela
tive
expr
essi
on
vs. R
pl13
* 1
03
***
***
***
***
**
Small intestine epithelium
high fat/low carb
0 fat/high carb
Sis
Mga
m
Slc2a2
Slc2a5
Slc5a1
0
1000
2000
3000
4000
rela
tive
expr
essi
on
vs. R
pl13
* 1
03
high carbPBS
high carbacarbose
**
*
**
*
**
Small intestine epithelium
RESEARCH | RESEARCH ARTICLEon M
arch 29, 2021
http://science.sciencemag.org/
Dow
nloaded from

Thus, nutrient availability can likely alter thecomposition of the small-intestine epithelialcompartment (Fig. 2, B to C, and fig. S2). Spe-cifically, a high-carbohydrate diet resultedin a reduction in the frequency of Fabp6+
enterocytes and an increase in the frequencyof stem cells (Fig. 2C). Expression of the car-bohydrate transcriptional programwas enrichedin Fabp1+ enterocytes, suggesting that a changein the ratio of Fabp1+ to Fabp6+ enterocytesaccounts, at least in part, for the transcriptionalchanges we observed (Fig. 2D). Enrichment ofthis program in transit-amplifying cells furthersuggests that specialized epithelial differentia-tion underlies its induction. Single-moleculefluorescence in situ hybridization (FISH) ex-periments revealed intercellular heterogeneityin the expression of the carbohydrate transcrip-tional program, particularly along the crypt-villus axis (Fig. 2E). One of the components ofthe carbohydrate transcriptional program, Slc2a2,was previously identified as a “landmark” genefor defining spatial heterogeneity in intestinalvilli (19). This indicated that intercellular het-erogeneity in enterocyte nutrient-handlingma-chinery reflects regional patterns in epithelialgene expression along the crypt-villus axis. Thephenomenonof small-intestineepithelial remodel-ing has been observed in the context of otherenvironmental stimuli—specifically bacterial,protozoan, or helminth infection—that promotehyperplasia of secretory epithelial cells involvedin host defense (14–18, 20). Together with theseprevious reports, our results suggest that epithelialremodeling may be a general strategy by whichthe intestine adapts to environmental change.
gd T cells regulate the carbohydratetranscriptional program
We next investigated whether direct sensingof glucose by epithelial cells was sufficient todrive induction of the carbohydrate transcrip-tional program. Small-intestine organoids cul-tured in differing concentrations of glucose didnot exhibit robust induction of this program(Fig. 3A). This suggested that direct epithelialsensing was not sufficient to drive activation ofthis program. TRPM5 (transient receptor po-tential cation channel subfamily M member5)–mediated taste receptor signaling and theglucose transporter SGLT1 (sodium/glucosecotransporter 1) were dispensable for induc-
tion of this program in vivo (fig. S3). Thus, weconsidered whether other cell types present inthe intestinemight contribute to its activation.The mouse small intestine contains the
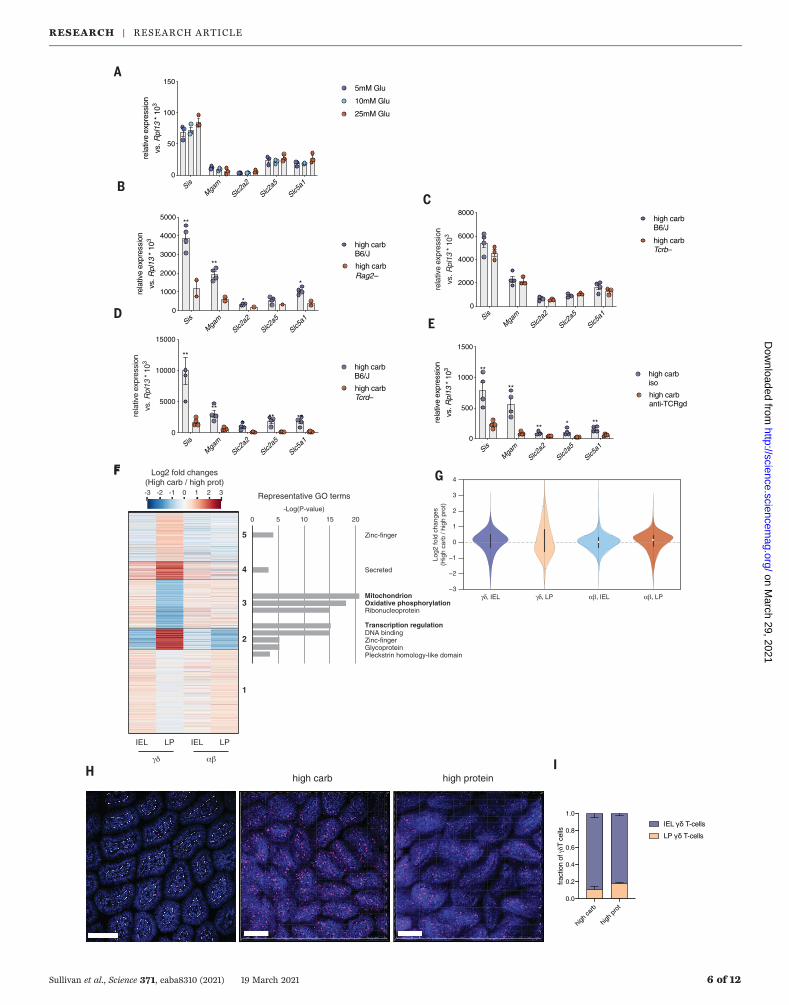
greatest number of lymphocytes of any tissue,and several recent studies have demonstratedthat resident lymphocytes can control epithe-lial cell fate in response to sensing of entericinfection (4, 14, 16, 17). We hypothesized thatepithelial-lymphocyte circuitry may also con-trol enteric adaptation to diet. Animals treatedwith an antibody to Thy1 to deplete T cells andinnate lymphoid cells (ILCs) exhibited an im-paired induction of the carbohydrate transcrip-tional program, suggesting the involvement ofT cells or ILCs (fig. S4A). The induction of acarbohydrate transcriptional programwas alsodeficient in Rag2−/− mice that were fed a high-carbohydrate diet (Fig. 3B). Together, the re-sults in Rag2−/−mice (which lack B and T cells),and in mice treated with antibody to Thy1(which lack ILCs and T cells) indicate the in-volvement of T cells in regulating the tran-scriptional response in epithelial cells. Likeother barrier tissues, the small intestine con-tains a large number of both ab and gd T cells.Although the role of intestinal ab T cells inantimicrobial and allergic defense is well es-tablished, whether they or gd T cells play arole in the response to nutrient sensing is un-explored. When we depleted ab T cells usingan antibody to T cell receptor b (TCRb) orTcrb−/−
mice, we found that ab T cells were dispens-able for the induction of this program (Fig. 3Cand fig. S4B). By contrast, mice treated withan antibody to TCRgd or that were geneticallydeficient in gd T cells exhibited defective induc-tion of the carbohydrate transcriptional program,with a more robust dependency in antibody-treated animals, presumably owing to devel-opmental compensation in constitutive knockoutmice (Fig. 3, D to E). Thus, gd T cells are requiredfor the induction of nutrient-handlingmachineryin response to a high-carbohydrate diet.Intestinal gd T cells are present in two ana-
tomically and developmentally distinct tissuecompartments: the intraepithelial lymphocyte(IEL) and lamina propria (LP) lymphocytefractions (21). IELs are highly abundant anddynamic and interact intimatelywith epithelialcells (4, 20). By contrast, LP gd T cells representa minor fraction of the CD45+ cells in this
compartment. Given their proximity to epi-thelial cells, we hypothesized that IEL gdT cells would be most responsive to diet.However, when we quantified with micros-copy and flow cytometry the number of IELsversus LPLs, we found that LP, not IEL, gdT cells increased in frequency and numberduring high-protein feeding (Fig. 3, H and I,and fig. S5). To further investigate the effectof diet on IEL versus LP gd T cells, we per-formed intravital imaging studies in Tcrd–green fluorescent protein (GFP) mice. LP gdT cell numbers increased in mice fed a high-protein diet (Fig. 3, H and I, and fig. S5), andIEL gd T cells exhibited more rapid move-ment in mice fed a high-carbohydrate diet,suggesting that both gd T cell compartmentsare affected by nutrient availability (movie S1).Last, we investigated whether diet might alterthe proximity of gd T cells to the intestinalcrypt. We hypothesized that during a high-carbohydrate diet, gd T cells interact withintestinal epithelial progenitors near the cryptbase to drive the transcriptional responses andepithelial remodeling that we observed. Usingthree-dimensional (3D) tissue imaging, we quan-tified the relative abundance of gd T cells alongthe crypt-villus axis and found an increased fre-quency of gd T cells localized close to the cryptbase in animals fed a high-carbohydrate diet(fig. S6). Thus, gd T cells may influence thetranscriptome and/or differentiation programof intestinal epithelial cells by interacting withepithelial progenitors in the crypt base.We then performed RNA-seq on ab and gd
T cells isolated from intraepithelial and LP com-partments. Unlike ab T cells, gd T cells fromboth compartments exhibited significant tran-scriptional responses to nutrient sensing (Fig.3, F and G). In particular, the LP gd T cell com-partment showed the greatest number of dif-ferentially expressed genes in response to ahigh-carbohydrate versus high-protein diet (Fig.3G and tables S3 and S4). Thus, this compart-ment may be the most sensitive to changes innutrient availability.Last, to determine whether intra- or inter-
compartmental heterogeneity may play a rolein the transcriptional changes that we observed,we performed single-cell RNA-seq on sorted IELand LP gd T cells (fig. S7). We identified fourtranscriptionally distinct clusters of small-intestine
Sullivan et al., Science 371, eaba8310 (2021) 19 March 2021 3 of 12
Fig. 1. Carbohydrate availability drives expression of carbohydrate tran-scriptional program. (A) Volcano plot showing differentially regulated genesin small-intestine epithelial cells in response to a high-carbohydrate or high-protein diet. A full list of genes can be found in table S1. Colored circlescorrespond to transcripts for brush border enzymes and transportersinvolved in digestion of carbohydrates, protein, or lipids. (B) Pancreaticenzymes, brush border enzymes, and monosaccharide transporters involvedin digestion and absorption of carbohydrates, encoded by carbohydratetranscriptional program. (C to E) Quantitative polymerase chain reaction(PCR) analysis of carbohydrate transcriptional program expression in small-
intestine epithelium and pancreas of mice fed (C) a high-carbohydrate orhigh-protein diet, (D) a high-carbohydrate or high-fat diet, or (E) a high-carbohydrate diet and treated with the a-glucosidase inhibitor acarbose.(F) Glucose uptake in mice fed a high-carbohydrate or high-protein diet.(G) Respiratory exchange ratio and (H) corresponding area under the curvein mice fed high-carbohydrate or high-protein diet. n = 3 or 4 mice pergroup. P values in (A) were calculated by using Sleuth. Data representmean ± SEM. P values in (B) to (H) were calculated by means of Student’st test. *P < 0.05, **P < 0.01, ***P < 0.001, ****P < 0.0001. Data arerepresentative of at least two independent experiments.
RESEARCH | RESEARCH ARTICLEon M
arch 29, 2021
http://science.sciencemag.org/
Dow
nloaded from

Sullivan et al., Science 371, eaba8310 (2021) 19 March 2021 4 of 12
A
C
D
E
high
car
bhi
gh p
rot
Overlay Sis Slc2a2 DAPI
Amy2
a1
Amy2
a2
Amy2
a3
Amy2
a4
Amy2
a5
Amy2
bPnli
pPrs
s10
2040
100000
300000
500000high carb 5d
low carb 1d
high carb 5d
low carb 5d**
****
**
****
Pancreas
Sis
Mga
m
Slc2a2
Slc2a5
Slc5a1
0
1000
2000
3000
4000
5000re
lativ
e ex
pres
sion
vs. R
pl13
* 1
03**
**
* *
**
Small intestine epithelium
Cyclin
g Gob
let
Cyclin
g TA
Fabp1
+ en
tero
cyte
Fabp6
+ en
tero
cyte
Enter
oend
ocrin
e
Goblet
Panet
hSte
m TA Tuft
0
10
20
30
40
% o
f SI e
pith
elia
l cel
ls
high carb
high prot
TSNE 1
Cycling_Goblet
Cycling_TA
Enterocyte_Fabp1
Enterocyte_Fabp6
Enteroendocrine
Goblet
Stem
TA
Tuft
NA
IdentityB
Tuft
TA
Stem
Goblet
Enteroendocrine
Enterocyte_Fabp6
Enterocyte_Fabp1
Cycling_TA
Cycling_Goblet
Mgam
SisAnpep
Slc1a1
Slc3a1
Slc6a18
Slc6a19
Slc7a1
Slc7a6
Slc7a7
Slc7a9
Slc7a11
Slc36a1
Slc38a3
Fabp1
Fabp6
1
Fraction ofexpressing cells
protein fatcarb
RESEARCH | RESEARCH ARTICLEon M
arch 29, 2021
http://science.sciencemag.org/
Dow
nloaded from

gd T cells, reflecting intraepithelial and LPcompartments (fig. S7A). Althoughwe did notsee differences in clustering in response todiet, we observed that one of the clusters weidentified was enriched for genes found to bedifferentially regulated by diet in our bulk-sequencing dataset. Thus, this cluster may bemore sensitive to nutrient availability thanother enteric gd T cells (fig. S7, B and C).We then asked what upstreammediators may
signal to gd T cells during a high-carbohydratediet. Our sequencing data did not reveal anysignificant changes in cytokine expression in gdT cells (fig. S8A). However, contact-dependentsignals, including components of Notch signal-ing, were up-regulated in LP gd T cells duringa high-carbohydrate diet (fig. S8C). We foundthat Jag2 (jagged canonical notch ligand 2), aNotch ligand, was up-regulated in epithelialcells in response to a high-carbohydrate diet,suggesting that Notch signaling may mediatecommunication between gd T cells and epithe-lial cells in response to nutrient sensing (fig.S8D). This notionwas further supported by ourimaging studies, which demonstrated that gdT cells localize to the crypt base, where Notchligands are more highly expressed (22), duringhigh-carbohydrate feeding (fig. S6). To testwhether JAG2/Notch signaling is involved inthe induction of the carbohydrate transcriptionalprogram,mice were fed a high-carbohydrate dietand treatedwith a JAG2-blocking antibody orisotype control. Animals treated with antibodyto JAG2 showed diminished expression of thecarbohydrate transcriptional program as com-pared with that of isotype control–treated ani-mals. This suggested that the up-regulation of Jag2on epithelial cells during a high-carbohydratediet played a role in the downstream induc-tion of the carbohydrate transcriptional program(fig. S9A). However, treatment with antibody toJAG2 did not influence the frequency or numberof gd T cells in the IEL or LP compartments (fig.S9, B to D), suggesting that Notch signaling mayinfluence gd T cell function but not survival.Our sequencing data also revealed that LP
gd T cells up-regulated IL2Rb, the co-receptorfor interleukin-2 (IL-2) and IL-15, during high-carbohydrate feeding. This raised the possibilitythat IL-15 may regulate the gd T cell responseto nutrient sensing (fig. S10A). Animals treatedwith a blocking antibody to IL-15 showed di-minished expression of the carbohydrate tran-scriptional program as compared with that of
isotype control–treated animals, suggestingthat IL-15 signaling is an important medi-ator in this circuit (fig. S10B). Epithelial cellIL-15 expression was not induced by a high-carbohydrate diet, and animals treated withantibody to IL-15 showed no difference in thefrequency of IEL or LP gd T cells. Thus, IL-15appears to be a tonic signal that maintains gdT cell function, rather than a nutrient-sensitivesignal (fig. S10, C and D).
gd T cells regulate carbohydrate transcriptionalprogram through control of IL-22
Because we did not find any differentially ex-pressed cytokines in gd T cells in response todiet, we assessed whether cytokines might bedifferentially expressed in other cell types. Wefound that IL-22—a cytokine known to playimportant roles in regulating metabolismand small-intestine epithelial cell prolifera-tion (23–26)—was up-regulated in responseto a high-protein diet. IL-22 expression wasfurther increased in mice lacking gd T cells(Fig. 4A). IL-22 was also up-regulated at theprotein level. ILC3s, but not T helper 17 (TH17)cells, showed elevated IL-22 production in re-sponse to a high-protein diet and in mice lack-ing gd T cells (Fig. 4, B to C, and fig. S11). Theincreased expression of IL-22 under conditionsin which we observed diminished expressionof carbohydrate-handling machinery suggestedthat IL-22 may be a negative regulator of thisprogram. This was confirmed in experimentsin which small-intestine organoids were cul-tured in different concentrations of IL-22.Although small-intestine organoids do notentirely recapitulate the full complement ofenterocyte subsets that we observed in vivo,organoids treated with IL-22 showed alterationsin the frequency of enterocytes and stem cellssimilar to the changes we observed in epi-thelial cells isolated from mice fed differentdiets (Figs. 2C and 4, D and E). Organoids treatedwith IL-22 also showed dose-dependent down-regulation of the carbohydrate transcriptionalprogram, confirming that this program is neg-atively regulated by IL-22 (Fig. 4F). Mice feda high-protein diet and treated with antibodyto IL22 showed expression of the carbohydratetranscriptional program at levels similar tothose of mice fed a high-carbohydrate diet(Fig. 4G). Furthermore, treatment with an anti-body to TCRgd was unable to suppress thecarbohydrate transcriptional program in Il22-
deficient animals (Fig. 4H). Thus, gd T cellsregulate the diet-dependent expression ofcarbohydrate-handling machinery by suppress-ing expression of IL-22.Because tuft cells have recently been de-
scribed to play a critical role in regulating theintestinal response to pathogens, we inves-tigated their role in regulating the intestinalresponse to nutrient sensing (14, 16, 17). Wefound that Pou2f3−/− animals, which lack tuftcells, had decreased expression of the carbo-hydrate transcriptional program, which sug-gested that tuft cells may be an upstreamregulator in this circuit (fig. S12, A andB). IL-25,produced by tuft cells, is known to be a negativeregulator of IL-22 expression (27). However, wedid not see a significant increase in Il25 ex-pression in intestinal epithelial cells during ahigh-carbohydrate diet (fig. S12C). We thereforeinvestigated the role of other soluble mediatorsknown to be produced by tuft cells in regulatingthis circuit. Tuft cells express cyclooxygenase1 (COX1) and COX2 and are thought to produceprostaglandins (28). Because we observed thatLP gd T cells up-regulate prostaglandin receptorduring high-carbohydrate feeding (fig. S12D),we treated high-carbohydrate–fed animals witha COX inhibitor, indomethacin. These animalsshowed marked down-regulation of the carbo-hydrate transcriptional program (fig. S12E) aswell as a trend toward reduced IL-22 (fig. S12F).Thus, tuft cellsmaybe involved in the regulationof the carbohydrate transcriptional program andmay control its expression through the produc-tion of prostaglandins.
Discussion
Our studies have defined a role for gd T cellsin the regulation of epithelial transcriptionalresponse to diet and showed that diet can alterthe frequency of epithelial cell subsets. We foundthat machinery required for carbohydrate diges-tion, in both the small intestine and pancreas,can be regulated on demand in response tonutrient availability. IL-22, produced by ILC3s,plays a critical role in the regulation of spe-cialized epithelial cell differentiation and ex-pression of digestive machinery, and gd T cellscan regulate its production. How gd T cellsregulate the production of IL-22 by ILC3s is animportant area for future study. A recent studyreported that gd T cell–deficient animals havean increased number of another innate-like lymphocyte, mucosal-associated invariant
Sullivan et al., Science 371, eaba8310 (2021) 19 March 2021 5 of 12
Fig. 2. Diet alters composition of epithelial compartment. (A) Expressionof carbohydrate transcriptional program in small-intestine epithelium andpancreas in mice fed a high-carbohydrate diet for 5 days and subsequentlyswitched to a high-protein diet for 1 or 5 days. (B) t-Distributed stochasticneighbor embedding (t-SNE) plots of major epithelial cell subsets with10,000 cells displayed. (C) Frequency of epithelial cell subsets in (B) duringhigh-carbohydrate or high-protein diets. (D) Differential expression ofnutrient-handling machinery for carbohydrates, protein, and fat. A full list of
genes can be found in table S2. (E) Single-molecule FISH imaging ofindicated carbohydrate program transcripts in jejunum isolated from micefed high-carbohydrate or high-protein diet for 5 days. Scale bar, 100 mm.P values in (A) were calculated by using Student’s t test. Data representmean ± SEM. *P < 0.05, **P < 0.01. Data in (A) are representative of atleast two independent experiments with n = 3 or 4 mice per group. Data in(B) to (D) are from a single experiment, with four mice per group pooledinto two samples.
RESEARCH | RESEARCH ARTICLEon M
arch 29, 2021
http://science.sciencemag.org/
Dow
nloaded from
Sullivan et al., Science 371, eaba8310 (2021) 19 March 2021 6 of 12
A
BC
DE
F
H Ihigh carb high protein
G
high
carb
high
prot
0.0
0.2
0.4
0.6
0.8
1.0
frac
tion
of
T ce
lls
LP T-cells
IEL T-cells
γδ, IEL γδ, LP αβ, IEL αβ, LP
Log2
fold
cha
nges
(Hig
h ca
rb /
high
pro
t)
−3
−2
−1
0
1
2
3
4
Sis
Mga
m
Slc2a2
Slc2a5
Slc5a1
0
50
100
150
rela
tive
expr
essi
on
vs. R
pl13
* 1
03
5mM Glu
10mM Glu
25mM Glu
Sis
Mga
m
Slc2a2
Slc2a5
Slc5a1
0
1000
2000
3000
4000
5000
rela
tive
expr
essi
on
vs. R
pl13
* 1
03
**
**
*
*
high carbB6/J
high carbRag2–
Sis
Mga
m
Slc2a2
Slc2a5
Slc5a1
0
2000
4000
6000
8000
rela
tive
expr
essi
on
vs. R
pl13
* 1
03
high carbB6/J
high carbTcrb–
Sis
Mga
m
Slc2a2
Slc2a5
Slc5a1
0
5000
10000
15000
rela
tive
expr
essi
on
vs. R
pl13
* 1
03
high carbB6/J
high carbTcrd–
**
**
*** **
Sis
Mga
m
Slc2a2
Slc2a5
Slc5a1
0
500
1000
1500
rela
tive
expr
essi
on
vs. R
pl13
* 1
03
high carbiso
high carbanti-TCRgd
**
**
*****
Representative GO terms
1
2
3
4
5
IEL LP IEL LP
-3 -2 -1 0 1 2 3
Log2 fold changes(High carb / high prot)
Zinc-finger
Secreted
Ribonucleoprotein
MitochondrionOxidative phosphorylation
Transcription regulationDNA bindingZinc-finger
Pleckstrin homology-like domainGlycoprotein
50 10 15
-Log(P-value)
20
F
RESEARCH | RESEARCH ARTICLEon M
arch 29, 2021
http://science.sciencemag.org/
Dow
nloaded from

T (MAIT) cells, in the small intestine (29). Thisstudy, aswell as our finding that gd T cells limitintestinal ILC3s, suggest that gd T cells mayrestrict other resident innate-like lymphocytesin the intestine. The precise molecular mech-anisms that dictate the interrelationshipsbetween intestinal innate-like lymphocytes—including MAIT cells, invariant natural killerT cells (iNKT cells), ILCs, and gd T cells—represent a broad and substantial area forfuture investigation in mucosal immunity.This work demonstrates a major role for
intestinal gd T cells outside of antimicrobialdefense and adds to emerging evidence of thetissue homeostatic role of gd T cells (30–33).Previous studies have pointed to a role for gdT cells in the pathogenesis of metabolic dis-eases, indicating that they influence the regula-tion of blood glucose (34–36). Our findingprovides additional context to these reports,suggesting that gd T cells may contribute tothese pathologies through direct regulation ofglucose uptake in the intestine. The relativecontributions of antigen recognition by the gdTCR and recognition of other signals such asbutyrophilins to the tissue homeostatic func-tion of gd T cells is an important area forfuture study that could be aided by identifi-cation of gd TCR antigens, which have largelyremained elusive (37–39).Our finding that IL-22 can regulate carbohydrate-
handling machinery accords with recent re-ports of its role in the regulation of lipid uptakemachinery in the small intestine (40–42). To-gether, these findings may help to link thedemonstrated role of IL-22 in organismalmetabolism to its function in intestinal epi-thelial homeostasis and raise the possibilitythat IL-22 may mediate its effects on metab-olism in part through its action on intestinalepithelial cells (23–26, 40, 41). This has largeimplications for understanding the link betweenintestinal function andmetabolic homeostasis, aswell as for current efforts to apply IL-22 as atherapeutic for intestinal injury and metabolicdisease. Additionally, IL-22 induction throughcontinuous exposure to enteropathogens maycontribute to diseases of nutrient malabsorption,as occurs in environmental enteropathy (43).Together with recent studies of intestinal re-
sponse to helminth, bacterial, and protozoan
infections (14–18, 20), our work suggests thatepithelial cell–lymphocyte circuits and epi-thelial remodeling may be general features ofadaptability to environmental change in thistissue. Our observation that nutrient uptakecan be regulated by lymphocyte control ofcytokine production links the regulation ofnutrient uptake to the regulation of barrierdefense. The finding that shared machinerycan regulate both of these crucial functions inthe small intestine may help explain how thistissue adjusts the balance between defense andnutrient uptake in the face of constant envi-ronmental change. Whether nutrient uptakecan be regulated by other intestinal lympho-cytes and cytokines in response to differentenvironmental signals is an intriguing ques-tion for further investigation.
Materials and methodsAnimals
All animal experiments were performed in ac-cordance with institutional regulations afterprotocol review and approval by YaleUniversity’sInstitutional Animal Care and Use Committee.The following strainswere obtained from JacksonLaboratories: C57BL/6J (stock no. 000664),Tcrd−/− (stock no. 002120), Tcrb−/− (stock no.002118), Il22−/− (stock no. 027524).Rag2−/−micewere provided by D. Schatz (Yale University),Tcrd-GFP mice were provided by D. Mucida(Rockefeller University), Trpm5−/− mice wereprovided by W. Garrett (Harvard University),and Pou2f3−/−mice were provided by C.Wilen(Yale University). Germ-free C57BL/6mice werebred andmaintained in Class Biologically Cleanisolators. Dietary interventions and other exper-imental procedures were performed in micro-isolator cages (Isocage P; Techniplast). Femalesaged 7 to 12weekswere used for all experimentsand were euthanized by cervical dislocationat ZT8.For antibody treatment experiments, animals
were injected intravenously with 500 mg of anti-Thy1 (clone 30H12; BioXCell #BP0066) or anti-keyhole lymphocyanin isotype control (cloneLTF-2; BioXCell #BP0090); or 200 mg anti-TCRb(clone H57-597; BioXCell #BE0102), anti-TCRgd(cloneUC7-1365: BioXCell #BE0070), or Armenianhamster isotype control (BioXCell #BE0091)on days −1, 0, 2, and 4 of each experiment.
One hundredmicrograms of anti-IL-22 (cloneIL22JOP; ThermoFisher #16-7222-82) or RatIgG2a isotype control (clone eBR2a; Thermo-Fisher #16-4321-82)was injected intraperitoneallyon days 0, 2, and 4 of each experiment.SGLT1 inhibitor phloridzin (SigmaAldrich)
was administered subcutaneously every 12 hoursfor the duration of each experiment. Animalsreceived 5 mg of phloridzin or vehicle (10%EtOH, 15% DMSO, 75% PBS) per injection.Acarbose (Cayman Chemical Co) was admin-istered by daily gavage for the duration of theexperiment. Animals received 25 mg acarboseor PBS per treatment. To quantify glucoseuptake, animals were fasted for 4 hours andthen administered 30 mg of D-glucose bygavage. Blood glucose was measured every5 min following injection using a OneTouchhandheld glucometer. For metabolic cage ex-periments, animals were individually housedin Promethion High-Definition MultiplexedRespirometry Cages (Sable Systems Interna-tional). After 3 days of acclimatization, spe-cial diets were introduced, and animals weremonitored for VO2 and VCO2 for 5 days. Pu-rified, specialized animal dietswere purchasedfrom Envigo. Diet ingredients and nutritionalinformation are summarized in table S5. Dietswere sterilized by irradiation.
Epithelial cell and lamina propria isolation(for qPCR and flow cytometry)
Single-cell suspensions of small intestine epi-thelium and lamina propria were prepared asdescribed (44). Briefly, the small intestine wasisolated and opened longitudinally. Its contentswere then rinsed in PBS following removal ofPeyer’s patches. The tissue was then cut into2-3-mm segments and incubated in RPMImedia (ThermoFisher) containing 5mMEDTA,145 mg/ml DTT, and 3% FBS at 37°C with 5%CO2 for 20 min with agitation. Pieces of intes-tine were then washed in RPMI containing2 mMEDTA to separate the epithelial fraction.Epithelial cell RNA was isolated from thisfraction. In cases where IELs were stained,the epithelial fraction was subjected to 30%Percoll density gradient by centrifugation (SigmaAldrich). Lamina propria digestion was per-formed using 100 mg/ml Liberase (Roche) and500 mg/ml DNAse (Sigma Aldrich) in RPMI
Sullivan et al., Science 371, eaba8310 (2021) 19 March 2021 7 of 12
Fig. 3. gd T cells are required for induction of carbohydrate transcrip-tional program. (A) Expression of the carbohydrate transcriptional programin small-intestine organoids cultured with indicated varying concentrations ofglucose. (B to E) Expression of the carbohydrate transcriptional program insmall-intestine epithelial cells from mice fed high-carbohydrate diet underindicated genotypes and treatment conditions. (F) Heatmap showing foldchanges in transcript levels in LP or IEL gd or ab T cells isolated from thesmall intestine of mice fed a high-carbohydrate or high-protein diet. Geneswere grouped by means of K-means clustering and functionally analyzed withDAVID (54). Full gene lists are available in table S3 (n = 3 or 4 mice pergroup). (G) Transcriptomic reprogramming of gd T cells in LP. Violin plots
show the changes in RNA expression between high-carbohydrate and high-protein diets. The plots were scaled with the same area. The white dotindicates the median. (H) Representative images of cleared ileal tissue fromTcrgd-GFP mice fed a high-carbohydrate or high-protein diet. Dotted linesindicate the border used to delineate the IEL from LP regions. gd T cellsare pseudocolored red. Scale bar, 100 mm. (I) Quantification of LP andIEL gd T cells from cleared tissue images. n = 3 or 4 mice per group. Datarepresent mean ± SEM. P values in (A) to (E) were calculated by means ofStudent’s t test. *P < 0.05, **P < 0.01. Data are representative of at least twoindependent experiments, except in (F) and (G), which represent a singlesequencing experiment.
RESEARCH | RESEARCH ARTICLEon M
arch 29, 2021
http://science.sciencemag.org/
Dow
nloaded from

Sullivan et al., Science 371, eaba8310 (2021) 19 March 2021 8 of 12
2.7
IL-2
2
RORgt
Gated on Live, CD45+90.2+Lineage-RORgt+
high carb
7.2
high prot
F
ED
1.6
IL-2
2
RORgtGated on Live, CD45+CD90.2+Lin-RORgt+
high carb diet
isotype
3.6
anti-gdTCR
A B
C
−25
0
25
50
−25 0 25 50
TSNE 1
TS
NE
2
Control
−25
0
25
50
−25 0 25 50
TSNE 1
TS
NE
2
IL−22
IdentityStemTAEnterocyteGobletTuftEndocrine
G
H
high carbB6/
high protB6/J
high carbTcrd–
high protTcrd–
0
2
4
6
8
10
rela
tive
expr
essi
on
vs. R
pl13
* 1
03Il22
*
**
****
Stem TA
Enter
ocyte
Goblet Tu
ft
Enter
oend
ocrin
e0.0
0.2
0.4
0.6
0.8
Small intestine organoid
Fre
quen
cy Control
IL-22** **
Sis
Mga
m
Slc2a2
Slc2a5
Slc5a1
0
20
40
60
80
rela
tive
expr
essi
on
vs. R
pl13
* 1
03
Small intestine organoid
untx
0.1ng/mLIL-22
1ng/mLIL-22
5ng/mLIL-22
Mga
m Sis
Slc2a2
Slc2a5
Slc5a1
0
2000
4000
6000
rela
tive
expr
essi
on
vs. R
pl13
* 1
03
Small intestine epithelium
high carbisoIl22–high carbanti-TCRIl22–
Sis
Mga
m
Slc2a2
Slc2a5
Slca5a
10
1000
2000
3000
4000
5000
rela
tive
expr
essi
on
vs. R
pl13
* 1
03
Small intestine epithelium
high carbiso
high protiso
high protanti-IL22
*
*
isotyp
e
anti-
TCR0
20000
40000
60000
80000
100000
RORgt+ ILC3s
# of
cel
ls
*
isotyp
e
anti-
TCR0
1000
2000
3000
4000
# of
cel
ls
IL-22+
**
high
carb
high
prot
ein0
2
4
6
8
10
IL-22+ ILC3s
% o
f Par
ent G
ate
**
Fig. 4. gd Tcells regulate carbohydrate transcriptional program through the suppression of IL-22. (A) Il22transcript expression in whole small intestine from wild-type or Tcrgd−/− mice fed a high-carbohydrate or high-proteindiet. (B) Representative intracellular cytokine staining and (right) quantification of IL-22 production in small-intestineILC3s from mice fed high-carbohydrate or high-protein diets. (C) (Left) Representative intracellular cytokine stainingand (right) quantification of retinoid-related orphan receptor–gT (RORgT) expression and IL-22 production in small-intestine ILC3s from mice fed a high-carbohydrate diet and treated with antibody to TCRgd or isotype control.(D) Frequency and (E) t-SNE plots showing epithelial subtypes in small-intestine organoids treated with IL-22 or controlmedia. (F) Expression of the carbohydrate transcriptional program in small-intestine organoids treated with indicatedconcentration of IL-22. (G) Expression of the carbohydrate transcriptional program in small-intestine epithelium ofmice fed a high-carbohydrate or high-protein diet and treated with antibody to IL22 or isotype control. (H) Expressionof carbohydrate transcriptional program small-intestine epithelial cells isolated from IL-22–deficient mice fed a high-carbohydrate diet and treated with antibody to TCRgd or isotype control. n = 3 or 4 mice per group. Data representmean ± SEM. P values [except in (E)] were calculated by means of Student’s t test. P values in (E) were calculated bymeans of Dirichlet-multinomial regression. *P < 0.05, **P < 0.01, ****P < 0.0001. All data are representative of at leasttwo independent experiments, except (D) and (E), which represent a single sequencing experiment.
RESEARCH | RESEARCH ARTICLEon M
arch 29, 2021
http://science.sciencemag.org/
Dow
nloaded from

for 30 min at 37°C with 5% CO2. Digested tis-sue was sequentially strained through 70 mMand 40 mM strainers, washed in RPMI contain-ing 3% FBS, and cells stained for further anal-ysis. Epithelial cells used for scRNAseq wereisolated as described (18). Small intestines wereisolated, opened longitudinally, and rinsed incold PBS. Two-millimeter tissue fragmentswere incubated in 20 mM EDTA in PBS for2-3 hours. The single-cell suspension was thenpassed through a 40-mm filter and stained forisolation by fluorescence-activated cell sorting(FACS) (Astrios) for droplet-based scRNA-seq(described below).
Flow cytometry
Single-cell suspensions were treated with anti-CD16/32 (Fcblock) (ThermoFisher #14-9161-73)and stained with ZombieYellow Fixable Live/Deaddye (Biolegend #423104) and the followingantibodies at a concentration of 1 mg/ml exceptwhere otherwise indicated: PE-Cy7-anti-CD326/EpCAM(clone 9C4; Biolegend #118216), BUV395-anti-CD45 (clone 30-F11; BDBiosciences #564279),PE-anti-TCRgd (clone GL3; ThermoFisher #12-5711-82), APC-anti-TCRb (clone H57-597; Bio-legend #109212), PE-Cy7-anti-TCRb (clone H57-597;Biolegend #109221), FITC-anti-CD90.2 (clone30-H12; BD Biosciences 553012) at 2.5 mg/ml,APC-anti-CD90.2 (clone 5302.1; ThermoFisher17-0902-81), BV605-anti-CD4 (clone RM4-5;Biolegend #100547), 7AAD (ThermoFisher#V35123), anti-PE-anti-CD31 (clone 390; Thermo-Fisher #12-0311-82), AlexaFluor 647-anti-IL-22 at2 mg/ml (clone IL22JOP; ThermoFisher #17-7222-80), PE-anti-RORgt at 2 mg/ml (clone B2D;ThermoFisher #E14326-107). “Lineage” stain-ing was performed using PE-Cy7-Streptavidinat 0.5 mg/ml (ThermoFisher #25-4317-82) orBV421-Streptavidin at 0.33 mg/ml (BD Biosciences#563259)andthe followingbiotinylatedantibodiesat 1.67 mg/ml: anti-CD3 (clone 145-2C11; Thermo-Fisher #13-0031-85), anti-CD5 (clone 53-7.3; BDBiosciences #553018), anti-CD8a (clone 53-6.7;ThermoFisher #13-0081-82), anti-CD19 (clone1D3; BDBiosciences #553784), anti-CD11b (cloneM1/70; ThermoFisher #13-0112-85), anti-CD11c(clone N418; ThermoFisher #13-0114-82), anti-CD45R (clone RA3-6B; Biolegend #103204),anti-CD49b (clone DX5; BD Biosciences #553856),anti-F4/80 (clone BM8; ThermoFisher #13-4801-85), anti-FcER1 (clone MAR-1; ThermoFisher 13-5898-85), anti-Gr1 (clone RB6-8C5; ThermoFisher#13-5931-85), anti-Nk1.1 (clone PK136; Thermo-Fisher #13-5941-82), anti-Ter119 (clone TER-119;ThermoFisher #13-5921-81). Stimulation andintracellular cytokine staining were performedas previously described (44). Cells were stimu-lated for 2 hours at 37°Cwith 50 ng/ml phorbol12-myristate 13-acetate (Sigma Aldrich) and3.35 mM ionomycin (Cell Signaling Technologies)in the presence of GolgiPlug (BD Biosciences).Staining for intracellular cytokines and tran-scription factors was performed using FoxP3/
Transcription Factor Staining Buffer Set (Thermo-Fisher). Flow cytometry was performed using aBD LSRII analyzer equipped with the followinglasers: 355 nm (UV), 405 nm (violet), 488 nm(blue), and 633 nm (red). Data were analyzedusing FlowJoX (BD Biosciences). Gates weredrawn according to fluorescence minus one(FMO) controls.
Cell sortingFor bulk T cell RNA-seq
Stained cells were sorted using a BD FACSAriaII.Cells were gated on live, CD45+, EpCAM−, single-cells, and sorted into TCRb+TCRgd− and TCRb−
TCRgd+ populations. Cells were collected inRLT lysis buffer (Qiagen) containing 1% beta-mercaptoethanol.
For plate-based scRNA-seq
Cells were sorted using parameters describedabove. Single gd T cells were sorted into indi-vidual wells of a 96-well plate containing TCLlysis buffer (Qiagen) with 1% b-mercaptoethanol.Immediately after sorting, plates were spundown and frozen at−80°C until library preparation.
For droplet based scRNAseq
FACS (Astrios) was used to sort cells intoEppendorf tubes containing PBS with 0.1%BSA and stored on ice until library prepara-tion. Cells were gated on live, single CD31−
Ter119− CD45−EpCAM+ cells.
qPCR analysis
Total RNA was purified from epithelial cellsusingDiretZol RNAMiniprep Plus Kit (Zymo).Total RNA was purified from organoids usingRNEasy Plus Micro Kit (Qiagen). Total RNAwas quantified by NanoDrop (ThermoFisher)and added to reverse transcriptase reactionusing SMART MMLV Reverse Transcriptase(Takara Bio) according to the manufacturer’sinstructions. qPCRwas performedwith PerfeCTaSYBR Green (Quanta Bio) using BioRad CFX96platform. Expression was calculated relative toRpl13a. A list of primers is provided in table S6.
Intestinal organoid cultures
Crypts were isolated fromwhole small intestineas follows. The small intestinewas extracted andrinsed in cold PBS. The tissue was openedlongitudinally and sliced into small fragmentsroughly 0.2 cm long. The tissue was incubatedin 20 mM EDTA-PBS on ice for 90 min, whileshaking every 30 min. The tissue was thenshaken vigorously and the supernatant wascollected as a fraction in a new conical tube.Next, the tissue was incubated in fresh EDTA-PBS and a new fraction was collected every30 min. Fractions were collected until thesupernatant consisted almost entirely of crypts.The final fraction (enriched for crypts) wasfiltered through a 70-mm filter, washed twicein PBS, centrifuged at 300g for 3 min, and
dissociated with TrypLE Express (Invitrogen)for 1 min at 37°C. Following crypt isolationfrom the whole small intestine of both maleand female mice, the single-cell suspensionwas resuspended in Matrigel (BD Bioscience)with 1 mMJagged-1 peptide (Ana-Spec). Roughly300 crypts embedded in 25 ml of Matrigel wereseeded onto each well of a 24-well plate. Oncesolidified, the Matrigel was incubated in 600 mlculture medium (Advanced DMEM/F12, Invi-trogen) with streptomycin–penicillin and gluta-matax and supplemented with EGF (100 ng/ml,Peprotech), R-Spondin-1 (600 ng/ml, R&D),Noggin (100 ng/ml, Prepotech), Y-276432 di-hydrochloridemonohydrate (10 mM, Tochris),N-acetyl-1-cysteine (1 mM, Sigma-Aldrich), N2(1X, Life Technologies), B27 (1X, Life Technol-ogies), and Wnt3A (25 ng/ml, R&D Systems).Fresh media was replaced on day 3 and or-ganoids were passaged by dissociation withTrypLE and resuspended in new Matrigel onday 6 with a 1:3 split ratio.
Intravital imaging
The terminal ilea of live Tcrgd-GFP mice wereimaged as described previously (20). Animalswere anesthetized using isoflurane before sur-gery and injected intravenously with Hoechstdye. Ten minutes after induction of anesthesia,animals were placed on a platform heated to37°C. A small incision was made in the ab-domen and a loop of terminal ileum was ex-posed and opened longitudinally. The contentswere then removed. The platform was thentransferred to a FV1000MPETwinuprightmulti-photon (Olympus) heated stage, and imagescollected with time lapse of ±30 s with a totalacquisition time of 20 min.
Whole-mount tissue imaging
Imaging of terminal ileum and duodenumwas performed as previously described (20).Tissues were isolated from TCRgd-GFP afterintravenous injection of Hoechst dye. Con-tents were removed, and tissue was fixed in4% PFA overnight at 4°C. Tissues were washedin PBS and placed in FocusClear (CeleplorerLabs Co) solution for 30 min at room temper-ature. Samples were then mounted on 3Dprinted slides, and imaging was performedon an Olympus FV1000 upright microscopewith a 25X 1.05 NA Plan water-immersionobjective and a Mai-Tai DeepSee Ti-Sapphirelaser (Spectraphysics).
T cell imaging analysis
T cells located in the lamina propria (densenucleated area below epithelial basementmem-brane) where manually counted with Fiji CellCounter, area scanned from each tissue was509×509 mm over 41 z-stacks of 5-mm step size,starting in the tip of the villus down to thecrypts. The total T cell count was performedwith Fiji TrackMate v5.1 (45) based on a cell
Sullivan et al., Science 371, eaba8310 (2021) 19 March 2021 9 of 12
RESEARCH | RESEARCH ARTICLEon M
arch 29, 2021
http://science.sciencemag.org/
Dow
nloaded from

size of 10 mm and GFP signal threshold of 1500units over all z-planes. Total nucleated cellswere countedwith Fiji TrackMate v5.1 with cellsize of 10 mmand DAPI signal threshold of 500units over all z-planes.
RNA FISH
An RNAscope Multiplex Fluorescent V2 (ACD,323100) detection kit was used according to themanufacturer’s instructions. Paraffin-embeddedsections were boiled in the target retrievalsolution at approximately 100°C for 15minand incubated in Protease Plus solution at 40°Cfor 15min. Probes for the following genes inMus musculus were used: Mm-Sis (573021),Mm-Slc2a2-E11-C2 (439891-C2), andMm-Slc5a1-C3 (468881-C3), and slides were stained withDAPI. Images and z-stacks were acquired witha 40X 1.3 NA oil immersion objective (Zeiss)using a Zeiss LSM900 confocal microscopewithAiryscan 2 andZen software (Zeiss).Whenindicated,maximum intensity projectionsweregenerated using Zen.
Statistics
With the exception of sequencing analysis, allstatistical analyses were performed in GraphPadPrism7. Statistical information is included infigure legends.
Plate-based single-cell RNA-seq and analysis
Plate-based single cell RNA-seq was performedas previously described (15). RNA-seq librarieswere constructed following SMART-seq2 pro-tocol (46). RNA clean-up was performed usingRNACleanXP beads (Agencourt). Reverse tran-scription was performed using Maxima H-Reverse Transcriptase (ThermoFisher) followedby whole transcription amplification (WTA)using KAPA HiFi HotStart PCR ReadyMix(KAPA Biosystems). Cleanup of WTA productswas performed using AMPure XP beads(Agencourt). DNAquantificationwas performedusing a High Sensitivity DNA Qubit kit andQubit analyzer (Life Technologies). Fragmentsizes were assessedwith a high-sensitivity DNAchip (Agilent). Indexing and library prepara-tion was performed using the Nextera XTDNALibrary Prep Kit (Illumina). The libraries weresequenced on Illumina NextSeq 500 (38×38 bppaired-end run). A total of 1536 cells weresequenced.Nextseq 500 base call files were demultiplexed
into FASTQ files using bcl2fast2 (Illumina).FASTQ files were used to quantify transcriptsfor each single cell using kallisto (47) TranscriptTPMs for each gene were summed to obtaingene level TPMs. Amatrix containing the TPMsfor each gene for each cell was used as input forthe single-cell RNA-seq analysis software pack-age Seurat (48). Genes were excluded from theanalysis if they had the prefix “GM” or wereexpressed in fewer than 10 cells. Cells wereincluded in the analysis if they had nonzero
TPMs for the Tcell associated genes Ptprc,Cd3d, and Cd3e and expressed at least 1000genes. After quality control, a total of 361 cellswere included in the analysis. Seurat was usedto classify cells into clusters and to determinewhat marker genes defined the clusters. TheSeurat FindClusters function was run using aresolution parameter of 0.6. t-SNE and ViolinPlots were created using Seurat.
Bulk RNA-seq and analysis
RNA was isolated from sorted T cells usingRNEasy Plus Micro Kit (Qiagen), and librarypreparation performed using SMART-seq2 pro-tocol as described above. RNAwas isolated fromepithelial cells usingDirectZol RNAMiniprepPlus Kit with on-column DNAse digestion ac-cording to the manufacturer’s instructions(Zymo). Sequencing libraries were constructedusing Illumina TruSeq Library Prep Kit andsequenced on Illumina NextSeq 500 (38×38 bppaired-end run).Sequencing reads were aligned to themm10
mouse transcriptome (GRCm38 ensembl; cDNAand ncRNA) and quantified by Kallisto (v0.45.0)with ak-mer index 25 and60bootstrapping (47).The expression of transcript was calculated inTPM (transcripts per million). When multipletranscripts match to the same gene, the expres-sion of the gene is calculated by summing theTPM of all matched transcripts. TPMs of 3 to4 biological replicates were averaged for eachsample. Statistical analyses for differentiallyexpressed genes were performed by Sleuth (49).
Droplet-based scRNA-seq and analysis
Single-cell suspensions were loaded onto3′ library chips as per the manufacturer'sprotocol for the Chromium Single Cell 3′ Li-brary (V3) (10X Genomics; PN-120233). Briefly,single cells were partitioned into Gel Beads inEmulsion (GEMs) in the Chromium instrumentwith cell lysis and barcoded reverse transcrip-tion of RNA, followed by amplification, enzy-matic fragmentation and 5′ adaptor and sampleindex attachment. Each 10X channel containedeither one mouse or a pool of three mice foreach condition to account for variations be-tween samples and were loaded on ChromiumSingle Cell Platform. In addition, both the epi-thelial fraction and the lamina propria fractionwere loaded to the same 10X channel with 7:1ratio, receptively. An input of 10,000 single cellsper sample was added to each channel with arecovery rate of approximately 5000 cells persample. Librarieswere sequenced on an IlluminaNextseq.
Processing FASTQ reads into geneexpression matrices
Cell Ranger v2.0 and Cumulus v0.7.0 (50) wereused to demultiplex the FASTQ reads, alignthem to the mm10 mouse transcriptome, andto generate the feature-countmatrix for the cell-
hashing data, using the “cumulus_hashing_cite_seq” workflow described in the Cumulusdocumentation.The output of this pipeline is a digital gene
expression (DGE)matrix for each sample, whichrecords the number of UMIs for each gene thatare associated with each cell barcode. As de-scribed previously (51), DGE matrices werefiltered to remove low quality cells, defined ascells in which fewer than 500 different geneswere detected. A total of 122,492 cells wereused for downstream analysis. To account fordifferences in sequencing depth across cells,UMI counts were normalized by the total numberof UMIs per cell and converted to transcripts-per-10,000 (henceforth “TP10K”).
Cell clustering overview
To cluster single cells into distinct cell subsets,we followed a previously outlined general pro-cedure (15) with additionalmodifications. Thisworkflow includes the following steps: par-titioning cells into epithelial, stromal, and im-mune compartments, followed by clusteringthe cells within each compartment, which en-tails the selection of “variable” genes, batchcorrection, dimensionality reduction (PCA),and graph clustering. Each step of this work-flow is detailed below.
Partitioning cells into epithelial, stromal,and immune compartments
Cells were partitioned into epithelial, stromal,and immune compartments based on the ex-pression of known marker genes. First, weclustered the cells by their gene expressionprofiles (with the clustering procedure below).The clusters were scored for the following genesignatures: epithelial cells (Epcam, Krt8, andKrt18), stromal cells (Col1Aa1, COl1a2, COl6a1,COl6a2, Vwf, Plvap, Cdh5, and S100b), andimmune cells (Cd52, Cd2, Cd3d, Cd3g, Cd3e,Cd79a, Cd79b, Cd14, Cd16, Cd68, Cd83, Csf1r,and Fcer1g). Signature scores were calculatedas the mean log2(TP10K+1) across all genes inthe signature. Each cluster was assigned tothe compartment of its maximal score and allcluster assignments were manually inspectedto ensure the accurate segregation of cells.Finally, the cells within each compartment wereassembled into three DGEmatrices, comprisingall epithelial cells, all stromal cells, and all im-mune cells. The epithelial cells were retained forfurther downstream analysis.
Variable gene selection
To identify variable genes within a sample, wefirst calculated the mean (m) and the coefficientof variation (CV) of expression of each gene.Genes were then grouped into 20 equal-frequency bins (ventiles) according to theirmeanexpression levels. LOESS regression was used tofit the relationship, log(CV) ~ log(m), and the 1500genes with the highest residuals were evenly
Sullivan et al., Science 371, eaba8310 (2021) 19 March 2021 10 of 12
RESEARCH | RESEARCH ARTICLEon M
arch 29, 2021
http://science.sciencemag.org/
Dow
nloaded from

sampled across these expression bins. To extendthis approach to multiple samples, we per-formed variable gene selection separately foreach sample to prevent “batch” differencesbetween samples from unduly impacting thevariable gene set. A consensus list of 1500variable genes was then formed by selectingthe genes with the greatest recovery ratesacross samples, with ties broken by randomsampling. This consensus gene set was thenpruned through the removal of all ribosomal,mitochondrial, immunoglobulin, and HLAgenes, which were found to induce unwantedbatch effects in some samples in downstreamclustering steps.
Batch correction
We observed substantial variability betweencells that had been obtained from differentmice, which likely reflects a combination oftechnical and biological differences. In somecases, these “batch effects” led to cells cluster-ing first by mouse, rather than by cell type orcell state.To eliminate these batch differences, we ran
ComBat (52) with default parameters on thelog2(TP10K+1) expression matrix, allowingcells to be clustered by cell type or cell state.Importantly, these batch-corrected data wereonly used for the PCA and all steps relying onPCA (e.g., clustering, diffusion map, t-SNEvisualization); all other analyses (e.g., differ-ential expression analysis) were based on theoriginal expression data.
Dimensionality reduction, graph clustering,and t-SNE visualization
We ran low-rank PCA on the variable genes ofthe batch-corrected expression matrix, chosenas described above. We then applied Pheno-graph (53) to the k-NN graph defined usingPCs 1 to 20 and k = 250, which was selectedthrough close inspection of the data. Finally,the Barnes–Hut t-distributed stochastic neigh-bor embedding (t-SNE) algorithm was run onthe PCs with perplexity = 20 and for 1000iterations to produce two-dimensional embed-dings of the data for visualization.
Identifying statistically significantdifferences in cell proportions
A major concern with the comparison of cellproportions in scRNA-Seq data are that theyare not independent of each other. Because allproportions sum to 1, an increase in the pro-portion of one cell subset will necessarily leadto a decrease in the proportions of other cellsubsets. To account for these dependencies, weused aDirichlet-multinomial regressionmodel,which tests for differences in cell compositionbetween conditions (e.g., high-carbohydratediet versus high-protein diet), while account-ing for the proportions of all of the other cellsubsets.
REFERENCES AND NOTES
1. W. H. Karasov, C. Martínez del Rio, E. Caviedes-Vidal,Ecological physiology of diet and digestive systems. Annu. Rev.Physiol. 73, 69–93 (2011). doi: 10.1146/annurev-physiol-012110-142152; pmid: 21314432
2. W. H. Karasov, A. E. Douglas, Comparative digestivephysiology. Compr. Physiol. 3, 741–783 (2013).pmid: 23720328
3. J. B. Furness, The enteric nervous system andneurogastroenterology. Nat. Rev. Gastroenterol. Hepatol. 9,286–294 (2012). doi: 10.1038/nrgastro.2012.32;pmid: 22392290
4. D. P. Hoytema van Konijnenburg, D. Mucida, Intraepitheliallymphocytes. Curr. Biol. 27, R737–R739 (2017). doi: 10.1016/j.cub.2017.05.073; pmid: 28787597
5. F. M. Gribble, F. Reimann, Function and mechanisms ofenteroendocrine cells and gut hormones in metabolism.Nat. Rev. Endocrinol. 15, 226–237 (2019). doi: 10.1038/s41574-019-0168-8; pmid: 30760847
6. L. G. van der Flier, H. Clevers, Stem cells, self-renewal, anddifferentiation in the intestinal epithelium. Annu. Rev. Physiol.71, 241–260 (2009). doi: 10.1146/annurev.physiol.010908.163145; pmid: 18808327
7. K. E. Barrett, Gastrointestinal Physiology (McGraw HillEducation/Medical, 2014).
8. W. F. Boron, E. L. Boulpaep, Eds., Medical Physiology(Saunders/Elsevier, 2012).
9. B. Misselwitz, M. Butter, K. Verbeke, M. R. Fox, Update onlactose malabsorption and intolerance: Pathogenesis,diagnosis and clinical management. Gut 68, 2080–2091(2019). doi: 10.1136/gutjnl-2019-318404; pmid: 31427404
10. K. Mochizuki, K. Honma, M. Shimada, T. Goda, The regulationof jejunal induction of the maltase-glucoamylase gene by ahigh-starch/low-fat diet in mice. Mol. Nutr. Food Res. 54,1445–1451 (2010). doi: 10.1002/mnfr.200900467;pmid: 20425755
11. T. Goda, F. Raul, F. Gossé, O. Koldovský, Effects of a high-protein, low-carbohydrate diet on degradation of sucrase-isomaltase in rat jejunoileum. Am. J. Physiol. 254, G907–G912(1988). pmid: 3287954
12. J. P. Cézard, J. P. Broyart, P. Cuisinier-Gleizes, H. Mathieu,Sucrase-isomaltase regulation by dietary sucrose in the rat.Gastroenterology 84, 18–25 (1983). doi: 10.1016/S0016-5085(83)80161-9; pmid: 6847846
13. T. Goda, Regulation of the expression of carbohydratedigestion/absorption-related genes. Br. J. Nutr. 84 (suppl. 2),S245–S248 (2000). doi: 10.1079/096582197388626;pmid: 11242478
14. M. R. Howitt et al., Tuft cells, taste-chemosensory cells,orchestrate parasite type 2 immunity in the gut. Science 351,1329–1333 (2016). doi: 10.1126/science.aaf1648; pmid: 26847546
15. A. L. Haber et al., A single-cell survey of the small intestinalepithelium. Nature 551, 333–339 (2017). doi: 10.1038/nature24489; pmid: 29144463
16. J. von Moltke, M. Ji, H. E. Liang, R. M. Locksley, Tuft-cell-derived IL-25 regulates an intestinal ILC2-epithelial responsecircuit. Nature 529, 221–225 (2016). doi: 10.1038/nature16161;pmid: 26675736
17. C. Schneider et al., A metabolite-triggered tuft cell-ILC2 circuitdrives small intestinal remodeling. Cell 174, 271–284.e14(2018). doi: 10.1016/j.cell.2018.05.014; pmid: 29887373
18. M. Biton et al., T helper cell cytokines modulate intestinal stemcell renewal and differentiation. Cell 175, 1307–1320.e22(2018). doi: 10.1016/j.cell.2018.10.008; pmid: 30392957
19. A. E. Moor et al., Spatial reconstruction of single enterocytesuncovers broad zonation along the intestinal villus axis. Cell175, 1156–1167.e15 (2018). doi: 10.1016/j.cell.2018.08.063;pmid: 30270040
20. D. P. Hoytema van Konijnenburg et al., Intestinal epithelial andintraepithelial T cell crosstalk mediates a dynamic response toinfection. Cell 171, 783–794.e13 (2017). doi: 10.1016/j.cell.2017.08.046; pmid: 28942917
21. P. Vantourout, A. Hayday, Six-of-the-best: Unique contributionsof gd T cells to immunology. Nat. Rev. Immunol. 13, 88–100(2013). doi: 10.1038/nri3384; pmid: 23348415
22. H. Gehart, H. Clevers, Tales from the crypt: New insights intointestinal stem cells. Nat. Rev. Gastroenterol. Hepatol. 16,19–34 (2019). doi: 10.1038/s41575-018-0081-y;pmid: 30429586
23. L. A. Zenewicz et al., Innate and adaptive interleukin-22protects mice from inflammatory bowel disease. Immunity 29,947–957 (2008). doi: 10.1016/j.immuni.2008.11.003;pmid: 19100701
24. X. Wang et al., Interleukin-22 alleviates metabolicdisorders and restores mucosal immunity in diabetes.Nature 514, 237–241 (2014). doi: 10.1038/nature13564;pmid: 25119041
25. C. A. Lindemans et al., Interleukin-22 promotes intestinal-stem-cell-mediated epithelial regeneration. Nature 528, 560–564(2015). doi: 10.1038/nature16460; pmid: 26649819
26. K. Gronke et al., Interleukin-22 protects intestinal stem cellsagainst genotoxic stress. Nature 566, 249–253 (2019).doi: 10.1038/s41586-019-0899-7; pmid: 30700914
27. S. Sawa et al., RORgt+ innate lymphoid cells regulate intestinalhomeostasis by integrating negative signals from the symbioticmicrobiota. Nat. Immunol. 12, 320–326 (2011). doi: 10.1038/ni.2002; pmid: 21336274
28. C. E. O’Leary, C. Schneider, R. M. Locksley, Tuft cells-systemically dispersed sensory epithelia integrating immuneand neural circuitry. Annu. Rev. Immunol. 37, 47–72 (2019).doi: 10.1146/annurev-immunol-042718-041505;pmid: 30379593
29. M. G. Constantinides et al., MAIT cells are imprinted by themicrobiota in early life and promote tissue repair. Science 366,eaax6624 (2019). doi: 10.1126/science.aax6624;pmid: 31649166
30. M. Ribeiro et al., Meningeal gd T cell-derived IL-17 controlssynaptic plasticity and short-term memory. Sci. Immunol. 4,eaay5199 (2019). doi: 10.1126/sciimmunol.aay5199;pmid: 31604844
31. M. J. Hong et al., Protective role of gd T cells in cigarettesmoke and influenza infection. Mucosal Immunol. 11, 894–908(2018). doi: 10.1038/mi.2017.93; pmid: 29091081
32. G. Crawford et al., Epithelial damage and tissue gd T cellspromote a unique tumor-protective IgE response. Nat.Immunol. 19, 859–870 (2018). doi: 10.1038/s41590-018-0161-8; pmid: 30013146
33. A. C. Kohlgruber et al., gd T cells producing interleukin-17Aregulate adipose regulatory T cell homeostasis andthermogenesis. Nat. Immunol. 19, 464–474 (2018).doi: 10.1038/s41590-018-0094-2; pmid: 29670241
34. S. He et al., Gut intraepithelial T cells calibrate metabolism andaccelerate cardiovascular disease. Nature 566, 115–119 (2019).doi: 10.1038/s41586-018-0849-9; pmid: 30700910
35. J. G. Markle et al., gd T cells are essential effectors of type1 diabetes in the nonobese diabetic mouse model. J. Immunol.190, 5392–5401 (2013). doi: 10.4049/jimmunol.1203502;pmid: 23626013
36. P. Mehta, A. M. Nuotio-Antar, C. W. Smith, gd T cells promoteinflammation and insulin resistance during high fat diet-induced obesity in mice. J. Leukoc. Biol. 97, 121–134 (2015).doi: 10.1189/jlb.3A0414-211RR; pmid: 25395302
37. B. E. Willcox, C. R. Willcox, gd TCR ligands: The quest to solve a500-million-year-old mystery. Nat. Immunol. 20, 121–128(2019). doi: 10.1038/s41590-018-0304-y; pmid: 30664765
38. A. Bas et al., Butyrophilin-like 1 encodes an enterocyte proteinthat selectively regulates functional interactions with Tlymphocytes. Proc. Natl. Acad. Sci. U.S.A. 108, 4376–4381(2011). doi: 10.1073/pnas.1010647108; pmid: 21368163
39. D. Melandri et al., The gdTCR combines innate immunity withadaptive immunity by utilizing spatially distinct regions foragonist selection and antigen responsiveness. Nat. Immunol.19, 1352–1365 (2018). doi: 10.1038/s41590-018-0253-5;pmid: 30420626
40. K. Mao et al., Innate and adaptive lymphocytes sequentiallyshape the gut microbiota and lipid metabolism. Nature 554,255–259 (2018). doi: 10.1038/nature25437; pmid: 29364878
41. J. Talbot et al., VIP-producing enteric neurons interact withinnate lymphoid cells to regulate feeding-dependent intestinalepithelial barrier functions. bioRxiv 721464 [Preprint]7 December 2019. .doi: 10.1101/721464
42. J. Talbot et al., Feeding-dependent VIP neuron-ILC3 circuitregulates the intestinal barrier. Nature 579, 575–580 (2020).doi: 10.1038/s41586-020-2039-9; pmid: 32050257
43. P. S. Korpe, W. A. Petri Jr., Environmental enteropathy: Criticalimplications of a poorly understood condition. Trends Mol.Med. 18, 328–336 (2012). doi: 10.1016/j.molmed.2012.04.007;pmid: 22633998
44. S. P. Spencer et al., Adaptation of innate lymphoid cells to amicronutrient deficiency promotes type 2 barrier immunity.Science 343, 432–437 (2014). doi: 10.1126/science.1247606;pmid: 24458645
45. J. Y. Tinevez et al., TrackMate: An open and extensibleplatform for single-particle tracking. Methods 115, 80–90(2017). doi: 10.1016/j.ymeth.2016.09.016; pmid: 27713081
Sullivan et al., Science 371, eaba8310 (2021) 19 March 2021 11 of 12
RESEARCH | RESEARCH ARTICLEon M
arch 29, 2021
http://science.sciencemag.org/
Dow
nloaded from

46. S. Picelli et al., Full-length RNA-seq from single cells usingSmart-seq2. Nat. Protoc. 9, 171–181 (2014). doi: 10.1038/nprot.2014.006; pmid: 24385147
47. N. L. Bray, H. Pimentel, P. Melsted, L. Pachter, Near-optimalprobabilistic RNA-seq quantification. Nat. Biotechnol. 34,525–527 (2016). doi: 10.1038/nbt.3519; pmid: 27043002
48. A. Butler, P. Hoffman, P. Smibert, E. Papalexi, R. Satija,Integrating single-cell transcriptomic data across differentconditions, technologies, and species. Nat. Biotechnol. 36,411–420 (2018). doi: 10.1038/nbt.4096; pmid: 29608179
49. H. Pimentel, N. L. Bray, S. Puente, P. Melsted, L. Pachter,Differential analysis of RNA-seq incorporating quantificationuncertainty. Nat. Methods 14, 687–690 (2017). doi: 10.1038/nmeth.4324; pmid: 28581496
50. J. T. Gaublomme et al., Nuclei multiplexing with barcodedantibodies for single-nucleus genomics. Nat. Commun. 10, 2907(2019). doi: 10.1038/s41467-019-10756-2; pmid: 31266958
51. C. S. Smillie et al., Intra- and inter-cellular rewiring of thehuman colon during ulcerative colitis. Cell 178, 714–730.e22(2019). doi: 10.1016/j.cell.2019.06.029; pmid: 31348891
52. W. E. Johnson, C. Li, A. Rabinovic, Adjusting batch effects inmicroarray expression data using empirical Bayes methods.Biostatistics 8, 118–127 (2007). doi: 10.1093/biostatistics/kxj037; pmid: 16632515
53. J. H. Levine et al., Data-driven phenotypic dissection of AMLreveals progenitor-like cells that correlate with prognosis.Cell 162, 184–197 (2015). doi: 10.1016/j.cell.2015.05.047;pmid: 26095251
54. W. Huang, B. T. Sherman, R. A. Lempicki, Systematic andintegrative analysis of large gene lists using DAVIDbioinformatics resources. Nat. Protoc. 4, 44–57 (2009).doi: 10.1038/nprot.2008.211; pmid: 19131956
ACKNOWLEDGMENTS
We thank all members of the Medzhitov laboratory for discussionsand C. Annicelli, S. Cronin, and C. Zhang for assistance with animalcare and husbandry. We thank F. Carvalho for assistance withimage analysis, W. Garrett (Harvard University) for Trpm5−/− mice,and C. Wilen (Yale University) for Pou2f3−/− mice. Funding: TheR.M. laboratory is supported by the Howard Hughes MedicalInstitute, Blavatnik Family Foundation, Food Allergy ScienceInitiative, and a grant form NIH (AI144152-01). Z.A.S. wassupported by the National Science Foundation Graduate ResearchFellowship Program under grant DGE1122492. Any opinions,findings, and conclusions or recommendations expressed in thismaterial are those of the author(s) and do not necessarily reflectthe views of the National Science Foundation. D.M. was supportedby the National Institute of Diabetes and Digestive and KidneyDiseases award R01DK113375. W.K-H. was supported by NIH underaward F32-AI143141. J.L. was supported by postdoctoralfellowships from the International Human Frontier ScienceProgram Organization (LT000037/2018-L) and Jane Coffin ChildsMemorial Fund. R.K.Z. was supported by NIH F32-DK125089.R.M. and A.R. are investigators of the Howard Hughes MedicalInstitute. Author contributions: Z.A.S. and R.M. conceived the
study. Z.A.S., W.K-H., M.B., B.S.R., and R.K.Z. performedexperiments with help from S.D.P., K.I-W., N.H.P., and S.R.; Z.A.S.,W.K-H., J.L., C.S., B.S.R., S.D.P., and R.P. analyzed data. Z.A.S.and R.M. wrote the manuscript, with input from N.P., A.W., D.M.,and A.R. Competing interests: A.R. is a cofounder and equityholder of Celsius Therapeutics, is an equity holder in Immunitas,and was an SAB member of ThermoFisher Scientific, SyrosPharmaceuticals, Neogene Therapeutics, and Asimov until31 July 2020. From 1 August 2020, A.R. is an employee ofGenentech. Authors declare no other competing interests. Dataand materials availability: Sequencing data are available from theNational Center for Biotechnology Information Gene ExpressionOmnibus (GSE145857). All data are available in the main text orthe supplementary materials.
SUPPLEMENTARY MATERIALS
science.sciencemag.org/content/371/6535/eaba8310/suppl/DC1Figs. S1 to S14Tables S1 to S6Movie S1MDAR Reproducibility Checklist
View/request a protocol for this paper from Bio-protocol.
8 January 2020; resubmitted 2 November 2020Accepted 19 January 202110.1126/science.aba8310
Sullivan et al., Science 371, eaba8310 (2021) 19 March 2021 12 of 12
RESEARCH | RESEARCH ARTICLEon M
arch 29, 2021
http://science.sciencemag.org/
Dow
nloaded from

T cells regulate the intestinal response to nutrient sensingδγ
Regev and Ruslan MedzhitovPope, Kavita Israni-Winger, Roham Parsa, Naomi H. Philip, Saleh Rashed, Noah Palm, Andrew Wang, Daniel Mucida, Aviv Zuri A. Sullivan, William Khoury-Hanold, Jaechul Lim, Chris Smillie, Moshe Biton, Bernardo S. Reis, Rachel K. Zwick, Scott D.
DOI: 10.1126/science.aba8310 (6535), eaba8310.371Science
, this issue p. eaba8310; see also p. 1202Science T cells modulate metabolic disease.δγinnate lymphoid cells. These findings may also provide insights into how
cells regulated the expression of a carbohydrate transcriptional program by limiting interleukin-22 production from type 3 Tδγimmune cell circuit that was required for digestion and absorption of carbohydrates. Intestinal −triggered an epithelial
and observed remodeling of the small intestinal epithelium in response to dietary carbohydrates. Nutrient availability Perspective by Talbot and Littman). The researchers analyzed mice fed a high-carbohydrate versus a high-protein diet
T cells in sensing nutrient uptake in the small intestine (see the δγdiscovered a previously unrecognized role for et al.) T cells are immune cells best known for host barrier defenses in epithelial tissues. Sullivan δγGamma delta (
T cells link immunity to nutritionδγ
ARTICLE TOOLS http://science.sciencemag.org/content/371/6535/eaba8310
MATERIALSSUPPLEMENTARY http://science.sciencemag.org/content/suppl/2021/03/17/371.6535.eaba8310.DC1
CONTENTRELATED
http://stm.sciencemag.org/content/scitransmed/12/572/eaaz2841.fullhttp://stm.sciencemag.org/content/scitransmed/12/558/eabc0441.fullhttp://stm.sciencemag.org/content/scitransmed/11/513/eaax9364.fullhttp://stm.sciencemag.org/content/scitransmed/13/577/eabb0192.fullhttp://science.sciencemag.org/content/sci/371/6535/1202.full
REFERENCES
http://science.sciencemag.org/content/371/6535/eaba8310#BIBLThis article cites 52 articles, 8 of which you can access for free
PERMISSIONS http://www.sciencemag.org/help/reprints-and-permissions
Terms of ServiceUse of this article is subject to the
is a registered trademark of AAAS.ScienceScience, 1200 New York Avenue NW, Washington, DC 20005. The title (print ISSN 0036-8075; online ISSN 1095-9203) is published by the American Association for the Advancement ofScience
Science. No claim to original U.S. Government WorksCopyright © 2021 The Authors, some rights reserved; exclusive licensee American Association for the Advancement of
on March 29, 2021
http://science.sciencem
ag.org/D
ownloaded from