immune epigenetic age in pregnancy and 1 year after birth
TRANSCRIPT

Am J Reprod Immunol. 2020;83:e13229. | 1 of 11https://doi.org/10.1111/aji.13229
wileyonlinelibrary.com/journal/aji
Received:6November2019 | Revised:24January2020 | Accepted:27January2020DOI: 10.1111/aji.13229
O R I G I N A L A R T I C L E
Immune epigenetic age in pregnancy and 1 year after birth: Associations with weight change
Kharah M. Ross1 | Judith Carroll2 | Steve Horvath3 | Calvin J. Hobel4 | Mary E. Coussons-Read5 | Christine Dunkel Schetter6
©2020JohnWiley&SonsA/S.PublishedbyJohnWiley&SonsLtd
1CentreforSocialSciences,AthabascaUniversity,Athabasca,AB,Canada2DepartmentofPsychiatryandBiobehavioralSciences,CousinsCenterforPsychoneuroimmunology,DavidGeffenSchoolofMedicine,SemelInstituteforNeuroscienceandHumanBehavior,UniversityofCalifornia–LosAngeles,LosAngeles,CA,USA3DepartmentofBiostatistics,UniversityofCalifornia–LosAngeles,LosAngeles,CA,USA4DepartmentofObstetricsandGynecology,Cedars-SinaiMedicalCenter,LosAngeles,CA,USA5PsychologyDepartment,UniversityofColorado–ColoradoSprings,ColoradoSprings,CO,USA6DepartmentofPsychology,UniversityofCalifornia–LosAngeles,LosAngeles,CA,USA
CorrespondenceKharahM.Ross,CentreforSocialSciences,AthabascaUniversity,1UniversityDrive,Athabasca,ABT9S3A3,USA.Email: [email protected]
Funding informationNationalCenterforAdvancingTranslationalSciences,Grant/AwardNumber:UL1TR001881;NationalInstitutesofHealth,Grant/AwardNumber:R01HD073491
AbstractProblem: Epigenetic age indices are markers of biological aging determined from DNAmethylationpatterns.Acceleratedepigeneticagepredictsmorbidityandmor-tality.Womentendtodemonstrateslowerbloodepigeneticagingcomparedtomen,possiblyduetofemale-specifichormonesandreproductivemilestones.Pregnancyand the post-partum period are critical reproductive periods that have not been stud-iedyetwithrespecttoepigeneticaging.Thepurposeofthispaperwastoexaminewhetherpregnancy itselfandan importantpregnancy-relatedvariable,changes inbodymassindex(BMI)betweenpregnancyandthepost-partumperiod,areassoci-ated with epigenetic aging.Method of Study: Apilotsampleof35womenwasrecruitedaspartoftheHealthyBabiesBeforeBirth(HB3)project.Wholebloodsampleswerecollectedatmid-preg-nancyand1yearpost-partum.DNAmethylationatbothtimepointswasassayedusingInfinium450KandEPICchips.Epigeneticageindiceswerecalculatedusinganonline calculator.Results: Paired-samplet-testswereusedtotestdifferencesinepigeneticageindicesfrompregnancyto1yearafterbirth.Over thiscritical timespan,womenbecameyounger with respect to phenotypic epigenetic age,GrimAge,DNAm PAI-1,andepige-neticageindiceslinkedtoaging-relatedshiftsinimmunecellpopulations,knownasextrinsic epigenetic age.Post-partumBMIretention,butnotprenatalBMIincreases,predicted accelerated epigenetic aging.Conclusion: Womenappeartobecomeyoungerfrompregnancytothepost-partumperiodbasedonspecificepigeneticageindices.Further,BMIat1yearafterbirththatreflects weight retention predicted greater epigenetic aging during this period.
K E Y W O R D S
bodymassindex,epigeneticage,post-partumperiod,pregnancy,wholeblood

2 of 11 | ROSS et al.
1 | INTRODUC TION
Immune cell-derived epigenetic age indices are indicators of biologi-cal aging1,2 that are highly correlated with chronological age but cap-turedifferentprocesses.Epigeneticagerobustlypredictsmorbidity,suchasriskofbreastandlungcancer,3,4 and earlier mortality.5-7Sexdifferencesinepigeneticagearealsoobserved,withwomenshowingslower rates of epigenetic aging compared with men.8-11 Reproductive biology and key reproductive periods, and their hormonal drivershave been proposed as one possible mechanism accounting for these sexdifferences.Forexample,earlieronsetofmenopause,whethernaturallyoccurringorsurgically induced, isassociatedwithacceler-ations in epigenetic aging in women.12 Also, faster onset and pro-gression of puberty in girls have been associated with epigenetic age accelerationsinonestudy,13 though not in another.14
Pregnancyisanormativereproductiveexperiencewith86%ofUSwomengivingbirth.15Theroleofpregnancyinbiologicalagingin general, and epigenetic aging in particular, is not well studied.Telomerelength,anothermarkerofbiologicalaging,wasexaminedin one study of 81 women followed from mid-pregnancy to 9 weeks post-partum,with results indicating no significant change in telo-mere length over this time frame.16 However, the effect of preg-nancyonepigeneticageremainsrelativelyunexplored.
Several epigenetic age indices exist that capture different as-pectsofbiological aging.Here,weexamined threeclassesofepi-genetic age indices: those based on chronological age, specific toimmunecells,andbasedonclinicalorphenotypicindicatorsofmor-talityrisk.Horvath'sDNAmethylationageisbasedonchronological age and is calculated fromDNAmethylation sites strongly associ-ated with chronological age across tissue types.2 The associationbetweenDNAmethylationageandchronologicalageisimperfect,suggestingadecouplingbetweenchronologicalageandDNAmeth-ylation-derivedage.Theageaccelerationresidualcapturesthedif-ference between chronological age and biological age estimated by Horvath'sDNAmethylationage.
Immune-specificbiological age isdeterminedbyboth intrinsic,i.e., within-cell biological age, and age-driven changes in immunecell proportions. As such, immune cell-specific epigenetic indices also consider cell proportions. Immune cell proportions change as afunctionofage,withincreasesinexhaustedorsenescentCD8+TcellsanddecreasesinnaïveCD8+Tcellsovertime.8,17Proportionsofimmunecells inbloodcanbeestimatedfromwholebloodDNAmethylation profiles.18 Intrinsic epigenetic age acceleration (IEAA)captures intrinsic biological age of immune cells, independent ofage-related changes in immune cell proportions.19 In contrast, ex-trinsic epigenetic age acceleration (EEAA) captures biological agedue to both intrinsic immune cell age and age-driven changes in im-mune cell populations.19
Finally, clinical or phenotypic-derived epigenetic age indices are calculated using DNAmethylation sites that are highly correlatedwithclinicalriskfactorsoroutcomes.Phenotypicepigeneticageac-celeration(PEAA)wasdevelopedasanepigeneticbiomarkerof“phe-notypicage,”definedbyninebiologicalmarkers(albumin,creatinine,
glucose,C-reactiveprotein,lymphocytepercent,meancellvolume,redcelldistribution,alkalinephosphatase,andwhitebloodcellcount)and chronological age.20GrimAgewasconstructedasacompositemarker calculated from epigenetic surrogate markers for 12 plasma proteins (adrenomedullin, β-2-microglobulin, CD56, ceruloplasmin,cystatin C, EGF fibulin-like ECM protein 1, growth differentiationfactor15,leptin,myoglobin,plasminogenactivatorinhibitor1,serumparaoxonase/arylesterase1,andtissueinhibitormetalloproteinases1)andsmokingpack-years,basedonself-reportedsmokingdata,21 and is strongly predictive of death. DNAm plasminogen activatorinhibitor-1(PAI-1) istheepigeneticsurrogatemarkerforPAI-1,21 a glycoprotein involved in suppressing fibrinolysis or the breakdown of bloodclots,andwhichisariskmarkerforcardiovasculardisease.22 In sum,eachepigeneticageindexcapturesdifferentfacetsofbiologicalaging,asindexedbydifferencesinDNAmethylationpatterns.
Weightchangebetweenpregnancyandthepost-partumperiodcould also be factors that affect epigenetic age during the child-bear-ingyears. Inhealthyadults,obesityandweightgainhavebeenas-sociated with accelerations in epigenetic age.23Weightgainduringpregnancy,however,isconsiderednormative.24 It might be hypothe-sizedthatinsufficientorexcessweightgaininpregnancyand/orre-tention of post-partum weight for longer than clinically recommended areassociatedwithmorerapidepigeneticaging.However, it isnotclear whether variation in weight change over pregnancy and varia-tion in weight loss during the post-partum period are associated with changes in epigenetic age in a manner similar to non-pregnancy pop-ulations.Thepurposeofthepresentstudywastoexaminechangesin epigenetic age variables between the second trimester and 1 year post-birth,andtestassociationsbetweenepigeneticageindicesandweight change during pregnancy and the post-partum period.
2 | METHODS
2.1 | Participants
A sample of 35womenwas studiedwhowere recruited into theHealthy Babies Before Birth (HB3) project, which is a longitudi-nal study designed to test the impact of antenatal maternal mood on pregnancy and post-partum outcome. Inclusion criteria were 18 years of age or older and singleton pregnancies up to 12 weeks gestationattimeofrecruitment.Exclusioncriteriawerecurrentsub-stanceabuse,HIV-positivestatus,currentsmoking,ormedicationsthat could affect inflammatory processes, for example, glucocor-ticoidsat the timeof recruitment.Thecurrent sample focusedonwomen recruitedatonlyoneof the twostudy sites (LosAngeles,CA),whohadwholebloodsamplescollectedatstudyentryinearlypregnancyandagainat1yearafterbirth.SamplecharacteristicsarepresentedinTable1.ThemajorityofparticipantswereWhite(43%),married(91%),andprimiparous(57%).Fewadversepregnancyout-comes were reported for the current sample, with only two par-ticipants (6%)givingbirthpreterm (<37weeksgestation), andone(3%)givingbirthtoalowbirthweightbaby(<2500g).Lessthanhalf
| 3 of 11ROSS et al.
(43%)reportedatleastoneobstetricrisk,thatis,seriousinfection,hypertension,diabetes,oranemia,eitherduring thisorapreviouspregnancy.StudydatawerecollectedandmanagedusingREDCapelectronic data capture tool.25
2.2 | Protocol
Women completed a maximum of six assessments, three overpregnancy (8-16 weeks gestation, 20-26 weeks gestation, and30-36 weeks gestation) and three over the post-partum period(6weeks,6months,and1yearpost-birth).Womenwereincludedinthe current analyses if they had information available on all variables. Demographics and previous pregnancy information were obtained at studyentry.Heightandweightweretakenateachassessment.Wholeblood samples were collected at the first or second pregnancy visit (16.3±2.78weeksgestation;8-26weeksgestation)andatthe1-yearpost-birthfinalstudyvisit(11.5±0.505months).Onaverage,therewere16.9±0.938monthsbetweenthetwoassessments.
2.3 | DNA methylation
DNAwasextractedfromwholebloodandassayedforDNAmethyla-tion by theUCLANeurosciencesGenomics Core. The firstwave ofparticipants(n=19)wasbatchedtogetherusingtheIlluminaInfinium
HumanMethylation450 BeadChip (Illumina, Inc; 485,577 CpG sites).Thesecondwaveofparticipants(n=16)wasrunayearlaterusingadifferent chip, the InfiniumMethylationEPIC BeadChip Kit (Illumina,Inc;868,464CpGsites).AchangeinchipusedwasnecessarybecauseIllumina had discontinued the previous chip between the two runs. Approximately90%oftheCpGsitesonthe450Kchiparealsoincludedon the850Kchip.Bothpregnancy andpost-partum samples fromagiven participant were run on the same chip and in the same batch.
DNA methylation data were pre-processed as per standardprotocols.2,26 Raw data were normalized using Noob in the minify package in R.27CpGcites thatweremissingon the450KorEPICchipswereadded,andprocesseddatawereuploadedintotheepi-geneticclockonlinecalculator(https://dnamage.genetics.ucla.edu/).Theonlinecalculatoralsoproducesqualitycontrolchecks.Allsam-pleswerecorrectlyidentifiedasbeingfemaleinorigin,withtissuesourcesofeitherwholebloodorbloodPBMCs,andhadsampleandgoldstandardcorrelations>.80(meanr=.96).
2.4 | Epigenetic age variables
2.4.1 | DNA methylation age and age acceleration residual
The epigenetic age of each blood sample was estimated usingseveralwell-definedalgorithmsavailable throughanonlineDNA
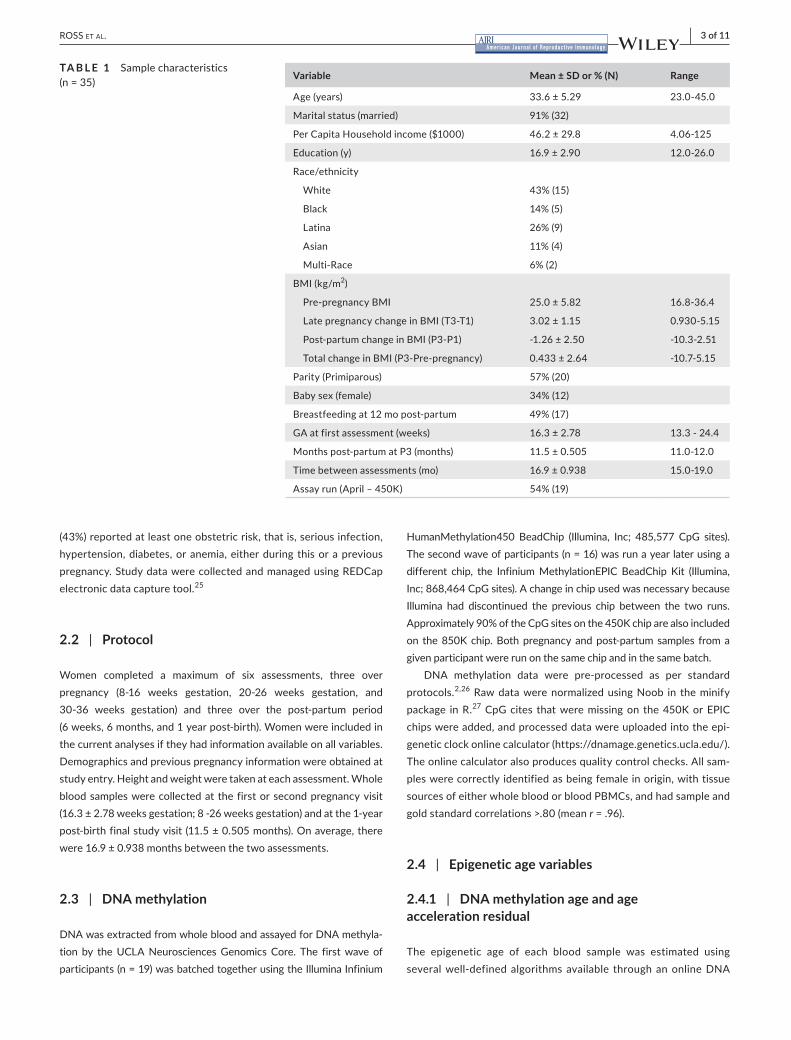
Variable Mean ± SD or % (N) Range
Age(years) 33.6±5.29 23.0-45.0
Maritalstatus(married) 91%(32)
PerCapitaHouseholdincome($1000) 46.2±29.8 4.06-125
Education(y) 16.9±2.90 12.0-26.0
Race/ethnicity
White 43%(15)
Black 14%(5)
Latina 26%(9)
Asian 11%(4)
Multi-Race 6%(2)
BMI(kg/m2)
Pre-pregnancyBMI 25.0±5.82 16.8-36.4
LatepregnancychangeinBMI(T3-T1) 3.02±1.15 0.930-5.15
Post-partumchangeinBMI(P3-P1) -1.26±2.50 -10.3-2.51
TotalchangeinBMI(P3-Pre-pregnancy) 0.433±2.64 -10.7-5.15
Parity(Primiparous) 57%(20)
Babysex(female) 34%(12)
Breastfeedingat12mopost-partum 49%(17)
GAatfirstassessment(weeks) 16.3±2.78 13.3-24.4
Monthspost-partumatP3(months) 11.5±0.505 11.0-12.0
Timebetweenassessments(mo) 16.9±0.938 15.0-19.0
Assayrun(April–450K) 54%(19)
TA B L E 1 Samplecharacteristics(n=35)

4 of 11 | ROSS et al.
methylation calculator.2DNAmethylationage(DNAmage;years),orbiologicalage,wascalculatedusingtheHorvathmethod,2 which uses the weighted average of regression coefficients obtained from353CpG“epigeneticclock”sites.Theageaccelerationresid-ual represents the difference between chronological and biological age,whichiscalculatedbytakingtheresidualfromthelinearre-gression model of biological age regressed onto chronological age. Again,positivevaluesindicateacceleratedbiologicalaging.
2.4.2 | Estimates of immune cell proportions
Additionalage-adjustedestimatesofproportionsofimmunecellsincirculation and biological age estimates specific to blood were ob-tained using the advanced analysis option in the online epigenetic clock calculator.2Proportionsofplasmablastcells,exhaustedorse-nescentCD8+Tcells(CD8+CD28-CD45FA-Tcells),naïveCD8+Tcells,andnaïveCD4+TcellswerecalculatedusingHouseman'ses-timationtechnique,whichisbasedonDNAmethylationsignaturesderivedfrompurifiedsamplesofleukocytes,18 and then adjusted for chronological age.
2.4.3 | Intrinsic and extrinsic epigenetic age acceleration
IEAA is estimated using the 353 CpG sites from the Horvathmethod2 to calculate the residual of biological age regressed onto chronological age, adjusting for imputedmeasures of blood cellcountsknowntochangewithage,specificallyCD8+naïveTcells,senescent CD8+ T cells, and plasmablasts.19 EEAA is estimatedusingthe71CpGsitesusedbytheHannummethodofcalculatingDNAmAge9 and is then enhanced using static weighted averages ofbloodcellcountsthatvarywithage,thatis,CD8+naïveTcells,senescentCD8+Tcells,andplasmablasts.28Theweightsarecal-culated from the correlation between chronological age and each individual variable.28
2.4.4 | Phenotypic epigenetic age acceleration
Phenotypicepigenetic ageaccelerationwas calculatedbyMorganLevineusingRsyntaxasdescribedelsewhere.20PEAAiscalculatedfrom 513 CpG sites that were selected based on ability to predict bothchronologicalageandphenotypicindicatorsofaging.PEAAisassociatedwithall-causemortality,cancers,physicalfunction,andAlzheimer'sdisease.20
2.4.5 | GrimAge and DNAm PAI-1
GrimAge and DNAm PAI-1 are epigenetic age markers enrichedforDNAmethylationsitesthataresurrogatebiomarkersforblood
plasma proteins related to morbidity and mortality and cigarette smoking(packsperyear).21DNAmPAI-1isoneofsevensurrogateDNA methylation indices validated by identifying the CpG sitesmostassociatedwithbloodplasmaproteinconcentrations.DNAmPAI-1emergedasthebloodplasmaproteinsurrogate indexmostassociated with risk for cardiovascular disease and physical func-tioning. GrimAge is a composite biomarker calculated from theDNAm-based surrogate epigenetic indices determined for sevenbloodplasmaproteinsandtheepigeneticindexcapturingsmokingpack-years.BothGrimAgeandDNAmPAI-1arepowerfulpredic-tors of morbidity and mortality.21
2.4.6 | Assay reliability
Atotalof16mid-pregnancysampleswereassayedonboththe450Kand850KDNAmethylationchips, allowing fora testof reliabilityof epigenetic age variables produced by the two assays. Estimates of DNA methylation age, EEAA, PEAA, GrimAge, DNAm PAI-1,and age-adjustedCD8+Naïve cellswere fairly reliable or consist-entbetweenthetwochips,r's >.60.AgeaccelerationresidualsandIEAA,however,wereonlymoderatelyreliable,r's=.40-.50,andage-adjustedproportionofCD8pCD28nCD45RAnwerenotconsistentbetweenruns,r=−.01.Toaccountforpotentialbetween-persondif-ferencesgeneratedbyassay,acovariatecapturingassaybatchwasincludedinalllinearregressionmodels.(Within-personcomparisonswould not be affected by between-chip differences because sam-ples from the same participant were always assayed on the same chip).
2.5 | Weight changes over pregnancy and the post-partum period
Participantheight in incheswasassessedatstudy intake,andpar-ticipants self-reported their last known pre-pregnancyweight. Ateachassessment,weightinpoundswasmeasuredbystudyperson-nelusingabalancebeamscale.Bodymassindex(BMI;kg/m2)wascalculatedbyconvertingheightandweighttometricunits,thendi-vidingweight(kg)byheightsquared(m2)forreportedpre-pregnancyweight and weight at each time point.
Pregnancy BMI change was calculated by subtracting firstpregnancy assessment of BMI from last pregnancy assessment ofBMI. Post-partumBMI changewas calculated by subtracting firstpost-partum assessment of BMI from the last post-partum as-sessmentofBMI.TotalBMIchangewascalculatedbysubtractingpre-pregnancyBMIfromlastpost-partumassessmentBMI.
2.6 | Covariates
Assay batch (54% [19] on Illumina 450K; 46% [16] on IlluminaEPIC)wasincludedinallmodels.Giventhesmallsamplesize,only

| 5 of 11ROSS et al.
covariates significantly associated with epigenetic age variables were included in analyses, specifically race/ethnicity (coded asWhiteornotWhite),yearsofeducation,parity(codedasprimipar-ityormultiparity),maritalstatus(marriedand/orcohabitingornot),gestationalageatpregnancybloodsampling(weeks),breastfeeding(stopped breastfeeding before 1 year post-partum or still breast-feedingat1yearpost-partum),andpre-pregnancyBMI.Notethatgestational age at pregnancy blood sampling was only included in models examining pregnancy-to-post-partum change in epigeneticage indices.
Per capita household incomewas also considered as a covari-ate,butwasnotsignificantlyassociatedwithepigeneticageindices.Given power considerations, itwas not included as a covariate inanalyses.
2.7 | Analytic strategy
AllanalyseswererunusingSPSSv.24.29 Data were inspected for outliers and normality prior to analyses. Outliers were defined as values>±3standarddeviationsfromtherespectivemeans.First,trends in epigenetic age variables between pregnancy and the post-partumperiodwereinspected.BivariatecorrelationswereusedtotestassociationsbetweenchronologicalageandDNAmethylationageatthepregnancyandpost-partumperiodassessments.Paired-sample t-tests were used to determine whether there were signifi-cant changes in the epigenetic age variables from mid-pregnancy to 1 year post-partum.
Next, associations between BMI changes between pregnancyto1yearpost-birthandepigeneticagevariablesinpregnancy,andchangeover the follow-up,asappropriate,wereassessed.Changein epigenetic age variables was calculated by subtracting pregnancy values from 1-year post-birth values. Bivariate correlations wereinspected to identify significant associations and were followed by
linear regression analyses controlling for assay batch and covariates asnotedabove.Linearregressionmodelspredictingchangeinepi-genetic age variables also co-varied for baseline or mid-pregnancy epigenetic values.30,31 Given the small sample size (N = 35), bothsignificant(P<.05)andmarginallysignificant(P<.10)effectswerereported.BivariateassociationssignificantatP<.10werefollowedby linear regression models.
3 | RESULTS
3.1 | Change in epigenetic age from pregnancy to the post-partum period*
Meanepigeneticageindicesatmid-pregnancyand1yearafterbirthare reported in Table 2. At study entry, womenwere on average33.6±5.29yearsoldchronologically,but36.3±5.52yearsoldwithrespecttoDNAmethylationage.
Strength of associations between chronological age and DNAmethylation age was compared for pregnancy and post-birth as-sessments (Figure 1). Consistent with studies of general adultpopulations, chronological age and DNAmethylation were highlycorrelated(r's= .758and.770,ateachtimepoint).Strengthofas-sociationsbetweenthetwoperiodswasnotstatisticallydifferent,z=−0.120,P=.905,suggestingthattherelationbetweenchrono-logicalageandDNAmethylationageremainsconstantfrompreg-nancy to the post-partum.
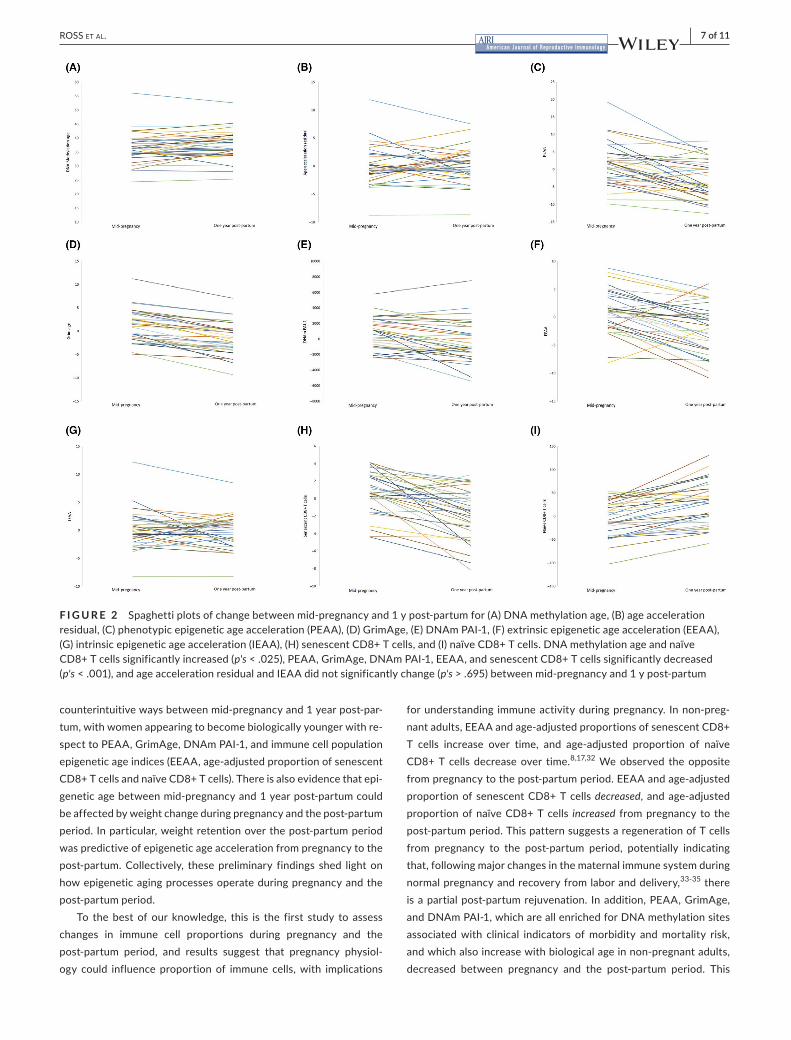
Paired-sample t-testswereused todeterminewhetherchangein epigenetic age variables occurred between mid-pregnancy and 1yearpost-birth (Table2).Asexpected,DNAmethylationage in-creased significantly between the two time points, t(34) = 2.34,p=.0.025,M=1.21years,SD=3.05years.Considerablevariationwaspresent,however,withchangesinDNAmethylationagerangingfromincreasesof5.51yearstodecreasesof3.07years(Figure2A).
TA B L E 2 Epigeneticagevariabledescriptivestatistics(n=35)
Variable
Mid-pregnancy 1 y post-partum Difference (PP - Preg)
Mn ± SD Range Mn ± SD Range Mn ± SD Range P
Chronologicalage(y) 33.6±5.29 23.0-45.0 35.1±5.19 24.0-46.0 1.46±0.505 1.0-2.00 <.001
DNAmethylationage(y) 36.3±5.52 30.0-42.6 37.5±5.20 30.4-45.3 1.21±3.05 −3.07-5.51 .025
Ageaccelerationresidual 0.014±3.51 −3.82-3.37 0.181±3.12 −3.99-6.59 0.167±3.04 −3.68-4.30 .747
EEAA(BioAge4HAStaticAdjAge) 1.06±3.77 −2.79-7.33 −1.97±4.28 −5.79-5.97 −3.03±3.78 −7.76-8.00 <.001
IEAA(AAHOAdjCellCounts) 0.158±3.35 −2.68-2.89 −0.043±2.92 −4.09-3.16 −0.201±3.01 −4.23-3.63 .695
SenescentCD8+Tcells 0.775±2.35 −1.76-4.13 −1.70±2.87 −4.99-2.74 −2.48±2.54 −5.86-2.75 <.001
NaïveCD8+Tcells −5.69±37.4 −45.2-49.9 23.8±46.7 −35.2-89.8 29.5±29.1 −23.7-62.8 <.001
PEAA 1.32±5.96 −8.65-11.0 −3.18±5.41 −10.1-8.09 −4.50±4.98 −13.4-3.31 <.001
DNAmPAI-1 663±1970 −2430-5777 −387±2580 −5411-7501 −1049±1584 −6086-1723 <.001
GrimAge 1.08±3.38 −4.88-11.3 −1.56±3.35 −9.34-7.06 −2.65±1.50 −6.22-0.45 <.001
Abbreviatons:EEAA,extrinsicepigeneticageacceleration(ie,notadjustedforcellpopulations,combinationofageintrinsictocellsandduetoage-relatedchangesincellpopulations);IEAA,intrinsicepigeneticageacceleration(ie,adjustedforcellpopulations,intrinsictoimmunecells);PEAA,phenotypic epigenetic age acceleration.

6 of 11 | ROSS et al.
Onaverage,therewerenosignificantchangesinrateofDNAageac-celerationfrompregnancytothepost-partumperiod,t(34)=0.326,P=.747,indicatingthatrateofepigeneticagingdidnotchangeoverthisperiod(Figure2B).
Significant changes were observed for PEAA, GrimAge, and DNAm PAI-1. In contrast to studies of non-pregnant adults, sig-nificant decreases inPEAA, t(34) =−5.34,P < .001,M=−4.50,SD=4.98(Figure2C),GrimAge,t(34)=−10.5,P<.001,M=−2.65,SD=1.50(Figure2D),andDNAmPAI-1,t(34)=−3.92,P< .001,M = −1050, SD = 1584 (Figure 2E), were observed betweenmid-pregnancyand1yearpost-birth.This suggests thatwomenbecome on average youngerwithrespecttoPEAA,GrimAge,andDNAmPAI-1betweenpregnancyandthepost-partumperiod.
Immune-specific epigenetic age indices also evidenced sig-nificant changes over time. Specifically, there were significantdecreases in EEAA observed from mid-pregnancy to 1 year post-partum, t(34) = −4.73, P < .001, M = −3.03, SD = 3.78(Figure 2F), but IEAA did not significantly change over the fol-low-up,t(34)=−0.396,P= .695(Figure2G). IEAAcapturesepi-genetic aging that is independent of age-related shifts in immune cellpopulations,whereasEEAAisanindicatorofimmuneepigene-tic age enriched for age-related shifted in immune cell populations. Giventhatdecreases inonlyEEAAwereobserved,thissuggeststhat women become younger with respect to age-related shifts in immunecellpopulationsspecifically.Consistentwiththispattern,changes were also detected in age-adjusted proportions of immune cells.Again,contrarytowhat isexpectedbasedonobservationsinnon-pregnantadults,proportionofsenescentCD8+Tcellssig-nificantly decreased frompregnancy to the post-partumperiod,t(34)=−5.78,P<.001,M=−2.48,SD=2.54(Figure2H),andnaïveCD8+Tcellsincreased,t(34)=5.99,P<.001,M=29.5,SD=29.1(Figure2I).
3.2 | Body mass index (BMI) change and post-partum epigenetic variables†
Participants on average gained 3.02 ± 1.15 kg/m2 during preg-nancy,lost1.26±2.50kg/m2duringtheyearafterbirth,andgained0.433 ± 2.64 kg/m2 from before pregnancy to 1 year after birth. In bivariate correlations, increases in BMI during pregnancywereassociatedwith lower post-birthDNAmethylation age, r = −.329,P=.053,lowerGrimAge,r=−.389,P=.021,andlowerDNAmPAI-1,r=−.351,P= .039.‡ Aftercovariateswereaddedtomodels, in-creasesinBMIduringlatepregnancyonlypredictedlowerpost-birthGrimAge,b=−1.35,SE=0.507,P=.013(Table3).
Havingnodecrease inBMIduring theyearpost-birth (reflect-ing weight retention) was associated with higher post-birth DNAmethylationage, r = .395,P = .021,higher ageacceleration resid-ual,r=.362,P=.035,higherIEAA,r=.401,P=.019,higherPEAA,r=.489,P=.003,higherGrimAge,r=.639,P<.001,higherDNAmPAI-1,r= .409,P= .016,smallerdecreases inGrimAgefrompreg-nancyto1yearafterbirth,r=.446,P=.008,andsmallerdecreasesinDNAmPAI-1,r=.491,P=.003.Eachoftheseassociationsper-sistedafteradjustingforcovariates,p's<.028(Table3;Figure3).
Next,changeinBMIduringpregnancyandduringthefirstyearpost-birth were both entered into linear regression models with co-variates.HavingnodecreaseinBMIby1yearpost-birthcontinuedto predict higher 1-year age acceleration residuals, IEAA, PEAA,GrimAge,changeinGrimAge,andchangeinDNAmPAI-1,p's<.041.In contrast, BMI changeduring pregnancywas not independentlyassociatedwithanyepigeneticageindices,p's >.217.
Finally, bivariate correlations between total BMI change frombefore pregnancy to the post-birth and epigenetic age indices were computed. Greater total increases in BMI from preconception to1 year post-birth were associated with higher post-birth PEAA,r= .331,P= .052,GrimAge, r= .430,P= .010,andhigherDNAmPAI-1,r=.351,P=.038;smallerdecreasesinPEAA,r=.440,P=.08,smaller decreases inGrimAge, r = .451,P = .007, and smaller de-creases in DNAm PAI-1, r = .496, P = .002, from pregnancy to1 year post-birth; and large increases in IEAA from pregnancy to1yearpost-birth,r=.316,P=.064.Afteradjustingforcovariates,greater total increases inBMI frompreconception to1yearpost-birthcontinuedtobeassociatedwithincreasesinIEAA,b=0.504,SE = 0.216,P = .028, and smaller decreases in PEAA, b = 0.700,SE=0.326,P=.042,GrimAge,b=.0.439,SE=0.098,P<.001,andDNAmPAI-1,b=336,SE=130,P=.017(Table3).
4 | DISCUSSION
Thepurposeofthisstudywastoevaluatechangesinimmunecellepi-genetic age indices between pregnancy and the post-partum period andexploreassociationswithimportantpregnancy-relatedfactors,namely weight change from mid-pregnancy to 1 year post-partum. Theresultssuggestthatsomeepigeneticagevariableschanged in
F I G U R E 1 ScatterplotshowingtheassociationbetweenchronologicalageandDNAmethylationageduringpregnancyandat1ypost-partum.Atthemid-pregnancyassessment,DNAmethylationageandchronologicalagearecorrelated,r=.758,andatthe1ypost-partumassessment,r=.770
| 7 of 11ROSS et al.
counterintuitive ways between mid-pregnancy and 1 year post-par-tum,withwomenappearingtobecomebiologicallyyoungerwithre-specttoPEAA,GrimAge,DNAmPAI-1,andimmunecellpopulationepigeneticageindices(EEAA,age-adjustedproportionofsenescentCD8+TcellsandnaïveCD8+Tcells).Thereisalsoevidencethatepi-genetic age between mid-pregnancy and 1 year post-partum could be affected by weight change during pregnancy and the post-partum period.Inparticular,weightretentionoverthepost-partumperiodwas predictive of epigenetic age acceleration from pregnancy to the post-partum.Collectively, thesepreliminary findings shed lightonhow epigenetic aging processes operate during pregnancy and the post-partum period.
To the best of our knowledge, this is the first study to assesschanges in immune cell proportions during pregnancy and the post-partum period, and results suggest that pregnancy physiol-ogy could influence proportion of immune cells,with implications
for understanding immune activity during pregnancy. In non-preg-nantadults,EEAAandage-adjustedproportionsofsenescentCD8+T cells increase over time, and age-adjusted proportion of naïveCD8+T cells decreaseover time.8,17,32Weobserved theoppositefrompregnancytothepost-partumperiod.EEAAandage-adjustedproportionof senescentCD8+Tcellsdecreased, andage-adjustedproportionofnaïveCD8+Tcells increased from pregnancy to the post-partumperiod.ThispatternsuggestsaregenerationofTcellsfrom pregnancy to the post-partum period, potentially indicatingthat,followingmajorchangesinthematernalimmunesystemduringnormalpregnancyandrecoveryfromlaboranddelivery,33-35 there isapartialpost-partumrejuvenation. Inaddition,PEAA,GrimAge,andDNAmPAI-1,whichareallenrichedforDNAmethylationsitesassociatedwith clinical indicators ofmorbidity andmortality risk,andwhichalsoincreasewithbiologicalageinnon-pregnantadults,decreased between pregnancy and the post-partum period. This
F I G U R E 2 Spaghettiplotsofchangebetweenmid-pregnancyand1ypost-partumfor(A)DNAmethylationage,(B)ageaccelerationresidual,(C)phenotypicepigeneticageacceleration(PEAA),(D)GrimAge,(E)DNAmPAI-1,(F)extrinsicepigeneticageacceleration(EEAA),(G)intrinsicepigeneticageacceleration(IEAA),(H)senescentCD8+Tcells,and(I)naïveCD8+Tcells.DNAmethylationageandnaïveCD8+Tcellssignificantlyincreased(p's<.025),PEAA,GrimAge,DNAmPAI-1,EEAA,andsenescentCD8+Tcellssignificantlydecreased(p's<.001),andageaccelerationresidualandIEAAdidnotsignificantlychange(p's >.695)betweenmid-pregnancyand1ypost-partum

8 of 11 | ROSS et al.
suggests that overall pregnancy may slow some aspects of aging. It is possible that this is drivenby theuniqueneuroendocrine ac-tivity that characterizes pregnancy and the post-partum period,particularlyforgrowthandthyroidhormones,24 although additional researchisneededtoexplorethispossibility.Collectively,then,ourfindingssuggestthatinsomeways,women'simmuneindicatorsofbiological age become younger between mid-pregnancy and 1 year post-partum,consistentwithaprotectivehealtheffectofparity36-40 and slower biological aging in women compared to men.8-11
Post-partumweightchangeemergedasastrongpredictorofepigeneticageindices.Innon-pregnantadultsamples,obesityandhigher body weight are associated with accelerated epigenetic age.23 In the current sample,weight gain during pregnancywasnot consistently associated with post-partum epigenetic age indi-ces. It is possible that processes linking weight gain and biological agingareinterruptedduringpregnancyinanadaptivemanner,orthat no association was found because weight gain during preg-nancycanbedrivenbyotherfactors,forexample,fluidretention,
and placenta and fetal growth. This finding alongwith the oth-ers requires replication. In contrast,weight retentionduring thepost-partum period was associated with accelerations in DNAmethylationageandhigherPEAAat12monthspost-partum,andthiswas independentofweightchangeduringpregnancy.Thesefindingsareimportantinthecontextofpriorworksuggestingthatpost-partum weight gain and weight retention increases risk for later health issues.41-44
Thereareseverallimitationstoconsider,andforemostisthatthis was a pilot study with a relatively small sample size. It is not possible to determine whether null results indicate a lack of as-sociationoralackofpowertodetectassociations.Nevertheless,meaningful and potentially important patterns were detected,supporting the usefulness of pursuing these questions in futureresearch. Second, although a clear strength of the study is useof data collected in a prospective design, the time period frommid-pregnancy to 1 year post-partum does not capture the full length of pregnancy, which would be of interest to do. Future
Predictor Outcome B SE β P
PregBMIchange PPDNAmethylationage
1.23- 0.952 −.271 .207
PPGrimAge −1.35 0.507 −.464 .013
PPDNAmPAI-1 −680 376 −.302 .082
PPBMIchange PPDNAmethylationage
1.02 0.435 .484 .028
PPAgeaccelresid 0.730 0.253 .577 .008
PPIEAA 0.795 0.229 .671 .002
PPPEAA 1.30 0.393 .592 .003
PPGrimAge 0.874 0.217 .645 <.001
PPDNAmPAI-1 497 179 .476 .010
ChangeGrimAgea 0.450 0.118 .744 .001
ChangeDNAmPAI-1a 323 140 .519 .030
TotalBMIchange PPPEAA 0.728 0.426 .356 .099
PPGrimAge 0.472 0.253 .373 .074
PPDNAmPAI-1 277 189 .284 .154
ChangeinIEAAa 0.504 0.216 .443 .028
ChangeinPEAAa 0.700 0.326 .372 .042
ChangeinGrimAgea 0.439 0.098 .212 <.001
ChangeinDNAmPAI-1a
336 130 .561 .017
Abbreviations:Ageaccelresid,ageaccelerationresidual;BMI,bodymassindex;EEAA,extrinsicepigeneticageacceleration;IEAA,intrinsicepigeneticageacceleration;PEAA,phenotypicepigeneticageacceleration;PP,post-partum;Preg,pregnancy.aindicatesmodelsforwhichbaseline(pregnancy)epigeneticageindicesandgestationalageatpregnancy assessment were additionally included as covariates.
TA B L E 3 Linearregressionmodelspredicting epigenetic age variables from pregnancy-related variables
F I G U R E 3 Associationsbetweenpost-birthchangeinBMIwith(A)post-partumDNAmethylationage,(B)post-partumage-adjustedaccelerationresiduals,(C)post-partumIEAA(intrinsicepigeneticageacceleration),(D)post-partumPEAA(phenotypicepigeneticageacceleration),(E)post-partumGrimAge,(F),post-partumDNAmPAI-1,(G)changeinGrimAgefrommid-pregnancyto1ypost-partum,and(H)changeinDNAmPAI-1frommid-pregnancyto1ypost-partum,adjustingforcovariates.Baselineormid-pregnancyvalueswerealsoincluded as covariates for models of change

| 9 of 11ROSS et al.

10 of 11 | ROSS et al.
work should consider tracking epigenetic aging from preconcep-tion through pregnancy and possibly longer into the post-birth pe-riod and to test additional factors that are associated with rates of aging. Third, there was a change in DNA methylation chipsmid-way through our pilot project (450K vs EPIC), and indica-tions of systematic between-person differences in epigenetic age variablesweredetectedbychip.Within-persondifferenceshow-ever were not due to chip differences because samples drawn for each participant from the two different time points were always includedon the samechip.Thus,observedchange inepigeneticagecouldnotbedue tobatch. Likewise,batchwasadjusted forin ourmodels.Optimally, future research should replicate thesefindingsusinga singlechip to reducebatcheffects.Fourth, it ispossiblethatadversepregnancyoutcomes,suchaspretermbirth,or obstetric risk factors, such ashypertension, diabetes, seriousinfections, or anemia, could affect epigenetic age indices in im-mune cells during pregnancy. Due to the small sample size and lowfrequencyofspecificpregnancycomplications,wewerenotable to test associations between pregnancy complications and change in epigenetic age indices between pregnancy and a year post-partum. Future work should consider how epigenetic aging during pregnancy and the post-partum is affected by pregnancy complications and adverse outcomes.
5 | CONCLUSIONS
From pregnancy to post-partum, women's epigenetic age, as in-dexedbytheEEAA,PEAA,GrimAge,andDNAmPAI-1,decreasedfrompregnancytothepost-partum,indicatingdecelerationofbio-logicalaging.Thisisthereverseofwhathasbeenobservedinnon-pregnantadults.Importantly,notallwomenexhibiteddeceleration.Whenexaminingpredictorsof ratesofepigenetic aging,post-par-tum weight gain was associated with increases in epigenetic aging. Thesefindingsshedlightontheuniquebiologicalstatesthatconsti-tute pregnancy and the post-partum period and highlight a possible mechanism through which pregnancy and post-partum associated factors could affect maternal health over the long-term.
ACKNOWLEDG MENTSAll protocols and methods were reviewed and approved by theUniversityofCalifornia—LosAngeles,Cedars-SinaiMedicalCentreinstitutional review boards, and participants provided written in-formedconsent.Allauthorshavereviewedthismanuscriptandcon-sent to its publication. Data will be deposited following completion ofalldataanalyses,butareavailableuponrequest fromJ.CarrollandC.DunkelSchetter.Theauthorsreportnocompetinginterests.HealthyBabiesBeforeBirth(HB3)StudywassupportedbyfundingfromNIH(R01HD073491:MPI:Coussons-Read&DunkelSchetter).Additional epigenetic assays were funded by the NIH/NationalCenter for Advancing Translational Science UCLA CTSI Grant(UL1TR001881). REDCap is supported by the Colorado Clinical
& Translational Sciences Institute (CCTSI) with the Developmentand Informatics Service Center (DISC) grant support [NIH/NCRRColorado CTSI Grant Number UL1 RR025780] and by the UCLACousins Center for Psychoneuroimmunology. K. Ross conductedanalysesandledwritingthemanuscript,J.Carrolladvisedondirec-tionofanalysesandmanuscript,S.Horvathadvisedonepigeneticclockandrelatedanalyses,andC.DunkelSchetterandM.CousinsReadoversawthelargerstudydesign,datacollection,andadvisedonthemanuscript.TheauthorsthanktheparticipantsandthestaffespeciallyDrRobertaMancuso,ProjectCoordinatorinDenverandSusanJackman,RN,CoordinatoroftheCedarsSinaiHealthCentersite.
ORCIDKharah M. Ross https://orcid.org/0000-0002-1472-5630
ENDNOTE S* Pregnancyandpost-partumepigeneticageindiceswereadjustedfor
gestational age at pregnancy at time of blood sampling using repeated measureANCOVAs.Magnitudeofchangeoverthefollow-upwasnotaffectedbygestationalageatsampling,andthesamepatternofre-sults emerged.
† Patternof resultswassimilarandconsistentwhentimingofweightmeasurement(pregnancygestationalageorweekspost-partum)andtiming between weight measurements were included in models as covariates.
‡ Given that there is no theoretical reason to assume that mid-preg-nancy epigenetic age values would drive changes in weight over the follow-up,pregnancyepigeneticagevariableswerenotconsidered.
R E FE R E N C E S 1. MitteldorfJ.Howdoesthebodyknowhowolditis?Introducingthe
epigenetic clock hypothesis. Interdiscip Top Gerontol.2015;40:49-62. 2. HorvathS.DNAmethylationageofhumantissuesandcelltypes.
Genome Biol.2013;14(10):R115. 3. AmbatipudiS,HorvathS,PerrierF,etal.DNAmethylomeanalysis
identifies accelerated epigenetic ageing associated with postmeno-pausal breast cancer susceptibility. Eur J Cancer.2017;75:299-307.
4. LevineME,HosgoodHD,ChenB,AbsherD,AssimesT,HorvathS.DNAmethylationageofbloodpredictsfutureonsetoflungcancerin the women’s health initiative. Aging.2015;7:690-700.
5. MarioniRE,ShahS,McRaeAF,etal.DNAmethylationageofbloodpredicts all-cause mortality in later life. Genome Biol. 2015;16:25.
6. HorvathS,PirazziniC,GiulaBacaliniM,etal.Decreasedepigeneticage of PBMCs from Italian semisupercentenarians and their off-spring. Aging.2015;7:1159-1170.
7. ChristiansenL,LenartA,TanQH,etal.DNAmethylationageisas-sociated with mortality in a longitudinal Danish twin study. Aging Cell.2016;15(1):149-154.
8. Kananen L,Marttila S,Nevalainen T, et al. The trajectory of thebloodDNAmethylomeageingrateislargelysetbeforeadulthood:evidence from two longitudinal studies. Age (Dordr).2016;38(3):65.
9. Hannum G, Guinney J, Zhao L, et al. Genome-wide methylationprofiles reveal quantitative views of human aging rates.Mol Cell. 2013;49(2):359-367.
10. WeidnerCI,LinQ,KochCM,etal.AgingofbloodcanbetrackedbyDNAmethylationchangesatjustthreeCpGsites.Genome Biol. 2014;15:R24.

| 11 of 11ROSS et al.
11. SimpkinAJ,HemaniG,SudermanM,etal.Prenatalandearlylifein-fluences on epigenetic age in children: a study of mother-offspring pairs from two cohort studies. Hum Mol Genet.2016;25(1):191-201.
12. LevineME,LuAT,ChenBH,etal.Menopauseacceleratesbiologicalaging. Proc Natl Acad Sci USA.2016;113(33):9327-9332.
13. BinderAM,CorvalanC,MericqV,etal.Fastertickingrateoftheepigenetic clock is associated with faster pubertal development in girls. Epigenetics.2018;13(1):85-94.
14. SimpkinAJ,HoweLD,TillingK,etal.Theepigeneticclockandphys-ical development during childhood and adolescence: longitudinal analysis from a UK birth cohort. Int J Epidemiol.2017;46(2):549-558.
15. Pew Research Center. They’reWaiting Longer, but U.S.WomenTodayMoreLikelytoHaveChildrenThanaDecadeAgo;2018.
16. MitchellAM,KowalskyJM,EpelES,LinJ,ChristianLM.Childhoodadversity, social support, and telomere length among perinatalwomen. Psychoneuroendocrinology.2018;87:43-52.
17. MarttilaS,KananenL,HayrynenS,etal.Ageing-associatedchangesin thehumanDNAmethylome:genomic locationsandeffectsongeneexpression.BMC Genom.2015;16:179.
18. HousemanEA,AccomandoWP,KoestlerDC,etal.DNAmethyla-tionarraysassurrogatemeasuresofcellmixturedistribution.BMC Bioinformatics. 2012;13:86.
19. CarrollJE,IrwinMR,LevineM,etal.Epigeneticagingandimmunesenescence in women with insomnia symptoms: findings from the women's health initiative study. Biol Psychiatry.2017;81(2):136-144.
20. LevineME,LuAT,QuachA,etal.Anepigeneticbiomarkerofagingfor lifespan and healthspan. Aging (Albany NY).2018;10(4):573-591.
21. Lu AT, Quach A, Wilson JG, et al. DNA methylation GrimAgestrongly predicts lifespan and healthspan. Aging (Albany NY). 2019;11(2):303-327.
22. Kohler HP, Grant PJ. Plasminogen-activator inhibitor type 1 andcoronary artery disease. N Engl J Med.2000;342(24):1792-1801.
23. Horvath S, Erhart W, Brosch M, et al. Obesity acceler-ates epigenetic aging of human liver. Proc Natl Acad Sci USA. 2014;111(43):15538-15543.
24. CunninghamGF,LevenoKJ,BloomSL,HauthJC,RouseDJ,SongCY. Williams Obstetrics,24ed.NewYork:McGrawHillProfessional;2014.
25. Harris PA, Taylor R, Thielke R, Payne J, Gonzalez N, Conde JG.Research electronic data capture (REDCap) – Ametadata-drivenmethodology and workflow process for providing translational re-search informatics support. J Biomed Inform.2009;42:377-381.
26. TricheTJJr,WeisenbergerDJ,VanDenBergD,LairdPW,SiegmundKD. Low-level processing of Illumina Infinium DNA methylationbeadArrays.Nucleic Acids Res.2013;41(7):e90.
27. minfi:AnalyzeIlluminaInfiniumDNAmethylationarrays[computerprogram].Version1.32.02019.
28. KlemeraP,DoubalS.Anewapproachtotheconceptandcomputa-tion of biological age. Mech Ageing Dev.2006;127(3):240-248.
29. IBM SPSS Statistics for Windows. Statistics for Windows, Version 24.0 [computer program].Armonk,NY:IBMCorp;2016.
30. DaleckiM,WillitsFK.Examiningchangeusingregressionanalysis:Threeapproachescompared.Sociol Spectr.1991;11(2):127-145.
31. Gillespie DF, Streeter CL. Fitting regression-models to researchquestions for analyzing change in nonexperimental research.Soc Work Res.1994;18(4):239-245.
32. PawelecG,LarbiA,DerhovanessianE.Senescenceof thehumanimmune system. J Comp Pathol.2010;142(Suppl1):S39-S44.
33. Mor G, Cardenas I. The immune system in pregnancy: a uniquecomplexity.Am J Reprod Immunol.2010;63(6):425-433.
34. RossKM,MillerG, Culhane J, et al. Patterns of peripheral cyto-kineexpressionduringpregnancyintwocohortsandassociationswith inflammatory markers in cord blood. Am J Reprod Immunol. 2016;76(5):406-414.
35. ChristianLM,PorterK.Longitudinalchanges inserumproinflam-matory markers across pregnancy and postpartum: effects of ma-ternalbodymassindex.Cytokine.2014;70:134-140.
36. Grundy E, Tomassini C. Fertility history and health in laterlife: a record linkage study in England and Wales. Soc Sci Med. 2005;61(1):217-228.
37. JaffeDH,NeumarkYD,EisenbachZ,ManorO.Parity-relatedmor-tality: shape of association among middle-aged and elderly men and women. Eur J Epidemiol.2009;24(1):9-16.
38. ManorO,EisenbachZ,IsraeliA,FriedlanderY.Mortalitydifferen-tialsamongwomen:theIsraelLongitudinalMortalityStudy.Soc Sci Med.2000;51(8):1175-1188.
39. Kvale G, Heuch I, Nilssen S. Parity in relation to mortality andcancer incidence: a prospective study of Norwegian women. Int J Epidemiol.1994;23(4):691-699.
40. LundE.Numberofchildrenanddeath fromhormone-dependentcancers. Int J Cancer.1990;46(6):998-1000.
41. ShaoY,QiuJ,HuangH,etal.Pre-pregnancyBMI,gestationalweightgain and risk of preeclampsia: a birth cohort study in Lanzhou,China. BMC Pregnancy Childbirth.2017;17(1):400.
42. OlsonCM.Achievingahealthyweightgainduringpregnancy.Annu Rev Nutr.2008;28:411-423.
43. Hedderson MM, Gunderson EP, Ferrara A. Gestational weightgain and risk of gestational diabetes mellitus. Obstet Gynecol. 2010;115(3):597-604.
44. Endres LK, Straub H, McKinney C, et al. Postpartum weight re-tention risk factors and relationship to obesity at 1 year. Obstet Gynecol.2015;125(1):144-152.
How to cite this article:RossKM,CarrollJ,HorvathS,HobelCJ,Coussons-ReadME,DunkelSchetterC.Immuneepigenetic age in pregnancy and 1 year after birth: Associationswithweightchange.Am J Reprod Immunol. 2020;83:e13229. https://doi.org/10.1111/aji.13229