immigration in times of recession implications for policy pia orrenius, ph.d. federal reserve bank...
Post on 20-Dec-2015
221 views
TRANSCRIPT
Immigration in Times of RecessionImplications for Policy
Pia Orrenius, Ph.D.
Federal Reserve Bank of Dallas
Disclaimer: The views expressed herein are those of the presenter; they do not necessarily reflect the views of the Federal Reserve Bank of Dallas or the Federal Reserve System.
Immigration Reform in 2010César Chávez Institute, San Francisco State Univ.
Road Map
Effects of recession on Foreign-born workers Foreign-born population
Regional differences Foreign-born vs. U.S.-born workers
Boom and bust Lessons for the recovery
Immigration policy: ready for recovery?

Job losses: Taking a toll

Current job losses worst since 1945
-4
-3
-2
-1
0
1
2
3
4
5
1980 1982 1984 1986 1988 1990 1992 1994 1996 1998 2000 2002 2004 2006 2008
Dec/Dec % Change
U.S.
Source: Bureau of Labor Statistics

Employment declines broad based
-25
-20
-15
-10
-5
0
5
10
Nat. Resources and Mining
Financial Activities
Trade, Transp &
Util.
Mfg.Educ. & Health Services
Const. Leisure & Hosp.
Info.Prof &
Business Services
Govt. TotalOther
% Change
Note: Employment change from December 2007 to December 2009Source: Bureau of Labor Statistics

Immigrant unemployment rate rises above native rate
1994
1995
1996
1997
1998
1999
2000
2001
2002
2003
2004
2005
2006
2007
2008
2009
2%
3%
4%
5%
6%
7%
8%
9%
10%
Native
Immigrant
Source: Orrenius and Zavodny 2009; BLS

Foreign-born unemployment rates rise most for less-educated
Less Than High School
High School Some College College0
5
10
15
Q3 2007 Q2 2009Percent
Source: Orrenius and Zavodny 2009; BLS

Immigration: Slowing

The foreign-born population stagnates in 2008
Source: Census Bureau through 2008
0
5
10
15
20
25
30
35
40
45
1850 1870 1890 1910 1930 1950 1970 1990 20070
2
4
6
8
10
12
14
16Millions Percent
Number
2008

2000 2001 2002 2003 2004 2005 2006 2007 20087
8
9
10
11
12
13 DHS* Pew
Millions
Unauthorized immigrant population falling?
Note: *DHS estimates not available for 2001-2004.Source: Department of Homeland Security; Pew Hispanic Center

New border fence 20 ft high
Source: Wayne Cornelius (2009) “Evaluating US Immigration Control Policy”
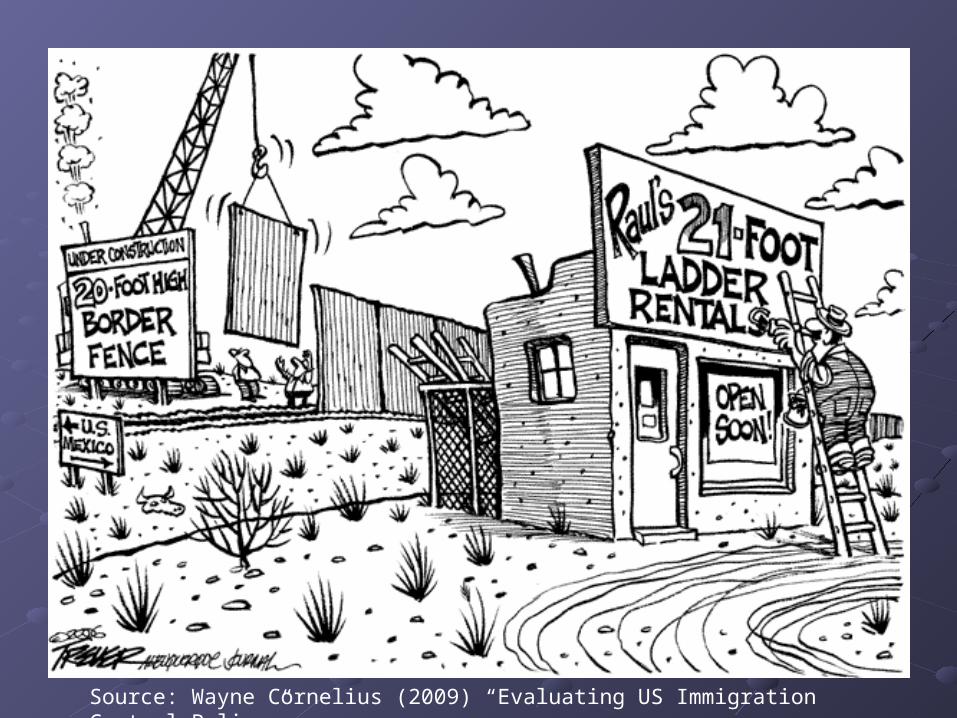
Source: Wayne Cornelius (2009) “Evaluating US Immigration Control Policy”

More border enforcement, more port-of-entry attempts

Q1 2006
Q2 2006
Q3 2006
Q4 2006
Q1 2007
Q2 2007
Q3 2007
Q4 2007
Q1 2008
Q2 2008
Q3 2008
Q4 2008
Q1 2009
Q2 2009
Q3 2009
100000
150000
200000
250000
300000
350000
400000
Thousands
Emigration from Mexico in steep decline
Source: INEGI 2009 (Mexican National Statistical and Geographical Institute)

Apprehensions a function of labor demand(De-trended employment; lagged apprehensions)
0
20
40
60
80
100
120
140
160
180
1991 1992 1993 1994 1995 1996 1997 1998 1999 2000 2001 2002 2003 2004 2005 2006 2007 2008 2009-2000
-1500
-1000
-500
0
500
1000
1500
2000
Apprehensions
EmploymentThousands, SA Thousands, SA
Source: BLS; DHS; Authors’ own calculations

Geographic differences: Immigrant/native outcomes differ by state
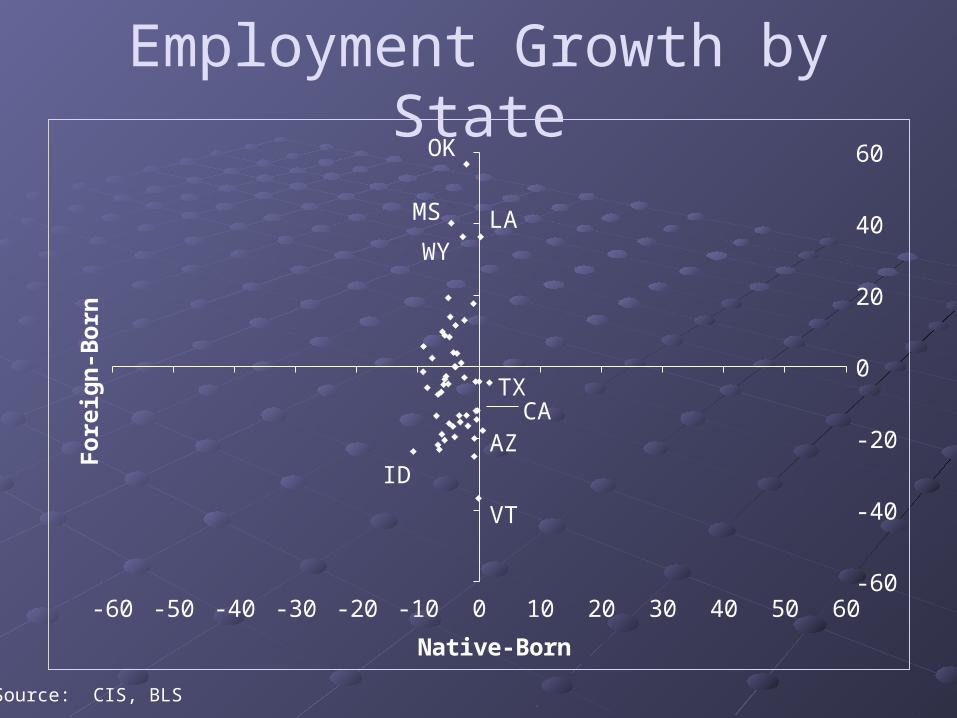
Employment Growth by State
Source: CIS, BLS
-60 -50 -40 -30 -20 -10 0 10 20 30 40 50 60-60
-40
-20
0
20
40
60
Native-Born
Fo
reig
n-B
orn
OK
LAWY
MS
ID
VT
TX
AZCA

Foreign-Born Populations Decline in Florida, California
(2008/2007 percent change)
U.S. California Florida New York Illinois Texas-2
-1.5
-1
-0.5
0
0.5
1
1.5
2
Percent
Source: Bureau of the Census

Boom and bust: Lessons for the recovery
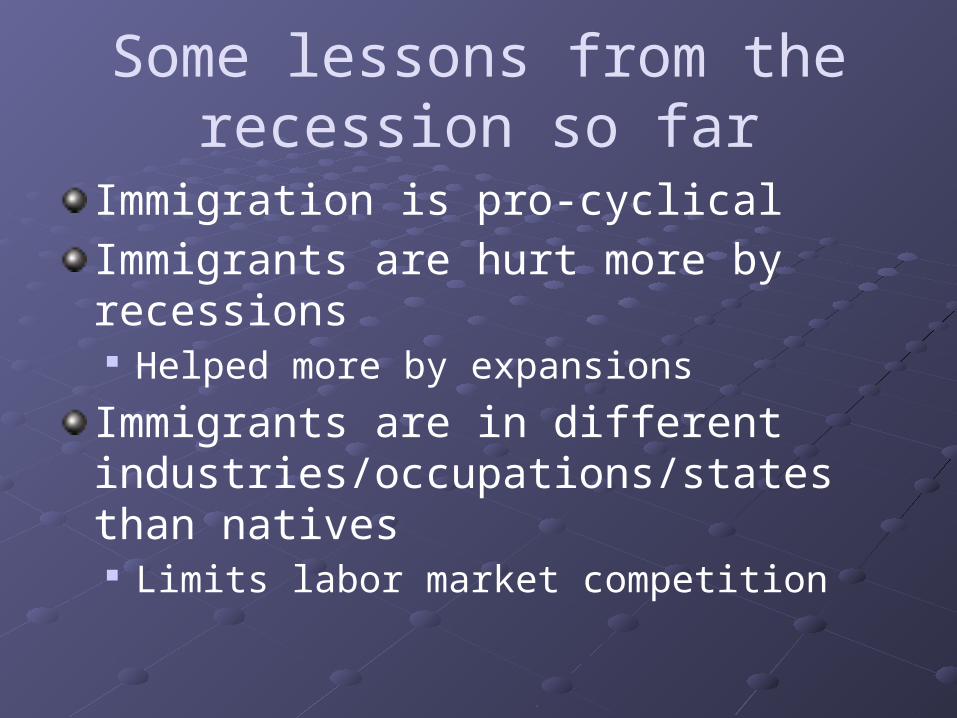
Some lessons from the recession so far
Immigration is pro-cyclical
Immigrants are hurt more by recessions Helped more by expansions
Immigrants are in different industries/occupations/states than natives Limits labor market competition
Immigrants key to the recovery
Labor force growth Immigrants account for one-half labor force
growth

U.S. labor force participation rate has peaked
19501951195219531954195519561957195819591960196119621963196419651966196719681969197019711972197319741975197619771978197919801981198219831984198519861987198819891990199119921993199419951996199719981999200020012002200320042005200620072008200956
58
60
62
64
66
68
Percent
Source: BLS

Labor force participation rate:Male, female rates falling since 2000
19501951195219531954195519561957195819591960196119621963196419651966196719681969197019711972197319741975197619771978197919801981198219831984198519861987198819891990199119921993199419951996199719981999200020012002200320042005200620072008200930
40
50
60
70
80
90
100
Percent
Men
Women
Source: BLS

Immigrants key to the recovery
Labor force growth Immigrants account for one-half labor force growth
Efficiency gains Complement native workers at high, low ends of skill distribution Fill jobs natives shun Move to where jobs are
Productivity growth High-skilled immigration instrumental in high-tech innovation,
R&D
Drawbacks Winners and losers Adverse fiscal impact of low-skilled immigration

Immigration Policy: Ready for recovery?

Green cards go to family, not work-based immigrants
Immediate family44%
Other family19%
Employment16%
Others2%
Refugees and asylees
15%
Diversity4%
Note: Data represent FY 2005-2008 averagesSource: DHS, 2008 Yearbook of Immigrant Statistics
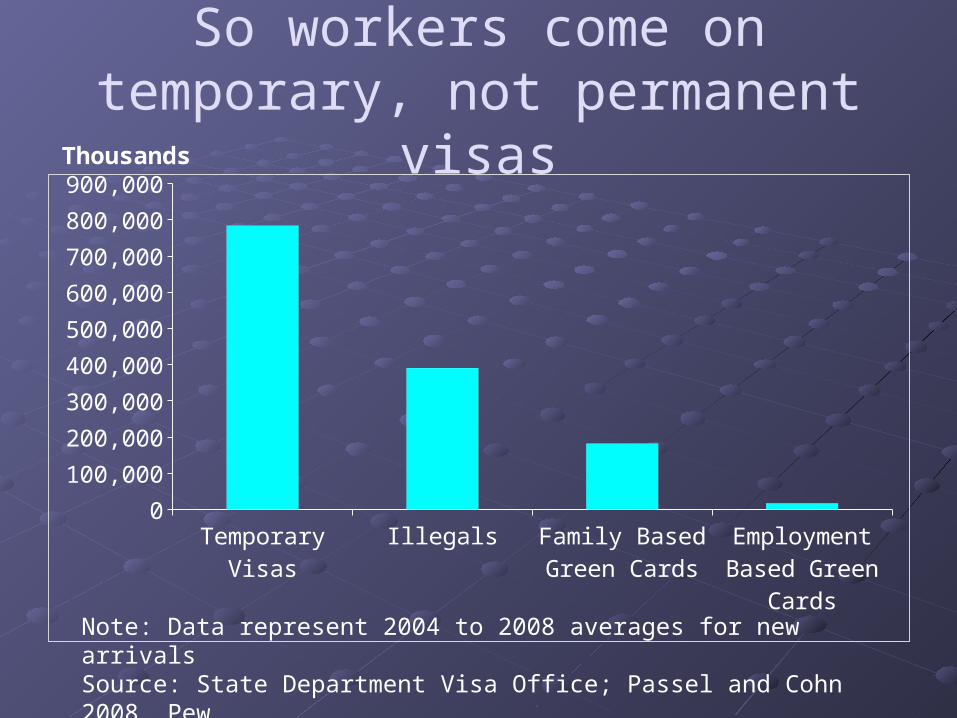
So workers come on temporary, not permanent visas
Temporary Visas
Illegals Family Based Green Cards
Employment Based Green
Cards
0
100,000
200,000
300,000
400,000
500,000
600,000
700,000
800,000
900,000
Note: Data represent 2004 to 2008 averages for new arrivalsSource: State Department Visa Office; Passel and Cohn 2008, Pew Hispanic Center; DHS Yearbook of Immigration Statistics
Thousands

Most skilled workers use temporary visas
0
50,000
100,000
150,000
200,000
250,000
300,000
350,000
400,000
450,000Employment Based (Skilled) H-1B and H-1B1 TN L1
Thousands
Note: Data from 1992 to 2008Source: Statistical Yearbook of the INS; DHS Yearbook of Immigration Statistics; Visa office of the State Department

Almost all legal low-skilled workers use temporary visas
1992
1993
1994
1995
1996
1997
1998
1999
2000
2001
2002
2003
2004
2005
2006
2007
2008
0
20,000
40,000
60,000
80,000
100,000
120,000
140,000
160,000
180,000
Unskilled Permanent H-2A H-2BThousands
Note: Data from 1992 to 2008Source: Statistical Yearbook of the INS; DHS Yearbook of Immigration Statistics; visa office of the State Department

0
200
400
600
800
1000
1200
1400
1600
Unauthorized Legal
Most low-skilled workers come illegally
Source: Jeffrey Passel and Roberto Suro, Pew Hispanic Center (2005); Passel and Cohn, Pew Hispanic Center (2008).

Absorbing temporary workers under current system is like
swallowing this fish…

Green card queues spell a decade-long wait in many cases
Source: State Department Visa Bulletin, March 2009; Wadhwa et al. 2007, Ewing Marion Kaufmann Foundation ; Authors’ own estimates
0
2
4
6
8
10
12
14
0
500
1,000
1,500
2,000
2,500
3,000
Employment Based Family Sponsored
Time
Visas
Thousands Years

Family-based green card queue for Mexicans 60 years?
Source: State Department Visa Bulletin, March 2009; Authors’ own estimates0
10
20
30
40
50
60
70
0
200
400
600
800
1,000
1,200
Time
Visas
Thousands Years

ConclusionImmigration is slowing due to the economyU.S. long-run growth will still depend on immigrantsPolicy environment is completely inadequate to deal w/ legal, illegal immigrationAmnesty alone is not enough; we need to address future flows


0
1000
2000
3000
4000
5000
6000
2002 2003 2004 2005 2006 2007 2008
Criminal Arrests
AdministrativeArrests
Worksite enforcement jumps
Source: DHS

Current policy environment in flux
Some Bush policies on hold No-match program, Real ID Act, worksite raids,
higher employer fines E-verify: immigration status verification
Obama policies: focus on labor regulations? Legalization?
Local, state ordinances reg. illegal immigrants; enforcement of federal law
Interminable queues for green cards; running out of temporary visas