imfp2006 - day 4 april 6, 2006 rick field – florida/cdf/cmspage 1 xxxiv international meeting on...
Post on 20-Dec-2015
215 views
TRANSCRIPT

IMFP2006 - Day 4 April 6, 2006
Rick Field – Florida/CDF/CMS Page 1
XXXIV International Meeting on XXXIV International Meeting on Fundamental PhysicsFundamental Physics
Rick FieldUniversity of Florida
(for the CDF & D0 Collaborations)
CDF Run 2
Real Colegio Maria Cristina, El Escorial, Spain
From HERA and the TEVATRON
to the LHC
Physics at the Tevatron
4th LectureDetailed Study of the “Underlying Event”
at the Tevatron

IMFP2006 - Day 4 April 6, 2006
Rick Field – Florida/CDF/CMS Page 2
The “Underlying Event” in Run 2 (CDF)The “Underlying Event” in Run 2 (CDF)
Two Classes of Events: “Leading Jet” and “Back-to-Back”. Two “Transverse” regions: “transMAX”, “transMIN”, “transDIF”. PTmax and PTmaxT distributions and averages. Distributions: “Density” and “Associated Density”. <pT> versus charged multiplicity: “min-bias” and the “transverse” region.
Correlations between the two “transverse” regions: “trans1” vs “trans2”.
Proton AntiProton
PT(hard)
Outgoing Parton
Outgoing Parton
Underlying Event Underlying Event
Initial-State Radiation
Final-State Radiation
The “underlying event” consists of hard initial & final-state radiation
plus the “beam-beam remnants” and possible multiple parton interactions.
Studying the “Underlying Event”
Studying the “Underlying Event” in Drell-Yan Production.
Extrapolations to the LHC.Extrapolations to the LHC.
Proton AntiProton
Drell-Yan Production Lepton
Underlying Event Underlying Event
Initial-State Radiation
Anti-Lepton CMS at the LHC
UE&MB@CMSUE&MB@CMS
Florida-Perugia

IMFP2006 - Day 4 April 6, 2006
Rick Field – Florida/CDF/CMS Page 3
Jet #1 Direction
“Transverse” “Transverse”
“Toward”
“Away”
“Toward-Side” Jet
“Away-Side” Jet
The “Transverse” RegionsThe “Transverse” Regionsas defined by the Leading Jetas defined by the Leading Jet
Look at charged particle correlations in the azimuthal angle relative to the leading calorimeter jet (JetClu R = 0.7, || < 2).
Define || < 60o as “Toward”, 60o < - < 120o and 60o < < 120o as “Transverse 1” and “Transverse 2”, and || > 120o as “Away”. Each of the two “transverse” regions have area = 2x60o = 4/6. The overall “transverse” region is the sum of the two transverse regions ( = 2x120o = 4/3).
Charged Particle Correlations pT > 0.5 GeV/c || < 1
“Transverse” region is very sensitive to the “underlying event”!
Jet #1 Direction
“Toward”
“Trans 1” “Trans 2”
“Away”
-1 +1
2
0
Leading Jet
Toward Region
Transverse Region 1
Transverse Region 2
Away Region
Away Region
Look at the charged particle density in the “transverse” region!
IMFP2006 - Day 4 April 6, 2006
Rick Field – Florida/CDF/CMS Page 4
-1 +1
2
0
1 charged particle
dNchg/dd = 1/4 = 0.08
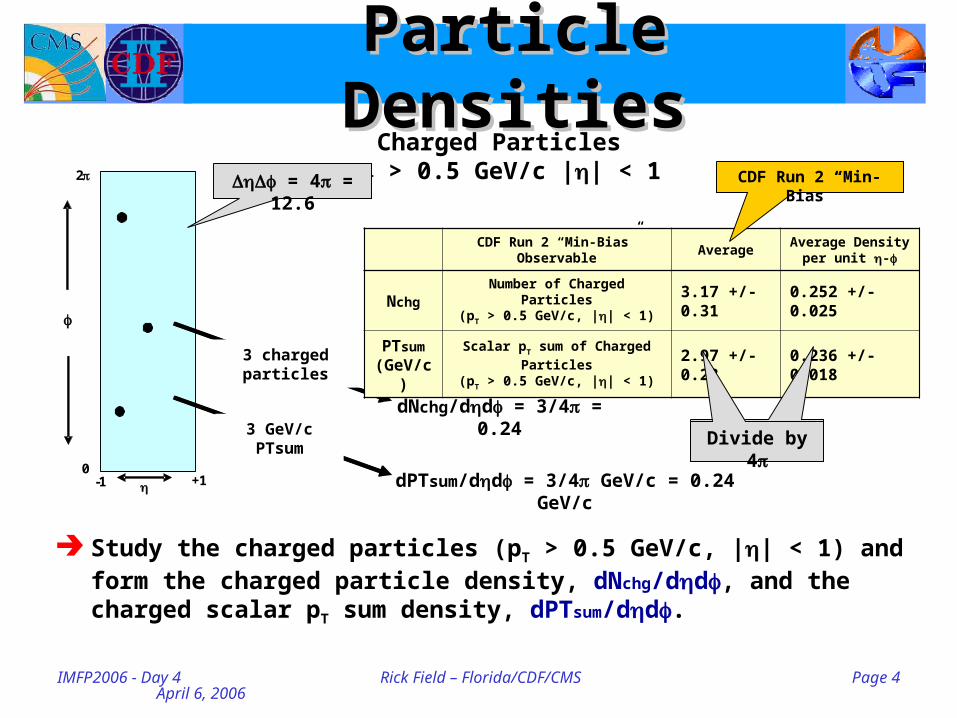
Particle DensitiesParticle Densities
Study the charged particles (pT > 0.5 GeV/c, || < 1) and form the charged particle density, dNchg/dd, and the charged scalar pT sum density, dPTsum/dd.
Charged Particles pT > 0.5 GeV/c || < 1 = 4 = 12.6
1 GeV/c PTsum
dPTsum/dd = 1/4 GeV/c = 0.08 GeV/c
dNchg/dd = 3/4 = 0.24
3 charged particles
dPTsum/dd = 3/4 GeV/c = 0.24 GeV/c
3 GeV/c PTsum
CDF Run 2 “Min-Bias”Observable
AverageAverage Density
per unit -
NchgNumber of Charged Particles
(pT > 0.5 GeV/c, || < 1) 3.17 +/- 0.31 0.252 +/- 0.025
PTsum
(GeV/c)Scalar pT sum of Charged Particles
(pT > 0.5 GeV/c, || < 1) 2.97 +/- 0.23 0.236 +/- 0.018
Divide by 4
CDF Run 2 “Min-Bias”

IMFP2006 - Day 4 April 6, 2006
Rick Field – Florida/CDF/CMS Page 5
-1 +1
2
0
Leading Jet
Toward Region
Transverse Region 1
Transverse Region 2
Away Region
Away Region
““Transverse” Particle DensitiesTransverse” Particle Densities
Study the charged particles (pT > 0.5 GeV/c, || < 1) in the “Transverse 1” and “Transverse 2” and form the charged particle density, dNchg/dd, and the charged scalar pT sum density, dPTsum/dd.
Charged Particles pT > 0.5 GeV/c || < 1
1 charged particle in the “transverse 2” region
dNchg/dd = 1/(4 = 0.48
Jet #1 Direction
“Toward”
“Trans 1” “Trans 2”
“Away”
Area = 4/6
The average “transverse” density is the average of “transverse 1” and “transverse 2”.
AVE “transverse”(Trans 1 + Trans 2)/2

IMFP2006 - Day 4 April 6, 2006
Rick Field – Florida/CDF/CMS Page 6
Charged Particle Density Charged Particle Density Dependence Dependence
Shows the dependence of the charged particle density, dNchg/dd, for charged particles in the range pT > 0.5 GeV/c and || < 1 relative to jet#1 (rotated to 270o) for “leading jet” events 30 < ET(jet#1) < 70 GeV.
Also shows charged particle density, dNchg/dd, for charged particles in the range pT > 0.5 GeV/c and || < 1 for “min-bias” collisions.
Leading Jet
Charged Particle Density: dN/dd
0.1
1.0
10.0
0 30 60 90 120 150 180 210 240 270 300 330 360
(degrees)
Ch
arg
ed
Pa
rtic
le D
en
sit
y
CDF Preliminarydata uncorrected
Charged Particles (||<1.0, PT>0.5 GeV/c)
30 < ET(jet#1) < 70 GeV
"Transverse" Region
Jet#1
Jet #1 Direction
“Transverse” “Transverse”
“Toward”
“Away”
“Toward-Side” Jet
“Away-Side” Jet
Jet #1 Direction
“Transverse” “Transverse”
“Toward”
“Away”
“Toward-Side” Jet
“Away-Side” Jet
Jet #3
Min-Bias0.25 per unit -
Log Scale!
IMFP2006 - Day 4 April 6, 2006
Rick Field – Florida/CDF/CMS Page 7
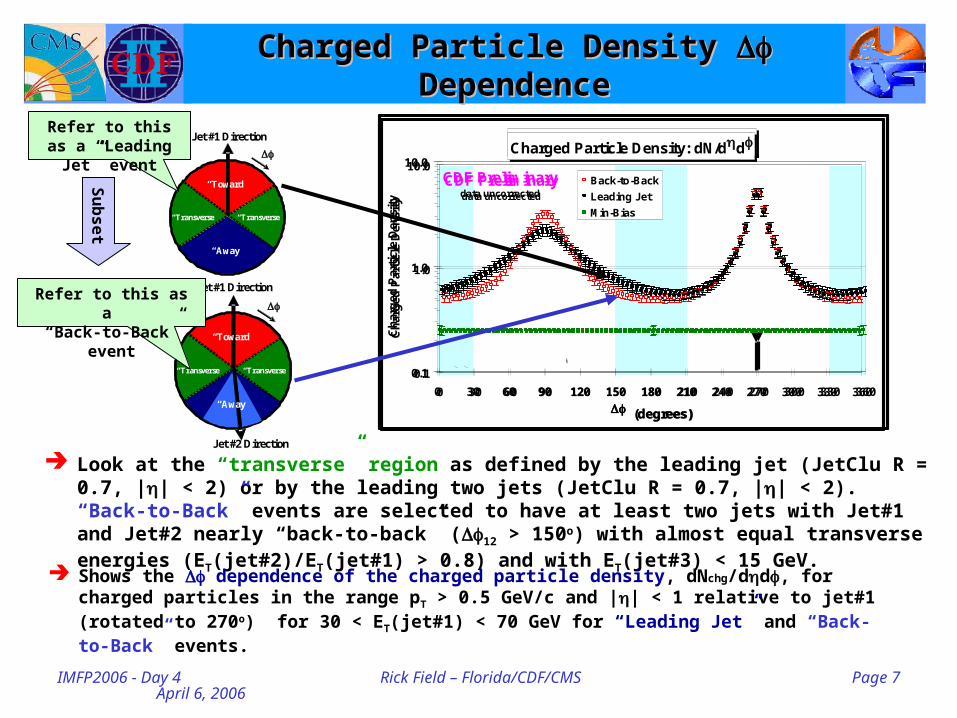
Charged Particle Density Charged Particle Density Dependence Dependence
Look at the “transverse” region as defined by the leading jet (JetClu R = 0.7, || < 2) or by the leading two jets (JetClu R = 0.7, || < 2). “Back-to-Back” events are selected to have at least two jets with Jet#1 and Jet#2 nearly “back-to-back” (12 > 150o) with almost equal transverse energies (ET(jet#2)/ET(jet#1) > 0.8) and with ET(jet#3) < 15 GeV.
Charged Particle Density: dN/dd
0.1
1.0
10.0
0 30 60 90 120 150 180 210 240 270 300 330 360
(degrees)
Ch
arg
ed
Pa
rtic
le D
en
sit
y
CDF Preliminarydata uncorrected
Charged Particles (||<1.0, PT>0.5 GeV/c)
30 < ET(jet#1) < 70 GeV
"Transverse" Region
Jet#1
Jet #1 Direction
“Toward”
“Transverse” “Transverse”
“Away”
Jet #1 Direction
“Toward”
“Transverse” “Transverse”
“Away”
Jet #2 Direction
Shows the dependence of the charged particle density, dNchg/dd, for charged particles in the range pT > 0.5 GeV/c and || < 1 relative to jet#1 (rotated to 270o) for 30 < ET(jet#1) < 70 GeV for “Leading Jet” and “Back-to-Back” events.
Charged Particle Density: dN/dd
0.1
1.0
10.0
0 30 60 90 120 150 180 210 240 270 300 330 360
(degrees)
Ch
arg
ed
Pa
rtic
le D
en
sit
y
Back-to-Back
Leading Jet
Min-Bias
CDF Preliminarydata uncorrected
Charged Particles (||<1.0, PT>0.5 GeV/c)
30 < ET(jet#1) < 70 GeV
"Transverse" Region
Jet#1
Refer to this as a “Leading Jet” event
Refer to this as a “Back-to-Back” event
Su
bset
IMFP2006 - Day 4 April 6, 2006
Rick Field – Florida/CDF/CMS Page 8
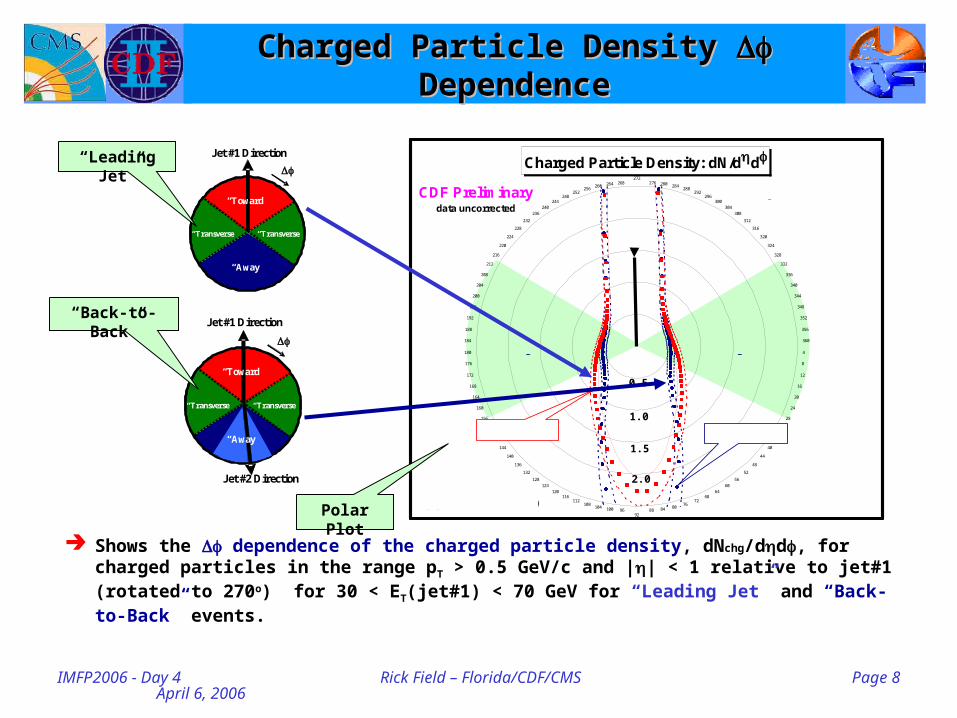
Charged Particle Density Charged Particle Density Dependence Dependence
Jet #1 Direction
“Toward”
“Transverse” “Transverse”
“Away”
Jet #1 Direction
“Toward”
“Transverse” “Transverse”
“Away”
Jet #2 Direction
Shows the dependence of the charged particle density, dNchg/dd, for charged particles in the range pT > 0.5 GeV/c and || < 1 relative to jet#1 (rotated to 270o) for 30 < ET(jet#1) < 70 GeV for “Leading Jet” and “Back-to-Back” events.
“Leading Jet”
“Back-to-Back”
Charged Particle Density: dN/dd272
276 280 284288
292296
300304
308
312
316
320
324
328
332
336
340
344
348
352
356
360
4
8
12
16
20
24
28
32
36
40
44
48
52
56
6064
6872
76808488
9296100104
108112
116120
124
128
132
136
140
144
148
152
156
160
164
168
172
176
180
184
188
192
196
200
204
208
212
216
220
224
228
232
236
240244
248252
256260 264 268
CDF Preliminarydata uncorrected
30 < ET(jet#1) < 70 GeV
Charged Particles (||<1.0, PT>0.5 GeV/c)
"Transverse" Region
"Transverse" Region
Jet#1
Back-to-BackLeading Jet
0.5
1.0
1.5
2.0
Polar Plot

IMFP2006 - Day 4 April 6, 2006
Rick Field – Florida/CDF/CMS Page 9
““Transverse” PTsum Density versus ETransverse” PTsum Density versus ETT(jet#1)(jet#1)
Jet #1 Direction
“Toward”
“Transverse” “Transverse”
“Away”
Jet #1 Direction
“Toward”
“Transverse” “Transverse”
“Away”
Jet #2 Direction
Shows the average charged PTsum density, dPTsum/dd, in the “transverse” region (pT > 0.5 GeV/c, || < 1) versus ET(jet#1) for “Leading Jet” and “Back-to-Back” events.
“Leading Jet”
“Back-to-Back”
"AVE Transverse" PTsum Density: dPT/dd
0.0
0.2
0.4
0.6
0.8
1.0
1.2
1.4
0 50 100 150 200 250
ET(jet#1) (GeV)
"Tra
nsv
erse
" P
Tsu
m D
ensi
ty (
GeV
/c)
CDF Run 2 Preliminarydata uncorrected
Charged Particles (||<1.0, PT>0.5 GeV/c)
Back-to-Back
Leading Jet
1.96 TeV
Min-Bias0.24 GeV/c per unit -
"AVE Transverse" PTsum Density: dPT/dd
0.0
0.2
0.4
0.6
0.8
1.0
1.2
1.4
0 50 100 150 200 250
ET(jet#1) (GeV)
"Tra
nsv
erse
" P
Tsu
m D
ensi
ty (
GeV
/c)
CDF Preliminarydata uncorrectedtheory + CDFSIM
Charged Particles (||<1.0, PT>0.5 GeV/c)
Back-to-Back
Leading Jet
PY Tune A
HW
1.96 TeV
Compares the (uncorrected) data with PYTHIA Tune A and HERWIG after CDFSIM.
Hard Radiation!

IMFP2006 - Day 4 April 6, 2006
Rick Field – Florida/CDF/CMS Page 10
““Transverse” PTsum Density versus ETransverse” PTsum Density versus ETT(jet#1)(jet#1)
Jet #1 Direction
“Toward”
“Transverse” “Transverse”
“Away”
Jet #1 Direction
“Toward”
“Transverse” “Transverse”
“Away”
Jet #2 Direction
30-70 GeV 95-130 GeV
"AVE Transverse" PTsum Density: dPT/dd
0.0
0.2
0.4
0.6
0.8
1.0
1.2
1.4
0 50 100 150 200 250
ET(jet#1) (GeV)
"Tra
nsv
erse
" P
Tsu
m D
ensi
ty (
GeV
/c)
CDF Run 2 Preliminarydata uncorrected
Charged Particles (||<1.0, PT>0.5 GeV/c)
Back-to-Back
Leading Jet
1.96 TeV
Charged PTsum Density: dPT/dd
0.1
1.0
10.0
100.0
0 30 60 90 120 150 180 210 240 270 300 330 360
(degrees)
Ch
arg
ed
PT
su
m D
en
sit
y (
Ge
V/c
) 95 < ET(jet#1) < 130 GeV
30 < ET(jet#1) < 70 GeV
Min-Bias
Leading Jet
Charged Particles (||<1.0, PT>0.5 GeV/c)
CDF Preliminarydata uncorrected
Jet#1
"Transverse" Region
Charged PTsum Density: dPT/dd
0.1
1.0
10.0
100.0
0 30 60 90 120 150 180 210 240 270 300 330 360
(degrees)
Ch
arg
ed
PT
su
m D
en
sit
y (
Ge
V/c
) 95 < ET(jet#1) < 130 GeV
30 < ET(jet#1) < 70 GeV
Min-Bias
Back-to-Back
Charged Particles (||<1.0, PT>0.5 GeV/c)
CDF Preliminarydata uncorrected
Jet#1
"Transverse" Region
Very little dependence on ET(jet#1) in the “transverse”
region for “back-to-back” events!

IMFP2006 - Day 4 April 6, 2006
Rick Field – Florida/CDF/CMS Page 11
““TransDIF” PTsum Density versus ETransDIF” PTsum Density versus ETT(jet#1)(jet#1)
Use the leading jet to define the MAX and MIN “transverse” regions on an event-by-event basis with MAX (MIN) having the largest (smallest) charged PTsum density.
Jet #1 Direction
“Toward”
“TransMAX” “TransMIN”
“Away”
Jet #1 Direction
“Toward”
“TransMAX” “TransMIN”
Jet #2 Direction
“Away”
Shows the “transDIF” = MAX-MIN charge PTsum density, dPTsum/dd, for pT > 0.5 GeV/c, || < 1 versus ET(jet#1) for “Leading Jet” and “Back-to-Back” events.
Jet #1 Direction
“Toward”
“TransMAX” “TransMIN”
“Away”
“Leading Jet”
“Back-to-Back”
"MAX-MIN Transverse" PTsum Density: dPT/dd
0.0
0.5
1.0
1.5
2.0
0 50 100 150 200 250
ET(jet#1) (GeV)
"Tra
nsv
erse
" P
Tsu
m D
ensi
ty (
GeV
/c)
CDF Run 2 Preliminarydata uncorrectedtheory + CDFSIM
1.96 TeV Charged Particles (||<1.0, PT>0.5 GeV/c)
Back-to-Back
LeadingJet
"MAX-MIN Transverse" PTsum Density: dPT/dd
0.0
0.5
1.0
1.5
2.0
0 50 100 150 200 250
ET(jet#1) (GeV)
"Tra
nsv
erse
" P
Tsu
m D
ensi
ty (
GeV
/c) CDF Run 2 Preliminary
data uncorrectedtheory + CDFSIM
1.96 TeV Charged Particles (||<1.0, PT>0.5 GeV/c)
PY Tune A
HW
Back-to-Back
LeadingJet
“MAX-MIN” is very sensitive to the “hard scattering” component
of the “underlying event”!
Hard Radiation!
IMFP2006 - Day 4 April 6, 2006
Rick Field – Florida/CDF/CMS Page 12
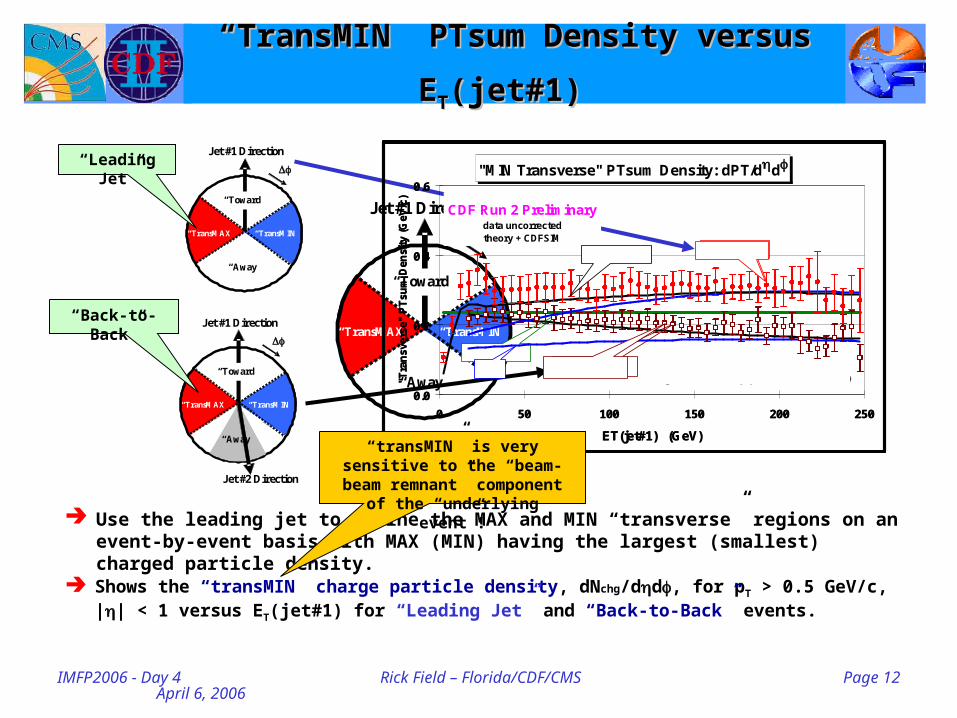
““TransMIN” PTsum Density versus ETransMIN” PTsum Density versus ETT(jet#1)(jet#1)
Use the leading jet to define the MAX and MIN “transverse” regions on an event-by-event basis with MAX (MIN) having the largest (smallest) charged particle density.
Jet #1 Direction
“Toward”
“TransMAX” “TransMIN”
“Away”
Jet #1 Direction
“Toward”
“TransMAX” “TransMIN”
Jet #2 Direction
“Away”
Shows the “transMIN” charge particle density, dNchg/dd, for pT > 0.5 GeV/c, || < 1 versus ET(jet#1) for “Leading Jet” and “Back-to-Back” events.
Jet #1 Direction
“Toward”
“TransMAX” “TransMIN”
“Away”
“Leading Jet”
“Back-to-Back”
"MIN Transverse" PTsum Density: dPT/dd
0.0
0.2
0.4
0.6
0 50 100 150 200 250
ET(jet#1) (GeV)
"Tra
nsv
erse
" P
Tsu
m D
ensi
ty (
GeV
/c)
CDF Run 2 Preliminarydata uncorrectedtheory + CDFSIM
1.96 TeV
Charged Particles (||<1.0, PT>0.5 GeV/c)
Min-BiasBack-to-Back
Leading Jet
"MIN Transverse" PTsum Density: dPT/dd
0.0
0.2
0.4
0.6
0 50 100 150 200 250
ET(jet#1) (GeV)
"Tra
nsv
erse
" P
Tsu
m D
ensi
ty (
GeV
/c)
CDF Run 2 Preliminarydata uncorrectedtheory + CDFSIM
1.96 TeV
Charged Particles (||<1.0, PT>0.5 GeV/c)
PY Tune A
HW Back-to-Back
Leading Jet
“transMIN” is very sensitive to the “beam-beam remnant” component
of the “underlying event”!

IMFP2006 - Day 4 April 6, 2006
Rick Field – Florida/CDF/CMS Page 13
““Transverse” PTsum DensityTransverse” PTsum Density PYTHIA Tune A vs HERWIG PYTHIA Tune A vs HERWIG
Jet #1 Direction
“Toward”
“Transverse” “Transverse”
“Away”
Jet #1 Direction
“Toward”
“Transverse” “Transverse”
“Away”
Jet #2 Direction
Shows the average charged PTsum density, dPTsum/dd, in the “transverse” region (pT > 0.5 GeV/c, || < 1) versus ET(jet#1) for “Leading Jet” and “Back-to-Back” events.
Compares the (uncorrected) data with PYTHIA Tune A and HERWIG after CDFSIM.
“Leading Jet”
“Back-to-Back”
"AVE Transverse" PTsum Density: dPT/dd
0.0
0.2
0.4
0.6
0.8
1.0
1.2
1.4
0 50 100 150 200 250
ET(jet#1) (GeV)
"Tra
nsv
erse
" P
Tsu
m D
ensi
ty (
GeV
/c)
CDF Preliminarydata uncorrectedtheory + CDFSIM
Charged Particles (||<1.0, PT>0.5 GeV/c)
Back-to-Back
Leading Jet
PY Tune A
HW
1.96 TeV
Now look in detail at “back-to-back” events in the region 30 < ET(jet#1) < 70 GeV!

IMFP2006 - Day 4 April 6, 2006
Rick Field – Florida/CDF/CMS Page 14
Charged PTsum DensityCharged PTsum DensityPYTHIA Tune A vs HERWIGPYTHIA Tune A vs HERWIG
Charged PTsum Density: dPT/dd
0.1
1.0
10.0
100.0
0 30 60 90 120 150 180 210 240 270 300 330 360
(degrees)
Ch
arg
ed
PT
su
m D
en
sit
y (
Ge
V/c
) Back-to-Back
PY Tune A30 < ET(jet#1) < 70 GeVCharged Particles
(||<1.0, PT>0.5 GeV/c)
CDF Preliminarydata uncorrectedtheory + CDFSIM
Jet#1"Transverse" Region
Charged PTsum Density: dPT/dd
0.1
1.0
10.0
100.0
0 30 60 90 120 150 180 210 240 270 300 330 360
(degrees)
Ch
arg
ed
PT
su
m D
en
sit
y (
Ge
V/c
) Back-to-Back
HERWIG30 < ET(jet#1) < 70 GeVCharged Particles
(||<1.0, PT>0.5 GeV/c)
CDF Preliminarydata uncorrectedtheory + CDFSIM
Jet#1
"Transverse" Region
Data - Theory: Charged PTsum Density dPT/dd
-2
-1
0
1
2
0 30 60 90 120 150 180 210 240 270 300 330 360
(degrees)
Da
ta -
Th
eo
ry
(Ge
V/c
)
CDF Preliminarydata uncorrectedtheory + CDFSIM
Charged Particles (||<1.0, PT>0.5 GeV/c)
Back-to-Back30 < ET(jet#1) < 70 GeV
PYTHIA Tune A
Jet#1
"Transverse" Region
Data - Theory: Charged PTsum Density dPT/dd
-2
-1
0
1
2
0 30 60 90 120 150 180 210 240 270 300 330 360
(degrees)
Da
ta -
Th
eo
ry
(Ge
V/c
)
CDF Preliminarydata uncorrectedtheory + CDFSIM
Charged Particles (||<1.0, PT>0.5 GeV/c)
30 < ET(jet#1) < 70 GeVBack-to-Back
HERWIG
Jet#1
"Transverse" Region
HERWIG (without multiple parton interactions) does not produces
enough PTsum in the “transverse” region for 30 < ET(jet#1) < 70 GeV!

IMFP2006 - Day 4 April 6, 2006
Rick Field – Florida/CDF/CMS Page 18
Min-Bias “Associated”Min-Bias “Associated”Charged Particle DensityCharged Particle Density
Use the maximum pT charged particle in the event, PTmax, to define a direction and look at the the “associated” density, dNchg/dd, in “min-bias” collisions (pT > 0.5 GeV/c, || < 1).
PTmax Direction
Correlations in
Charged Particle Density: dN/dd
0.0
0.1
0.2
0.3
0.4
0.5
0 30 60 90 120 150 180 210 240 270 300 330 360
(degrees)
Ch
arg
ed
Pa
rtic
le D
en
sit
y
PTmax
Associated DensityPTmax not included
CDF Preliminarydata uncorrected
Charged Particles (||<1.0, PT>0.5 GeV/c)
Charge Density
Min-Bias
“Associated” densities do not include PTmax!
Highest pT charged particle!
PTmax Direction
Correlations in
Shows the data on the dependence of the “associated” charged particle density, dNchg/dd, for charged particles (pT > 0.5 GeV/c, || < 1, not including PTmax) relative to PTmax (rotated to 180o) for “min-bias” events. Also shown is the average charged particle density, dNchg/dd, for “min-bias” events.
It is more probable to find a particle accompanying PTmax than it is to
find a particle in the central region!

IMFP2006 - Day 4 April 6, 2006
Rick Field – Florida/CDF/CMS Page 19
Min-Bias “Associated”Min-Bias “Associated”Charged Particle DensityCharged Particle Density
Associated Particle Density: dN/dd
0.0
0.2
0.4
0.6
0.8
1.0
0 30 60 90 120 150 180 210 240 270 300 330 360
(degrees)
As
so
cia
ted
Pa
rtic
le D
en
sit
y
PTmax > 2.0 GeV/c
PTmax > 1.0 GeV/c
PTmax > 0.5 GeV/c
CDF Preliminarydata uncorrected
PTmaxPTmax not included
Charged Particles (||<1.0, PT>0.5 GeV/c)
Min-Bias
PTmax Direction
Correlations in
Shows the data on the dependence of the “associated” charged particle density, dNchg/dd, for charged particles (pT > 0.5 GeV/c, || < 1, not including PTmax) relative to PTmax (rotated to 180o) for “min-bias” events with PTmax > 0.5, 1.0, and 2.0 GeV/c.
Transverse Region
Transverse Region
Jet #1
Shows “jet structure” in “min-bias” collisions (i.e. the “birth” of the leading two jets!).
Jet #2
Ave Min-Bias0.25 per unit -
PTmax Direction
“Toward”
“Transverse” “Transverse”
“Away”
PTmax > 0.5 GeV/c
PTmax > 2.0 GeV/c
Rapid rise in the particle density in the “transverse” region as PTmax increases!

IMFP2006 - Day 4 April 6, 2006
Rick Field – Florida/CDF/CMS Page 20
““Transverse” PTmax versus ETransverse” PTmax versus ETT(jet#1)(jet#1)
Shows the average PTmaxT, in the “transverse” region (pT > 0.5 GeV/c, || < 1) versus ET(jet#1) for “Leading Jet” and “Back-to-Back” events compared with the average maximum pT particle, PTmax, in “min-bias” collisions (pT > 0.5 GeV/c, || < 1).
“Leading Jet”
“Back-to-Back”
"Transverse" Charged PTmax
0.0
0.5
1.0
1.5
2.0
2.5
3.0
0 50 100 150 200 250
ET(jet#1) (GeV)
"Tra
ns
ve
rse
" P
Tm
ax
(G
eV
/c) CDF Run 2 Preliminary
data uncorrected1.96 TeV
Charged Particles (||<1.0, PT>0.5 GeV/c)
Min-Bias
Leading Jet
Back-to-Back
Use the leading jet to define the “transverse” region and look at the maximum pT charged particle in the “transverse” region, PTmaxT.
Jet #1 Direction
“Toward”
“TransMIN”
“Away”
“TransMAX”
PTmaxT
Jet #1 Direction
“Toward”
“TransMIN” “TransMAX”
PTmaxT
Jet #2 Direction
“Away”
Jet #1 Direction
“Toward”
“TransMIN”
“Away”
“TransMAX”
PTmaxT
Highest pT particle in the “transverse” region!
Min-Bias

IMFP2006 - Day 4 April 6, 2006
Rick Field – Florida/CDF/CMS Page 21
Back-to-Back “Associated”Back-to-Back “Associated”Charged Particle DensitiesCharged Particle Densities
Use the leading jet in “back-to-back” events to define the “transverse” region and look at the maximum pT charged particle in the “transverse” region, PTmaxT.
“Associated” densities do not include PTmaxT!
Jet #1 Direction
“Toward”
“TransMIN” “TransMAX”
PTmaxT
Jet #2 Direction
“Away”
Jet#1 Region
PTmaxT Direction
Jet#2 Region
PTmaxT Direction
Jet#1 Region
Jet#2 Region
Look at the dependence of the “associated” charged particle and PTsum densities, dNchg/dd and dPTsum/dd for charged particles (pT > 0.5 GeV/c, || < 1, not including PTmaxT) relative to PTmaxT.
Rotate so that PTmaxT is at the center of the plot (i.e. 180o).
Maximum pT particle in the “transverse” region!

IMFP2006 - Day 4 April 6, 2006
Rick Field – Florida/CDF/CMS Page 22
Back-to-Back “Associated”Back-to-Back “Associated”Charged Particle DensitiesCharged Particle Densities
PTmaxT Direction
Jet#1 Region
Jet#2 Region
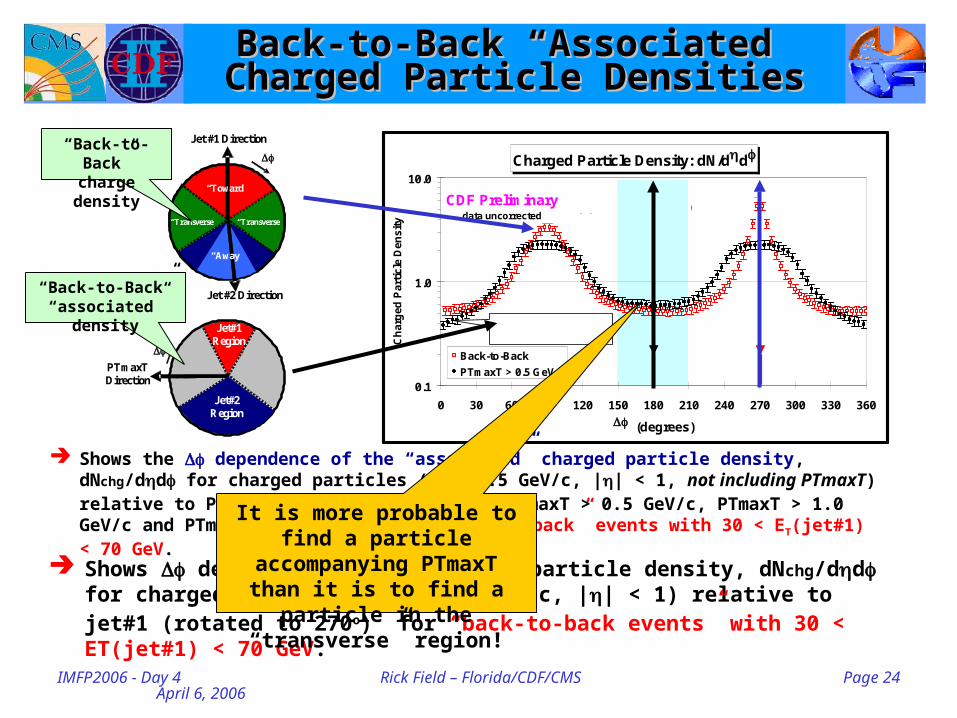
Look at the dependence of the “associated” charged particle density, dNchg/dd for charged particles (pT > 0.5 GeV/c, || < 1, not including PTmaxT) relative to PTmaxT (rotated to 180o) for PTmaxT > 0.5 GeV/c, PTmaxT > 1.0 GeV/c and PTmaxT > 2.0 GeV/c, for “back-to-back” events with 30 < ET(jet#1) < 70 GeV.
Shows “jet structure” in the “transverse” region (i.e. the “birth” of the 3rd & 4th jet).
Associated Particle Density: dN/dd
0.1
1.0
10.0
0 30 60 90 120 150 180 210 240 270 300 330 360
(degrees)A
ss
oc
iate
d P
art
icle
De
ns
ity
PTmaxT > 2.0 GeV/c
PTmaxT > 1.0 GeV/c
PTmaxT > 0.5 GeV/c
CDF Preliminarydata uncorrected
PTmaxT
Back-to-Back30 < ET(jet#1) < 70 GeV
Charged Particles (||<1.0, PT>0.5 GeV/c)
PTmaxT not included
"Jet#1" Region
Jet#2 Region
Jet #1
Jet #2
Jet #4
“Associated” densities do not include PTmaxT!
Jet #3
Log Scale!
??
IMFP2006 - Day 4 April 6, 2006
Rick Field – Florida/CDF/CMS Page 24
Back-to-Back “Associated”Back-to-Back “Associated”Charged Particle DensitiesCharged Particle Densities
Jet#1 Region
PTmaxT Direction
Jet#2 Region
Charged Particle Density: dN/dd
0.1
1.0
10.0
0 30 60 90 120 150 180 210 240 270 300 330 360
(degrees)
Ch
arg
ed P
arti
cle
Den
sity
Back-to-Back
PTmaxT > 0.5 GeV/c
CDF Preliminarydata uncorrected
30 < ET(jet#1) < 70 GeVCharged Particles (||<1.0, PT>0.5 GeV/c)
"Transverse" Region
PTmaxT Jet#1
Associated DensityPTmaxT not included
Shows the dependence of the “associated” charged particle density, dNchg/dd for charged particles (pT > 0.5 GeV/c, || < 1, not including PTmaxT) relative to PTmaxT (rotated to 180o) for PTmaxT > 0.5 GeV/c, PTmaxT > 1.0 GeV/c and PTmaxT > 2.0 GeV/c, for “back-to-back” events with 30 < ET(jet#1) < 70 GeV.
Shows dependence of the charged particle density, dNchg/dd for charged particles (pT > 0.5 GeV/c, || < 1) relative to jet#1 (rotated to 270o) for “back-to-back events” with 30 < ET(jet#1) < 70 GeV.
Jet #1 Direction
“Toward”
“Transverse” “Transverse”
“Away”
Jet #2 Direction
It is more probable to find a particle accompanying PTmaxT than it is to find a particle in the
“transverse” region!
“Back-to-Back”“associated” density
“Back-to-Back”charge density

IMFP2006 - Day 4 April 6, 2006
Rick Field – Florida/CDF/CMS Page 25
Back-to-Back “Associated”Back-to-Back “Associated”Charged Particle DensitiesCharged Particle Densities
Jet#1 Region
PTmaxT Direction
Jet#2 Region
Shows the dependence of the “associated” charged particle density, dNchg/dd, pT > 0.5 GeV/c, || < 1 (not including PTmaxT) relative to PTmaxT (rotated to 180o) and the charged particle density, dNchg/dd, pT > 0.5 GeV/c, || < 1 relative to jet#1 (rotated to 270o) for “back-to-back events” with 30 < ET(jet#1) < 70 GeV.
Jet #1 Direction
“Toward”
“Transverse” “Transverse”
“Away”
Jet #2 Direction
Charged Particle Density: dN/dd2
6 1014
1822
26
30
34
38
42
46
50
54
58
62
66
70
74
78
82
86
90
94
98
102
106
110
114
118
122
126
130
134
138
142
146
150
154
158162
166170
174178182
186190194
198202
206
210
214
218
222
226
230
234
238
242
246
250
254
258
262
266
270
274
278
282
286
290
294
298
302
306
310
314
318
322
326
330
334
338342
346350
354 358
CDF Preliminarydata uncorrected
30 < ET(jet#1) < 70 GeVBack-to-Back
Charged Particles (||<1.0, PT>0.5 GeV/c)
"Transverse" Region "Transverse"
Region
Jet#1
Associated DensityPTmaxT not included
PTmaxT
Polar Plot
0.5
1.0
1.5
2.0
“Back-to-Back”charge density
“Back-to-Back”“associated” density

IMFP2006 - Day 4 April 6, 2006
Rick Field – Florida/CDF/CMS Page 26
Back-to-Back “Associated”Back-to-Back “Associated”Charged Particle DensitiesCharged Particle Densities
Jet#1 Region
PTmaxT Direction
Jet#2 Region
Shows the dependence of the “associated” charged particle density, dNchg/dd, pT > 0.5 GeV/c, || < 1, PTmaxT > 2.0 GeV/c (not including PTmaxT) relative to PTmaxT (rotated to 180o) and the charged particle density, dNchg/dd, pT > 0.5 GeV/c, || < 1, relative to jet#1 (rotated to 270o) for “back-to-back events” with 30 < ET(jet#1) < 70 GeV.
Jet #1 Direction
“Toward”
“Transverse” “Transverse”
“Away”
Jet #2 Direction
Charged Particle Density: dN/dd2
6 1014
1822
26
30
34
38
42
46
50
54
58
62
66
70
74
78
82
86
90
94
98
102
106
110
114
118
122
126
130
134
138
142
146
150
154
158162
166170
174178182
186190194
198202
206
210
214
218
222
226
230
234
238
242
246
250
254
258
262
266
270
274
278
282
286
290
294
298
302
306
310
314
318
322
326
330
334
338342
346350
354 358
CDF Preliminarydata uncorrected
30 < ET(jet#1) < 70 GeVBack-to-Back
Charged Particles (||<1.0, PT>0.5 GeV/c)
"Transverse" Region "Transverse"
Region
Jet#1
Associated DensityPTmaxT > 2 GeV/c
(not included)
PTmaxT
Polar Plot
“Back-to-Back”“associated” density
“Back-to-Back”charge density
0.5
1.0
1.5
2.0

IMFP2006 - Day 4 April 6, 2006
Rick Field – Florida/CDF/CMS Page 27
Jet TopologiesJet Topologies
Jet#1 Region
PTmaxT Direction
Jet#2 Region
Shows the dependence of the “associated” charged particle density, dNchg/dd, pT > 0.5 GeV/c, || < 1, PTmaxT > 2.0 GeV/c (not including PTmaxT) relative to PTmaxT (rotated to 180o) and the charged particle density, dNchg/dd, pT > 0.5 GeV/c, || < 1, relative to jet#1 (rotated to 270o) for “back-to-back events” with 30 < ET(jet#1) < 70 GeV.
Charged Particle Density: dN/dd2
6 1014
1822
26
30
34
38
42
46
50
54
58
62
66
70
74
78
82
86
90
94
98
102
106
110
114
118
122
126
130
134
138
142
146
150
154
158162
166170
174178182
186190194
198202
206
210
214
218
222
226
230
234
238
242
246
250
254
258
262
266
270
274
278
282
286
290
294
298
302
306
310
314
318
322
326
330
334
338342
346350
354 358
CDF Preliminarydata uncorrected
30 < ET(jet#1) < 70 GeVBack-to-Back
Charged Particles (||<1.0, PT>0.5 GeV/c)
"Transverse" Region "Transverse"
Region
Jet#1
Associated DensityPTmaxT > 2 GeV/c
(not included)
PTmaxT
Polar Plot
0.5
1.0
1.5
2.0
Jet #3
Jet #3
Jet #1
Jet #1
Jet #2
Jet #2
Jet #4
Jet #4
QCD Three Jet TopologyQCD Four Jet Topology
Proton AntiProton
QCD 2-to-4 Scattering
PT(hard)
Outgoing Parton
Outgoing Parton
Underlying Event Underlying Event
Initial-State Radiation
Final-State Radiation
Final-State Radiation
Proton AntiProton
Multiple Parton Interactions
PT(hard)
Outgoing Parton
Outgoing Parton
Underlying Event Underlying Event
Outgoing Parton
Outgoing Parton

IMFP2006 - Day 4 April 6, 2006
Rick Field – Florida/CDF/CMS Page 28
Back-to-Back “Associated”Back-to-Back “Associated”Charged Particle DensityCharged Particle Density
Associated Particle Density: dN/dd
0.1
1.0
10.0
0 30 60 90 120 150 180 210 240 270 300 330 360
(degrees)
As
so
cia
ted
Pa
rtic
le D
en
sit
y
95 < ET(jet#1) < 130 GeV
30 < ET(jet#1) < 70 GeV
Charged Particles (||<1.0, PT>0.5 GeV/c)
CDF Preliminarydata uncorrected
PTmaxT
PTmaxT > 2.0 GeV/c (not included)
"Jet#1" Region
Back-to-Back
PTmaxT Direction
Jet#1 Region
Jet#2 Region
Look at the dependence of the “associated” charged particle density, dNchg/dd, pT > 0.5 GeV/c, || < 1 (not including PTmaxT) relative to PTmaxT (rotated to 180o) for PTmaxT > 2.0 GeV/c for “back-to-back” events with 30 < ET(jet#1) < 70 GeV and 95 < ET(jet#1) < 130 GeV.
Jet#2 Region
Very little dependence on ET(jet#1) in the “transverse” region for “back-to-back” events!
Log Scale!
IMFP2006 - Day 4 April 6, 2006
Rick Field – Florida/CDF/CMS Page 29
““Back-to-Back” vs “Min-Bias”Back-to-Back” vs “Min-Bias”“Associated” Charge Density“Associated” Charge Density
“Back-to-Back”“Associated” Density
“Min-Bias”“Associated” Density
Associated Particle Density: dN/dd
0.1
1.0
10.0
0 30 60 90 120 150 180 210 240 270 300 330 360
(degrees)
As
so
cia
ted
Pa
rtic
le D
en
sit
y PTmaxT > 2.0 GeV/c
PTmax > 2.0 GeV/c
Charged Particles (||<1.0, PT>0.5 GeV/c)
30 < ET(jet#1) < 70 GeV
PTmaxTPTmax
PTmaxT, PTmax not included
CDF Preliminarydata uncorrected
Min-Bias
PTmax Direction
Correlations in
PTmaxT Direction
Jet#1 Region
Jet#2 Region
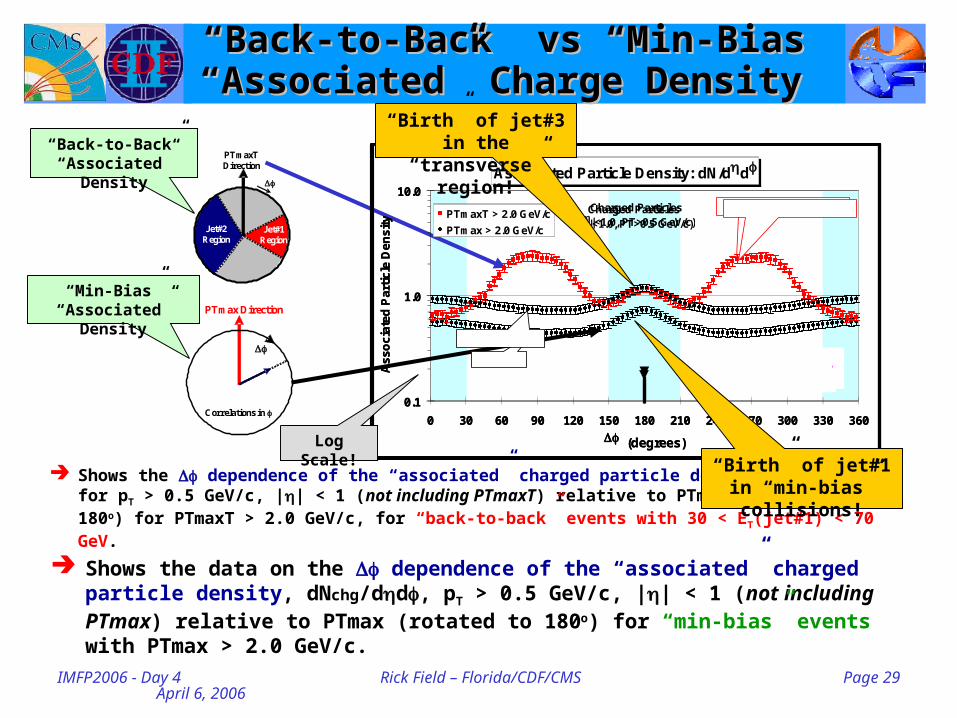
Shows the dependence of the “associated” charged particle density, dNchg/dd for pT > 0.5 GeV/c, || < 1 (not including PTmaxT) relative to PTmaxT (rotated to 180o) for PTmaxT > 2.0 GeV/c, for “back-to-back” events with 30 < ET(jet#1) < 70 GeV.
Shows the data on the dependence of the “associated” charged particle density, dNchg/dd, pT > 0.5 GeV/c, || < 1 (not including PTmax) relative to PTmax (rotated to 180o) for “min-bias” events with PTmax > 2.0 GeV/c.
Associated Particle Density: dN/dd
0.1
1.0
10.0
0 30 60 90 120 150 180 210 240 270 300 330 360
(degrees)
As
so
cia
ted
Pa
rtic
le D
en
sit
y PTmaxT > 2.0 GeV/c
PTmax > 2.0 GeV/c
Charged Particles (||<1.0, PT>0.5 GeV/c)
CDF Preliminarydata uncorrected
PTmaxTPTmax
PTmaxT, PTmax not included
30 < ET(jet#1) < 70 GeV
Min-Bias x 1.65
“Birth” of jet#1 in “min-bias” collisions!
“Birth” of jet#3 in the “transverse” region!
Log Scale!

IMFP2006 - Day 4 April 6, 2006
Rick Field – Florida/CDF/CMS Page 31
““Associated” PTsum DensityAssociated” PTsum DensityPYTHIA Tune A vs HERWIGPYTHIA Tune A vs HERWIG
Associated PTsum Density: dPT/dd
0.1
1.0
10.0
0 30 60 90 120 150 180 210 240 270 300 330 360
(degrees)
As
so
cia
ted
PT
su
m D
en
sit
y (
Ge
V/c
)
PTmaxT > 0.5 GeV/c
PY Tune ABack-to-Back
30 < ET(jet#1) < 70 GeV
Charged Particles (||<1.0, PT>0.5 GeV/c)
CDF Preliminarydata uncorrectedtheory + CDFSIM
PTmaxT "Jet#1" Region
PTmaxT not included
Data - Theory: Associated PTsum Density dPT/dd
-2
-1
0
1
2
0 30 60 90 120 150 180 210 240 270 300 330 360
(degrees)
Da
ta -
Th
eo
ry
(Ge
V/c
)
CDF Preliminarydata uncorrectedtheory + CDFSIM
Charged Particles (||<1.0, PT>0.5 GeV/c)
Back-to-Back30 < ET(jet#1) < 70 GeV
PYTHIA Tune A
PTmaxT
PTmaxT not included
"Jet#1" Region
Associated PTsum Density: dPT/dd
0.1
1.0
10.0
0 30 60 90 120 150 180 210 240 270 300 330 360
(degrees)
As
so
cia
ted
PT
su
m D
en
sit
y (
Ge
V/c
)
PTmaxT > 0.5 GeV/c
HERWIGBack-to-Back
30 < ET(jet#1) < 70 GeV
Charged Particles (||<1.0, PT>0.5 GeV/c)
CDF Preliminarydata uncorrectedtheory + CDFSIM
PTmaxT "Jet#1" Region
PTmaxT not included
Data - Theory: Associated PTsum Density dPT/dd
-2
-1
0
1
2
0 30 60 90 120 150 180 210 240 270 300 330 360
(degrees)
Da
ta -
Th
eo
ry
(Ge
V/c
)
CDF Preliminarydata uncorrectedtheory + CDFSIM
Charged Particles (||<1.0, PT>0.5 GeV/c)
Back-to-Back30 < ET(jet#1) < 70 GeV
HERWIG PTmaxT
PTmaxT not included
"Jet#1" Region
HERWIG (without multiple parton interactions) does not produce
enough “associated” PTsum in the direction of PTmaxT!
And HERWIG (without multiple parton interactions) does not
produce enough PTsum in the direction opposite of PTmaxT!
PTmaxT > 0.5 GeV/c

IMFP2006 - Day 4 April 6, 2006
Rick Field – Florida/CDF/CMS Page 32
““Associated” PTsum DensityAssociated” PTsum DensityPYTHIA Tune A vs HERWIGPYTHIA Tune A vs HERWIG
Associated PTsum Density: dPT/dd
0.1
1.0
10.0
0 30 60 90 120 150 180 210 240 270 300 330 360
(degrees)
As
so
cia
ted
PT
su
m D
en
sit
y (
Ge
V/c
)
PTmaxT > 2.0 GeV/c
PY Tune ABack-to-Back
30 < ET(jet#1) < 70 GeV
Charged Particles (||<1.0, PT>0.5 GeV/c)
CDF Preliminarydata uncorrectedtheory + CDFSIM
PTmaxT "Jet#1" Region
PTmaxT not included
Associated PTsum Density: dPT/dd
0.1
1.0
10.0
0 30 60 90 120 150 180 210 240 270 300 330 360
(degrees)
As
so
cia
ted
PT
su
m D
en
sit
y (
Ge
V/c
)
PTmaxT > 2.0 GeV/c
HERWIGBack-to-Back
30 < ET(jet#1) < 70 GeV
Charged Particles (||<1.0, PT>0.5 GeV/c)
CDF Preliminarydata uncorrectedtheory + CDFSIM
PTmaxT "Jet#1" Region
PTmaxT not included
Data - Theory: Associated Particle Density dN/dd
-2.0
-1.0
0.0
1.0
2.0
0 30 60 90 120 150 180 210 240 270 300 330 360
(degrees)
Da
ta -
Th
eo
ry
CDF Preliminarydata uncorrectedtheory + CDFSIM
Charged Particles (||<1.0, PT>0.5 GeV/c)
Back-to-Back30 < ET(jet#1) < 70 GeV
PYTHIA Tune A
PTmaxT "Jet#1" Region
PTmaxT > 2.0 GeV/c (not included)
Data - Theory: Associated Particle Density dN/dd
-2
-1
0
1
2
0 30 60 90 120 150 180 210 240 270 300 330 360
(degrees)
Da
ta -
Th
eo
ry
CDF Preliminarydata uncorrectedtheory + CDFSIM
Charged Particles (||<1.0, PT>0.5 GeV/c)
Back-to-Back30 < ET(jet#1) < 70 GeVHERWIG
PTmaxT "Jet#1" Region
PTmaxT > 2.0 GeV/c (not included)
For PTmaxT > 2.0 GeV both PYTHIA and HERWIG produce
slightly too much “associated” PTsum in the direction of PTmaxT!
But HERWIG (without multiple parton interactions) produces
too few particles in the direction opposite of PTmaxT!
PTmaxT > 2 GeV/c

IMFP2006 - Day 4 April 6, 2006
Rick Field – Florida/CDF/CMS Page 33
Jet MultiplicityJet Multiplicity
Shows the data on the number of jets (JetClu, R = 0.7, || < 2, ET(jet) > 3 GeV) for “back-to-back” events with 30 < ET(jet#1) < 70 GeV and PTmaxT > 2.0 GeV/c.
Jet #1 Direction
“Toward”
“TransMIN” “TransMAX”
PTmaxT
Jet #2 Direction
“Away”
Max pT in the “transverse” region!
Compares the (uncorrected) data with PYTHIA Tune A after CDFSIM.
Jet Multiplicity
0%
10%
20%
30%
40%
50%
0 1 2 3 4 5 6 7 8 9 10
Number of Jets
Pe
rce
nt
of
Ev
en
ts
Data CDF Run 2 Pre-Preliminarydata uncorrectedtheory + CDFSIM
Back-to-Back30 < ET(jet#1) < 70 GeV
PTmaxT > 2.0 GeV/c
Jet Multiplicity
0%
10%
20%
30%
40%
50%
0 1 2 3 4 5 6 7 8 9 10
Number of Jets
Pe
rce
nt
of
Ev
en
ts
Data
PY Tune A
CDF Run 2 Pre-Preliminarydata uncorrectedtheory + CDFSIM
Back-to-Back30 < ET(jet#1) < 70 GeV
PTmaxT > 2.0 GeV/c
Jet Multiplicity
0%
10%
20%
30%
40%
50%
0 1 2 3 4 5 6 7 8 9 10
Number of Jets
Pe
rce
nt
of
Ev
en
ts
Data
HERWIG
CDF Run 2 Pre-Preliminarydata uncorrectedtheory + CDFSIM
Back-to-Back30 < ET(jet#1) < 70 GeV
PTmaxT > 2.0 GeV/c
Compares the (uncorrected) data with HERWIG after CDFSIM.
Data have about equal amounts of 3 and 4 jet topologies!
HERWIG (without multiple parton interactions) does not have equal amounts of 3 and 4 jet topologies!

IMFP2006 - Day 4 April 6, 2006
Rick Field – Florida/CDF/CMS Page 36
The “Central” RegionThe “Central” Regionin Drell-Yan Productionin Drell-Yan Production
Look at the “central” region after removing the lepton-pair.
Study the charged particles (pT > 0.5 GeV/c, || < 1) and form the charged particle density, dNchg/dd, and the charged scalar pT sum density, dPTsum/dd, by dividing by the area in - space.
Proton AntiProton
Drell-Yan Production Lepton
Underlying Event Underlying Event
Initial-State Radiation
Anti-Lepton
Charged Particles (pT > 0.5 GeV/c, || < 1)
After removing the lepton-pair everything else is the
“underlying event”!
Proton AntiProton
Multiple Parton Interactions
Anti-Lepton
Lepton
Underlying Event Underlying Event
-1 +1
2
0
Central Region
Look at the charged particle density and the
PTsum density in the “central” region!
IMFP2006 - Day 4 April 6, 2006
Rick Field – Florida/CDF/CMS Page 37
CDF Run 1 PCDF Run 1 PTT(Z)(Z)
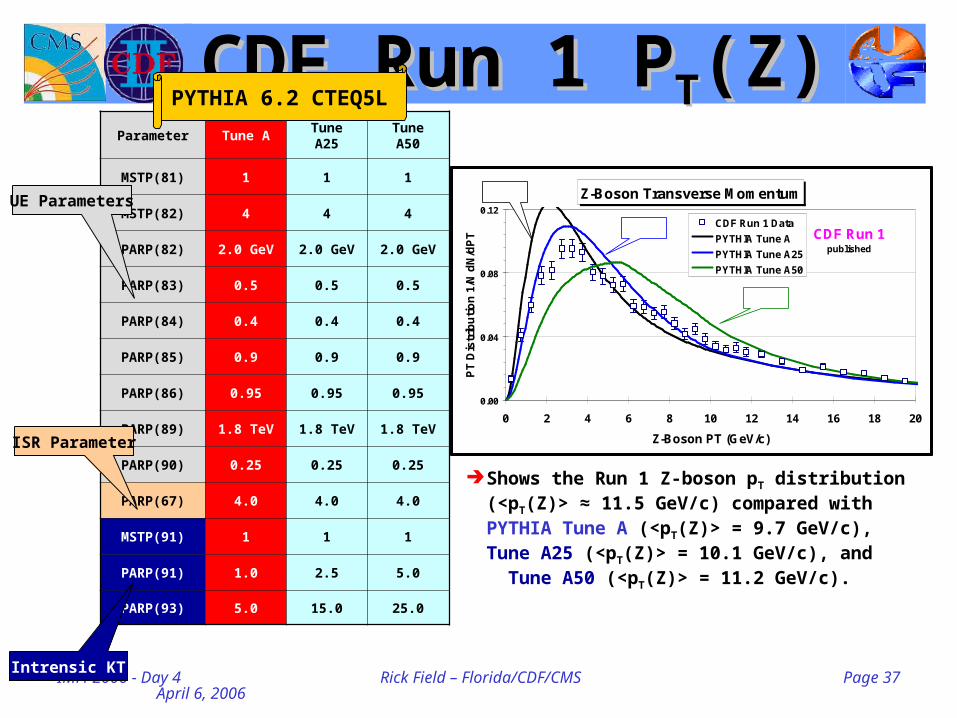
Shows the Run 1 Z-boson pT distribution (<pT(Z)> ≈ 11.5 GeV/c) compared with PYTHIA Tune A (<pT(Z)> = 9.7 GeV/c), Tune A25 (<pT(Z)> = 10.1 GeV/c), and Tune A50 (<pT(Z)> = 11.2 GeV/c).
Z-Boson Transverse Momentum
0.00
0.04
0.08
0.12
0 2 4 6 8 10 12 14 16 18 20
Z-Boson PT (GeV/c)
PT
Dis
trib
uti
on
1/N
dN
/dP
T
CDF Run 1 Data
PYTHIA Tune A
PYTHIA Tune A25
PYTHIA Tune A50
CDF Run 1published
1.8 TeV
Normalized to 1
s = 1.0
s = 2.5
s = 5.0
Parameter Tune A Tune A25 Tune A50
MSTP(81) 1 1 1
MSTP(82) 4 4 4
PARP(82) 2.0 GeV 2.0 GeV 2.0 GeV
PARP(83) 0.5 0.5 0.5
PARP(84) 0.4 0.4 0.4
PARP(85) 0.9 0.9 0.9
PARP(86) 0.95 0.95 0.95
PARP(89) 1.8 TeV 1.8 TeV 1.8 TeV
PARP(90) 0.25 0.25 0.25
PARP(67) 4.0 4.0 4.0
MSTP(91) 1 1 1
PARP(91) 1.0 2.5 5.0
PARP(93) 5.0 15.0 25.0
UE Parameters
ISR Parameter
Intrensic KT
PYTHIA 6.2 CTEQ5L

IMFP2006 - Day 4 April 6, 2006
Rick Field – Florida/CDF/CMS Page 38
Parameter Tune A Tune AW
MSTP(81) 1 1
MSTP(82) 4 4
PARP(82) 2.0 GeV 2.0 GeV
PARP(83) 0.5 0.5
PARP(84) 0.4 0.4
PARP(85) 0.9 0.9
PARP(86) 0.95 0.95
PARP(89) 1.8 TeV 1.8 TeV
PARP(90) 0.25 0.25
PARP(62) 1.0 1.25
PARP(64) 1.0 0.2
PARP(67) 4.0 4.0
MSTP(91) 1 1
PARP(91) 1.0 2.1
PARP(93) 5.0 15.0 The Q2 = kT2 in s for space-like showers is scaled by PARP(64)!
Effective Q cut-off, below which space-like showers are not evolved.
CDF Run 1 PCDF Run 1 PTT(Z)(Z)
Shows the Run 1 Z-boson pT distribution (<pT(Z)> ≈ 11.5 GeV/c) compared with PYTHIA Tune AW (<pT(Z)> = 11.7 GeV/c).
UE Parameters
ISR Parameters
Intrensic KT
Z-Boson Transverse Momentum
0.00
0.04
0.08
0.12
0 2 4 6 8 10 12 14 16 18 20
Z-Boson PT (GeV/c)
PT
Dis
trib
uti
on
1/N
dN
/dP
T
CDF Run 1 Data
PYTHIA Tune AWCDF Run 1
published
1.8 TeV
Normalized to 1
s = 2.1
PYTHIA 6.2 CTEQ5L

IMFP2006 - Day 4 April 6, 2006
Rick Field – Florida/CDF/CMS Page 39
DrellDrell--Yan ProductionYan Productionat the Tevatronat the Tevatron
Shows the lepton-pair average PT versus the lepton-pair invariant mass at 1.96 TeV for PYTHIA Tune AW and PYTHIA Tune A.
Lepton-Pair Transverse Momentum
0
5
10
15
20
0 50 100 150 200 250
Lepton-Pair Invariant Mass (GeV)
Av
era
ge
Pai
r P
T
Drell-Yan1.96 TeV
RDF Preliminarygenerator level
PY Tune A
PY Tune AW
Shows the lepton-pair average PT versus the lepton-pair invariant mass at 1.96 TeV for PYTHIA Tune AW and HERWIG.
<PT(pair)> versus M(pair)Lepton-Pair Transverse Momentum
Proton AntiProton
Drell-Yan Production
PT(pair)
Lepton-Pair
Outgoing Parton
Underlying Event Underlying Event
Initial-State Radiation
Final-State Radiation
Lepton-Pair Transverse Momentum
0
5
10
15
20
0 50 100 150 200 250
Lepton-Pair Invariant Mass (GeV)
Av
era
ge
Pai
r P
T
Drell-Yan1.96 TeV
RDF Preliminarygenerator level
PY Tune AW
HERWIG
Z Z

IMFP2006 - Day 4 April 6, 2006
Rick Field – Florida/CDF/CMS Page 40
DrellDrell--Yan ProductionYan Productionat the LHCat the LHC
Shows the lepton-pair average PT versus the lepton-pair invariant mass at 1.96 TeV for PYTHIA Tune AW and HERWIG.
Shows the lepton-pair average PT versus the lepton-pair invariant mass at 14 TeV for PYTHIA Tune AW and HERWIG.
<PT(pair)> versus M(pair)Lepton-Pair Transverse Momentum
Proton AntiProton
Drell-Yan Production
PT(pair)
Lepton-Pair
Outgoing Parton
Underlying Event Underlying Event
Initial-State Radiation
Final-State Radiation
Lepton-Pair Transverse Momentum
0
5
10
15
20
0 50 100 150 200 250
Lepton-Pair Invariant Mass (GeV)
Av
era
ge
Pai
r P
T
Drell-Yan1.96 TeV
RDF Preliminarygenerator level
PY Tune AW
HERWIG
Lepton-Pair Transverse Momentum
0
10
20
30
40
0 50 100 150 200 250
Lepton-Pair Invariant Mass (GeV)
Av
era
ge
Pai
r P
TDrell-Yan
RDF Preliminarygenerator level
PY Tune AW
HERWIGCDF
LHC
The lepton-pair <PT> much larger at the LHC!
Z Z

IMFP2006 - Day 4 April 6, 2006
Rick Field – Florida/CDF/CMS Page 41
The “Underlying Event” inThe “Underlying Event” inDrell-Yan Production (Tevatron)Drell-Yan Production (Tevatron)
Shows the charged particle density versus the lepton-pair invariant mass at 1.96 TeV for PYTHIA Tune AW and PYTHIA Tune A.
Shows the charged particle density versus the lepton-pair invariant mass at 1.96 TeV for PYTHIA Tune AW and HERWIG (with no MPI).
Charged particle density versus M(pair)
Charged Particle Density: dN/dd
0.0
0.2
0.4
0.6
0.8
1.0
0 50 100 150 200 250
Lepton-Pair Invariant Mass (GeV)
Ch
arg
ed
Pa
rtic
le D
en
sity
RDF Preliminarygenerator level
Drell-Yan1.96 TeV
Charged Particles (||<1.0, PT>0.5 GeV/c)
PY Tune A
PY Tune AW
The “Underlying Event”
Proton AntiProton
Drell-Yan Production Lepton
Underlying Event Underlying Event
Initial-State Radiation
Anti-Lepton
Charged Particle Density: dN/dd
0.0
0.2
0.4
0.6
0.8
1.0
0 50 100 150 200 250
Lepton-Pair Invariant Mass (GeV)
Ch
arg
ed P
arti
cle
De
nsi
ty
RDF Preliminarygenerator level
Drell-Yan1.96 TeV
PY Tune AW
HERWIG
Charged Particles (||<1.0, PT>0.5 GeV/c)(excluding lepton-pair )
HERWIG (without MPI) is much less active than
PY Tune AW (with MPI)!
Z Z

IMFP2006 - Day 4 April 6, 2006
Rick Field – Florida/CDF/CMS Page 42
The “Underlying Event” inThe “Underlying Event” inDrellDrell--Yan Production (LHC)Yan Production (LHC)
Charged particle density versus the lepton-pair invariant mass at 1.96 TeV for PYTHIA Tune AW and HERWIG (without MPI).
Charged particle density versus the lepton-pair invariant mass at 14 TeV for PYTHIA Tune AW and HERWIG (without MPI).
The “Underlying Event”
Proton AntiProton
Drell-Yan Production Lepton
Underlying Event Underlying Event
Initial-State Radiation
Anti-Lepton
Charged Particle Density: dN/dd
0.0
0.2
0.4
0.6
0.8
1.0
0 50 100 150 200 250
Lepton-Pair Invariant Mass (GeV)
Ch
arg
ed P
arti
cle
De
nsi
ty
RDF Preliminarygenerator level
Drell-Yan1.96 TeV
PY Tune AW
HERWIG
Charged Particles (||<1.0, PT>0.5 GeV/c)(excluding lepton-pair )
Charged Particle Density: dN/dd
0.0
0.5
1.0
1.5
0 50 100 150 200 250
Lepton-Pair Invariant Mass (GeV)
Ch
arg
ed P
arti
cle
De
nsi
ty
RDF Preliminarygenerator level
Drell-YanCharged Particles (||<1.0, PT>0.5 GeV/c)
(excluding lepton-pair )
PY Tune AW
HERWIG
LHC
CDF
Charged particle density versus M(pair)
“Underlying event” much more active at the LHC!
HERWIG (without MPI) is much less active than
PY Tune AW (with MPI)!
Z
Z
IMFP2006 - Day 4 April 6, 2006
Rick Field – Florida/CDF/CMS Page 43
The “Underlying Event” inThe “Underlying Event” inHigh PHigh PTT Jet Production (LHC) Jet Production (LHC)
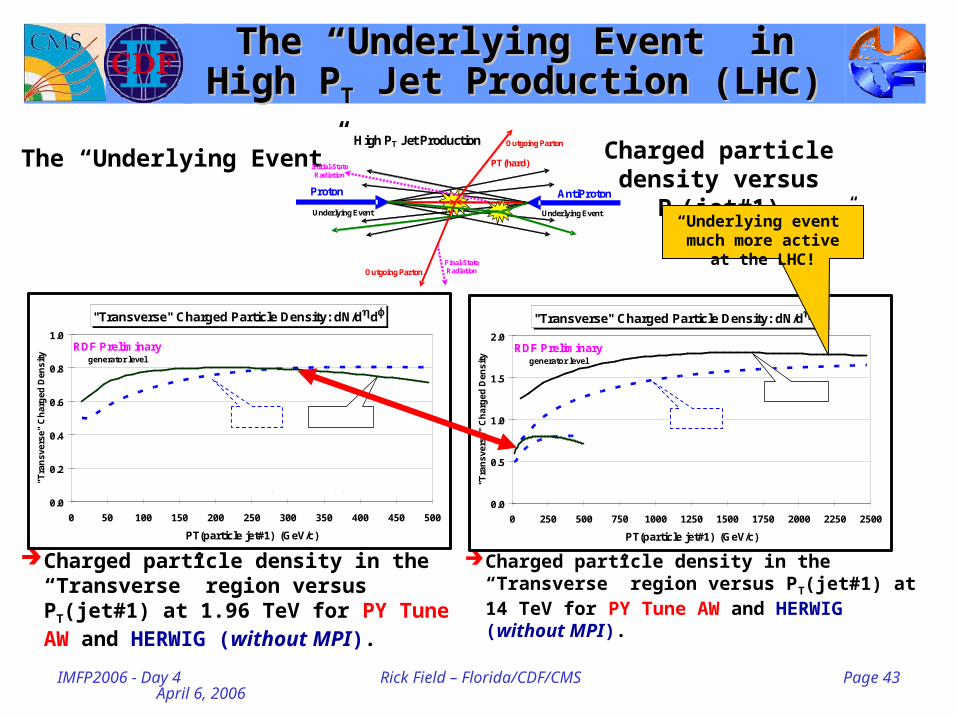
Charged particle density in the “Transverse” region versus PT(jet#1) at 1.96 TeV for PY Tune AW and HERWIG (without MPI).
Charged particle density in the “Transverse” region versus PT(jet#1) at 14 TeV for PY Tune AW and HERWIG (without MPI).
The “Underlying Event”
"Transverse" Charged Particle Density: dN/dd
0.0
0.2
0.4
0.6
0.8
1.0
0 50 100 150 200 250 300 350 400 450 500
PT(particle jet#1) (GeV/c)
"Tra
ns
ve
rse
" C
ha
rge
d D
en
sit
y
RDF Preliminarygenerator level
Charged Particles (||<1.0, PT>0.5 GeV/c) "Leading Jet"
PY Tune AW
1.96 TeV
HERWIG
"Transverse" Charged Particle Density: dN/dd
0.0
0.5
1.0
1.5
2.0
0 250 500 750 1000 1250 1500 1750 2000 2250 2500
PT(particle jet#1) (GeV/c)
"Tra
ns
vers
e" C
ha
rge
d D
en
sity
RDF Preliminarygenerator level
Charged Particles (||<1.0, PT>0.5 GeV/c) "Leading Jet"
PY Tune AW
CDF
LHC
HERWIG
Charged particle density versus PT(jet#1)
“Underlying event” much more active at the LHC!
Proton AntiProton
High PT Jet Production
PT(hard)
Outgoing Parton
Outgoing Parton
Underlying Event Underlying Event
Final-State Radiation
Initial-State Radiation

IMFP2006 - Day 4 April 6, 2006
Rick Field – Florida/CDF/CMS Page 45
UE&MB@CMSUE&MB@CMS
Measure Min-Bias and the “Underlying Event” at CMS The plan involves two phases. Phase 1 would be to measure min-bias and the “underlying event”
as soon as possible (when the luminosity is low), perhaps during commissioning. We would then tune the QCD Monte-Carlo models for all the other CMS analyses. Phase 1 would be a service to the rest of the collaboration. As the measurements become more reliable we would re-tune the QCD Monte-Carlo models if necessary and begin Phase 2.
Phase 2 is “physics” and would include comparing the min-bias and “underlying event” measurements at the LHC with the measurements we have done (and am doing now) at CDF and then writing a physics publication.
Me at CMS!
Darin
UE&MB@CMSRick Field (Florida)
Darin Acosta (Florida) Paolo Bartalini (Florida)Albert De Roeck (CERN)
Livio Fano' (INFN/Perugia at CERN)Filippo Ambroglini (INFN/Perugia at CERN)
Khristian Kotov (UF Student, Acosta)
UE&MB@CMSUE&MB@CMS

IMFP2006 - Day 4 April 6, 2006
Rick Field – Florida/CDF/CMS Page 46
Proton Proton
High PT Jet Production
PT(hard)
Outgoing Parton
Outgoing Parton
Underlying Event Underlying Event
Final-State Radiation
Initial-State Radiation
UE&MB@CMSUE&MB@CMS
“Underlying Event” Studies: The “transverse region” in “leading Jet” and “back-to-back” charged particle jet production and the “central region” in Drell-Yan production. (requires charged tracks and muons for Drell-Yan)
Drell-Yan Studies: Transverse momentum distribution of the lepton-pair versus the mass of the lepton-pair, <pT(pair)>, <pT
2(pair)>, ds/dpT(pair) (only requires muons). Event structure for large lepton-pair pT (i.e. +jets, requires muons).
Min-Bias Studies: Charged particle distributions and correlations. Construct “charged particle jets” and look at “mini-jet” structure and the onset of the “underlying event”. (requires only charged tracks)
Proton Proton
Drell-Yan Production Lepton
Underlying Event Underlying Event
Initial-State Radiation
Anti-Lepton
Proton Proton
“Minimum-Bias” Collisions
Proton Proton
Drell-Yan Production
PT(pair)
Lepton-Pair
Outgoing Parton
Underlying Event Underlying Event
Initial-State Radiation
Final-State Radiation
UE&MB@CMSUE&MB@CMS
Study charged particles and muons using the CMS detector
at the LHC (during the pilot run)!