imf country report no. 16/268 japan regression on labor productivity, aging and population size...
TRANSCRIPT

© 2016 International Monetary Fund
IMF Country Report No. 16/268
JAPAN SELECTED ISSUES
This Selected Issues paper on Japan was prepared by a staff team of the International
Monetary Fund as background documentation for the periodic consultation with the
member country. It is based on the information available at the time it was completed on
July 13, 2016.
Copies of this report are available to the public from
International Monetary Fund Publication Services
PO Box 92780 Washington, D.C. 20090
Telephone: (202) 623-7430 Fax: (202) 623-7201
E-mail: [email protected] Web: http://www.imf.org
Price: $18.00 per printed copy
International Monetary Fund
Washington, D.C.
August 2016

JAPAN SELECTED ISSUES
Approved By Asia and Pacific Department
Prepared By Elif Arbatli, Dennis Botman, Yihan Liu, Ikuo Saito, and Niklas Westelius (all APD), George Kopits (APD/FAD Visiting Scholar), Vitor Gaspar and Constant Lonkeng Ngouana (both FAD), Chie Aoyagi, Giovanni Ganelli, Naoko Miake, and Nour Tawk (all OAP), Pietro Cova, Xavier Debrun, Zoltan Jakab, Douglas Laxton, Joannes Mongardini, Hui Tong, and Hou Wang (all RES), and Fei Han (MCM)
EXECUTIVE SUMMARY ________________________________________________________________ 6
SUMMARY OF STAFF RESEACH SINCE 2010 _________________________________________ 7
A. Potential Growth _____________________________________________________________________ 7
B. Labor Market Dynamics ______________________________________________________________ 8
C. Drivers of Private Investment _________________________________________________________ 8
D. Monetary Policy ______________________________________________________________________ 9
E. Fiscal Policy __________________________________________________________________________ 10
F. The Financial Sector _________________________________________________________________ 11
G. Spillovers ____________________________________________________________________________ 11
REFERENCES __________________________________________________________________________ 13
LABOR MARKET AND WAGE DEVELOPMENTS _____________________________________ 16
A. Introduction _________________________________________________________________________ 16
B. The Rise of Non-Regular Employment ______________________________________________ 19
C. Sluggish Wage Growth ______________________________________________________________ 22
D. Conclusions _________________________________________________________________________ 25
CONTENTS
July 13, 2016

JAPAN
2 INTERNATIONAL MONETARY FUND
BOX 1. Wage Setting in Japan _______________________________________________________________ 26
FIGURES 1. Labor Market Indicators _____________________________________________________________ 17 2. Beveridge Curve and Structural Unemployment ____________________________________ 18 3. Wage Developments ________________________________________________________________ 20 4. Sectoral Composition of Growth and Employment __________________________________ 21 5. Part-time Employment ______________________________________________________________ 22 6. Labor Force Participation ____________________________________________________________ 24
REFERENCES __________________________________________________________________________ 27
MININUM WAGES AS A POLICY TOOL ______________________________________________ 28
A. Introduction _________________________________________________________________________ 28
B. Empirical Strategy and Results ______________________________________________________ 29
C. Policy Implications __________________________________________________________________ 29
TABLE 1. Wage Determinants in Japan (Prefectural Panel), Regression Results Using Instrumental Variables (hourly) in Logs ________________________________________________ 30
IMPACT OF DEMOGRAPHICS ON GROWTH AND INFLATION IN JAPAN _________ 31
A. Introduction _________________________________________________________________________ 31
B. Data and Empirical Methodology ___________________________________________________ 32
C. Results ______________________________________________________________________________ 33
D. Conclusions and Policy Implications ________________________________________________ 34
FIGURES 1. Demographic and Macroeconomic Comparison of G7 Countries ___________________ 34 2. Impact of Aging and Population Growth on Japan’s Labor Force ___________________ 34
TABLES 1. Panel Regression on Labor Productivity, Aging and Population Size ________________ 35 2. Panel Regression on Inflation, Aging and Population Growth _______________________ 35
REFERENCES __________________________________________________________________________ 36
QQES IMPACT ON FINANCING CONDITIONS OF LISTED FIRMS ___________________ 37
A. Background _________________________________________________________________________ 37
B. Methodology and Results ___________________________________________________________ 37
C. Conclusion __________________________________________________________________________ 38

JAPAN
INTERNATIONAL MONETARY FUND 3
FIGURES 1. Change of Total Debt from 2013 to 2015 (%)(by pre-QQE Financial Constraints) ___ 38 2. Change of Total Debt from 2013 to 2015 (%)(by Domestic and multinational firms) 38
REFERENCES __________________________________________________________________________ 39
NEGATIVE INTEREST RATE POLICY AND BANK DEPOSIT RATE____________________ 40
A. Background _________________________________________________________________________ 40
B. Results _______________________________________________________________________________ 40
C. Conclusions _________________________________________________________________________ 41
FIGURES 1. Deposit Rates by Type _______________________________________________________________ 42 2: Relative Standard Deviation of Bank Rates for 5-year Large Deposits _______________ 42
TABLE 1. Change of 5-year Rate for Large Feposits (12/5/15–5/21/16) _______________________ 42
IS HOME BIAS WEAKENING? ________________________________________________________ 43
A. Introduction _________________________________________________________________________ 43
B. Empirical Analysis and Results _______________________________________________________ 45
C. Conclusions and Policy Implications ________________________________________________ 45
FIGURES 1a. Residents' Holdings of Domestic Sovereign Debt __________________________________ 43 1b. 10-Year Local-Currency Government Bond Yields _________________________________ 43 2a. Financial Institutions' Holdings of JGBs ____________________________________________ 44 2b. Financial Institutions' Holdings of Foreign Securities ______________________________ 44 3a. Home Bias in Debt Securities_______________________________________________________ 44 3b. Home Bias and Holdings of Domestic Sovereign Debt ____________________________ 44 4. Decomposition of Home Bias _______________________________________________________ 46 5. Year Effects and Global Risk Aversion _______________________________________________ 46
TABLE 1. Panel Estimates of Determinants of Home Bias _____________________________________ 47
REFERENCES __________________________________________________________________________ 48
FADING RICARDIAN EQUIVALENCE IN AGEING JAPAN ____________________________ 49
A. Background _________________________________________________________________________ 49
JAPAN
4 INTERNATIONAL MONETARY FUND
B. Myopia and Liquidity Constraints ___________________________________________________ 50
C. Policy Implications __________________________________________________________________ 51
D. Conclusions _________________________________________________________________________ 52
REFERENCES __________________________________________________________________________ 53
ECONOMIC POLICY UNCERTAINTY __________________________________________________ 54
A. Background _________________________________________________________________________ 54
B. Measuring Economic Policy Uncertainty ____________________________________________ 55
C. Economic Impact of Policy Uncertainty _____________________________________________ 56
D. Conclusions and Policy Implications ________________________________________________ 57
FIGURES 1. Economic Policy Uncertainty Index __________________________________________________ 55 2. VAR Results: Impulse Responses to EPU Shock______________________________________ 57
TABLES 1. Economic Policy Uncertainty Keywords _____________________________________________ 58 2. Correlation of Japan EPU Index with Other Measures of Economic Uncertainty ____ 59 3. Aggregate Investment Equation Estimates __________________________________________ 59
REFERENCES __________________________________________________________________________ 60
AN INDEPENDENT FISCAL INSTITUTION FOR JAPAN ______________________________ 61
A. Background _________________________________________________________________________ 61
B. International Experience _____________________________________________________________ 61
C. The Case for an IFI in Japan _________________________________________________________ 63
D. Design Options for Japan ___________________________________________________________ 64
E. Conclusions __________________________________________________________________________ 65
TABLES 1. Advanced Economies: Statutes and Structure of Independent Fiscal Institutions ___ 66 2. Advanced Economies: Functions of Independent Fiscal Institutions _________________ 66
REFERENCES __________________________________________________________________________ 67
REFLATING JAPAN: TIME TO GET UNCONVENTIONAL? ___________________________ 68
A. Introduction _________________________________________________________________________ 68
B. Methodology ________________________________________________________________________ 69
C. Assumptions for Simulating the Three Arrows Plus Policy Package _________________ 70
D. Assumptions for Simulating Krugman’s Irresponsible Fiscal and Monetary Policy __ 71

JAPAN
INTERNATIONAL MONETARY FUND 5
E. Assumptions for Simulating Svensson’s Foolproof Way _____________________________ 72
F. Assumptions for Simulating Turner’s Monetization of the Deficit ____________________ 73
G. Three Arrows Plus Package _________________________________________________________ 74
H. Krugman’s Irresponsible Fiscal and Monetary Policy ________________________________ 77
I. Svensson’s Foolproof Way ___________________________________________________________ 79
J. Turner’s Monetization of the Deficit Scenario _______________________________________ 81
K. Conclusions and Policy Implications ________________________________________________ 84 FIGURES 1. Simulations of the Three Arrows Plus Package ______________________________________ 76 2. Simulations of Krugman’s Irresponsible Fiscal and Monetary Policy ________________ 78 3. Simulations of Svensson’s Foolproof Way ___________________________________________ 80 4. Simulations of Turner’s Monetization of the Deficit _________________________________ 83 TABLES 1. Assumptions for Simulating the Three Arrows Plus Policy Package _________________ 71 2. Assumptions for Simulating Krugman’s Irresponsible Fiscal and Monetary Policy __ 72 3. Assumptions for Simulating Svensson's Foolproof Way _____________________________ 73 4. Assumptions for Simulating Turner's Monetization of the Deficit ___________________ 74
REFERENCES __________________________________________________________________________ 85

JAPAN
6 INTERNATIONAL MONETARY FUND
EXECUTIVE SUMMARY Staff’s analytical work since around the launch of Abenomics has focused on how to reflate the economy and achieve fiscal sustainability. It covered the areas of potential growth, labor market duality’s implications for wage-price dynamics and productivity, drivers of private investment, the effectiveness of and limits to quantitative easing, aging and deflationary pressures, government revenue and expenditure priorities to restore public debt sustainability, financial sector reforms to rekindle risk-taking, and spillover effects of Japan’s new policy framework (Summary of staff research since 2010). Complementary research completed for the 2016 Article IV consultation supports the staff’s view that Abenomics needs to be reloaded along most dimensions to meet the authorities’ ambitious targets:
Labor market reform and incomes policies. Together with income policies, reforming structural features of the labor market, in particular addressing labor market-duality, will be essential to generate strong enough wage pressures to coordinate wage-price adjustment and help achieve the BoJs inflation target (Labor market and wage developments). Lifting minimum wage growth as decided by the authorities is a good starting point as it will partially pass through the wage structure and support reflation efforts (Minimum wages as a policy tool).
Headwinds from demographics. Ongoing aging and the recently started decline in population size are found to adversely affect productivity and inflation (Impact of demographics on growth and inflation). This finding puts a premium on policies to raise participation rates of females and older workers, make more use of foreign labor, and raise productivity through deregulation and support for innovation.
Monetary policy effectiveness. There are some concerns that easy monetary conditions do not fully get transmitted to credit-constrained SMEs, suggesting the need to phase out SME guarantees and improve risk-management capacity in the financial system (QQEs’ impact on financing conditions of listed firms). And structural features of banks appear to affect the pass through of the negative policy rate onto deposit rates (Negative interest rate policy and bank deposit rates).
Fiscal policy and frameworks. Strong home bias has allowed the public sector to finance high debt and deficits without adverse effects on funding costs, but it should not be taken for granted or expected to last forever, especially when the BoJ exits from its unconventional policies (Is home bias weakening?). At the same time, households have become less Ricardian, with the decline in average remaining life expectancy and the rising share of cash constrained households key factors (Fading Ricardian equivalence in ageing Japan). Hence, fiscal consolidation should start soon and be gradual. More broadly, economic policy uncertainty—measured using novel methods—appears to have a large and statistically significant adverse effect on output, employment and investment (Economic policy uncertainty). This suggests that steady, transparent, and credible policy frameworks could have large benefits, making the establishment of an independent fiscal council particularly beneficial (An independent fiscal institution for Japan).
Unorthodox policies? While many observers advocate further unorthodox policies (e.g., helicopter money), simulations suggest that a comprehensive Abenomics-reload package remains preferable to such alternatives from a risk-return perspective (Reflating Japan: time to get unconventional?).

JAPAN
INTERNATIONAL MONETARY FUND 7
SUMMARY OF STAFF RESEACH SINCE 20101 Since the bursting of the asset-price bubble in early 1990s, Japan has faced the formidable challenge of raising growth, ending deflation, securing fiscal sustainability and maintaining financial stability. Japan’s rapidly aging society, entrenched deflationary expectations, and sluggish global growth hampered policy transmission. Against this backdrop, in late 2012, the Japanese authorities launched a comprehensive approach to revive the economy, composed of three complementary elements: aggressive monetary easing, flexible fiscal policy, and structural reforms to raise potential growth. Recent IMF research has focused on structural impediments to growth and wage-price dynamics, including from aging and labor market frictions. Other research areas covered the implications of the authorities’ new policy framework and the key policy challenges and points to the need for a comprehensive and coordinated set of reforms to transition to a self-sustained recovery.
A. Potential Growth
Over the last two decades, Japan’s growth has lagged that of many advanced economies, but Japan’s weak growth performance has been mainly driven by the decline in its labor force, while productivity growth has been comparable to other countries (Danninger and Steinberg, 2012). Potential growth declined from about 4 percent in the 1980s to 1 percent in the 2000s, initially reflecting deceleration in capital formation and total factor productivity growth after the bursting of the asset bubble, but more recently declining labor input has played an important role. Headwinds from Japan’s aging society are expected to play an important role in shaping not only potential growth, but also inflation dynamics, and fiscal sustainability. Anderson, Botman and Hunt (2014) find that a declining labor-force participation rate, falling land prices, and currency appreciation following the repatriation of foreign savings by the elderly could all create deflationary pressures amid a declining natural rate of interest and the zero-lower bound on monetary policy rates. These effects are magnified by the large and sustained fiscal consolidation need.
Danninger and Steinberg (2012) propose that real GDP growth in Japan could be increased by 1 to 2 percentage points over the course of a decade through increased immigration, greater labor force participation of women and the aged and higher productivity, especially in protected sectors, as a result of deregulation, a more dynamic financial sector and greater international integration. Steinberg and Nakane (2012) argue that raising female labor force participation can indeed provide an important boost to growth and policies should target reducing the gender gap in career positions and providing better support for working mothers. Kinoshita and Guo (2015) explore the implications of non-regular employment among female workers, arguing that child cash allowances reduce the proportion of regular female employment. More public spending on childcare can help women continue to work. Ganelli and Miake (2015) find that increasing reliance on foreign labor could help ease labor shortages.
1 Prepared by Elif Arbatli (APD). The research discussed in this chapter has been summarized in Botman et al. (2015).

JAPAN
8 INTERNATIONAL MONETARY FUND
While rare, sustained trend growth increases of more than 1 percent have been achieved in several advanced economies, and have been driven mainly by contributions from labor input and total factor productivity. As highlighted by Danninger and Steinberg (2012), achieving a sustained increase in growth would only be feasible by concerted action on all fronts and a comprehensive reform package which delivers sustainable public finances, steady positive inflation and structural reforms. Staff research finds that full implementation of structural reforms is also critical to improve equality (Aoyagi et. al., 2015).
B. Labor Market Dynamics
Japan’s labor market has fared relatively well considering the substantial output losses that have occurred at time, with unemployment remaining low. Steinberg and Nakane (2011) find that while Japan’s employment responsiveness to the cyclical position has been relatively low, it has been rising over time reflecting the higher share of the non-regular workforce. The lower employment response to output compared to other countries during the Great Recession reflects the quick implementation of an employment subsidy program, a more flexible wage system and strong employment protection. Notwithstanding Japan’s relatively low unemployment rate, there are important skill mismatches in certain sectors and the occupational and employment type mismatch in Japan’s labor market has increased substantially since the global financial crisis (Shibata, 2013).
Japan stands out as having downward nominal wage flexibility, as a large share of remuneration consists of bonuses, while wages tend to be more rigid upwardly. In addition, real wage growth has lagged productivity over the last two decades. Aoyagi and Ganelli (2013) argue that increasing labor market duality, with a rising share of non-regular workers, has contributed to the sluggish real wage growth. It likely had a negative net effect on potential growth by reducing total factor productivity as non-regular workers have lower incentives to exert effort and firms have lower incentives to train them. Based on cross-country evidence, they propose reducing the difference in employment protection between regular and non-regular workers in an effort to reduce labor market duality. This could be achieved through the introduction of a Single Open Ended Contract for all newly hired workers, or by encouraging a wider use of the “limited regular” contracts which already exist in Japan. Porcellacchia (2016) finds that reducing labor-market duality can help generate favorable wage-price dynamics by raising the bargaining power of workers, in particular if it is implemented together with corporate governance reforms to provide managers an incentive to pass on higher input costs into prices. However, such reforms come with an unusual trade-off, whereby attaining higher inflation involves lower employment.
C. Drivers of Private Investment
One of the key policy objectives under Abenomics has been to boost private demand and achieve sustained growth momentum. Tokuoka (2010) argues that private consumption could be a critical driver of growth and finds that boosting household income through higher wages and property income can support consumption growth. Boosting private investment is also critical to increase potential growth and raise employment but it has remained subdued in recent years, despite favorable financing conditions, an aged capital stock, and improved profitability in the corporate

JAPAN
INTERNATIONAL MONETARY FUND 9
sector. Kang (2014) finds that firms’ expectations of demand growth over the medium term are a key determinant of corporate investment, highlighting the importance of expediting structural reforms. Kang and Piao (2015) explore factors behind the weak investment response at the firm level distinguishing between firms expanding abroad and those operating mainly in domestic markets. They find that the former are less responsive to the Q ratio and more responsive to cash flow, suggesting that firms rely on internal financing for overseas expansion. Japanese firms’ aiming to have a footprint in markets where demand is growing could therefore explain the subdued investment performance despite increasing profitability, the weaker yen under Abenomics, and favorable financing conditions and balance sheets.
Syed and Lee (2010) find an important role for raising the return on investment (including through reforms to the tax code), improving SME access to finance through venture capital investment and more risk-based lending and supporting corporate sector restructuring to raise investment and spending on R&D. Subdued investment and low dividend payouts amid high profits have led to the accumulation of excessive cash holdings by Japanese corporates. Sher (2014) finds that cash accumulation has been due to financial imperfections combined with rising corporate profitability and uncertainty, while corporate governance has also played a role. Aoyagi and Ganelli (2014) highlight corporate governance as an important factor in understanding Japanese firms’ investment decisions. They propose policies to encourage the use of firms’ cash holdings, including ambitious requirements for the number of outside directors and measures to reduce cross shareholding.
D. Monetary Policy
An important element of Japan’s policy response to shore up growth and exit deflation involved monetary stimulus through the Bank of Japan’s (BoJ) zero interest rate and quantitative easing policies, first introduced in 2001. The BoJ exited its quantitative easing policy in 2006, amid signs that the economy was coming out of deflation (Botman, 2015). Looking at the BoJ’s experience with quantitative easing during this period, Berkmen (2012) finds that unconventional monetary easing has had a positive effect on output, which increased over time with the improvements in the banking and corporate sector, but it has been less effective in terms of raising inflation. After the financial crisis, the BoJ undertook several measures including a clearer commitment to the zero interest rate policy and a new asset purchase program under its Comprehensive Monetary Easing (CME) policy involving purchases of private sector financial assets in addition to government securities. Lam (2011) finds that the unconventional monetary easing measures introduced since 2009 under the Comprehensive Monetary Easing (CME) had a statistically significant impact on lowering bond yields and improving equity prices, but no notable impact on inflation expectations. Lam (2011) also found that the composition of asset purchases by the BoJ mattered, with private asset purchases critical in affecting asset prices.
With the launch of Abenomics, the BoJ adopted a new monetary policy framework consisting of a higher inflation target of 2 percent and an unprecedented asset-purchase program (QQE) which was further expanded in October 2014. Against this background, Arslanalp and Botman (2015) look at the scope for further portfolio rebalancing using realistic scenarios based on collateral needs of banks, asset-liability management constraints on insurers, and announced asset allocation targets of
JAPAN
10 INTERNATIONAL MONETARY FUND
major pension funds. They find that the BoJ may face limits on its purchases of JGBs and need to taper its purchases in 2017 or 2018. However, the BoJ can continue to provide monetary stimulus by extending the maturity of its JGB purchases or by scaling up private asset purchases. The significant expansion of the BoJ’s balance sheet also poses important questions regarding its exit from unconventional monetary policies. Yamaoka and Syed (2010) analyzed the BoJ’s exit from its earlier quantitative easing policies in 2006, with a view to inform the exit strategies of other central banks.
E. Fiscal Policy
The weak, post-bubble, nominal economic growth rate, fiscal stimulus measures and aging led to a significant deterioration in Japan’s fiscal position. Public debt increased substantially and at 246 percent of GDP in 2014, it is the highest among advanced economies. The appropriate fiscal stance in the context of Japan’s weak growth and efforts to exit from deflation as well as the timing and composition of fiscal adjustment to put public debt on a sustainable path have been among the mostly debated policy challenges. Given the sizeable adjustment need and the relatively large scope for raising revenues, staff’s analysis has suggested that the consolidation strategy should include both spending and revenue measures. Tokuoka (2012) finds that combining social security spending reforms and revenue measures in a balanced manner is also desirable from an intergenerational equity perspective.
On the spending side, social security and health care spending are important areas of reform. Although Japan’s social security spending is relatively low, it is still an important component of total outlays. Against this background, Kashiwase, Nozaki and Tokuoka (2012) analyze different reform options for Japan’s public pension system. They argue that the most attractive option is to increase the pension eligibility age in line with the high and rising life expectancy. This would have a positive effect on long-run economic growth and would be relatively fair in sharing the burden of fiscal adjustment between younger and older generations. If implemented, together with other measures, the fiscal deficit can be reduced by up to 1¼ percent of GDP by 2020. Nozaki, Kashiwase and Saito (2014) find that health care spending would increase by about 5½-6½ percent of GDP during 2010-2030 on current policies. This increase is driven to a large extent by aging. The authors propose raising copayment rates and more efficient use of health resources to partially offset the projected increase in health care spending.
Japan has significant scope to raise revenues and improve its composition by relying more on consumption taxes. Keen et. al. (2011) argue that Japan’s relatively low consumption tax rate and the lower distortions associated with this tax makes it a more appealing measure than other taxes. They also highlight the need to raise the consumption tax rate sooner than later, in a pre-announced stepwise fashion, while maintaining the single rate structure. The relatively high level of statutory corporate tax rates in Japan suggests that reforming the corporate tax system can help boost investment and growth. De Mooij and Saito (2014) find that with every point of rate reduction, investment is expected to increase by around 0.4 percent. Although part of the revenue loss could be recovered in the long run through dynamic scoring, offsetting measures are necessary to minimize the impact on the fiscal balance.

JAPAN
INTERNATIONAL MONETARY FUND 11
Despite rising public debt levels, long-term interest rates in Japan have remained low. Arslanalp and Lam (2013) find that bond yields have been pushed down by higher demand for safe assets amid population aging and increased purchases by the BoJ. Similarly, Lam and Tokuoka (2011) and Tokuoka (2010) find that Japanese sovereign bond yields have remained low and stable supported by steady inflows from the household and corporate sector amid high domestic ownership of government bonds, while safe-haven flows have also contributed. They argue that over time, the market’s capacity to absorb new debt will likely shrink as population ages and risk appetite recovers. Fiscal reforms to reduce public debt more quickly and lengthen the maturity of government bonds will help limit these risks.
F. The Financial Sector
The financial sector plays a critical role in the effectiveness of the new policy framework. There has only been limited progress with portfolio rebalancing from safe assets towards higher-yielding capital provision, despite the substantial improvement in banks’ balance sheets (Arslanalp, Lam and Nabar, 2015). Limited risk capital reflects both supply and demand factors. Lack of securitization and venture capital, together with factors that impede the demand for risk capital, such as insufficient SME restructuring, entry, and exit have contributed to the reliance on low-yielding, safe assets (Lam and Shin, 2012). Public guarantees have compounded this problem by facilitating rollovers and delaying repayments. Lam and Shin (2012) propose measures to accelerate SME restructuring, deepen capital markets to enhance risk capital availability, and address regulatory barriers to starting a business.
New policies under Abenomics also have important implications for banks, in particular, their exposure to interest rate risk and from rising overseas lending. Arslanalp, Lam and Nabar (2015) consider how under different assumptions about policy implementation under Abenomics, the interest rate risks for banks evolve over time. They find that in the near-term interest rate risk of banks would decline substantially, but in the medium term, risks may emerge if structural and fiscal reforms disappoint. Their finding emphasizes the need for a complete reform package for reducing risks to the financial sector. Another implication of greater portfolio rebalancing under Abenomics is the overseas expansion of Japanese banks mainly in Asia, which has gathered further momentum in recent years. Lam (2013) finds that both global and regional factors explain a large part of the Japanese banks’ expansion abroad. Among domestic factors, the strong capital positions of major Japanese banks played the biggest role, while limited domestic opportunities contributed to a lesser extent. The overseas expansion of Japanese banks brings opportunities and risks. While a more diversified income base and increased profitability are desirable, a rapid expansion abroad could result in losses given the scope for underestimating risks in new markets and potential foreign exchange funding risks.
G. Spillovers
Japan’s economic performance and policies also have potential spillover effects on the rest of the world. In general, a stronger economic recovery in Japan would have positive spillovers for its trading partners. For example, Botman and Kang (2015) find that successful implementation of a

JAPAN
12 INTERNATIONAL MONETARY FUND
comprehensive reform package would generate a small positive effect on the G-20 countries in the short-run (0-0.1 percent of GDP), but as the structural reforms gradually raise Japan’s potential growth rate in the medium-term, positive spillovers would also increase. They argue that an important positive spillover from reforms in Japan includes the reduction in medium-term tail risks, given Japan’s high level of public debt and large net foreign asset position.
Regarding the exchange rate, the process of production offshoring and the emergence of global supply chains put into perspective the transmission of economic policies and spillovers. Potential effects of the yen’s depreciation on Japan’s competitors and the impact of capital outflows from Japan have been relatively muted so far. The depreciation of the yen did not have a substantial impact on export volumes, in part reflecting reluctance by Japanese exporters to gain market share, instead opting to keep invoice prices broadly stable. The lack of an export response is also explained by the increasing trend of production outsourcing and Japan’s upward position in the Asian supply chain (Kang, 2015a, and IMF, 2011).
Ganelli and Tawk (2016) use a Global VAR model to study spillovers from the BoJ’s QQE on emerging Asia. Their main result is that, despite an appreciation of their currencies vis-à-vis the yen, the impact on emerging Asia’s GDP tended to be positive and significant. Their results suggest that the positive effect of QQE on expectations, by improving confidence, more than offset any negative exchange rate spillover due to expenditure switching from domestic demand to Japanese goods.
Finally, Japan’s safe-haven status is an important consideration when evaluating spillovers from the rest of the world onto Japan, as it can pose policy challenges. Botman, Carvalho Filho, and Lam (2013) find that neither capital inflows nor expectations of the future monetary policy stance can explain the yen’s safe haven behavior. In contrast, they find evidence that changes in market participants’ risk perceptions trigger derivatives trading, which in turn lead to changes in the spot exchange rate without capital flows. Specifically, the authors find that risk-off episodes coincide with forward hedging and reduced net short positions or a buildup of net long positions in yen. These empirical findings suggest that offshore and complex financial transactions should be part of spillover analyses and that the effectiveness of capital flow management measures or monetary policy coordination to address excessive exchange rate volatility might be limited in certain cases.

JAPAN
INTERNATIONAL MONETARY FUND 13
References
Anderson, D., D. Botman, and B. Hunt, 2014, “Is Japan’s Population Aging Deflationary?” IMF Working Paper No. 14/139.
Aoyagi, C. and G. Ganelli, 2013, “The Path to Higher Growth: Does Revamping Japan’s Dual Labor Market Matter?” IMF Working Paper No. 13/202.
Aoyagi, C., G. Ganelli, and K. Murayama, 2015, “How Inclusive Is Abenomics?” IMF Working Paper No. 15/54.
Aoyagi, C. and G. Ganelli, 2014, “Unstash the Cash! Corporate Governance Reform in Japan,” IMF Working Paper No. 14/140.
Arslanalp, S. and D. Botman, 2015, “Portfolio Rebalancing in Japan: Constraints and Implications for Quantitative Easing?” IMF Working Paper No. 15/186.
Arslanalp, S., R.W. Lam, and M. Nabar, 2015, “The Opportunities and Risks of Abenomics in the Financial Sector,” in Can Abenomics Succeed?: Overcoming the Legacy of Japan’s Lost Decades, edited by D. Botman, S. Danninger, and J. Schiff. Washington D.C.: International Monetary Fund, 2015.
Arslanalp, S. and R.W. Lam, 2013, “Outlook for Interest Rates and Japanese Banks’ Risk Exposures under Abenomics” IMF Working Paper No. 13/213.
Berkmen, P., 2012, “Bank of Japan’s Quantitative and Credit Easing: Are They Now More Effective?” IMF Working Paper No. 12/2.
Berkmen, P., 2011, “The Impact of Fiscal Consolidation and Structural Reforms on Growth in Japan,” IMF Working Paper No. 11/13.
Botman, D., 2015, “Lessons Learned from Two Decades of Monetary Policies” in Can Abenomics Succeed?: Overcoming the Legacy of Japan’s Lost Decades, edited by D. Botman, S. Danninger, and J. Schiff. Washington D.C.: International Monetary Fund, 2015.
Botman, D. and J. S. Kang, 2015, “Japan’s Role in the Global Economy and Spillover Effects of Abenomics” in Can Abenomics Succeed?: Overcoming the Legacy of Japan’s Lost Decades, edited by D. Botman, S. Danninger, and J. Schiff. Washington D.C.: International Monetary Fund, 2015.
Botman, D., I. de Carvalho Filho, and R. W. Lam, 2013, “The Curious Case of the Yen as a Safe Haven Currency: A Forensic Analysis,” IMF Working Paper No. 13/228.
Danninger, S. and C. Steinberg, 2012, “Japan’s Growth Challenge: What Needs to Be Done and What Can Be Achieved?” in Japan: Selected Issues Paper, IMF Country Report No. 12/209.

JAPAN
14 INTERNATIONAL MONETARY FUND
De Mooij, R. and I. Saito, “Japan’s Corporate Income Tax: Facts, Issues and Reform Options,” IMF Working Paper No. 14/138.
Ganelli, G. and Tawk, N., 2016, “Spillovers from Japan’s Unconventional Monetary Policy to Emerging Asia: A Global VAR approach,” IMF Working Paper No. 16/99.
Ganelli, G. and N. Miake, 2015, “Foreign Help Wanted: Easing Japan’s Labor Shortages,” IMF Working Paper No. 15/181.
International Monetary Fund, 2011, “Japan: 2011 Spillover Report-Selected Issues,” IMF Country Report No. 11/183.
Kang, J. S., 2014, “Balance Sheet Repair and Corporate Investment in Japan,” IMF Working Paper No. 14/141.
Kang, J. S. and S. Piao, 2015, “Production Offshoring and Investment by Japanese Firms,” IMF Working Paper No. 15/183.
Kashiwase, K., M. Nozaki, and K. Tokuoka, 2012, “Pension Reforms in Japan,” IMF Working Paper No. 12/285.
Keen, M., K., M. Pradhan, and R. A. Mooij, 2011, “Raising the Consumption Tax in Japan: Why,When, How?” IMF Staff Discussion Note No. 11/13.
Kinoshita, Y. and F. Guo, 2015, “What Can Boost Female Labor Force Participation in Asia?” IMF Working Paper No. 15/56.
Lam, R. W., 2013, “Cross-border Activity of Japanese Banks,” IMF Working Paper No. 13/235.
Lam, R. W. and J. Shin, 2012, “What Role Can Financial Policies Play in Revitalizing SMEs in Japan?,” IMF Working Paper No. 12/291.
Lam, R. W. and K. Tokuoka, 2011, “Assessing the Risks to the Japanese Government Bond (JGB) Market,” IMF Working Paper No. 11/292.
Lam, R. W., 2011, “Bank of Japan’s Monetary Easing Measures: Are They Powerful and Comprehensive?” IMF Working Paper No. 11/264.
Nozaki, M., K. Kashiwase, and I. Saito, 2014, “Health Spending in Japan: Macro-fiscal Implications and Reform Options,” IMF Working Paper No. 14/142.
Porcellacchia, D., 2016, “Wage-Price Dynamics and Structural Reforms in Japan,” IMF Working Paper No. 16/20.
Sher, G., 2014, “Cashing in for Growth: Corporate Cash Holdings as an Opportunity for Investment and Growth in Japan,” IMF Working No. 14/221.

JAPAN
INTERNATIONAL MONETARY FUND 15
Shibata, I., 2013, “Is Labor Market Mismatch a Big Deal in Japan?” IMF Working No. 13/196.
Steinberg, C. and M. Nakane, 2012, “Can Women Save Japan?” IMF Working Paper No. 12/248.
———, 2011, “To Fire or to Hoard? Explaining Japan’s Labor Market Response in the Great Recession,” IMF Working Paper No. 11/15.
Syed, M. and J. Lee, 2010, “Japan’s Quest for Growth: Exploring the Role of Capital and Innovation,” IMF Working Paper No. 10/294.
Tokuoka, K., 2010, “Rebalancing in Japan: The Role of Private Consumption,” IMF Working Paper No. 10/293.
———, 2010, “The Outlook for Financing Japan’s Public Debt,” IMF Working Paper No. 10/19.
———, 2012, “Intergenerational Implications of Fiscal Consolidation in Japan,” IMF Working Paper No. 12/197.
Yamaoka, H. and M. Syed, 2010, “Managing the Exit: Lessons from Japan’s Reversal of Unconventional Monetary Policy,” IMF Working Paper No. 10/114.

JAPAN
16 INTERNATIONAL MONETARY FUND
LABOR MARKET AND WAGE DEVELOPMENTS1 Japan’s labor market tightened considerably based on standard metrics. Still wage growth is only gradually picking up. A combination of cyclical and structural factors seem to be at play: a) residual slack in the economy—mainly due to a weak recovery in the manufacturing sector—is putting downward pressure on wages as employment is concentrated in the less productive services sectors and dominated by part-time employees; b) a trend increase in female labor force participation and the reversal of the cyclical decline in participation after the crisis could be dampening wage growth; c) structural characteristics of the Japanese labor market—the low horizontal mobility of regular workers, an industrial relations system emphasizing employment stability over wage increases, and limited wage bargaining power—tend to reduce wage pressures even in the face of a tight labor market. The labor market is projected to tighten further in the medium-term but weak demand prospects, coupled with a sluggish outlook for the manufacturing sector will continue to dampen wage growth in the near term.
A. Introduction
Japan’s labor market has tightened considerably in recent years based on a range of standard metrics. The unemployment rate has declined among all age groups and types of unemployed (e.g., long-term unemployed, involuntarily unemployed). At 3.3 percent it is below its pre-global financial crisis (GFC) trough of 3.7 percent. Alternative measures of labor underutilization taking into account discouraged workers, workers who are marginally attached to the labor force and part-time employment due to economic reasons all confirm a significant reduction in labor market slack.2 Furthermore, long-term unemployed and part-time engaged for economic reasons showed a cyclical increase during the GFC.3 Other indicators such as vacancy rates, the job applicant-to-openings ratio, and survey-based measures all indicate a considerable tightening in the labor market (Figure 1). Nonetheless, wages have remained sluggish, complicating efforts to durably exit from deflation and achieve stronger private-sector led growth.
1 Prepared by Elif Arbatli (APD). 2 Workers who are marginally attached to the labor force are those who currently are neither working nor looking for work but indicate that they want a job and have looked for work sometime in the past 12 months. Discouraged workers, a subset of the marginally attached, have given a job-market related reason for not currently looking for work. Persons employed part time for economic reasons are those who work less than 35 hours per week and want to work more hours. 3 Naganuma and Uno (2016) find that long-term unemployed (unemployed for more than one-year) do not have a significant effect on nominal wages in Japan.
0
2
4
6
8
10
12
14
16
2002Q1 2003Q4 2005Q3 2007Q2 2009Q1 2010Q4 2012Q3 2014Q2 2016Q1
U1:Unemployed more than 3 monthsU2: Unemployment Rate (official)U3: U2+ Discouraged WorkersU4: U2+ Marginally AttachedU5: U4+part-time for economic reasons
Alternative Measures of Labor Underutilization(In percent)
Sources: Japan Labor Force Survey; and IMF staff calculations.

JAPAN
INTERNATIONAL MONETARY FUND 17
Figure 1. Japan: Labor Market Indicators Unemployment declined considerably…. …among all age-groups, especially the 15-24 year old.
The vacancy rate and ratio of job openings to applicants
indicate tightening labor market conditions…
…as do enterprise surveys of employment conditions,
especially among small and medium-sized firms.
Increasing tightness in the labor market coincided with the narrowing of the output gap, but there remains residual slack in the economy reflecting a slower recovery in the manufacturing sector. Although estimates of the output gap are highly uncertain, a range of estimates indicates it is still mildly negative, or at least not positive. Employment has recently reached its pre-crisis level, but its composition has shifted towards part-time workers, which accounts for the considerable decline in total hours worked. A low sensitivity of employment indicators to the cyclical position as well as labor market rigidities and mismatches could help explain the observed tightness in the labor market amid overall slack in the economy:
0
1
2
3
4
5
6
7
1984 1987 1990 1993 1996 1999 2002 2005 2008 2011 2014
Unemployed - Other Reasons
Unemployed - Involuntary
Unemployed - Involuntary (due to employer)
Unemployed - Involuntary and Other(In percent of labor force)
Source: Japan Statistics Bureau
0
2
4
6
8
10
12
1970Q1 1976Q1 1982Q1 1988Q1 1994Q1 2000Q1 2006Q1 2012Q1
15-24 25-34
35-44 45-54
55-64 65 and older
Source: Haver Analytics.
Age-specific Unemployment Rates(In percent, share of labor force in age group)
2015Q4
0.0
0.2
0.4
0.6
0.8
1.0
1.2
1.4
1.6
1.8
2.0
0
0.5
1
1.5
2
2.5
3
3.5
4
1970Q1 1976Q1 1982Q1 1988Q1 1994Q1 2000Q1 2006Q1 2012Q1
Vacancy Rate
Ratio of Job Job Openings to Applicants (RHS)
Vacancy Rate and Ratio of Job Openings to Applicants(In percent, ratio)
Source: Haver Analytics.
2015Q4
-25
-20
-15
-10
-5
0
5
10
15
20
25
30
2003Q4 2005Q2 2006Q4 2008Q2 2009Q4 2011Q2 2012Q4 2014Q2 2015Q4
Large enterprises Medium-sized enterprisesSmall enterprises
Employment Conditions by Size of Enterprise(diffusion index, "excess" minus "shortage")
Source: Bank of Japan "Tankan Survey".
90
92
94
96
98
100
102
104
2007Q1 2009Q3 2012Q1 2014Q3
Real GDPTotal Hours Worked (Non-agriculture)Total Employment (Non-agriculture)
Japan- Real GDP, Employment and Hours Worked(level, 2007Q1=100)
Sources: Haver Analytics; and IMF staff calculations.
2015Q4

JAPAN
18 INTERNATIONAL MONETARY FUND
A weak relationship between unemployment and output in Japan: Estimates of Okun’s Law suggest that a 10 percent increase in output reduces unemployment by 1.2 percentage points based on Steinberg and Nakane (2011), which is lower than estimates for other G7 countries with an estimated response of about 4 percentage points.4 Indeed unemployment in Japan did not increase as much during the GFC, despite the relatively large decline in output. Steinberg and Nakane (2011) relate this feature of Japan’s labor market to the strong employment protection enjoyed by regular workers and high wage flexibility (owing to a relatively high share of bonus payments in total compensation). This suggests that in economic downturns firms tend to hoard labor, reducing work hours and wages rather than employment. In the recovery phase, the decline in the unemployment rate may hide residual labor market slack and not necessarily signal a strong cyclical recovery, consistent with the still-negative output gap and the fact that the unemployment rate has only recently reached its structural level based on some estimates (Figure 2)5.
Figure 2. Japan: Beveridge Curve and Structural Unemployment Beveridge Curve (BC) has shifted out during the 1990s and
in since the GFC together with a movement along the BC.
Structural unemployment using the BC suggests that the
unemployment gap has only recently closed.
Labor market mismatches: There is some evidence that labor market mismatches have
increased—consistent with a shift in the Beveridge Curve in the 1990s—leading to a higher vacancy rate for a given level of unemployment (Figure 2).6 Recent staff analysis also points to
4 Steinberg and Nakane (2011) find that the response of unemployment to output is asymmetric and depends on the position in the cycle, with a larger response in downturns (a coefficient of 0.24) than in recoveries (a coefficient of 0.12). See Balakrishnan, Das, and Kannan (2010) for G7 estimates. 5 One approach following Hara et. al. (2006) is to calculate “structural” unemployment over time using the position of unemployment and the vacancy rate at any point in time relative to the 45-degree line and assuming a similar slope as observed during 1988-1993 to compute the level of structural unemployment. To control for the impact of demographic changes on the unemployment rate over time, we conduct this exercise using a demographics-adjusted unemployment rate constructed by holding the age-composition labor force constant over time (at 1990 levels). 6 Findings in Shibata (2013) indeed suggest an important role for labor market mismatches in Japan.
2000Q12000Q2
2000Q32000Q42001Q12001Q22001Q3
2001Q42002Q12002Q22002Q32002Q42003Q12003Q2
2003Q32003Q42004Q1
2004Q22004Q3
2004Q42005Q12005Q22005Q32005Q42006Q12006Q22006Q32006Q42007Q12007Q22007Q3
2007Q42008Q1
2008Q22008Q3
2008Q4
2009Q1
2009Q2 2009Q32009Q42010Q12010Q2
2010Q32010Q4
2011Q12011Q22011Q32011Q42012Q1
2012Q22012Q32012Q42013Q12013Q2
2013Q32013Q42014Q12014Q22014Q32014Q42015Q12015Q22015Q32015Q4
1
1.5
2
2.5
3
3.5
4
4.5
5
5.5
6
1 2 3 4 5 6
Vaca
ncy
Rate
Unemployment Rate
2000-2015
1970s
1980s
1990s
Japan - Beveridge Curve(In percent)
Sources: Haver Analytics; and IMF staff calculations
0
1
2
3
4
5
6
1975Q1 1981Q1 1987Q1 1993Q1 1999Q1 2005Q1 2011Q1
Unemployment (demographics-adjusted)Unemployment - Structural
Unemployment Rate and Gap(In percent)
Sources: Haver Analytics; and IMF staff calculations.
2015Q4

JAPAN
INTERNATIONAL MONETARY FUND 19
increasing labor shortages in the services and construction sectors and among specialists and technicians (Ganelli and Miake (2015)).
B. The Rise of Non-Regular Employment
Hourly wages have stagnated since the GFC, rising only gradually over the past couple of years. While some sectors continued to have positive wage growth (e.g., manufacturing, construction, wholesale and retail trade, communication), others stagnated (medical and health care, finance). Wages of part-time employees have fared better during the GFC, which probably reflects the limited scope to reduce wages given the already low levels of compensation for part-time workers and a lower share of variable compensation in total compensation (for example in the form of bonuses). More recently, the pick-up in wage growth has been more visible in sectors facing higher labor shortages (construction, accommodation and eating) and sectors with higher labor productivity (scientific research, manufacturing). Part-time workers have enjoyed higher wage growth since 2013 (increasing by 1.2 percent since end-2013, compared to a 0.3 percent increase for full-time employees), which probably reflects the rising demand for part-time workers and the stronger cyclical pick-up in the services sector (Figure 3).
-1.5
-1
-0.5
0
0.5
1
1.5
2
2.5
3
3.5
-2 -1.5 -1 -0.5 0 0.5
Real
com
pens
atio
n pe
r hou
r (an
nual
ized
q/q
ra
te, M
A o
f 4 q
uart
ers)
Unemployment Rate Gap
1981Q1-1994Q4 1995Q1-2014Q4
2015Q1-2015Q4
Real Compensation Growth and Unemployment Gap(In percent)
Sources: Haver Analytics; and IMF staff calculations

JAPAN
20 INTERNATIONAL MONETARY FUND
Figure 3. Japan: Wage Developments Hourly wages stagnated since the GFC. More recently there is some pick-up in wages….
...driven by sectors facing labor shortfalls and with higher productivity.
Contractual (excluding bonus) wage growth turned positive only recently with higher wage growth for part-time workers.
Composition effects (manufacturing versus services) are dampening wage growth, with the rising share of part-time workers playing a central role:
Two-speed recovery and the rising employment share of the non-manufacturing sector with lower labor productivity and wages: The great recession had a much larger impact on Japan’s manufacturing sector given declining external demand, a strong yen, and declining export prices. A sectoral breakdown of output and factor utilization since the crisis reveals continued residual slack in the manufacturing sector, while the services sector has performed relatively better (Figure 4). While the shift in employment towards services has been ongoing for some time, dampening wage growth (Sommer, 2009), this trend has accelerated during the post-crisis period with the two-speed recovery. Employment in both the manufacturing and the non-manufacturing sector declined during 2007–09, but while employment recovered in the non-manufacturing sectors since 2009, the manufacturing sector continued to shed employees. Comparing changes in employment for regular versus part-time employees, the differences are striking. Manufacturing has responded to the crisis by reducing its full-time employees, while the non-manufacturing sector substituted part-time workers for regular workers at the peak of the crisis, but afterwards started to employ both full-time and part-time workers. The higher
80
85
90
95
100
105
110
2005Q1 2007Q3 2010Q1 2012Q3 2015Q1
All Industries manufacturingconstruction electricity and gasinformation/communication transportwholesale/retail trade financemedical/health care
Hourly Wages by Sector (2005Q1=100)
Sources: Haver Analytics; and IMF Staff calculations.
2016Q1-2
-1.5
-1
-0.5
0
0.5
1
1.5
2006Q1 2007Q2 2008Q3 2009Q4 2011Q1 2012Q2 2013Q3 2014Q4 2016Q1
Total Earnings by Employee Total Earnings per hourReal Earnings per hour
Source: Haver Analytics.
Nominal and Real Cash Earnings Growth(YoY; in percent)
-4
-3
-2
-1
0
1
2
3
All
Indu
strie
s
Scue
ntifi
c Re
sear
ch
Com
poun
d Se
rvic
es
Elec
tric
ity/U
tiliti
es
Cons
truc
tion
Acc
omod
atio
n/Ea
ting
Man
ufac
turin
g
Fina
nce
and
Insu
ranc
e
Who
lesa
le a
nd R
etai
l Tra
de
Info
rmat
ion/
Com
mun
icat
ion
Educ
atio
n
Med
ical
and
Hea
lth C
are
Tran
spor
t
Real
Est
ate
& G
oods
Ren
tal
Pers
onal
/Am
usem
ent
Serv
ices
Min
ing
Hourly Wage Growth by Sector 2015-2013(In annual average percent)
Sources: Haver Analytics; and IMF staff calculations
86
88
90
92
94
96
98
100
102
104
2007Q1 2008Q2 2009Q3 2010Q4 2012Q1 2013Q2 2014Q3 2015Q4
Total Earnings (per full-time employee)Total Earnings (per half-time employee)Contractual Earnings (per employee)
Different Measures of Earnings(4 quarter MA of total earnings, 2007=100)
Sources: Haver and IMF staff calculations

JAPAN
INTERNATIONAL MONETARY FUND 21
level of and growth in labor productivity and wages in the manufacturing sector imply that the rising share of non-manufacturing employment has been putting continued downward pressure on wages since the GFC.
Figure 4. Japan: Sectoral Composition of Growth and Employment
There is still residual slack in the manufacturing sector… …while the non-manufacturing sector is facing tighter employment conditions….
Full-time employment declined during the GFC, and subsequent growth has been only in non-manufacturing.…
…and concentrated among part-time employees.
General increase in the share of part-time employment: The increasing share of part-time employment has been a key determinant of declining average wage growth (Figure 5). This phenomenon goes beyond sectoral composition effects. In fact, only 1 percentage point of the increase in the part-time employment share since 2007 can be explained by the change in the composition of employment towards sectors that already had higher part-time employment. The remaining 4 percentage points increase reflects the rising part-time employment within individual industries.
-10
-5
0
5
10
15
20
25
30
35
40
2003Q4 2006Q2 2008Q4 2011Q2 2013Q4
manufacturing non-manufacturing
Tankan Enterprise Survey: Capacity Utilization(diffusion index, excess-tight)
Source: Tankan Survey, Bank of Japan.
2016Q1
-30
-20
-10
0
10
20
30
40
50
2003Q4 2007Q1 2010Q2 2013Q3
manufacturing non-manufacturing
Tankan Enterprise Survey: Employment Conditions(diffusion index, excess-shortage)
Source: Tankan Survey, Bank of Japan.
2016Q1
-1000
-500
0
500
1000
1500
2000
2500
3000
35002007-2009 2009-2015
Change in Full-time Employees by Sector(In thousands of persons)
Source: Haver Analytics.
-1000
-500
0
500
1000
1500
2000
2500
3000
35002007-2009 2009-2015
Change in Part-time Employees by Sector(In thousands of persons)
Source: Haver Analytics.

JAPAN
22 INTERNATIONAL MONETARY FUND
Figure 5. Japan: Part-time Employment The increasing share of part-time employment is putting downward pressure on aggregate wages….
…driven by changes in the sectoral composition of employment…
…and in the share of part-time employment within individual sectors.
Demand factors seem to have been at play as well reflected in the increasing openings for part-timers.
Consistent with the findings in Sommer (2009) and Steinberg and Nakane (2011), updated estimates of the impact of the aging of working adults using a constant age-earnings profile suggest no negative impact given that the increase in older workers with lower wages is offset by an increase in workers in their peak-earning years and a decline in young workers with similarly low earnings.
C. Sluggish Wage Growth
Lack of strong wage pressures could reflect residual slack in the labor market, associated with a rise in labor force participation. In particular:
A reversal of the cyclical decline in the labor force participation rate (LFPR). LFPR declined during the 1997, 2001, and 2008 recessions. However, considering structural changes such as the age composition of the population and the trend increase in female LFPR are important for its behavior over the cycle. Figure 6 (first and second charts) shows that aging of the work force has indeed put downward pressure on the LFPR for both male and female workers, contributing to a
27
29
31
33
35
37
-3
-2
-1
0
1
2
3
2001Q4 2003Q4 2005Q4 2007Q4 2009Q4 2011Q4 2013Q4 2015Q4
Changes in part-time wagesComposition effect
Change in full-time wages
Share of nonregular workers (right side) 1/
Sources: Haver Analytics; and IMF staff estimates.1/ Yearly Average.
Nonregular Workers and Wage Growth (YoY; in percent) (In percent of staff)
0
0.1
0.2
0.3
0.4
0.5
0.6
-150-100
-500
50100150200250
Change in Employment (2007-2015)Share of part-time to full-time in 2007 (RHS)
Change in Employment and Share of Part-time Workers(In ten thousand person and share)
Sources: Japan Statistics Bureau, Labor Force Survey.
00.010.020.030.040.050.060.070.080.090.1
0
0.1
0.2
0.3
0.4
0.5
0.6 Share of part-time in 2007Increase in Share of Part-time 2007-2015
Share of Part-time Employment(share)
Source: Japan Labor Force Survey.
0
100
200
300
400
500
600
700
800
900
1000
1970Q1 1977Q1 1984Q1 1991Q1 1998Q1 2005Q1 2012Q1
New Job Openings
New Job Openings exc. Part-time workers
New Job Openings(In thousands of persons)
Source: Haver Analytics.
2015Q4

JAPAN
INTERNATIONAL MONETARY FUND 23
decline of close to 3 percentage points since 2007.7 The male LFPR has declined more than explained by demographics alone, while the opposite is true for the female LFPR which has increased despite the downward pressure from aging. The increase in female LFPR could be due to structural factors such as improvements in the availability of childcare and more flexible working hours, but it could also reflect cyclical factors if for instance more women decide to join the labor force to support household income.8 Staff estimates using prefectural level data suggests a modest but statistically significant impact of cyclical conditions on LFPRs, accounting for a decline of about 0.4 percentage points during 2007–15 at the aggregate level.9
Trend increase in labor force participation rates among female and older workers. Although Japan’s working-age population is declining, there has been a significant increase in the labor force participation rate, especially for female workers among all age groups and more recently for older workers. While there could be a cyclical element in the increase in LFPR among certain groups, a continued trend increase in participation rates due to structural factors could contribute to labor market slack.10
7 Figures show the impact of the changing age composition of the labor force, holding the level of age-specific LFPRs constant at their 2007 level, and projecting aggregate LFPR based on actual population dynamics. 8 Kawata and Naganuma (2010) note that there were both “discouraged worker” and “household assistance” effects in Japan’s LFPR behavior after the GFC. 9 The estimates use prefectural data to exploit heterogeneity in cyclical conditions. The degree of cyclical downturn is proxied using the percentage change in employment during 2007–09 which was regressed on the change in LFPR during 2007–15, controlling for prefecture-level changes in the population’s age composition. 10 Recent work on the employment of older workers in Japan suggests that there is scope to further raise the labor force participation of this group (Ganelli and Miake (2016)).

JAPAN
24 INTERNATIONAL MONETARY FUND
Figure 6. Japan: Labor Force Participation Aging explains the trend decline in male LFPR but there appears to be a cyclical decline during the GFC as well.
Female LFPR increased significantly, despite the downward pressure from aging.
Male LFPR of all age groups declined during the GFC, with the 55-64 year olds showing a strong pick-up post-GFC.
The trend increase in female LFPR holds across all age groups and an acceleration is visible post-GFC.
LFPR of older male… …and female workers have increased since the GFC.
Source: Haver Analytics.
68
69
70
71
72
73
74
2007Q1 2008Q3 2010Q1 2011Q3 2013Q1 2014Q3
Demographics Actual
Male Labor Force Participation Rate(In percent)
2015Q443
44
45
46
47
48
49
50
51
2007Q1 2008Q3 2010Q1 2011Q3 2013Q1 2014Q3
Demographics Actual
Female Labor Force Participation Rate(In percent)
2015Q4
80
81
82
83
84
85
86
87
93
93
94
94
95
95
96
96
97
97
98
2005Q1 2007Q4 2010Q3 2013Q2
25-34 35-44 45-54 55-64 (RHS)
Male LFPR - Different Age Groups(In percent)
2015Q446
48
50
52
54
56
58
60
62
60
62
64
66
68
70
72
74
76
78
2005Q1 2007Q4 2010Q3 2013Q2
25-34 35-44 45-54 55-64 (RHS)
Female LFPR - Different Age Groups(In percent)
2015Q4
37
38
39
40
41
42
43
44
45
46
47
25
26
27
28
29
30
31
32
2005Q1 2007Q4 2010Q3 2013Q2
65 and older 15-24 (RHS)
Male LFPR - Different Age Groups(In percent)
2015Q410.0
11.0
12.0
13.0
14.0
15.0
16.0
39
40
41
42
43
44
45
46
2005Q1 2007Q4 2010Q3 2013Q2
15-24 65 and older (RHS)
Female LFPR - Different Age Groups(In percent)
2015Q4

JAPAN
INTERNATIONAL MONETARY FUND 25
Structural characteristics of the Japanese labor market tend to dampen wage growth even in the face of a tight labor market. These include:
The low horizontal mobility of regular workers. Under Japan’s lifetime employment system, a wage increase in competitor firms may not create wage pressure, because workers are unlikely to switch jobs. By the same token, firms do not have incentives to raise wages to try to fill positions. In addition, Japanese regular workers are typically hired as generalists. They are expected to work in several different positions and duty stations within the company. This employment model reduces incentives and needs for firms to increase wages to attract workers from outside to fill specific positions, because existing workers can be reassigned.
An industrial relations system emphasizing employment stability over wage increases. Unions and workers have been willing to accept wage moderation in exchange for low unemployment and employment stability (of regular workers).
Limited wage bargaining power. Japan’s labor market is characterized by extreme duality. In the past, most workers were hired under life-time contracts. Wage bargaining took place at the firm level in coordinated industry-wide bargaining rounds, the so-called Shunto (Box 1). However, with the rapid rise in the share of non-regular workers, the importance of the Shunto has waned. Unionization rates have declined and labor conflicts have all but disappeared, suggesting a fall in the wage bargaining power of labor. As a further indication, real wages have not kept up with productivity over the past two decades, more so than in most comparable economies. These developments have contributed to Japan slipping into and staying in a liquidity trap (Porcellachia (2016)).
Low actual and expected inflation have contributed to stagnant nominal wages. An entrenched deflationary mindset and backward-looking inflation expectations are generating weak nominal wage growth. Unions and employees look at past headline inflation in their negotiations, rather than setting wages in anticipation of higher future prices. Public wage setting takes the same approach following developments in the private sector rather than leading in line with the authorities’ inflation targets.
D. Conclusions
Japan’s labor market has tightened considerably, but wage growth remains subdued. A combination of cyclical and structural factors seem to be at play, including a weak recovery in the manufacturing sector, a shift towards the less productive services sectors, a rising share of part-time employees, a trend increase in female labor force participation, as well as structural characteristics of the Japanese labor market—the low horizontal mobility of regular workers, an industrial relations system emphasizing employment stability over wage increases, and limited wage bargaining power. Although, the labor market is projected to tighten further in the medium-term, without addressing these bottlenecks, wage-price dynamics will only very gradually strengthen.

JAPAN
26 INTERNATIONAL MONETARY FUND
Box 1. Wage Setting in Japan 1 Private Sector Wages
Japan’s wage setting mechanism, the so-called Shunto, is an annual synchronized wage negotiation exercise. Although wages are formally determined by negotiations between individual companies and their enterprise unions, there is a strong demonstration effect from a handful of firms in major industries (e.g., automobiles and electronics), affecting the entire economy.
The Shunto system was developed in the 1950s to boost the bargaining power of unions through industry-wide simultaneous negotiations, but its influence has been waning in recent years. With the rise of the share of non-regular workers and reduced reliance on seniority-based wage increases, the influence of Shunto negotiations has been decreasing. Nominal overall wage growth was negative in most years from the late 1990s, despite Shunto wage growth remaining constant at about 2 percent (chart). Many workers in companies not directly included in the Shunto received less than what agreed in the negotiations. The 2015 Shunto resulted in average wage growth of 2.2 percent for large enterprises and 1.9 percent for SMEs, compared to the union request for a hike of 3.7 percent. The early results of the 2016 Shunto suggest weaker base pay hikes relative to last year.
The government has become involved directly in discussions on wages with employers and trade unions through the Tripartite Commission (TC). Through the TC, the government has been exerting “moral suasion”, by explicitly asking profit-making companies to increase wages. While this strategy has probably contributed to the positive nominal wage growth observed recently, it is not delivering the substantial wage growth which Japan needs to get out of deflation.
Public Sector and Minimum Wages
Under the current institutional arrangements, the government has limited room in influencing average wage growth through public worker wage increases, since the latter follow those in the private sector. Every year, the National Personnel Authority (NPA) publishes a recommendation for public wage hikes, which is expected to ensure appropriate remuneration of public employees in accordance with general social conditions. In practice, the recommendation implies that wage developments in the public sector follow those in the private sector.
In November 2015, the Abe administration called for raising the minimum wage by 3 percent per year, as part of its efforts to increase the nominal GDP to JPY 600 trillion (see also Chapter 3). Japan has a minimum wage system which, although set at the prefectural level, can be significantly influenced by the central government. The Central Minimum Wage Council, an advisory body for the Ministry of Health, Labor and Welfare, makes recommendations on prefectural minimum wage increases. Based on the panel’s recommendations and taking local conditions into consideration, local councils decide on the actual minimum wage level for each prefecture. Although the recommendation by the central council is not legally binding, in practice it provides a lower bound. The announced intention to raise the minimum wage by 3 percent per year, which will result in a hike from JPY 798 per hour to over JPY 1,000 by fiscal year 2023, seems an ambitious target in a historical perspective (see chart). Staff estimates suggest that increasing the minimum wage can help boost average wage growth: a 1 percent increase in minimum wage growth is estimated to increase average wage growth by about ½ percentage points (Aoyagi, Ganelli and Tawk, 2016).
1 Prepared by Chie Aoyagi, Giovanni Ganelli, Naoko Miake, and Nour Tawk.
0
1
2
3
4
5
6
400
450
500
550
600
650
700
750
800
850
900
1990 1995 2000 2005 2010 2015
Average Minimum Wage(In yen; per hour)
minimum wage (LHS) yoy growth % (RHS)
Source: Ministry of Health Labour and Welfare
-6
-4
-2
0
2
4
6
8
1990 1995 2000 2005 2010 2015
Wage Growth
Shunto wage growth Nominal wage growth
Source: Ministry of Health, Labor and Welfare

JAPAN
INTERNATIONAL MONETARY FUND 27
References
Aoyagi, C., G. Ganelli, and N. Tawk, 2016, “Minimum Wages as a Policy Tool,” forthcoming IMF Working Paper.
Balakrishnan, R, M. Das and P. Kannan, “Unemployment Dynamics during Recessions and Recoveries: Okun's Law and Beyond,” World Economic Outlook, April 2010, World Economic and Financial Surveys (Washington).
Ganelli, G. and N. Miake, 2015, “Foreign Help Wanted: Easing Japan’s Labor Shortages,” IMF working Paper 15/181.
———, 2016, “A Silver Lining?: Elderly Employment in Japan,” forthcoming IMF Working Paper.
Hara, N., N. Hirakata, Y. Inomata, S. Ito, T. Kawamoto, T. Kurozumi, M. Minegishi and I. Takagawa, 2006, “The New Estimates of Output Gap and Potential Growth Rate,” Bank of Japan Review, 2006-E-3.
Kawata, H. and S. Naganuma, 2010, “Labor Force Participation Rate in Japan,” Bank of Japan Review, 2010-E-7.
Naganuma, S. and Y. Uno, 2016, “Long-term Unemployment in Japan”, Bank of Japan Research LAB No. 16-E-1, April 13, 2016.
Porcellachia, D., 2016, “Wage-Price Dynamics and Structural Reforms in Japan,” IMF Working Paper 16/20.
Shibata, I, 2013, “Is Labor Market Mismatch a Big Deal in Japan?” IMF Working Paper 13/196.
Sommer, M. 2009, “Why Are Japanese Wages So Sluggish?” IMF Working Paper 09/97.
Steinberg, C. and M. Nakane, 2011, “To Fire or to Hoard? Explaining Japan’s Labor Market Response in the Great Recession,” IMF Working Paper 11/15.

JAPAN
28 INTERNATIONAL MONETARY FUND
MININUM WAGES AS A POLICY TOOL1 In order to revamp growth and permanently exit deflation, Japan needs vigorous wage growth. The government has recognized this and announced substantial increases in the minimum wage and we empirically estimate its impact on average wages. Our econometric results suggest that the 3 percent hourly minimum wage increase could cause monthly wages to increase by about 1.5 percent on a year-on-year basis. The minimum wage policy should be complemented by other income policies—e.g. a “soft target” for wage growth and increases in public wages to create cost-push pressures in line with the inflation target.
A. Introduction
While Japan has maintained relatively strong productivity growth through the “lost decades,” real wage growth has lagged behind. Sluggish wage growth reflects cyclical and structural factors, including the rapid emergence of low-paid non-regular workers, whose share gradually rose to almost 40 percent of the labor force. Weak wage-price dynamics despite a very tight labor market weakens consumption and hampers the attainment of the inflation target.
In September 2015, the Abe administration called for a substantial rise in the minimum wage as part of its efforts to stimulate wage growth. In Japan, minimum wages are set at the prefectural level, but they can be substantially influenced by the central government. Hence, the government’s proposal is expected to translate into an increase of 3 percent per year between now and 2023, which would hike the national weighted average of the hourly minimum wage from 798 to 1,000 yen. The 3 percent increase in the minimum wage is an ambitious objective compared to the dynamics during the last two decades (Table 1).
While the absolute level of the minimum wage in Japan is comparable to that of other developed countries, its level relative to the average wage of full-time workers is low. Existing estimates of
1 Prepared by Chie Aoyagi, Giovanni Ganelli, and Nour Tawk (all OAP).
-20%
-15%
-10%
-5%
0%
5%
10%
15%
1991 1993 1995 1997 1999 2001 2003 2005 2007 2009 2011 2013 2015
Nominal Wages growth Productivity ( in Manufacturing) growth
Wages and Productivity Growth
Source: Haver Analytics.
-2%
0%
2%
4%
6%
8%
10%
12%
1976 1980 1984 1988 1992 1996 2000 2004 2008 2012
Real MW Nominal MW
2015
Evolution of the Minimum Wage in Japan
Source: Ministry of Health, Labour and Welfare (MHLW).

JAPAN
INTERNATIONAL MONETARY FUND 29
people at (or around the) minimum wage vary widely but could be around 10 percent of all workers, while covering a considerably higher share of part-time workers.
Higher minimum wages most directly impact workers at the lower end of the wage distributions. Given Japan’s high share of non-regular workers, this suggests that a significant number of employees’ wages could be affected. Eyeballing the data also suggests that there is correlation between the minimum and average wage growth, although causality needs to be established by a more rigorous empirical analysis, which we present in next section.
B. Empirical Strategy and Results
In our empirical analysis, we exploit the variability of the minimum wage over time and across prefectures. Our panel data comprises yearly data for the 47 prefectures of Japan, from 1997 until 2014. The dependent variable is the hourly real average wage and explanatory variables include: the minimum wage, the unemployment rate, the consumer price index (CPI) level, real GDP, the share of part-time work applicants (as a proxy for labor market duality), the share of unemployment in manufacturing, and the average age of workers (male, female).
Since standard tests confirmed the existence of endogeneity between minimum wages and average wages, we employed a two-stage least squares regression using as instruments for the minimum wage the ratio of male and female applicants to social welfare in each prefecture to the total amount of applicants to social welfare in Japan. Given an overall coefficient close to 0.5 (see Table 1), our results suggest that the planned annual increase of 3 percent in the minimum wage could raise average wages by 1.5 percent on a year-on-year basis.
C. Policy Implications
The 1.5 percent annual increase in average wages resulting from the minimum wage policy would be a significant boost to wage growth, but it would still fall short of what is needed to engender the kind of wage-price dynamics that Japan needs to reach escape velocity form deflation. Given the BoJ inflation target of 2 percent, and assuming productivity growth of 1 percent, wage growth of 3
0
5
10
15
20
25
30
35
40
-139.9 140.0-199.9
200.0-259.9
260.0-319.9
320.0-399.9
400.0-599.9
600.0-899.9
900.0-
Male Female
Monthly Wage Distribution for Full-time Workers(Monthly wage in thousand yen; % of total number of workers)
Sources: Ministry of Health Labor and Welfare; and IMF staff calculations.

JAPAN
30 INTERNATIONAL MONETARY FUND
percent would seem desirable for Japan. The policy implication of our analysis is therefore that, while the minimum wage increase policy announced by the authorities is helpful in stimulating wage growth, it should be complemented by other income policies—e.g. a “soft target” for wage growth and increases in public wages.
Table 1. Wage Determinants in Japan (Prefectural Panel), Regression Results Using Instrumental Variables. (hourly), in Logs
Period : 1997–2014 Dep. Variable:Real wages (total)
Dep. Variable:Real wages (Women)
Dep. Variable: Real wages (Men)
Minimum Wage 0.48**(1.92)
0.42**(2.28)
0.66**(2.42)
CPI Inflation -0.008**(-2.36)
-0.001(-0.31)
0.01**(02.31)
Prefectural GDP 0.0003 ***(4.33)
0.0004*** (6.20)
0.0004***(5.09)
Share of part-time workers
-0.09(-0.99)
0.12**(1.65)
-0.1 (-0.85)
Unemployment Rate -0.009*(-1.75)
0.002(0.52)
0.01*(1.69)
Share of employment in manufacturing
0.002***(3.52)
0.001*(1.78)
0.003***(3.21)
Average female age -0.03***(-6.22)
-0.02***(-5.00)
---
Average male age 0.04***(5.28)
--- 0.03***(4.27)
Constant -2.41
(-1.30) -1.93
(-1.36) -6.23**(-3.14)
R-Squared 0.63 0.70 0.53
Source: IMF Staff Calculations Z-statistics are reported in parenthesis. * denotes significance at 10% level, ** significance at 5% level, and *** significance at 1 percent level

JAPAN
INTERNATIONAL MONETARY FUND 31
IMPACT OF DEMOGRAPHICS ON GROWTH AND INFLATION IN JAPAN1 Is Japan’s aging and, more recently, declining population hampering growth and reflation? Exploiting demographic variation in prefectural data we find that: (i) aging has a significant negative impact on labor productivity, mainly through total factor productivity (TFP), and tends to lower overall inflation, (ii) a shrinking population is associated with a weak but significant and negative impact on TFP, but does not have a significant impact on overall inflation. In sum, aging seems to have a stronger adverse impact on productivity and inflation than population decline. While, the results also indicate that migration could help raise labor productivity, addressing low growth and inflation in Japan requires a coordinated package of measures that strengthens the monetary transmission and lifts potential growth.
A. Introduction
Mounting demographic headwinds have raised policymakers’ concerns about their macroeconomic impact. Over the past five years Japan’s population declined by close to 1 million, the equivalent of the population of San Francisco, while the share of the population aged 65 or above rose from 12 to 26 percent since 1990. The potential economic impact of an aging and shrinking population has increasingly caught the attention of policymakers in Japan. The government recently announced a new growth strategy which includes efforts to raise the fertility rate, boost female and older worker labor force participation and increase the number of high skilled foreign workers. Meanwhile, former Governor Shirakawa of the Bank of Japan voiced concerns that demographic headwinds have contributed to Japan’s deflationary mindset.
Indeed, when comparing Japan with other G7 countries, the country appears to be an outlier both in terms of demographics and macroeconomic performance (Figure 1). Specifically, the total labor force participation rate has fallen, more than offsetting the rise in the working age population as Japan’s working age population grew by close to 6 percent between 1995 and 2014, while the labor force shrank by 1 percent. This is because the share of the working age population (defined as 15 years and above) that is older than 65 has increased substantially.
Few studies have looked at the impact of aging and population growth on labor productivity in Japan.2 Moreover, while the impact of demographics on inflation in Japan has been explored primarily through theoretical papers, there are few empirical studies that tries to establish a relationship. There are several channels through which population growth and aging could potentially impact growth and inflation:
1 Prepared by Dennis Botman, Yihan Liu, and Niklas Westelius (all APD). 2 One exception is Kyoji and Tatsuji (2015) who find that aged prefectures tend to have lower labor productivity but argue that aging does not systematically reduce TFP levels.

JAPAN
32 INTERNATIONAL MONETARY FUND
Growth. First, a shrinking and aging population reduces the amount of labor available for production. While a declining population would decrease the size of the working-age population, aging would negatively impact the overall labor force participation rate. Second, demographics could impact labor productivity. A larger population could have a positive impact on productivity through positive network effects and greater economies of scale. On the other hand, higher population growth could put strains on the availability of capital and natural resources, hence reducing labor productivity. Moreover, aging could negatively impact productivity through the depreciation of human capital.
Inflation. There is little consensus about the relationship between demographics and inflation with some pointing to a positive relationship (as supply falls while aggregate demand remains supported through permanent income effects) and others finding a negative relationship. Many theoretical studies are skeptical of any relationship at all as monetary policy could offset the impact in either direction, just like other disturbances to the inflation path. However, in a situation where policy is constrained by the zero-lower bound and the natural rate of interest may also have fallen significantly, recent studies have started to revisit this monetarist dogma.3 Aging could also lead to a shift from market to regulated prices and hence affect overall measured inflation.
B. Data and Empirical Methodology
Demographics and labor productivity. To estimate the effects of aging and population size on labor productivity we first decompose prefectural labor productivity into its total factor productivity (TFP) and capital-labor ratio components.4 Overall labor productivity growth and its two-sub components are then regressed on the change in prefectural dependency ratios and population size.5 Moreover, to estimate the impact of inter-prefectural migration on labor productivity, a five year average of net migration inflows (as a share of prefectural population) is included in the regression.6
Demographics and inflation. Similarly, to assess the impact of aging and population growth on inflation, we estimate a panel regression using overall prefectural consumer price inflation (CPI) as well as its sub-components. Since monetary policy is targeting national CPI inflation and could in theory mitigate any demographic impact on inflation, prefectural inflation was
3 See for example Juselius and Takats, 2015. "Can demography affect inflation and monetary policy?" BIS Working Papers 485, Bank for International Settlements. 4 Data on prefectural real value added and labor and capital stocks are from the Research Institute of Economy, Trade and Industry (REITI). The time span of the date is from 1970 to 2009. 5 The panel regressions also include prefectural fixed effects, time dummies, and the size of the services sector. The latter was included to account for the fact that labor productivity tends to be lower in this sector. Population size is measured relative to the average prefectural population. 6 To mitigate the potential endogeneity problem if migration is driven by prefectural wage differentials, lagged migration and population growth is used.

JAPAN
INTERNATIONAL MONETARY FUND 33
measured relative to national inflation.7 The regressors (i.e., the old-age dependency ratio and population growth) were also measured relative to prefectural averages.
C. Results
Aging has a negative impact on labor productivity by lowering TFP growth, while population has a neutral impact through higher TFP growth but lower capital-labor ratios. Table 1 shows the results from the labor productivity regressions:
Aging. The change in the old age dependency ratio has a significant and negative impact on labor productivity, stemming from its negative effect on TFP growth. The point estimate suggests that a 10 percentage point increase in the old age dependency ratio lowers TFP by 11.6 percent.
Population size. More populous prefectures are associated with higher TFP growth but lower growth in the capital-labor ratio, resulting in an insignificant impact on overall labor productivity. A one percent increase in the relative prefectural population results in a 0.08 percent increase in TFP growth.
Migration. Net migration is positively associated with TFP growth but negatively related to capital-labor growth. A 1 percentage point increase in net migration (as a share of population) increases overall labor productivity by 0.7 percent, reflecting an increase in TFP by 2.5 percent and a decrease in the capital-labor ratio by 1.6 percent.
Faster aging prefectures tend to have lower overall inflation. Table 2 shows the results from the CPI panel regressions. Aging has a negative and statically significant impact on overall inflation, while population growth has a positive but insignificant impact. The regressions also indicate some interesting results on the impact of aging and population growth on the sub components of the CPI basket:
Aging and consumption preferences. The empirical evidence suggests that faster aging prefectures have higher inflation of medical services but lower inflation in transportation and communication costs. This is consistent with average expenditure shares of older and younger households in Japan, which shows that older households spend relatively more on medical care, but relatively less on transportation services.
Population growth and supply constraints. The results also indicate that prefectures with relatively higher population growth tend to have higher inflation in housing. This appears reasonable given that housing supply may be sticky, at least in the short run. However, the negative impact on energy and transportation inflation seems harder to understand.
7 The regression also includes prefectural fixed effects and prefectural real growth relative to national GDP growth.

JAPAN
34 INTERNATIONAL MONETARY FUND
D. Conclusions and Policy Implications
In sum, the results suggest that aging seems to have a stronger adverse impact on productivity and inflation than population decline. While, the results also indicate that internal migration could help raise labor productivity, addressing low growth and inflation in Japan requires a coordinated package of measures that strengthens the monetary transmission and lifts potential growth.
Figure 1. Demographic and Macroeconomic Comparison of G7 Countries
Figure 2. Impact of Aging and Population Growth on Japan’s Labor Force
CanadaFrance
Germany Italy
Japan
U.KU.S.
OECD
0
5
10
15
20
25
-5 0 5 10 15 20 25 30
Population growth and Speed of Aging, 1995-2014
Source: OECD Cumulative population growth
Ch
an
ge
in
old
ag
e d
ep
en
de
ncy
ra
tio
Canada
FranceGermany
Italy
Japan
U.K
U.S.
OECD
0.0
0.5
1.0
1.5
2.0
2.5
3.0
0 1 2 3 4
GDP Growth and Inflation, 1995-2014
Source: WEO
Ave
rag
ea
nu
al
infl
ati
on
Annual average GDP growth
-0.5
0.0
0.5
1.0
1.5
2.0
2.5
3.0
UnitedStates
Japan Germany UK France Canada Italy
Labor force growth Labor productivity growth
Growth Contributions from Labor Force and Productivity, Average Annual Growth 1995-2014
Sources: Worl Bank and IMF Staff calculation

JAPAN
INTERNATIONAL MONETARY FUND 35
Table 1. Panel Regression on Labor Productivity, Aging and Population Size
Table 2. Panel Regression on Inflation, Aging and Population Growth
(1) (2) (3)Explanatory variables log(Y/L) log(A) log(K/L)
old age dependency -0.851** -1.157* -0.214(0.338) (0.664) (0.493)
0.724* 2.491*** -1.654***(0.361) (0.691) (0.567)
Lagged log population -0.00632 0.0883** -0.0924**(0.0199) (0.0407) (0.0366)
Control Variable service in percent of GDP -1.367*** -2.274*** 0.945***
(0.133) (0.227) (0.115)Lagged on dependent variables Yes Yes YesTime Dummy Yes Yes Yes
Constant 0.164 -1.042* 1.251**(0.298) (0.595) (0.532)
Observations 1,380 1,380 1,380R-squared 0.643 0.585 0.451Number of id 46 46 46Robust standard errors in parentheses*** p<0.01, ** p<0.05, * p<0.1
5 year average net migration in percent of population
(1) (2) (3) (4) (5) (6) (7) (8) (9) (10)
OverallIndependent variables
relative old age dependency -0.149* 0.151* -0.0109 -0.0988 -0.0294 -0.574*** -0.272 0.0394 -0.233 0.00826
(0.0824) (0.0885) (0.226) (0.242) (0.0961) (0.146) (0.230) (0.171) (0.194) (0.102)
relative population 0.101 0.0319 0.369* -0.405*** 0.195*** -0.184* 0.446*** 0.0306 0.0515 0.0661
(0.0726) (0.0600) (0.191) (0.129) (0.0608) (0.106) (0.124) (0.130) (0.158) (0.0882)
Control variablelog in relative GDP -0.000858 0.00596 -0.0228 0.00573 0.0102 0.00211 -0.00296 0.0181 -0.0219 0.00138
(0.00569) (0.00757) (0.0153) (0.0131) (0.00896) (0.00837) (0.0161) (0.0184) (0.0149) (0.0110)
Lagged on dependent variables Yes Yes Yes Yes Yes Yes Yes Yes Yes YesTime Dummy Yes Yes Yes Yes Yes Yes Yes Yes Yes Yes
Constant 0.000657 -0.000577 0.000254 -0.00565** 0.000200 5.99e-05 0.00267 -2.94e-05 -0.00144 0.00200
(0.000698) (0.000876) (0.00133) (0.00272) (0.000924) (0.000903) (0.00196) (0.00107) (0.00270) (0.00126)
Observations 1,472 1,472 1,472 1,472 1,469 1,472 1,472 1,472 1,472 1,472
R-squared 0.076 0.065 0.136 0.040 0.030 0.091 0.025 0.148 0.053 0.053
Number of id 1/ 46 46 46 46 46 46 46 46 46 46Robust standard errors in parentheses*** p<0.01, ** p<0.05, * p<0.1
Relative CPI inflation
trans&commu
furniturecloths&footwear
housingMedical Care
foodfuel, energy, and
reading and recreation
education

JAPAN
36 INTERNATIONAL MONETARY FUND
References
Anderson, D, D. Botman, B. Hunt, 2014, “Is Japan’s Population Aging Deflationary,” IMF Working Paper WP14/139.
Bloom, D and J. Finlay, 2008, “Demographic Change and Economic Growth in Asia,” PGDA Working Paper No.41.
Feyrer, J. 2007, “Demographics and Productivity,” The Review of Economics and Statistics 89(1):100–109.
Kyoji, F, 2010, “Service Sector Productivity in Japan: The key to future economic growth,” RIETI Policy Discussion Paper Series 10-P-007.
Kyoji, F and M. Tatsuji, 2015, “Aging, Interregional Income Inequality, and Industrial Structure: An empricial analysis based on the R-JIP Database and the R-LTES Database,” RIETI Discussion Paper Series 15-E-022.
———, 2015, “Regional Factor Inputs and Convergence in Japan: A macro-level analysis, 1955-2008,” RIETI Discussion Paper Series 15-E-123.
JAPAN
INTERNATIONAL MONETARY FUND 37
QQES IMPACT ON FINANCING CONDITIONS OF LISTED FIRMS1 Under Japan’s QQE I and II, the total debt of listed firms increased. But the increase was more pronounced for financially-unconstrained firms (as measured by their financial constraint index in March 2013) than for financially-constrained firms. Meanwhile, the total debt increased more for multinational firms than for domestic firms, due to the former’s international operations. This suggests that risk-taking by the financial sector remains incomplete, hampering the transmission of monetary easing.
A. Background
The Bank of Japan implemented the Quantitative and Qualitative Monetary Easing policy (QQE I) on April 4, 2013, and expanded it further on October 31, 2014 (QQE II). Aggregate bank lending has increased since QQE. But little analysis has been done to examine the distributional effects on non-financial firms, especially based on their pre-QQE financial conditions. We address this issue by examining 3058 listed non-financial firms in Japan from March 2013 to March 2015, and analyze how their borrowing has changed since QQE and how that change relates to their pre-QQE financial constraints.
B. Methodology and Results
We first construct a financial constraint index for each firm based on their financial fundamentals in March 2013. Following the approach of Kaplan and Zingales (1997), the financial index is measured as: -[cash flow to capital] + 0.28*[Tobin's Q] + 3.13*[debt to capital] -39.36*[dividends to capital] - 1.31*[cash to capital]. A higher index is associated with greater financial constraints; i.e., the higher the extent to which firms depend on external sources of funds to finance investment. If the firm’s financial index is above (or below) the sample median, then it is classified as financially constrained (or unconstrained). Figure 1 plots the percentage change in total debt from March 2013 to March 2015 for the whole sample, for the financially constrained group, and for the financially unconstrained group respectively. Total debt increased for the whole sample, but the increase was mostly due to financially unconstrained firms, while much less so for financially constrained firms.
We next examine whether Japanese multinational firms and domestic firms have had different borrowing patterns since the QQEs. We first identify a firm as a multinational firm based on its ratio of foreign assets over total assets in March 2013. It will be classified as a multinational (or domestic) firm if that ratio was above (or below) the sample median. Figure 2 plots the percentage change of the total debt for multinational firms and for domestic firms respectively. Total debt increased significantly for multinational firms, but much less so for domestic firms. This is likely due to the
1 Prepared by Hui Tong (RES).

JAPAN
38 INTERNATIONAL MONETARY FUND
higher demand of financing from multinational firms owing to their international growth opportunities.
C. Conclusion
The borrowing by Japanese non-financial firms has increased since QQE. But the increase was more pronounced for financially-unconstrained firms than for financially-constrained firms. Meanwhile, the total debt increased more for multinational firms than for domestic firms, likely reflecting the former’s international operations. This suggests that domestic risk-taking by the financial sector remains incomplete, hampering the transmission of monetary easing.
Figure 1. Change of Total Debt from 2013 to 2015 (%)
(by pre-QQE Financial Constraints)
Figure 2. Change of Total Debt from 2013 to 2015(%)
(by Domestic and multinational firms)
0
5
10
15
20
25
30
35
40
All firms Financially unconstrainedfirms
Financially constrainedfirms
Source: Worldscope.
(In percent)
0
2
4
6
8
10
12
14
16
18
20
Domestic firms Multinational firms
Source: Worldscope.
(In percent)

JAPAN
INTERNATIONAL MONETARY FUND 39
References
Kaplan, S. N. and L. Zingales, 1997, Do Investment-Cash Flow Sensitivities Provide Useful Measures of Financing Constraints? Quarterly Journal of Economics 112 (1): 169–215.

JAPAN
40 INTERNATIONAL MONETARY FUND
NEGATIVE INTEREST RATE POLICY AND BANK DEPOSIT RATE1 On January 29, 2016, the Bank of Japan (BoJ) made a surprise announcement of adopting a negative interest rate policy (NIRP), which was subsequently implemented on February 16, 2016. This paper examines how the NIRP has so far affected the deposit rates of 216 Japanese banks. The NIRP reduced the deposit rates across the term structure, especially for deposits with longer maturity and with large amounts. But deposit rates also varied significantly across banks. In particular, deposit rates declined faster for banks with lower net interest margins, with larger excess deposits at the BoJ relative to deposits,2 or with a higher percentage of customer deposits in total funding. This calls for a careful examination of the transmission channels and distributional effects of the NIRP across banks.
A. Background
Under the NIRP, the BoJ introduced a three-tiered reserve deposit system, which comprises of the basic balance, the macro add-on balance and the policy rate balance, receiving an interest rate of 0.1%, 0% and -0.1% respectively. By charging a negative rate on the policy balance, the NIRP aims to reduce the short-term interest rate and boost bank lending. Compared to cuts in the policy rate from a positive level, the transmission effect of NIRP hinges on whether and how commercial banks will transmit the negative policy rates to retail depositors. In particular, banks may face reputation risk and lose deposits if they charge a negative rate on depositors, which may decide to hold cash instead. There has been little empirical work so far to examine how banks determine their deposit rates under the NIRP. This paper aims to fill the gap by studying how Japanese banks adjusted deposit rates according to their business models, such as their funding sources and net interest margins, from December 5, 2015 to May 21, 2016.
B. Results
Japan’s NIRP has been effective in reducing deposit rates, which declined across the term structure, especially so for deposits with longer duration and with large amounts. This is shown in Figure 1, which plots the deposit rates for different maturities, i.e., 3 months and 5 years, and also for different amounts, i.e., medium amounts (3-10 million yen) and large amounts (>10 million yen). It illustrates the decline of both the term premium and the premium due to deposit insurance.
Meanwhile, after the NIRP, the variation of deposit rates across banks increased. Deposit rates differ between banks operating nationally (e.g., city banks) and those operating mostly within a region (e.g., regional I and II banks and Shinkin banks). But even within the second group, the heterogeneity across banks increased significantly after the NIRP. Figure 2 plots the standard
1 Prepared by Hui Tong (RES). 2 Proxied by the accounting entry “cash and due from banks.”

JAPAN
INTERNATIONAL MONETARY FUND 41
deviation of bank deposit rates over the mean bank deposit rate for 216 non-city banks. The relative standard deviation almost doubled from December 15, 2015 to May 21, 2016.
Next, we systematically examine whether pre-NIRP bank features explain this heightened heterogeneity among the 216 non-city banks, based on bank characteristics in 2014 at both the asset and the liability sides, such as funding sources and bank business models and operations, such as net interest margins. We find that by May 21, 2016, the 5-year deposit rate (for large amounts) declined more for banks with a higher ratio of excess deposits at the BoJ relative to deposits, for banks with a higher ratio of customer deposits relative to total funding, and for banks with lower net interest margins (Table 1):
A one standard deviation increase in cash and due from banks relative to deposits reduces the 5-year deposit rate by 0.2bps, amounting to 12% of the standard deviation of the change in the deposit rate (1.6bp). This could reflect banks’ desire to decrease their current account holdings by reducing deposit rates so as to avoid the negative rate on the policy balance.
A one standard deviation increase of bank customer deposits relative to total funding reduces the 5-year deposit rate by 0.37bps, amounting to 23% of the standard deviation of the change in the deposit rate. This suggests that banks relying on customer deposits have more incentives to cut deposit rates so as to reduce the funding cost.
Net interest margin is measured as the net interest income (i.e, interest revenues minus interest expenses) divided by the interest earning assets. A one standard deviation increase in the net interest margin increases the 5-year deposit rate by 0.54bps, amounting to 34% of the standard deviation of the change in the deposit rate. This suggests that banks with higher pre-NIRP profitability are less likely to reduce the deposit rates, probably reflecting greater ability to rebalance portfolios towards higher-yielding assets, including credit provision
C. Conclusions
The NIRP reduced the bank deposit rates but to different degrees depending on bank characteristics. This calls for a careful examination of the distributional effects of the NIRP across bank types and how this may affect banks’ roles as financial intermediaries.

JAPAN
42 INTERNATIONAL MONETARY FUND
Figure 1. Deposit Rates by Type Figure 2: Relative Standard Deviation of Bank Rates for 5-year Large Deposits
Table 1. Change of 5-year Rate for Large Deposits (12/5/15–5/21/16)
Firm size -0.00208
[0.00133]
Net interest margin 2.268***
[0.471]
Customer Deposits / Total Funding excl. Derivatives -0.0844***
[0.0306]
Cash and due from banks/Customer deposits -0.0255*
[0.0135]
Constant 0.0643
[0.0549]
Observations 216
R-squared 0.202
0
1
2
3
4
5
6
7
5-Dec-15 3-Feb-16 3-Apr-16
5-year large deposit 5-year medium deposit3-month medium deposit
Source: Bank websites.
21-May-16
(In Bps)
0
0.2
0.4
0.6
0.8
1
1.2
1.4
1.6
1.8
5-Dec-15 3-Feb-16 3-Apr-16
Source: Bank websites.
In Percent
21-May-16
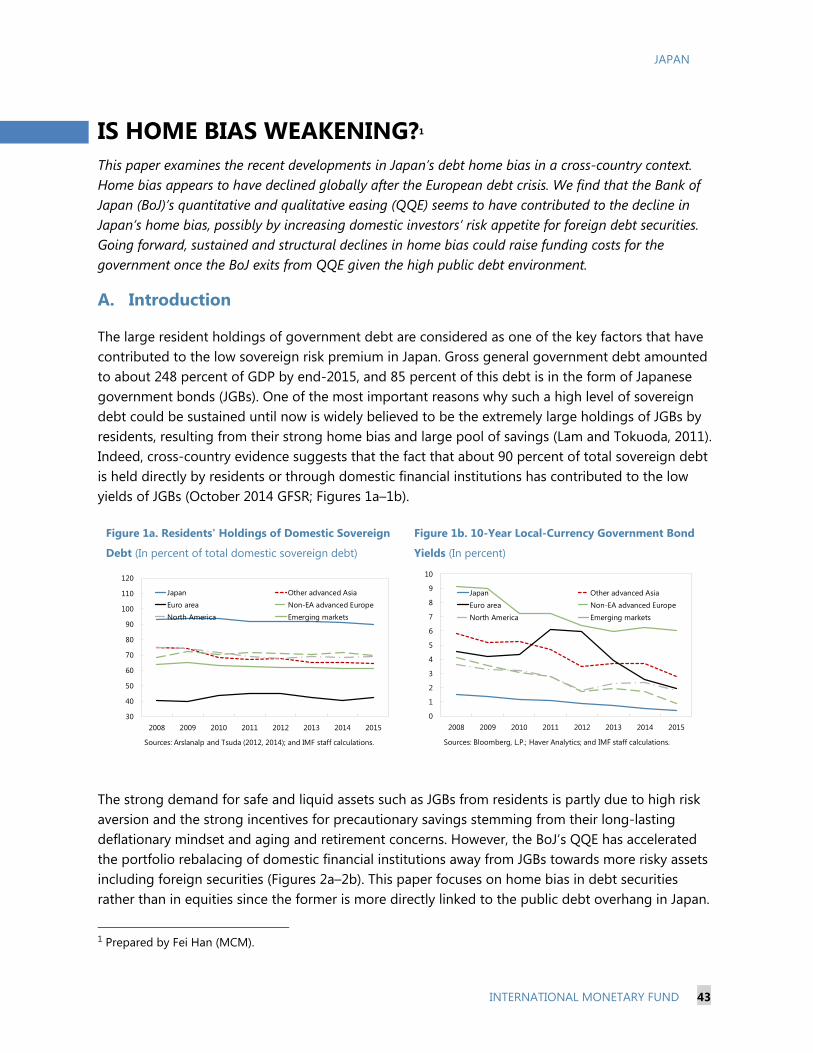
JAPAN
INTERNATIONAL MONETARY FUND 43
IS HOME BIAS WEAKENING?1 This paper examines the recent developments in Japan’s debt home bias in a cross-country context. Home bias appears to have declined globally after the European debt crisis. We find that the Bank of Japan (BoJ)’s quantitative and qualitative easing (QQE) seems to have contributed to the decline in Japan’s home bias, possibly by increasing domestic investors’ risk appetite for foreign debt securities. Going forward, sustained and structural declines in home bias could raise funding costs for the government once the BoJ exits from QQE given the high public debt environment.
A. Introduction
The large resident holdings of government debt are considered as one of the key factors that have contributed to the low sovereign risk premium in Japan. Gross general government debt amounted to about 248 percent of GDP by end-2015, and 85 percent of this debt is in the form of Japanese government bonds (JGBs). One of the most important reasons why such a high level of sovereign debt could be sustained until now is widely believed to be the extremely large holdings of JGBs by residents, resulting from their strong home bias and large pool of savings (Lam and Tokuoda, 2011). Indeed, cross-country evidence suggests that the fact that about 90 percent of total sovereign debt is held directly by residents or through domestic financial institutions has contributed to the low yields of JGBs (October 2014 GFSR; Figures 1a–1b).
Figure 1a. Residents' Holdings of Domestic Sovereign
Debt (In percent of total domestic sovereign debt)
Figure 1b. 10-Year Local-Currency Government Bond
Yields (In percent)
The strong demand for safe and liquid assets such as JGBs from residents is partly due to high risk aversion and the strong incentives for precautionary savings stemming from their long-lasting deflationary mindset and aging and retirement concerns. However, the BoJ’s QQE has accelerated the portfolio rebalacing of domestic financial institutions away from JGBs towards more risky assets including foreign securities (Figures 2a–2b). This paper focuses on home bias in debt securities rather than in equities since the former is more directly linked to the public debt overhang in Japan.
1 Prepared by Fei Han (MCM).
30
40
50
60
70
80
90
100
110
120
2008 2009 2010 2011 2012 2013 2014 2015
Japan Other advanced AsiaEuro area Non-EA advanced EuropeNorth America Emerging markets
Sources: Arslanalp and Tsuda (2012, 2014); and IMF staff calculations.
0
1
2
3
4
5
6
7
8
9
10
2008 2009 2010 2011 2012 2013 2014 2015
Japan Other advanced AsiaEuro area Non-EA advanced EuropeNorth America Emerging markets
Sources: Bloomberg, L.P.; Haver Analytics; and IMF staff calculations.

JAPAN
44 INTERNATIONAL MONETARY FUND
Sustained declines in debt home bias could reduce the fiscal breathing space for governments with high public debt and raise debt sustainability risk (Asonuma and others, 2015; IMF, 2015).
Figure 2a. Japan: Financial Institutions' Holdings of
JGBs (In trillion yen)
Figure 2b. Japan: Financial Institutions' Holdings of
Foreign Securities (In trillion yen)
The Domestic Asset Acceptance Ratio (DAAR) has been widely used as an empirical measure of home bias:2
1
,
The measure is bounded between 0 and 1 with a higher value indicating a stronger home bias. The measure shows a declining trend across the globe after the European debt crisis. Moreover, although home bias in Japan does not seem to be extremely high compared to that in the U.S. or the other advanced Asian countries (in line with the literature using the same measure of home bias), there is a positive correlation between a country’s home bias and the share of domestic sovereign debt in its total sovereign debt holdings in a cross-country context (Figures 3a–3b).
Figure 3a. Home Bias in Debt Securities (DAAR measure) Figure 3b. Home Bias and Holdings of Domestic
Sovereign Debt (2015)
2 The measure has been used in Ahearne et al. (2004), Kho et al. (2009), Coeurdacier and Rey (2012), Vanpee and De Moor (2012), Asonuma et al. (2015), and IMF (2015).
0
100
200
300
400
500
600
700
800
900
2009 2010 2011 2012 2013 2014 2015
Banks Insurance companies Pension funds Other financial institutions
Source: Bank of Japan.
0
50
100
150
200
250
300
350
400
2009 2010 2011 2012 2013 2014 2015
BanksInsurance companiesPension fundsOther financial institutions
Source: Bank of Japan.
0.45
0.55
0.65
0.75
0.85
0.95
0.75
0.8
0.85
0.9
0.95
1
2009 2010 2011 2012 2013 2014 2015
JapanNorth AmericaEmerging marketsOther advanced Asia (RHS)Advanced Europe (RHS)
Sources: Bank for Internaional Settlements; Coordinated Portfolio Investment Survey ; Haver Analytics; and IMF staff calculations.
10
20
30
40
50
60
70
80
90
100
0.1 0.2 0.3 0.4 0.5 0.6 0.7 0.8 0.9 1 1.1
Per
cen
t o
f to
tal h
old
ings
of s
ove
reig
n d
ebt
Japan
Sources: BIS; CPIS; Arslanalp and Tsuda (2012, 2014); Haver Analytics; and Fund staff calculations.

JAPAN
INTERNATIONAL MONETARY FUND 45
B. Empirical Analysis and Results
Cross-country panel regressions suggest that the expansion of central bank’s balance sheets have a significant impact on home bias (Table 1). Drawn mainly from the existing literature, the explanatory variables are categorized into four groups:
Macroeconomic developments: higher real GDP per capita or lower inflation tend to reduce home bias, while higher real exchange rate volatility increases the uncertainty of investments in foreign debt securities and hence increases home bias.
Financial variables: the return on domestic debt securities, proxied by the 10-year government bond yield, has a positive impact on home bias.
Structural factors: financial openness and institutional quality have significantly negative effects
on home bias.
Policy changes: central banks’ purchases of domestic sovereign bonds lower the (expected) returns of domestic assets. As a result, domestic investors—to offset the losses from such lower returns—would raise their risk appetite towards riskier assets including foreign debt securities. In particular, specifications V and VI suggest that the impact of a decline in the yield on home bias could be larger when the central bank increases its holdings of domestic sovereign bonds.
Lower global risk aversion after the European debt crisis has also contributed to the decline in home bias. We decompose the change in each country’s home bias into contributions from each aforementioned factor (Figure 4). In Japan, QQE seems to have contributed significantly to the decline in home bias during 2013–14. Moreover, global common factors (year effects), positively correlated with the VIX, are also important in driving the dynamics of home bias (Figure 5).
C. Conclusions and Policy Implications
Home bias in debt securities has broadly declined globally after the European debt crisis. In particular, Japan’s debt home bias is not extremely high in a cross-country context, and has declined along with other countries since 2012 as global risk aversion subsided.
Common factors such as global risk aversion played an important role in driving the dynamics of home bias in all countries. Idiosyncratic factors, including macroeconomic developments, structural factors, and changes in QE programs also tend to have a significant effect on each country’s home bias. In particular, the BoJ’s QQE has contributed to the decline in Japan’s home bias, possibly by raising domestic investors’ risk appetite for foreign debt securities to mitigate the loss from lower returns on domestic bonds. Sustained declines in Japan’s home bias would reduce the sovereign-financial nexus, but also increase debt sustainability risks once the BoJ exits the QQE in the future as interest rates would rise amid greater reliance on foreign investors.

JAPAN
46 INTERNATIONAL MONETARY FUND
Figure 4. Decomposition of Home Bias
Sources: Bank for Internaional Settlements; Arslanalp and Tsuda (2012, 2014); Haver Analytics; IMF's WEO and IFS databases; and
IMF staff calculations based on the panel specification III in Table 1.
-0.05
-0.04
-0.03
-0.02
-0.01
0.00
0.01
0.02
0.03
0.04
2011 2012 2013 2014 2015
Japan
Lag effects Macroeconomic StructuralYield CBBS Year effects
-0.05
-0.04
-0.03
-0.02
-0.01
0.00
0.01
0.02
0.03
0.04
2011 2012 2013 2014 2015
Euro Area
Lag effects Macroeconomic StructuralYield CBBS Year effects
-0.06
-0.04
-0.02
0.00
0.02
0.04
0.06
2011 2012 2013 2014 2015
United Kingdom
Lag effects Macroeconomic StructuralYield CBBS Year effects
-0.04
-0.03
-0.02
-0.01
0.00
0.01
0.02
0.03
2011 2012 2013 2014 2015
United States
Lag effects Macroeconomic StructuralYield CBBS Year effects
-0.04
-0.03
-0.02
-0.01
0
0.01
0.02
13 15 17 19 21 23 25
Year
eff
ects
VIX
Figure 5. Year Effects and Global Risk Aversion(2011-2015)
Sources: Bank for Internaional Settlements; Arslanalp and Tsuda (2012, 2014); Haver Analytics; IMF's WEO and IFS databases; and IMF staff calculations based on the panel specification III in Table 1.

JAPAN
INTERNATIONAL MONETARY FUND 47
Table 1. Panel Estimates of Determinants of Home Bias
Dependent variable Home bias Logit (home bias)
I II III IV V VI
Lagged dependent variable
— 0.22*** (0.08) 0.24*** (0.09)
— 0.21** (0.09) 0.25** (0.10)
Log(real GDP per capita), lagged
0.19 (0.17) -0.26* (0.14) 0.08 (0.16) 0.42 (0.87) -1.64* (0.81)
0.10 (0.94)
Inflation, lagged 0.011* (0.007)
0.009** (0.004)
0.01 (0.01) 0.06* (0.03) 0.06*** (0.02) 0.04 (0.03)
Credit/GDP, lagged 3.36e-4 (5.92e-4)
5.46e-5 (5.16e-4)
7.31e-5 (5.71e-4)
-8.96e-4 (0.003)
-0.002 (0.003)
-0.002 (0.003)
Debt/GDP, lagged 1.40e-3** (6.66e-4)
2.66e-4 (7.89e-4)
8.90e-6 (7.35e-4)
0.003 (0.003) -0.003 (0.004)
-0.004 (0.003)
Vol(REER), lagged 0.004 (0.004) 0.012* (0.007)
0.004** (0.002)
0.02 (0.02) 0.04 (0.03) 0.01 (0.01)
Trade openness, lagged -3.00e-4 (8.65e-4)
-5.77e-4 (7.86e-4)
-8.68e-5 (8.55e-4)
-0.001 (0.004)
-0.004 (0.005)
-4.59e-4 (0.004)
Financial openness, lagged
-0.09* (0.05)
-0.05 (0.06) -0.05 (0.06) -0.50** (0.19) -0.28 (0.31) -0.29 (0.27)
Institutional quality, lagged
-0.03 (0.08)
-0.09*** (0.03)
-0.10** (0.04) -0.06 (0.43) -0.49*** (0.15)
-0.49*** (0.18)
Dependency ratio, lagged
-0.004 (0.007)
-0.004 (0.005)
0.003 (0.007) -0.01 (0.04) -0.02 (0.02) 0.02 (0.04)
Yield 0.001 (0.004) 0.005* (0.003)
-0.001 (0.003)
0.01 (0.02) 0.02 (0.02) -0.004 (0.01)
CBBS -0.003* (0.002)
-1.65e-5 (0.001)
-0.002* (0.001)
-0.01 (0.01)
4.56e-5 (0.01)
-0.01 (0.01)
Yield*CBBS 0.08 (0.08) 0.05 (0.04) 0.08 (0.05) 0.55 (0.40) 0.39* (0.21) 0.49** (0.23)
Constant -1.01 (1.88) 3.89** (1.61) 0.20 (1.83) -2.23 (9.25) 21.68** (8.40) 2.58 (9.90)
Year effects Yes — Yes Yes — Yes
Fixed effects Yes Yes Yes Yes Yes Yes
Adj. R2 0.04 0.36 0.63 0.27 0.30 0.56
Total obs. 175 125 150 175 125 150
Source: IMF staff estimates.
Note: 24 advanced economies plus Latvia and Lithuania (whose government bonds were also purchased by the ECB) are included in the regressions. CBBS represents the central bank’s holdings of domestic government bonds, including the ECB’s public sector purchase program (PSPP). Lagged values for all explanatory variables except financial variables. Robust standard errors are reported in parentheses. * denotes significance at 10% level, ** significance at 5% level, and *** significance at 1 percent level.

JAPAN
48 INTERNATIONAL MONETARY FUND
References
Ahearne, A.G., Griever, W.L. and F.E. Warnock, 2004, “Information Costs and Home Bias: An Analysis of US Holdings of Foreign Equities”, Journal of International Economics, Vol. 62, pp. 313–36.
Arslanalp, S. and T. Tsuda, 2012, “Tracking Global Demand for Advanced Economy Sovereign Debt”, IMF Working Paper No. 12/284 (Washington: International Monetary Fund).
Asonuma, T., Bakhache, S. and H. Hesse, 2015, “Is Banks’ Home Bias Good or Bad for Public Debt Sustainability?”, IMF Working Paper No. 15/44 (Washington: International Monetary Fund).
Bekaert, G. and X. Wang, 2009, “Home Bias Revisited,” unpublished manuscript, Colombia Business School.
Chan, K., Covrig, V. and L. Ng, 2005, “What Determines the Domestic Bias and Foreign Bias? Evidence from Mutual Fund Equity Allocations Worldwide,” The Journal of Finance, Vol. LX, No. 3, pp. 1495–534.
Coeurdacier, N. and H. Rey, 2012, “Home Bias in Open Economy Financial Macroeconomics,” Journal of Economic Literature, 51(1), pp. 63-115.
Kho, B., Stulz, R.M. and F.E. Warnock, 2009, “Financial Globalization, Governance, and the Evolution of the Home Bias”, Journal of Accounting Research, Vol. 47, No. 2, pp. 597–635.
International Monetary Fund, 2015, “From Banking to Sovereign Stress: Implications for Public Debt” (Washington: International Monetary Fund).
Lam, R.L. and K. Tokuoda, 2011, “Assessing the Risks to the Japanese Government Bond (JGB) Market”, IMF Working Paper No. 11/292 (Washington: International Monetary Fund).
Vanpee, R. and L. De Moor, 2013, “Bond and Equity Home Bias and Foreign Bias: An International Study”, unpublished manuscript, Hogeschool-Universiteit Brussel, KU Leuven.
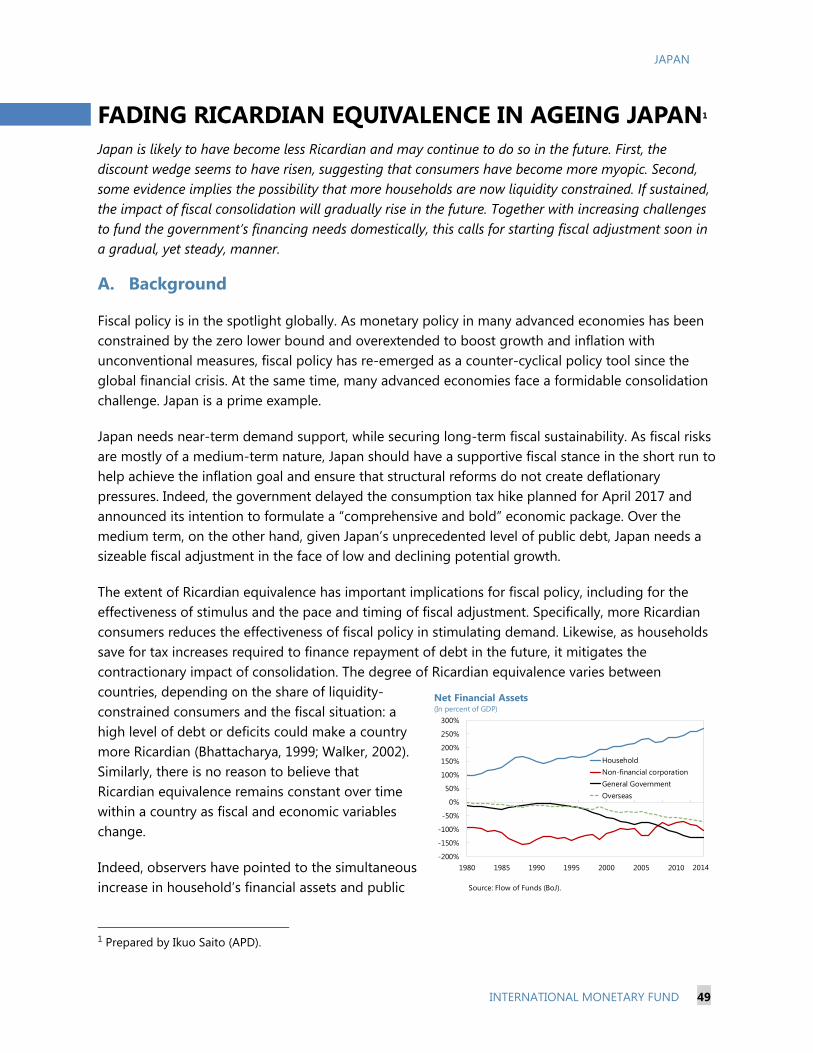
JAPAN
INTERNATIONAL MONETARY FUND 49
FADING RICARDIAN EQUIVALENCE IN AGEING JAPAN1 Japan is likely to have become less Ricardian and may continue to do so in the future. First, the discount wedge seems to have risen, suggesting that consumers have become more myopic. Second, some evidence implies the possibility that more households are now liquidity constrained. If sustained, the impact of fiscal consolidation will gradually rise in the future. Together with increasing challenges to fund the government’s financing needs domestically, this calls for starting fiscal adjustment soon in a gradual, yet steady, manner.
A. Background
Fiscal policy is in the spotlight globally. As monetary policy in many advanced economies has been constrained by the zero lower bound and overextended to boost growth and inflation with unconventional measures, fiscal policy has re-emerged as a counter-cyclical policy tool since the global financial crisis. At the same time, many advanced economies face a formidable consolidation challenge. Japan is a prime example.
Japan needs near-term demand support, while securing long-term fiscal sustainability. As fiscal risks are mostly of a medium-term nature, Japan should have a supportive fiscal stance in the short run to help achieve the inflation goal and ensure that structural reforms do not create deflationary pressures. Indeed, the government delayed the consumption tax hike planned for April 2017 and announced its intention to formulate a “comprehensive and bold” economic package. Over the medium term, on the other hand, given Japan’s unprecedented level of public debt, Japan needs a sizeable fiscal adjustment in the face of low and declining potential growth.
The extent of Ricardian equivalence has important implications for fiscal policy, including for the effectiveness of stimulus and the pace and timing of fiscal adjustment. Specifically, more Ricardian consumers reduces the effectiveness of fiscal policy in stimulating demand. Likewise, as households save for tax increases required to finance repayment of debt in the future, it mitigates the contractionary impact of consolidation. The degree of Ricardian equivalence varies between countries, depending on the share of liquidity-constrained consumers and the fiscal situation: a high level of debt or deficits could make a country more Ricardian (Bhattacharya, 1999; Walker, 2002). Similarly, there is no reason to believe that Ricardian equivalence remains constant over time within a country as fiscal and economic variables change.
Indeed, observers have pointed to the simultaneous increase in household’s financial assets and public
1 Prepared by Ikuo Saito (APD).
-200%
-150%
-100%
-50%
0%
50%
100%
150%
200%
250%
300%
1980 1985 1990 1995 2000 2005 2010
HouseholdNon-financial corporationGeneral GovernmentOverseas
Net Financial Assets (In percent of GDP)
Source: Flow of Funds (BoJ).
2014

JAPAN
50 INTERNATIONAL MONETARY FUND
debt as evidence that Japanese consumers are Ricardian. However, this ignores the movements in non-financial assets: the total asset-to-GDP ratio of the household sector has been stable after the bursting of the bubble despite a rapid increase in the total financial liability of the general government. Hence, the co-movement between rising household financial assets and government debt may just reflect life-cycle saving and consumption patterns amid rapid ageing. Indeed, household assets managed by pension funds and insurers have been increasing since 1980.
B. Myopia and Liquidity Constraints
Japan may have become more myopic. The estimation result of a restricted model with myopic consumers based on Bayoumi and Sgherri (2006) shows that the discount wedge in Japan is around 0.1 over the full sample period (1980-2014).2 Rolling estimates with windows of 20 years suggest that the additional discount rate has increased over time. In addition, the results suggest that the impact of changes in the personal income tax rate (net of transfers) on changes in consumption may have increased (the average elasticity is 0.15 and 0.22 for the first and last 5 windows, respectively): i.e., the tax multiplier may have increased. The higher discount wedge means that Japan has become more myopic and thus less Ricardian.
Rapid population ageing may have made, and will continue to make, Japan shorter-sighted as a nation. In Japan, life expectancy minus the median age, which can be regarded as an indicator of patience or the planning horizon of a nation as a whole, has been rapidly declining in the past few decades. This results from the more rapid rise in the median age than the average lifespan. In contrast, the US has seen a flattening of this indicator in recent years, which could partly explain the
2 The difference between a discount rate people face and the market rate.
0%
100%
200%
300%
400%
500%
600%
700%
1980 1985 1990 1995 2000 2005 2010
Financial assets (gross) Non-financial assets Total assets
Source: The Cabinet Office, Japan.
2013
Household's Total Asset (In percent of GDP)
0
2
4
6
8
10
12
14
16
2001 2003 2005 2007 2009 2011 2013Source: IMF staff estimates. 1/ Years in the x-axis show the last year of each 20-year window.
Discount Wedge 1/(In percent)
2014
32
34
36
38
40
42
44
46
1960 1965 1970 1975 1980 1985 1990 1995 2000 2005 2010 2014 2030
JPN USA
Sources: Japan Census; National Institute of Population and Social Security Research;US Census; UN; IMF staff estimates.
Japan and USA: Life Expectancy minus Median Age

JAPAN
INTERNATIONAL MONETARY FUND 51
difference between the two countries in terms of the movement of the discount wedge.3 Moreover, the difference between life expectancy and the median age is projected to narrow further in Japan.
Studies of past cash transfer programs suggest that liquidity constraints are somewhat binding in Japan. First, Hori et al. (2002) examine the impact of the shopping coupon program in 1999 and find that the marginal propensity to consume (MPC) was larger for households who are regarded as liquidity constrained. Second, the Cabinet Office (CAO, 2012) analyzes the cash benefit program in 2009 and finds that the MPC was 0.25 for the whole sample, but it was higher for households who are more likely to be liquidity constrained: 0.40 for those with children and 0.37 for the elderly.
Other evidence suggests that liquidity constraints in Japan have become more binding for both the young and the old. First, especially for the young male, there has been a notable increase in non-regular workers. More workers with lower wages and less job security imply a larger number of people subject to liquidity constraints. This is in line with the findings of the CAO (2015) that younger households with lower income reduced consumption after the 2014 consumption tax hike more than other types of households. Per person financial assets have also declined for younger generations. Second, a larger number of retirees could imply more liquidity constrained households as pension benefits in Japan, on average, are not as generous as those in European counterparts. Indeed, inequality among the elderly is known to be larger compared to other cohorts. Moreover, pension benefits per person have been cut in nominal and real terms recently.
The record-high number of people on public assistance provides further evidence for rising liquidity constraints. The number of people on the public assistance program, the final safety net in Japan, rose from less than a million to an all-time high of 2.2 million in the past twenty years. This trend is well explained empirically by ageing, the share of non-regular workers, and the job-to-applicant ratio, with the first two exerting a positive impact and the latter a negative effect. Given further ageing, even if the non-regular worker ratio would flatten in the future, the number of people on the public assistance program is estimated to increase by an additional 0.3 million by FY2030. This means that more households will become liquidity constrained, making Japan even less Ricardian.
C. Policy Implications
A smaller Ricardian offset suggests a higher multiplier of fiscal policy. Using the IMF’s Global Integrated Monetary and Fiscal Model (GIMF), the consumption tax multiplier is estimated at around 0.4, with the default value of a planning horizon for advanced economies including Japan at 20 years. If we use a shorter planning horizon of 10 years, which is more in line with the discount wedge of 10 percent estimated above, the multiplier becomes larger at around 0.6.
The 2014 consumption tax hike provides a prime example of potentially higher multipliers than originally believed. Based on the CAO’s (2015) methodology, we first estimate the consumption function using quarterly data for 1998Q1-2013Q3 (the period between the two consumption tax hikes in April 1997 and 2014). We then compared the actual and forecasted (without the tax hike) consumption path to derive the
3 Bayoumi and Sgherri (2009) find that the discount wedge in the US had been on a declining trend.

JAPAN
52 INTERNATIONAL MONETARY FUND
multiplier of the consumption tax increase. Depending on the consumption data used and abstracting from other factors that might have affected consumption, the multiplier amounted to 0.9 (national accounts data) or 0.6 (Bank of Japan’s (BoJ) new consumption indicator).4 The latter is close to the result of the GIMF simulations mentioned above using a shorter planning horizon.
Becoming less Ricardian also means less household savings, the most important source of JGB financing. Expanding on Tokuoka (2010) and Hoshi and Ito (2012), we project future demand and supply of JGBs. An illustrative calculation, assuming that the BoJ halts its purchases of JGBs at end 2017, suggests that the supply exceeds the demand as early as 2018. At that moment, interest rates may need to rise to attract enough buyers, including domestic financial institutions which hold excess reserves at the BoJ’s current account (the white dotted area in the text chart). In addition, private pension funds and other insurers may reverse their portfolio rebalancing towards riskier assets. However, in the long run, the savings rate is expected to decline further due to ageing, more myopic behavior, and rising liquidity constraints, resulting in a slower increase or decline in household’s financial assets. This will pose a challenge for JGB financing.
D. Conclusions
All considered, Japan has, and possibly will, become less Ricardian with ageing and weak economic prospects. The estimate of the discount wedge suggests that Japan may have become more myopic. It appears natural that Japan becomes shorter-sighted as the average remaining life expectancy of the population declines. In addition, the number of liquidity constrained households is increasing.
Fiscal policy faces a trade-off between short-term policy effectiveness and long-term sustainability. First, as multipliers become stronger, fiscal consolidation should start soon, in a gradual manner. Likewise, a potential reduction in savings may pose a challenge for JGB financing in the not-too-distant future, calling for steady fiscal adjustment. Second, given the large impact of the previous consumption tax hike, more gradual increases seem to be warranted. Third, reorienting expenditure towards liquidity constrained consumers would improve fiscal policy effectiveness.
4 Nakamura et al. (2016), as a BoJ Reports & Research Paper, proposes a new timely consumption indicator, “Consumption Activity Index,” as preliminary quarterly estimates of private consumption (national accounts data) is arguably not very reliable, while annual reports on national accounts have a lag of almost a year.
12.45
12.50
12.55
12.60
12.65
12.70
1998 2001 2004 2007 2010 2013 2016
Actual (SNA)Fitted valuesOut-of-sample estimates
Private Consumption 1/(real; in logs)
Sources: Cabinet office, Japan; and IMF staff estimates. 1/ Quarterly data from 1998Q1 to 2013Q3 is used.
0
200
400
600
800
1,000
1,200
1,400
1,600
1,800
0
200
400
600
800
1000
1200
1400
1600
1800
2015 2016 2017 2018 2019 2020 2021 2022 2023 2024 2025
BOJ-long BOJ-shortdepository institutions insurance/pension fundsGG othersoverseas excess reserves at BoJ's CAfinancing needs
Sources: Flow of Funds (BoJ); and IMF staff estimates.1/ Includes both central and local governments' debt (including FILP bonds).The BoJ is assumed to stop increasing its JGB holdings under QQE2 at end-2017.
Public Debt Financing in the Baseline 1/(In trillion yen; end of period)

JAPAN
INTERNATIONAL MONETARY FUND 53
References
Arslanalp, S. and D. Botman, 2015, “Portfolio Rebalancing in Japan: Constraints and Implications for Quantitative Easing,” IMF Working Paper 15/186.
Bayoumi, T. and S. Sgherri, 2006, “Mr. Ricardo’s Great Adventure: Estimating Fiscal Multipliers in a Truly Intertemporal Model,” IMF Working Paper 06/168.
———, 2009, “On Impatience and Policy Effectiveness,” IMF Working Paper 09/18.
Bhattacharya, R., 1999, “Private Sector Consumption Behavior and Non-Keynesian Effects on Fiscal Policy,” IMF Working Paper 99/112.
Cabinet Office Japan, 2012, “What Impact Did the Fixed Cash Benefit Program Have on Household Consumption?” Policy Issues Analysis Series 8 (in Japanese).
———, 2015, “Annual Report on the Japanese Economy and Public Finance 2015: Japan Is in the Best Condition in A Quarter Century and Achieving Economic Revitalization” (in Japanese).
Hori, M., C. Hsieh, K. Murata, and S. Shimizutani, 2002, “Did the Shopping Coupon Program Stimulate Consumption?: Evidence from Japanese Micro Data,” ESRI Discussion Paper Series No.12.
Hoshi, T. and T. Ito, 2012, “Defying Gravity: How Long Will Japanese Government Bond Prices Remain High?” NBER Working Paper Series No. 18287.
Nakamura, K., H. Kawata, M. Tanaka, and L. Uemae, 2016, “The Consumption Activity Index,” BOJ Reports & Research Papers.
Tokuoka, K., 2010 “The Outlook for Financing Japan’s Public Debt,” IMF Working Paper 10/19.
Walker, C., 2002, “Ricardian Equivalence and Fiscal Policy Effectiveness in Japan,” Asian Economic Review Journal, Vol. 16, No. 3, pp. 285–302.

JAPAN
54 INTERNATIONAL MONETARY FUND
ECONOMIC POLICY UNCERTAINTY1 The Japanese economy is facing formidable challenges (high public debt, weak growth, and lingering risks of deflation). Without credible policy frameworks these challenges are contributing to higher policy uncertainty, holding back sentiment. This paper constructs a novel measure of economic policy uncertainty (EPU index) using the frequency of articles that appear in major domestic newspapers containing keywords related to “economy”, “uncertainty” and “policy.” The EPU index suggests that policy uncertainty has increased substantially over the past year, consistent with other measures of economic uncertainty. Furthermore, econometric results show an economically large and statistically significant effect of policy uncertainty on output, employment and investment. Strengthening policy frameworks and institutions, adopting concrete and credible policy actions can help reduce policy uncertainty and support domestic demand.
A. Background
Japan faces important policy challenges and choices. If not properly managed, high policy uncertainty can emerge. For instance, putting Japan’s high public debt on a sustainable path will involve critical policy decisions about the composition and timing of fiscal adjustment. With monetary policy stuck in a liquidity trap for most of the previous two decades, and in the context of BoJ’s unprecedented monetary easing program, the future course of monetary policy and its implications for the economy are also likely to affect the degree of policy uncertainty. Finally, structural policies spanning labor markets, deregulation, and trade integration are all critical to raise Japan’s declining growth potential, and based on surveys of Japanese firms pose an important source of uncertainty as well.2 There is therefore a growing concern that policy uncertainty is contributing to weak domestic demand, by delaying firm investment and hiring and creating incentives for outsourcing if there are fixed costs or if investments are partially irreversible. If agents are risk averse, higher uncertainty can also lead to precautionary savings, depressing demand. Economic activity could also be affected if financial conditions tighten in response to policy uncertainty. This paper uses a novel approach to measure economic policy uncertainty in Japan by using the frequency of articles published on economic policy uncertainty in major domestic newspapers and studies its impact on output, employment, and investment. This paper relates to a growing literature studying how policy uncertainty affects the real economy (Bloom et. al. (2007), Bloom (2009), Baker et. al. (2016), Fernandez-Villaverde et. al. (2015), Gulen and Ion (2016)) and there are several studies
1 This note features preliminary results of a joint project between the Economic Policy Uncertainty project (Steven J. Davis), IMF (Elif Arbatli, Naoko Miake, Ikuo Saito, all APD) and REITI Policy Uncertainty Project (Arata Ito). The final results of the project will be featured in a forthcoming IMF Working Paper. 2 See Morikawa (2013, 2016).

JAPAN
INTERNATIONAL MONETARY FUND 55
which have found important effects of policy and broader uncertainty on economic activity in Japan (Morikawa (2010), Ono and Sullivan (2013), Matsuura (2013), Ito (2016) and Kitao (2016)).
B. Measuring Economic Policy Uncertainty
Following Baker et. al. (2016), we use search algorithms to count the number of newspaper articles that include certain keywords such as ‘uncertain’ or ‘uncertainty,’ ‘economic’ or ‘economy,’ and one or more policy relevant terms such as ‘tax,’ ‘regulation,’ ‘spending,’ ‘deficit,’ ‘budget,’ or ‘central bank’ published in four major domestic newspapers: Yomiuri, Asahi, Mainichi and Nikkei.3 Article counts at the monthly frequency are scaled by the total number of articles published after applying appropriate seasonal adjustments and are then normalized. The list of keywords used to perform the search is reported in Table 1.
The economic policy uncertainty index (EPU index, Figure 1) peaks around political events and elections as well as during economic recessions and big events (e.g. the collapse of Lehman Brothers). The EPU index is showing a trend increase after the global financial crisis and then a gradual decline coinciding with the launch of Abenomics. Since 2015, policy uncertainty has increased, amid concerns over spillovers from China, the introduction of the negative interest rate policy (NIRP), Brexit risks, and the decision to delay the consumption tax hike. The EPU index is correlated with other measures of uncertainty including implied or actual stock market volatility and measures based on the dispersion of household expectations of growth prospects. The EPU index is also related to measures of political uncertainty, for example the index constructed in Ito (2016) which uses data on approval ratings by political parties in opinion polls that are conducted monthly by the Japanese news media (Table 2).
Figure 1. Economic Policy Uncertainty Index
3 Our index tries to improve upon the existing Japan EPU index in Baker et al. (2016) by increasing its coverage from two to four newspapers, adjusting the keywords for economic policy uncertainty through detailed audits and constructing three sub-indices that capture uncertainty related to fiscal, monetary and structural policies.
0
50
100
150
200
250
300
1987 1992 1997 2002 2007 2012
(1987-2015=100)
Sources: Authors' calculations.
Electoral Reform;New PM Hosokawa
Asian financial crisis
New PM Obuchi
House dissolvesnew generalelections
Invasion ofIraq
Lehman collapsePM Fukuda resigns
China spilloversBoJ's NIRPBrexitDelay of consumptiontax hike
Great East JapanEarthquake
governmentdebt andtax policyconcerns
2016

JAPAN
56 INTERNATIONAL MONETARY FUND
C. Economic Impact of Policy Uncertainty
We consider the impact of economic policy uncertainty using (i) a VAR model to study its dynamic impact on output, employment, consumption and investment; and (ii) a standard investment equation.
VAR Analysis: We estimate a VAR using quarterly data for 1988Q1–2015Q4 with the following variables: EPU index, log of Nikkei index, nominal interest rate (2 year JGB yields), log of employment, log of GDP and its components (i.e. consumption and investment). We control for the level of economic activity in Japan’s trading partners in all specifications and allow for a linear trend. We use the standard Cholesky decomposition to identify shocks. We explore the robustness of our results to the inclusion of other variables such as the VIX index and equity price volatility to explore additional effects of economic policy uncertainty after controlling for general economic uncertainty.4 Our baseline results (Figure 2) suggest an economically and statistically significant negative impact of policy uncertainty on output, employment and investment.5 A one-standard deviation shock to policy uncertainty reduces output by about 0.33 percent, employment by 0.15 percent and investment by 1 percent over one year. Controlling for other measures of economic uncertainty, the effects are reduced by about one-half for output and employment, and by 15-35 percent for investment.
Investment equation: We supplement the VAR analysis by estimating a standard investment equation, augmented with our economic policy uncertainty index:
Where is the ratio of investment to last period’s capital stock, is the ratio of the market value of equities to the net worth of nonfinancial corporates, denotes other control variables such as the real effective exchange rate (REER), real interest rate (average long-term bank lending rate minus investment deflator) and economic outlook (proxied by the leading index). The sample period includes the post-bubble period from 1994Q1–2015Q4. Table 3 shows the estimates under different specifications, using the coefficients for different variables multiplied by their standard deviation to better assess their relative economic significance. All the variables have the expected signs and both Tobin’s Q and the EPU index have relatively large and statistically significant effects on investment. As expected, when other measures of economic uncertainty or other control variables are included (specifications 3-6), the coefficient estimate for the EPU index declines but remains significant.
4 Other measures of economic uncertainty would include uncertainty related to policies. The fact that the EPU index continues to have a negative effect on economic activity when other measures of economic uncertainty are included suggests that the EPU index captures additional sources of policy uncertainty. 5 We did not find a significant effect of EPU index on consumption. This could reflect a slower response of consumption to policy uncertainty. The composition of consumption could matter: Ito (2016) finds a significant response of consumption of durable goods to shocks to policy uncertainty. It could also be the case that consumption responds more strongly to sub-components of policy uncertainty, for instance fiscal policy uncertainty.

JAPAN
INTERNATIONAL MONETARY FUND 57
D. Conclusions and Policy Implications
Policy uncertainty seems to have increased recently and preliminary estimates suggest that it could have a large dampening effect on demand, especially investment. Strengthening policy frameworks and institutions and adopting concrete and credible policy actions can help reduce policy uncertainty and support domestic demand.
Figure 2. VAR Results: Impulse Responses to EPU Shock
-0.5
-0.4
-0.4
-0.3
-0.3
-0.2
-0.2
-0.1
-0.1
0.0
0.1
0.1
1 2 3 4 5 6 7 8 9 10
Impulse Response of Employment(to one-standard deviation shock to policy uncertainty, +/- 2 standard errors)
Sources: IMF staff calculations
-0.8
-0.6
-0.4
-0.2
0.0
0.2
0.4
0.6
1 2 3 4 5 6 7 8 9 10
Impulse Response of Output(to one-standard deviation shock to policy uncertainty, +/- 2 standard errors)
Sources: IMF staff calculations
-2.5
-2.0
-1.5
-1.0
-0.5
0.0
0.5
1.0
1 2 3 4 5 6 7 8 9 10
Impulse Response of Investment(to one-standard deviation shock to policy uncertainty, +/- 2 standard errors)
Sources: IMF staff calculations
-0.3
-0.3
-0.2
-0.2
-0.1
-0.1
0.0
0.1
0.1
0.2
0.2
1 2 3 4 5 6 7 8 9 10
With VIX
With Equity Price Volatility
Impulse Response of Employment(to one-standard deviation shock to policy uncertainty, +/- 2 standard errors)
Sources: IMF staff calculations
-0.6
-0.4
-0.2
0.0
0.2
0.4
0.6
1 2 3 4 5 6 7 8 9 10
With VIX
With Equity Price Volatility
Impulse Response of GDP(to one-standard deviation shock to policy uncertainty, +/- 2 standard errors)
Sources: IMF staff calculations
-2.0
-1.5
-1.0
-0.5
0.0
0.5
1.0
1.5
1 2 3 4 5 6 7 8 9 10
With VIX
With Equity Price Volatility
Impulse Response of Investment(to one-standard deviation shock to policy uncertainty, +/- 2 standard errors)
Sources: IMF staff calculations

JAPAN
58 INTERNATIONAL MONETARY FUND
Table 1. Economic Policy Uncertainty Keywords
English term Japanese term
[1] economic, economy経済[keizai]
景気[keiki]
[1] uncertain, uncertainty
不透明[futomei]
不確実[fukakujitsu]
不確定[fukakutei]
[2] concern 不安[fuan]NOT不安定[fuantei (unstable)]
[1] tax, taxes 税[zei]
[2] taxation税制 [zeisei]
課税 [kazei]
[3] government spending 歳出 [saisyutsu]
[4] government expenditure(s) 歳出 [saisyutsu]
[5] government revenue(s)歳入 [sainyu]
財源 [zaigen]
[6] government budget予算 [yosan]
財政 [zaisei]
[7] public debt 公的債務 [koteki-saimu]
[8] government debt
国債 [kokusai]
政府債務 [seifu-saimu]
国の借金[kuni-no-syakkin]
政府の債務[seifu-no-saimu]
[9] government deficit(s) 財政赤字 [zaisei-akaji]
[10] BOJ 日銀 [nichigin]
[11] Bank of Japan 日本銀行 [nippon-ginko]
[12] central bank(s) 中央銀行 [chuo-ginko]
[13] The Fed 連銀 [rengin]
[14] Federal Reserve 連邦準備 [renpo-jyunbi]
[15] regulation(s)
[16] regulatory
[17] regulate
[18] deregulation
[19] deregulate
[20] structural reform 構造改革 [kozo-kaikaku]
[21] legislation 法案 [hoan]
[22] upper house 参議院 [sangi-in]
[23] lower house 衆議院 [syugi-in]
[24] Diet 国会 [kokkai]
[25] Prime Minister首相 [syusyo]
総理 [sori]
[26] Prime Minister's office 官邸 [kantei]
規制 [kisei]
自由化 [jiyuka]
Policy Keywords
Economy Keywords
Uncertainty Keywords

JAPAN
INTERNATIONAL MONETARY FUND 59
Table 2. Correlation of Japan EPU Index with Other Measures of Economic Uncertainty
Table 3. Aggregate Investment Equation Estimates
Alternative Measures of Economic Uncertainty Correlation with EPU Index
VIX 0.58
Equity Price Volatility (Actual) 0.51
Equity Price Volatility (Implied) 0.54
Consensus Dispersion of Forecasts 0.16
Dispersion of views on future economic conditions 1/ 0.51
Political Uncertainty Index (Ito, 2016) 0.28
Japan EPU Index (Baker et. al. 2016) 2/ 0.73
1/ Based on the dispersion of responses on the growth potential of the economy from
the BoJ's survey of households.
2/ This is the original Japan EPU index constructed using a different set of keywords
and a smaller set of newspapers
Independent variable: real investment to capital stock ratio (in percent)Variables 1/
(impact of one std. dev. change)
Tobin's Q (-3) 0.31 *** 0.15 *** 0.15 *** 0.19 *** 0.28 *** 0.29 ***
EPU (-4) -0.35 *** -0.28 *** -0.24 *** -0.18 *** -0.15 ***
Equity Price Volatility(-4) -0.13 ** -0.10 ** -0.11 ** -0.07 *
Real Interest Rate -0.14 *** -0.10 ** -0.09 **
log(REER) -0.17 *** -0.08
log(Leading Index) 0.19 ***
R-squared
Adjusted R-squared
S.E. of Regression
Durbin-Watson Statistic
1/ *, **, *** indicate statistically significant coefficients with 10%, 5%, and 1% confidence levels, respectively.
0.84
0.68
0.66
0.35
0.85
0.64
0.62
0.37
0.84
4 5 6
0.75
0.73
0.31
2
0.55
0.54
0.40
0.71
3
0.59
0.57
0.39
0.89
1
0.28
0.27
0.51
0.23

JAPAN
60 INTERNATIONAL MONETARY FUND
References
Baker, S. R., N. Bloom, and S. J. Davis, 2016. “Measuring Economic Policy Uncertainty,” forthcoming
in the Quarterly Journal of Economics.
Bloom, N., S. Bond, and J. van Reenen, 2007. “Uncertainty and Investment
Dynamics,” Review of Economic Studies, 74, 391–415.
Bloom, N., 2009. “The Impact of Uncertainty Shocks,” Econometrica, 77 no. 3 (May), 623–85.
Fernandez-Villaverde, J., P. Guerron-Quintana, K. Kuester, and J. Rubio-Ramirez, 2015. “Fiscal
volatility shocks and economic activity,” American Economic Review, 105, No. 11 (November).
Gulen, H. and M. Ion, 2016. “Policy uncertainty and corporate investment,” Review of Financial
Studies, 29, no. 3 (March), 523–64.
Ito, A., 2016. “Government Policy Uncertainty and Economic Activities”, RIETI Discussion Paper Series,
16-J-016.
Kitao, S., 2016. “Policy Uncertainty and the Cost of Delaying Reform: A case of aging Japan”, RIETI
Discussion Paper Series, 16-E-013.
Matsuura, T., 2013. “Why Did Manufacturing Firms Increase the Number of Non-Regular Workers in
the 2000s? Does International Trade Matter?” RIETI Discussion Paper, 13-E-036.
Morikawa, M., 2010. “Volatility, Nonstandard Employment, and Productivity: An
Empirical Analysis Using Firm-Level Data,” RIETI Discussion Paper, 10-E-025.
Morikawa, M., 2013. “What Type of Policy Uncertainty Matters for Business?” RIETI Discussion Paper
Series 13-E-076.
Morikawa, M., 2016. "How Uncertain Are Economic Policies? Evidence from a survey on Japanese
firms." RIETI Policy Discussion Paper Series 16-P-008.
Ono, Y. and D. Sullivan, 2013. “Manufacturing Plants' Use of Temporary
Workers: An Analysis Using Census Microdata,” Industrial Relations, Vol. 52, No. 2, pp. 419–43.

JAPAN
INTERNATIONAL MONETARY FUND 61
AN INDEPENDENT FISCAL INSTITUTION FOR JAPAN1 In response to the recent financial crisis and the ensuing buildup in public indebtedness, an increasing number of advanced economies have created independent fiscal institutions (IFIs) to improve the quality of public finances and to strengthen the credibility of government policy. A review of Japan’s fiscal policymaking over the past decades suggests that Japan would greatly benefit from establishing an IFI in line with internationally accepted standards of good practice. Such an institution could help correct critical weaknesses in policymaking and anchor expectations, especially if introduced as part of a fiscal framework with a medium-term perspective.
A. Background
In recent years, a new generation of independent fiscal institutions (IFIs) has proliferated in advanced economies, as well as in some emerging markets, partly in response to the financial crisis and the ensuing buildup in public indebtedness. The rationale for IFIs stems from the quest for transparency in public finances, and thereby, for improving fiscal policymaking. In general, IFIs are entrusted with vigilance over public finances mainly by evaluating fiscal policy usually before and during the decision-making process. They are charged with real-time forward-looking surveillance of fiscal policymaking, with a focus on macro-fiscal effects in the short to medium run, and on public debt sustainability over the long run. The purpose of this chapter is to examine the case for establishing an IFI for Japan, given past trends, current conditions, and the outlook. To this end, the rationale, experience, and effectiveness of existing IFIs are reviewed to assess their potential relevance for Japan. In addition, drawing on international good practice, the paper explores the features of such an institution that would be most suitable to address Japan’s public finances.
B. International Experience
Origins: According to origin, IFIs can be classified as the result of local political conditions; prompted by fear of, or recovery from, a crisis; or owing to an external commitment by the government. While a number of IFIs emerged due to a confrontation between political parties (e.g., United States), more recently they were established in the aftermath of a crisis to recuperate erosion in credibility (e.g., United Kingdom), or simply as a requirement under a Fund-supported stabilization program (e.g., Ireland) or under EU membership.
Rationale: The foremost argument for establishing an IFI has been the need for transparency in public finances, as the key to informed and quality policymaking. More specifically, through comprehensive and timely access to information on the government’s policy intentions and execution, the IFI is intended to correct three interrelated deficiencies in fiscal management: deficit
1 Prepared by George Kopits (APD/FAD Visiting Scholar) with inputs from Elif Arbatli (APD). A more detailed version of this paper is forthcoming as an IMF Working Paper.

JAPAN
62 INTERNATIONAL MONETARY FUND
bias, procyclicality bias and optimistic bias. If successful, the IFI can also help anchor fiscal expectations, much like an independent central bank can help anchor inflation expectations.2
Statutes: IFIs are rather heterogeneous in their statutory basis, structure, and functions (Table 1). In most countries, the enabling statute of the IFI is set in a law, while in a few countries, presumably due to historical circumstances, the IFI has been established by executive decree.
Structure: The organizational structure of IFIs varies significantly across countries. Roughly one half of IFIs are endowed with a monocratic authority, while the other half (mostly in Europe) operate under the collective leadership of a council. The monocratic model can ensure a higher degree of non-partisanship to the extent the IFI head is under stricter public scrutiny than a collective IFI where the members may represent different political parties or interest groups, thereby diluting the evaluation of a budget bill or of some policy proposal. On the other hand, collective leadership of non-affiliated experts can reduce groupthink, especially if the council includes some members from abroad—as in Ireland, Portugal, or Sweden.
Remit: Most IFIs prepare estimates and forecasts of the fiscal and macroeconomic consequences of the budget bill and proposed fiscal measures in time for consideration by the legislature before enactment. Detailed estimation of the budgetary cost of each major proposed expenditure or tax measure is undertaken by only handful of IFIs (Table 2). In a number of countries, prior to submission of the budget bill, the IFI prepares short- and medium-term no-policy-change projections to serve as the baseline to judge the realism of the government’s projections. In addition, periodically, the IFI prepares quantitative long-term scenarios and sensitivity analyses for specific policy options, with clearly spelled out macroeconomic and demographic assumptions. Some IFIs are developing and incorporating stochastic techniques to assess risks around medium- to long-term fiscal projections, stemming from various sources, including the accumulation of contingent liabilities. Notably, in a few countries (Netherlands, UK), where in the past the government’s projections had lost credibility owing to a persistent optimistic bias, the IFI is assigned the responsibility of preparing the official macro-fiscal projections. In countries where governments are subject to fiscal rules, the IFI has the added mandate of monitoring compliance with such rules. The IFIs usually have no policy-making authority, and by implication, they cannot have legally binding enforcement power.
Effectiveness: Good practice for IFIs has been codified in the Principles for IFIs by an OECD reference group, consisting of heads of these institutions, and recommended formally to member countries, including Japan, by the OECD Council. 3 Besides following these best practices, the IFI must be home-grown and home-owned, developed on the basis of the broadest possible consensus; it must be endowed with adequate financial and human resources, with proven competence to perform
2 See the analysis underlying this point in Leeper (2010).
3 In all, these 22 internationally accepted principles are grouped under nine broad headings: local ownership; independence and non-partisanship; relationship with the legislature; access to information; transparency; communication; and external evaluation. See OECD (2013).

JAPAN
INTERNATIONAL MONETARY FUND 63
quantitative analysis; and it must possess communication skills to gain the support of the media and the general public. Moreover, to earn credibility, it is essential for the IFI to demonstrate non-partisanship and technical competence at the initial phase of operation. But, even after a successful start, upon having met all the foregoing conditions, IFIs are still exposed to the will of elected officials and require an extended tenure before being well established. To claim success, an IFI needs to operate at least over two electoral cycles, with major political parties alternating each other in government. Ultimately, the success of the institution depends on public’s demand for transparency and accountability from elected political leaders.
C. The Case for an IFI in Japan
Japan’s large public debt burden, together with its declining potential growth and low equilibrium interest rates, is posing significant policy challenges, in particular with respect to ensuring a growth-friendly, gradual and credible fiscal adjustment process. In the meantime, the stop-and-go nature of fiscal policy and the frequent use of supplementary budgets are leading to policy uncertainty and rendering fiscal policy less transparent. The downside risks of prolonged stagnation in the future, coupled with a continued rise in public indebtedness, cannot be exaggerated especially with the dramatic contraction of the labor force—predicted to decline by one half between now and the 2080s. The home bias in sovereign bond holdings and extraordinary monetary expansion cannot be counted upon to last indefinitely.
Challenging trends: Over more than two decades, Japanese policymakers have struggled to emerge from the prolonged stagnation that followed the financial crisis of the early 1990s. Periodic attempts at stimulating the economy through monetary and fiscal policies did not yield a much-hoped sustained revival. The formulation of fiscal policy in Japan has straddled an unenviable dilemma between boosting economic activity on the one hand and preserving debt sustainability on the other.
Stop-and-go nature of fiscal policy: In the dynamics of the budgetary process, the Ministry of Finance tends to set rather conservative revenue forecasts despite optimistic macroeconomic projections provided by the Cabinet Office. In the course of the fiscal year, as the revenue outcome is usually more favorable than forecasted, the new information gives rise to additional demands that are met with added spending in a routine supplementary budget. During the past twenty years there have been more than 40 supplementary budgets, averaging about two per year, estimated to increase primary spending by 6 percent over initial appropriations (excluding 2008-09 and 2011). This practice creates unpredictability, and may prevent automatic stabilizers from being the first line of defense against procyclicality. The optimistic bias is evident mainly in the medium-term projections, especially for the high-growth “revitalization” projection, which can be interpreted as the government’s elusive goal, and to a lesser extent for the “prudent” projection, which implicitly incorporates some specific tax or expenditures measures. Altogether absent is a no-policy-change baseline projection against which to assess the estimated effect of the envisaged measures. Optimistic medium-term projections in return hamper the credibility of medium-term fiscal targets by reducing the implied adjustment needs.
JAPAN
64 INTERNATIONAL MONETARY FUND
Opacity and uncertainty: The lack of clearly spelled out priorities and of a credible commitment to a medium-term plan, along with mid-year improvisations through serial enactment of supplementary budgets tend to undermine the efficacy of fiscal policy and creates uncertainty for the private sector. Thus, fiscal expectations are unanchored, which at least in part may explain the overall reluctance of households and enterprises to consume and to invest, respectively. Such an outlook begs for a break with past habits of opacity and a determined shift to a fiscal framework characterized by a high level of transparency that would be conducive to a steady progress toward solving Japan’s public debt sustainability problem, paving the way to sustained growth. The establishment of an IFI can go a long way in enhancing credibility and transparency, especially if introduced as part of a fiscal framework with a medium-term perspective.
D. Design Options for Japan
Japan already has two fiscal institutions, embodied in the Prime Minister’s Council on Economic and Fiscal Policy and the Finance Ministry’s Fiscal System Council, but neither of these institutions meets any attributes enumerated in the OECD Principles. Instead, the Councils perform a useful advisory and analytical role, much like similar official bodies around the world. Drawing on the experience of IFIs with a successful track record and taking into account its own needs, Japan can select from among a number of good practices regarding the functions, statutes and structure of a prospective IFI. Ideally, the IFI should be a key component of a new fiscal policy framework.
Functions: The IFI would encourage the government to set targets for the general government balance and expenditures, along with major envisaged structural reform measures, over a medium-term horizon. As part of this approach, the government would refrain from resorting to enactment of within-year supplementary budgets, except when warranted by extraordinary unanticipated events beyond its control. The IFI would prepare a medium-term macro-fiscal baseline (no policy change) projection that would serve as the backdrop for evaluating the realism of (i) the government’s projection that incorporates the envisaged policy measures and (ii) the annual budget bill and its consistency with the target. Estimates of the output gap would allow real-time estimates of the structural (or cyclically adjusted) budget balance and assessment of the fiscal policy stance. Over time, the IFI could be entrusted with the preparation on a regular basis of long-term quantitative baseline scenarios to assess public debt sustainability, which is even more critical in the case of Japan given its large adjustment needs which will need to be met over a long horizon. Besides relying on a baseline scenario, fiscal sustainability analysis should possibly be complemented with a risk assessment applying sophisticated techniques.4 At a later stage, responsibility for preparing the official medium-term macro-fiscal projections could be shifted from the government to the IFI, to guarantee impartiality as well as greater time consistency. Also, consideration could be given to deepening the evaluation function by costing each proposed mandatory expenditure or tax measure. As this is the most resource-intensive function, it should await the availability of sufficient manpower to activate it in full. Normative functions should be
4 See the roadmap for a comprehensive risk-adjusted fiscal sustainability analysis provided by Kopits, Ferrarini, and Ramayandi (2016).

JAPAN
INTERNATIONAL MONETARY FUND 65
permanently excluded from the role of the IFI. It must be emphasized that the IFI is not a decision-making body under any circumstances.
Statutory basis: The IFI should be created through an informed and open debate, and enshrined in legislation reached on the basis of a broad political consensus. The institution should not be established simply through a government decree or legislated along party lines, in order to bestow on it the status it deserves and to assert its nonpartisanship. A strong statutory basis can serve as signaling a regime shift toward improved and transparent fiscal governance. Formal affiliation of the IFI to the government, much like an advisory function, carries the risk of government capture. Far less risky would be affiliation to the Diet, or possibly no affiliation at all. In either case, the enabling law should ensure de facto independence for the IFI. Furthermore, to enhance its effectiveness, the IFI should be charged with oversight beyond the central government and its agencies, that is, with jurisdiction over subnational governments and the rest of the public sector.
Structure: The IFI can consist of an individual head or a collective leadership, but its assessments and projections should be based on impartial, export opinion. The IFI’s work, if limited to the above envisaged functions, could be performed by a lean staff of professionals.
E. Conclusions
In response to the recent financial crisis and the ensuing buildup in public indebtedness, there has been a surge of interest in creating independent fiscal institutions (IFIs) with a view to improving the quality of public finances, and to strengthening the credibility and transparency of government policy. A strong case can be made for establishing an IFI to help correct critical weaknesses in Japan’s fiscal policymaking. An IFI by itself cannot, of course, remedy all potential failures of policymaking, but it can certainly constitute a major improvement, especially if it is introduced as part of a broader reform of the fiscal framework that would incorporate a medium-term perspective and abandonment of the discretionary short-run approach—exemplified by the routine practice of mid-year supplementary budgets.

JAPAN
66 INTERNATIONAL MONETARY FUND
Table 1. Advanced Economies: Statutes and Structure of Independent Fiscal Institutions
Sources: Kopits (2013a) and update from IFI webpages.
Table 2. Advanced Economies:
Functions of Independent Fiscal Institutions
Sources: Kopits (2013a) and update from IFI webpages.
Effective date Statute Affiliation Leadership< 10 10 to 50 50 to 100 > 100
United States (CBO) 1975 law legislature individual XNetherlands (CPB) 1986 law executive individual XBelgium (HCF) 1989 decree executive X collective (24) X XKorea (NABO) 2003 law legislature individual XSweden (FC) 2007 decree executive collective (5) X XCanada (PBO) 2008 law legislature individual XUnited Kingdom (OBR) 2010 law executive collective (3) X XAustralia (PBO) 2011 law legislature individual XIreland (IFAC) 2011 law none collective (5) XPortugal (CFP) 2011 law none X collective (5) XSlovakia (CBR) 2012 constitution none collective (3) XFinland (FPAO) 2013 law legislature individual XFrance (HCFP) 2013 law judiciary X collective (10) XItaly (UPB) 2014 constitution legislature collective (3) XSpain (AIREF) 2014 law none X individual X
Staff Outside support
Subnational coverage

JAPAN
INTERNATIONAL MONETARY FUND 67
References
Kopits, G., B. Ferrarini, and A. Ramayandi (2016) “Exploring Risk-Adjusted Fiscal Sustainability Analysis for Asian Economies,” ADB Working Paper Series No. 483, May.
Leeper, E.M. (2010). “Monetary Science, Fiscal Alchemy” in Macroeconomic Challenges in the Decade Ahead, A Symposium Sponsored by the Federal Reserve Bank of Kansas City, Jackson Hole, Wyoming, August 26-28.
OECD (2013) Principles for Independent Fiscal Institutions, Paris, February 12. http://www.pbo-dpb.gc.ca/web/default/files/files/files/Revised%20IFI%20Principles_EN%20-%2013-Feb-13.pdf

JAPAN
68 INTERNATIONAL MONETARY FUND
REFLATING JAPAN: TIME TO GET UNCONVENTIONAL?1 We simulate staff’s reform scenario and contrast it with advice from Krugman, Svensson, and Turner. Staff’s recommended set of policies has a higher probability of lasting success by directly targeting wage-price rigidities through incomes policies. It is less risky by making steady headway with fiscal consolidation through very gradual consumption tax hikes. Finally, it avoids triggering a rise in the risk premium (even a modest increase would eliminate the benefits of the alternative proposals).
A. Introduction
Ever since Japan entered the liquidity trap, a variety of policy proposals have been put forward to reflate the economy. In a nutshell, these proposals include:
Krugman (2015) appears skeptical about the effectiveness of quantitative easing and policymakers’ ability to engineer a jump in inflation expectations. Instead, he advocates highly expansionary fiscal and monetary policy (a stimulus of 5 percent of GDP and inflation well above 2 percent) to reach “escape velocity” that would bring about higher aggregate demand and inflation, in part inflate the debt away.
Svensson’s “foolproof way” to end deflation consists of implementing: 1) an upward-sloping price-level target path; 2) an initial depreciation, followed by a crawling peg of the currency to reach the desired price-level target; and 3) an exit strategy in the form of the abandonment of the crawling peg in favor of inflation or price-level targeting when the price-level target path has been achieved.
Turner (2015) suggests monetizing the (higher) fiscal deficit, financed by an irredeemable, non-interest-bearing asset of the government to the central bank.2 Technically, this financing could be performed in three ways: (a) a direct credit from the central bank to the government’s current account, (b) an interest-bearing debt issued by the government, which the central bank purchases and then converts to a non-interest-bearing non-redeemable asset; or (c) through the issuance of interest-bearing debt which the central bank perpetually rolls over while remitting to the government as profit the interest income it receives from the government. Tuner argues that while technically straightforward, monetization could be abused by politicians in the future.
Staff has suggested a more comprehensive policy package, the “three arrows plus policy package.” The package aims to put the Japanese economy on a higher sustainable real and nominal growth path, eliminate deflation risks, restore fiscal sustainability, and enhance the shock-absorbing capacity of the economy. The most innovative element of the package is an incomes policy to directly control wage growth in the economy and induce cost-push inflation, but all elements are
1 Prepared by Pietro Cova, Xavier Debrun, Zoltan Jakab, Douglas Laxton, Joannes Mongardini, and Hou Wang (all RES), Vitor Gaspar and Constant Lonkeng Ngouana (both FAD), and Elif Arbatli and Dennis Botman (both APD). A forthcoming IMF Working Paper will elaborate further on the details of staff’s proposed policy package and the simulations. 2 Bernanke (2003), Buiter (2014) and Gali (2014) propose similar policies.

JAPAN
INTERNATIONAL MONETARY FUND 69
designed to be coordinated and complementary; i.e. monetary easing and near-term fiscal stimulus boost demand, gradual increases in the VAT rate keep the risk premium in check, structural reforms raise expectations of future demand, which all combined gives firms an incentive to comply with the incomes policy.
B. Methodology
All simulations in this paper are based on the Fund’s Flexible System of Global Models (FSGM).3 Each FSGM module is an annual, multi-region, general equilibrium model of the global economy combining a mix of micro-founded and reduced-form formulations of the various economic sectors. Each country/regional block is structurally similar, but each has its own steady-state ratios and behavioral parameters.
In the FSGM module for Japan, real GDP is determined by the sum of its demand components in the short run, and the level of potential output in the long run. The key price level, the consumer price index (CPI), is modeled by a Phillips curve.
Consumption is determined partly by forward-looking households based on the Blanchard-Weil-Yaari overlapping generations (OLG) model. OLG households take into account the expected path for government debt. In their savings decisions, they treat government bonds as wealth since there is a belief that the associated tax liabilities will fall on future generations. Saving is based also on domestic labor income, the private business capital stock, and net foreign assets denominated solely in U.S. dollars. Consumption dynamics are driven too by liquidity-constrained (LIQ) households. They do not have access to financial markets, do not save, and thus consume all their income each period. This feature amplifies the non-Ricardian properties of the model.
Private business investment is modeled on an extended version of Tobin's Q. Investment is negatively correlated with real interest rates, and positively with the output gap (a financial accelerator type mechanism). Firms choose their capital stock to maximize their profits.
The government spends on consumption and infrastructure, and on transfers to households. Infrastructure investment enhances productivity– for example, through improved transportation links. The government chooses a long-run level of debt relative to GDP. In order to meet the debt target, under the standard fiscal reaction function in the model, the government adjusts lump-sum transfers.
The model tracks aggregate exports and imports, and their oil, metals and food components. Exports increase with foreign activity, and imports with domestic activity. Relative international prices, incorporating exchange rate changes, affect both exports and imports.
3 Andrle, M. and others (2015), “The Flexible System of Global Models — FSGM,” IMF Working Paper No. 15/64.

JAPAN
70 INTERNATIONAL MONETARY FUND
Potential output is based on Cobb-Douglas production technology with trend total factor productivity, the steady-state labor force, the non-accelerating inflation rate of unemployment (NAIRU), and the actual capital stock.
The rate of increase in the core price index (CPIX) is determined by a Phillips curve. As well as the output gap, and expected inflation, the equation contains pass-through from the exchange rate, and from oil and food prices. Wage inflation adjusts such that the real wage returns to its equilibrium gradually, at a rate depending on the expected evolution of overall economic activity.
Monetary policy is represented by an interest rate reaction function, based on an inflation-forecast-based rule. The 10-year Japanese government bond interest rate is determined by the expectations theory of the term structure, plus a term premium.
The simulations are calculated as deviations from the baseline projections for Japan included in the July 2016 World Economic Outlook (see International Monetary Fund, 2016). Under the baseline scenario, the authorities are assumed to follow the existing policy mix of ¥80 trillion yearly QQE, the same fiscal policy including the increase in the VAT rate to 10 percent in October 2019, and unchanged structural policies.
C. Assumptions for Simulating the Three Arrows Plus Policy Package
The numerical assumptions for monetary, fiscal and incomes policies are listed in Table 1. These assumptions establish a baseline for comparison with alternative policy proposals. Structural reforms are modeled separately.
In the simulation for Three Arrows Plus, we include another round of Quantitative and Qualitative Easing (QQE) by the Bank of Japan. We assume that the additional purchases of long-term government bonds (quantitative easing) by the Bank of Japan compress long-term yields, i.e. the term premium decreases. In addition, we assume that by purchasing corporate bonds (qualitative easing), the BoJ can compress the corporate risk premium too. In accordance with monetary easing, the monetary policy rate was held fixed at the effective lower bound (ELB) throughout the exercise for the whole simulation period.
Fiscal policy under Three Arrows Plus involves a gradual VAT rate increase. We assume annual increases of 0.5 percentage points, such that the VAT tax rate reaches 15 percent in 2030. This is assumed to be preannounced and fully anticipated by all agents in the economy. In order to offset negative aggregate demand consequences of the VAT-hike, and to help with the achievement of the inflation target, we add an incomes policy with a gradual increase in public wages, and a temporary increase in transfers to liquidity-constrained households.
The incomes policy is modeled through shocks to expectations of both price and wage inflation. The shocks are calibrated such that core inflation (CPIX) inflation is higher by around 1 percentage point in the first year. In line with the proposed incomes policy, the shock corresponds to an initial boost to real wages, as productivity increases are factored into wage setting behavior.

JAPAN
INTERNATIONAL MONETARY FUND 71
We also simulated the case where price inflation adjusts more slowly to the Three Arrows Plus policy package. In these alternative scenarios, the price inflation shock was set to a value such that the initial response of inflation is one-third and two-thirds of the Four Arrows Policy Package scenario in the first and the second year, respectively. The shock to wage inflation is also reduced somewhat, but due to the higher bargaining power it is less impacted in this scenario. Otherwise all other assumptions were held the same.
Table 1. Assumptions for Simulating the Three Arrows Plus Policy Package 2017 2018 2019 2020 2021-
Monetary Policy: Term premium (basis points difference) -10 -15 -20 -10 Decays with
AR=0.6
Corporate risk premium (basis points difference) -1.7 -8.3 -8.3 -8.3 Decays with
AR=0.6
Short-term policy rate Fixed at baseline 2017-2022
Fiscal policy: VAT 0.5pp rise every year in 2017-2030, end tax rate=15%
Targeted transfers (% of baseline GDP) 0.8 1.6 1.5 1.4 0.9, then 0
Incomes policy: Inflation expectations shock 1/ 0.9 1.1 1.8 1.5 1.2 then 0
Wage inflation expectations shock 2/ 0.9 1.6 2.3 1.8 1.2 then 0
With slow inflation adjustment: As above except for Incomes policy: Inflation expectations shock 1/ 0.2 0.7 1.7 1.3 1.1 then 0
Wage inflation expectations shock 2/ 0.8 1.4 2.2 1.1 0.8 then 0
Source: Authors' assumptions. 1/ Impact of inflation expectations shocks on core inflation (net of the impact of VAT). 2/ Impact of wage inflation expectations on wage inflation.
D. Assumptions for Simulating Krugman’s Irresponsible Fiscal and Monetary Policy
Krugman (2015) argues that Japan should pursue a period of Irresponsible Fiscal and Monetary Policy to deal with the ELB constraint. In order to assess the merits of Krugman’s argument, we present the results of a simulation where the Japanese authorities follow expansionary fiscal and monetary policies over the period 2017-21.
For the model simulations, the Irresponsible Fiscal and Monetary Policy is represented by a fiscal stimulus that results in a transitory deviation from a debt stabilization policy. Specific assumptions

JAPAN
72 INTERNATIONAL MONETARY FUND
are listed in Table 2. The assumed fiscal shock builds up gradually: 2 percent of GDP in year 1, 4 percent year 2; and 5 percent in years 3 and 4. The increased government spending is equally distributed across public infrastructure investment, targeted fiscal transfers, and government purchases of goods and services.
The irresponsible monetary policy keeps the BoJ policy rate fixed at the current level of zero for five years. This implies a significant departure from the inflation target of 2 percent. Beyond 2020, monetary policy reacts to higher output gap and inflation in order to get inflation back to target, and to provide the long-run nominal anchor that the economy, as well as the model, needs.
Table 2. Assumptions for Simulating Krugman’s Irresponsible Fiscal and Monetary Policy 2017 2018 2019 2020 2021-
Monetary Policy:
Term premium (basis points difference) -10 -15 -20 -10 Decays with
AR=0.6
Corporate risk premium (basis points difference) -1.7 -8.3 -8.3 -8.3 Decays with
AR=0.6
Short-term policy rate Fixed at baseline 2017-2022
Fiscal policy:
VAT as in the baseline
Targeted transfers (% of baseline GDP) 0.7 1.3 1.7 1.7 1.7 then 0
Public investments (% of baseline GDP) 0.7 1.3 1.7 1.7 1.7 then 0
Inflation expectations shock 1/ 0.7 1.3 1.7 1.7 1.7 then 0
Wage inflation expectations shock 2/
As above except for:
Rise in term premium by 100 basis points
Term premium (basis points difference) 100 100 100 100 100 with decay
of AR=0.75
Inflation expectations shock 1/
Wage inflation expectations shock 2/ 200 200 200 200 200 with decay
of AR=0.75
Source: Authors' assumptions.
1/ Impact of inflation expectations shocks on core inflation (net of the impact of VAT).
2/ Impact of wage inflation expectations on wage inflation.
E. Assumptions for Simulating Svensson’s Foolproof Way
Svensson (2000) argued that Japan could end deflation by following a Foolproof Way of escaping from a liquidity trap. This policy consists of a credible commitment to price level path targeting (PLPT); exchange market intervention; measures to maintain low long-term interest rates (e.g., forward guidance, central bank long-term bond purchases); and a return to flexible inflation targeting once the PLPT is achieved.

JAPAN
INTERNATIONAL MONETARY FUND 73
PLPT, if implemented credibly, guarantees that inflation on average will be close to target. The policy has memory: it will react to a negative deviation that emerges in one period by targeting a positive deviation in a future period. To capture this response, we insert the deviation from the target path for the price level in the monetary policy reaction function, with a coefficient of 0.05 (Table 3).
Table 3. Assumptions for Simulating Svensson's Foolproof Way
2017 2018 2019 2020 2021-
Monetary Policy: Price level target coefficient 0.05 0.05 0.05 0.05 0.05
Long term price level target Gradually reaching 10 percent higher target price level
Short-term policy rate Fixed at baseline 2017-2022
FX premium 0.6 0.4 0.3 0.1 -0.5 with decay of AR=0.75
With rise in term premium: As above except for Long-term price level target Gradually reaching 5 percent higher target price level
Inflation expectations shock 1/ 0.5 0.4 0.4 0.4 0.4 with decay of AR=0.75
Source: Authors' assumptions. 1/ Impact of inflation expectations shocks on core inflation (net of the impact of VAT).
2/ Impact of wage inflation expectations on wage inflation.
F. Assumptions for Simulating Turner’s Monetization of the Deficit
Turner (2015) proposes to monetize a portion of the fiscal deficit in Japan. He argues that Japan should consider a policy of running a higher fiscal deficit, which is financed by an irredeemable, non-interest-bearing asset of the government to the central bank.4 Technically, this financing could be performed in three ways: (a) a direct credit from the central bank to the government’s current account, (b) an interest-bearing debt issued by the government, which the central bank purchases and then converts to a non-interest-bearing non-redeemable asset; or (c) through the issuance of interest-bearing debt which the central bank perpetually rolls over while remitting to the government as profit the interest income it receives from the government. Non-technically, these measures amount to financing the budget deficit by issuing central bank money.
To be precise, Turner’s proposal essentially contains three elements (i) more explicit coordination between monetary and fiscal policies (helicopter money); (ii) the conversion of Bank of Japan holdings of JGBs to perpetuities; and (iii) and the forced non-remuneration of excess reserves serving as an implicit tax on the financial system. In the simulations we only cover (i); i.e. “flow monetization” and not “stock monetization,” which could also have implications for debt dynamics,
4 Bernanke (2003), Buiter (2014) and Gali (2014) also propose similar policies.

JAPAN
74 INTERNATIONAL MONETARY FUND
financial stability, inflation expectations, and the conduct of monetary policy once objectives have been achieved.
We analyze the benefits and risks of the proposal by simulating an amended version of the FSGM. In this scenario, the Japanese authorities follow expansionary fiscal and monetary policies over the period 2017-21, and the additional fiscal deficit is financed by money creation (Table 4). By construction, in the model, interest-bearing debt is not affected by the additional fiscal stimulus: we introduce instead an irredeemable non-interest bearing liability (money) to finance the increased budget deficit. For comparability with Krugman’s Irresponsible Fiscal and Monetary Policy, we assume the same fiscal stimulus. Beyond 2022, fiscal policy reverts back to the non-money financing setup once the economy is out of the ELB and the liquidity trap.
Table 4. Assumptions for Simulating Turner's Monetization of the Deficit
2017 2018 2019 2020 2021-
Monetary Policy: Finances deficit through money creation and normalizes after 2021
Short-term policy rate Fixed at baseline 2017-2021
Fiscal policy: VAT as in the baseline
Targeted transfers (% of baseline GDP) 0.7 1.3 1.7 1.7 1.7 then 0
Public investments (% of baseline GDP) 0.7 1.3 1.7 1.7 1.7 then 0
Public consumption (% of baseline GDP) 0.7 1.3 1.7 1.7 1.7 then 0
With inflation scare: Term premium shock (basis point differences) 400 400 400 400 400 with decay of AR=0.75
Inflation expectations shock 1/ 1 1 1 1 1 then 0
Wage inflation expectations shock 2/ 1 1 1 1 1 then 0
With inflation scare and BoJ response: Term premium shock (basis point differences) 400 400 400 400 400 with decay of AR=0.75
Inflation expectations shock 1/ 1 1 1 1 1 then 0
Wage inflation expectations shock 2/ 1 1 1 1 1 then 0
Short-term policy rate Fixed at baseline for 2017-19, then following an inflation-forecast targeting rule
Source: Authors' assumptions. 1/ Impact of inflation expectations shocks on core inflation (net of the impact of VAT). 2/ Impact of wage inflation expectations on wage inflation.
G. Three Arrows Plus Package
According to the simulations, the Three-Arrows-Plus package (excluding structural reforms) would result in higher growth and inflation than the baseline over the medium term (Figure 1, blue line). On average, real GDP growth would be 0.4 percentage point higher each year over the forecast

JAPAN
INTERNATIONAL MONETARY FUND 75
horizon, while CPI inflation (excluding the effects of the VAT increase) would overshoot the BoJ target of 2 percent by 2019.5 The output gap would turn positive by 2019, in contrast to the baseline scenario where negative output gaps persist, while policy rates would not respond as it is optimal under these circumstances to overshoot the inflation target. The combination of higher real GDP growth, gradual VAT increases, and inflation would put the net-debt-to-GDP ratio on a downward trajectory, which would reduce the term premium marginally as markets would now consider the debt more sustainable. The REER would depreciate moderately, followed by a slight rebound in the outer years. Overall, the proposed policy would end deflation and improve moderately real GDP growth and debt sustainability over the medium term, underscoring that the ambitious targets of Abenomics can still be achieved within a relatively short time frame.
The assumption under the proposed policy package is that CPI inflation responds contemporaneously to incomes policy. We also investigate the sensitivity of our results to the relaxation of this assumption. This slower adjustment may reflect that firms may initially compress their margins to absorb the cost of higher wage bills in order to maintain competitiveness. Specifically, we run the following scenario where CPI inflation only reflects 33 percent of the wage inflation at time t, 66 percent at t+1, and 100 percent at time t+2 (Figure 1, red line).
The results are similar to our standard policy package, but with some delay in the adjustment process. As it now takes longer for the economy to exit deflation, the increase in real GDP through higher private investment and net exports is delayed. This slower expansion in domestic demand is, however, partly compensated by a rise in real wages, as wage inflation now rises faster than price inflation. This leads to slightly higher consumption expenditures compared to the benchmark policy package. The real exchange rate responds in a similar fashion, with an initial small depreciation followed by a slight appreciation in the outer years. Overall, aggregate demand expands by less than if CPI inflation adjusts contemporaneously to wage inflation. The slower GDP and inflation dynamics translate into a slower nominal GDP growth than under the proposed policy package, which in turn explains the smaller reduction in the debt-to-GDP ratio.
5 Monetary policy in the simulations is assumed to target inflation excluding the direct impact of the VAT increase. As a result, the relevant inflation comparison between the scenarios is the one excluding the direct impact of the VAT increase.

JAPAN
76 INTERNATIONAL MONETARY FUND
Figure 1. Simulations of the Three Arrows Plus Package

JAPAN
INTERNATIONAL MONETARY FUND 77
H. Krugman’s Irresponsible Fiscal and Monetary Policy
The results of these simulations are shown in Figure 2. As expected, Irresponsible Fiscal and Monetary Policy leads to higher real GDP growth and inflation. Since government debt is assumed to be financed through long-dated maturity debt at fixed nominal rates, real interest payments and real expenditures on cyclical components drop. Given the faster increase in nominal GDP growth, the net government debt-to-GDP ratio falls over the medium term. The REER depreciates faster than under our proposed policy package.
This scenario, however, is not without considerable risk, stemming from market expectations of debt sustainability and future inflation. In particular, we assume that financial markets do not adjust their expectations, such that real interest rates decline, as envisaged by Krugman. However, if financial markets anticipate higher debt and inflation in the future, this will result in higher long-term nominal interest rates.
We illustrate these risks with two alternative scenarios of a 100 and 200 basis points increase in the difference between short- and long-term interest rates (the term premium) over the forecast horizon. The assumed increases in the term premium are within the actual range of variation over the period 1990-2015. Higher term premiums feed into higher cost of lending for both households and the nonfinancial corporate sector. As a consequence, consumption and investment are lower. Smaller output gaps and higher unemployment create less inflationary pressures. Even without a policy reaction from the central bank, the fiscal boost is therefore offset by the drop in private demand. As a result, if the term premium rises by 100 basis points, net government debt as a percentage of GDP eventually ends up at the same level as in the proposed policy package by 2021. If the term premium rises by 200 basis points, the debt path becomes explosive, while the REER appreciates first due to higher long-term interest rates. So, the exchange rate becomes a shock amplifier rather than a shock absorber.
Based on these results, we conclude that Krugman’s proposal critically depends on market expectations of future taxes and higher inflation. If market expectations remain unchanged, Krugman’s proposal has a more favorable outcome than our proposal. However, if market expectations adjust to higher future inflation through an increase in the term premium, the positive impact from higher inflation is offset by higher long-term nominal interest rates, keeping real rates unchanged or higher.

JAPAN
78 INTERNATIONAL MONETARY FUND
Figure 2. Simulations of Krugman’s Irresponsible Fiscal and Monetary Policy

JAPAN
INTERNATIONAL MONETARY FUND 79
I. Svensson’s Foolproof Way
Svensson (2000) argued that Japan could end deflation by following a foolproof way of escaping from a liquidity trap. This policy consists of a credible commitment to price level path targeting (PLPT), an exchange rate intervention policy supported by other policies to maintain low real long-term interest rates, and a return to flexible inflation targeting once the PLPT is achieved. The PLPT serves to help raise inflation expectations temporarily above longer-term inflation objectives and, more importantly, to prevent long-term inflation expectations from ratcheting upwards. The higher inflation expectations over the medium term will be successful in reducing real interest rates and stimulating domestic demand provided that the BoJ can employ other measures to maintain low nominal longer-term interest rates.
A practical implementation of the basic approach outlined by Svensson has been successfully adopted in the Czech Republic when the economy was constrained by the ZLB (see Alichi and others, 2015a,b). However, implementation in Japan would have important complications that might make this policy package less successful than in the Czech Republic. The MoF is legally in charge of exchange rate policy and the BoJ is not allowed to intervene in the foreign exchange market. At a minimum, the implementation of the Foolproof Way would require close coordination between the MoF and the BoJ or an amendment of the central bank law. We abstract from these legal impediments in the simulations below. In addition, the Japanese economy is less open that the one in the Czech Republic. As a result, the BoJ may have to rely more heavily on the exchange rate and other policies to credibly maintain long-term real interest rates low. Finally, there are important perceptions that this might be a beggar-thy-neighbor policy and would require the support of other countries especially in the current environment of global deflationary pressures and weak growth.
If market participants firmly expect a higher future price level, the nominal exchange rate depreciates immediately. This would be supported if necessary under the Svensson program by official market intervention. To represent such an effect in the simulations, we add a shock to the FX premium.
In contrast to Krugman’s Irresponsible Fiscal and Monetary Policy and Turner’s Monetization of the Deficit (Section J), this policy does not constitute a major departure from a flexible inflation targeting framework. Its distinctive feature is to use the exchange rate as an instrument to achieve the PLPT path. As the economy exits deflation, monetary policy is assumed to go back to inflation targeting using the short-term interest rate as the main instrument to manage the short-run inflation-output trade-off.
The results of these simulations are shown in Figure 3 (red line). As expected, the Foolproof Way also leads to an overshoot in inflation. The depreciation in the currency and the measures to maintain low longer-term real interest rates generate a 1.5 percent positive output gap. If the PLPT path is credible, both inflation and wage inflation expectations gradually adjust. The depreciation and the reduction in real interest rates help to jolt the economy out of deflation, Lower interest rates and higher tax revenues put the government debt-to-GDP ratio onto a gradually decreasing path.
Compared to our proposed policy package, the Foolproof Way delivers higher output, lower net debt and a slightly smaller inflation overshoot if long-term rates do not adjust to expected higher nominal interest rates.

JAPAN
80 INTERNATIONAL MONETARY FUND
As such, results crucially depend on how long-term interest rates evolve. We consider an alternative scenario where the BoJ aims for a more gradual increase in inflation, and where the special measures fail to prevent a rise in long-term interest rates. In this case, much of the positive impact of Svensson’s Foolproof Way fades: the outcome is lower inflation and higher debt than under our proposal (Figure 3, black line).
Figure 3. Simulations of Svensson’s Foolproof Way

JAPAN
INTERNATIONAL MONETARY FUND 81
J. Turner’s Monetization of the Deficit Scenario
We analyze the benefits and risks of Turner’s proposal by simulating an amended version of the FSGM.6 In this scenario, the Japanese authorities follow expansionary fiscal and monetary policies over the period 2017-21 and the additional fiscal deficit is financed by money creation. By construction, interest-bearing debt is not affected by the additional fiscal stimulus. Specifically, we assume the same fiscal stimulus as in Krugman’s irresponsible fiscal and monetary policy scenario. Beyond 2022, fiscal policy is assumed to revert back to the non-money financing setup once the economy is out of the ZLB and the liquidity trap.
We also assume that throughout the projection period, the BoJ keeps its policy rate at the current level. As with Krugman’s scenario, this scenario also implies a significant departure from the inflation target of 2 percent. As the economy departs from the ZLB, monetary policy starts reacting to higher output gap and inflation in order to get inflation back to target.
The results of these simulations are shown in Figure 4. Monetization of the Deficit does stop deflation, and boost real GDP growth. As the fiscal stimulus is assumed to be financed by non-interest bearing debt, nominal interest payments remain constant and the real debt burden therefore falls. Higher nominal income leads to higher (nominal) tax revenues. The net government debt-to-GDP ratio falls over the medium term by around 30 percentage points, despite the fiscal expansion. The REER depreciates to provide an additional stimulus to the economy.
Overall, Turner’s proposal would give a stronger boost to the economy than our proposed package. However, it implies a significant departure from the existing monetary policy framework, under which the official BoJ inflation target of 2 percent in principle provides a nominal anchor. This means more uncertainty. The major risk stems from market expectations of higher inflation, as the commitment from the authorities not to resort again to monetary financing may not be credible. It may also be the case that politicians start using the monetary financing of the deficit as an excuse to delay fiscal consolidation (e.g., VAT increases). In other words, market participants might expect further fiscal stimulus in the future, again financed by monetary expansion. This gives rise to the specter of “fiscal dominance,” where the financing needs of the government override the inflation control objective of the central bank. An inflation scare would be more protracted if this type of policy lacks a proper long-term macroeconomic framework. It would result in higher long-term nominal interest rates, through an increase in the term premium and a ratcheting up of inflation expectations. The central bank would then need to tighten, to bring inflation expectations back under control.
We illustrate these risks with two alternative scenarios. In both, we assume the inflation scare to translate in a 400 basis points increase in the term premium and a 1 percentage increase in inflation
6 Following Turner (2015) we added money into the government’s budget constraint as an additional source of revenue. This is then used to purchase goods and services from the private sector. In this way, the private sector’s budget constraint is not directly affected, but only indirectly through higher (nominal) demand and fiscal transfers. One should note, however, that this treatment of money suffers several shortcomings; we abstract from liquidity services provided by money and its ability to serve as a store of value.

JAPAN
82 INTERNATIONAL MONETARY FUND
expectations. The two alternative scenarios differ to the extent that a) the BoJ does not respond to the inflation scare; and (b) the BoJ does respond, starting in 2019. In both scenarios, the inflation scare does not directly feed into higher interest rate payments of the government, but has a considerable impact on the rates faced by the private sector (both households and the nonfinancial corporate sector). As a consequence, both private investment and consumption are lower than in the scenario without higher term premiums. Lower output gaps and higher unemployment create less inflationary pressures. In the scenario where monetary policy reacts after 2019, lending rates rise even more sharply and the anti-inflationary monetary policy eventually leads to a drop in output and consumption, together with an appreciation of the REER. The net government-debt ratio still ends up at a lower level, compared to the Three-Arrows-Plus package. But inflation substantially exceeds the target for a more prolonged period, and output growth is lower, and less stable.
Turner’s proposal for monetization of the fiscal deficit therefore critically depends on market expectations of future inflation, and how monetary policy would handle these risks. If market expectations remain unchanged, Monetization of the Deficit implies significantly lower debt and higher output and inflation than Three Arrows Plus. However, if market expectations adjust to higher future (fiscally-induced) inflation through an increase in the term premium, and monetary policy then pursues an anti-inflationary policy, the macroeconomic costs might well offset the benefits of lower interest-bearing debt.
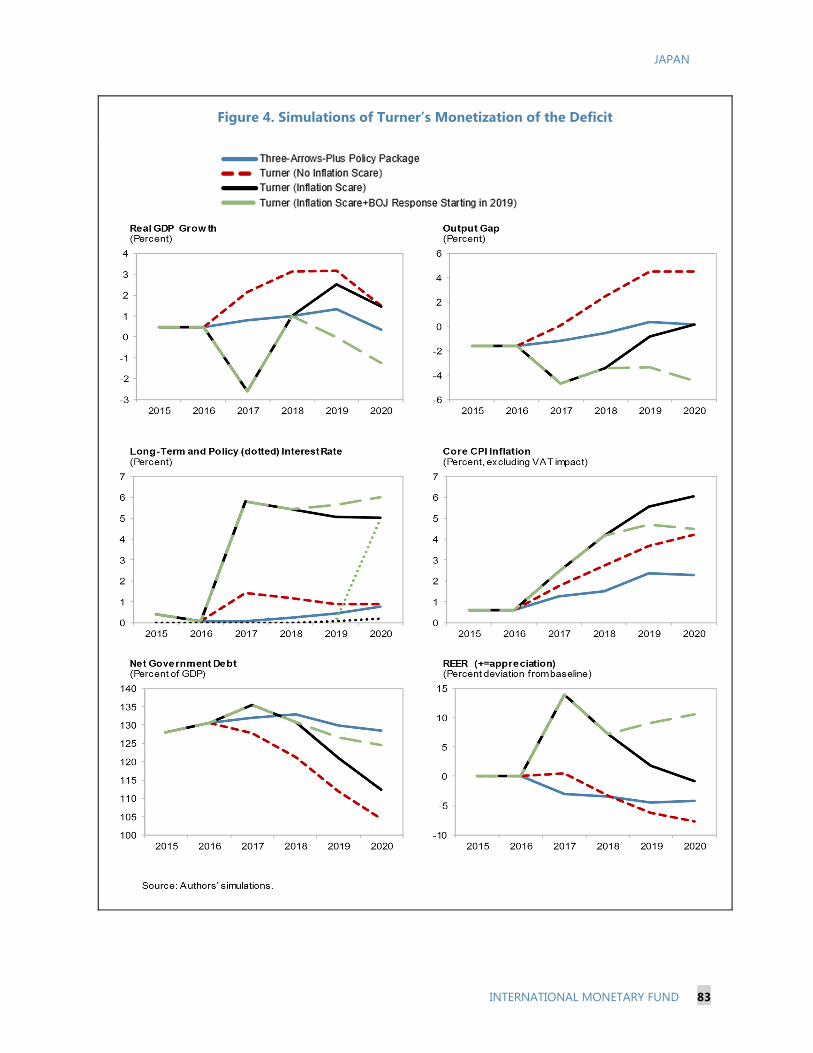
JAPAN
INTERNATIONAL MONETARY FUND 83
Figure 4. Simulations of Turner’s Monetization of the Deficit

JAPAN
84 INTERNATIONAL MONETARY FUND
K. Conclusions and Policy Implications
In this chapter, we propose a comprehensive policy package to end deflation in Japan. The policy package builds on the authorities’ current three-arrow approach. We propose to bring the three arrows together in a coherent and comprehensive package. We argue that both monetary and fiscal policies have to be embedded in long-term frameworks that deal with uncertainty and anchor private sector expectations about the behavior of inflation and public debt, over the long run. We also propose to add incomes policy as an extra arrow. This is in line with the practice in the US that contributed to ending the Great Depression in the 1930s. We also show through a series of simulations how the proposed package may be more likely to succeed than other proposals as it mitigates the risk of an adverse response from the private sector.
The policy challenge to end deflation in Japan is formidable. As shown by the experience over the last 25 years, a separate instruments’ approach will not succeed. It is essential instead to use multiple coordinated instruments, in a framework that over time ensures stability of inflation and a sustainable path of government debt.
JAPAN
INTERNATIONAL MONETARY FUND 85
References
Alichi, A., J. Benes, J. Felman, I. Feng, C. Freedman, D. Laxton, E. Tanner , D. Vavra, and H. Wang,( 2015a), “Frontiers of Monetary Policymaking: Adding the Exchange Rate as a Tool to Combat Deflationary Risks in the Czech Republic”, IMF Working Paper No. 15/74.
Alichi, A., K. Clinton, C. Freedman, O. Kamenik, M. Juillard, D. Laxton, J. Turunen, and H. Wang (2015b), “Avoiding Dark Corners: A Robust Monetary Policy Framework for the United States,” IMF Working Paper No. 15/134.
Andrle, M., P. Blagrave, P. Espaillat, K. Honjo, B. Hunt, M. Kortelainen, R. Lalonde, D. Laxton, E. Mavroeidi, D. Muir, S. Mursula, S. Snudden, 2015, “The Flexible System of Global Models – FSGM,” IMF Working Paper No. 15/64.
Bernanke, B. S., 2003, “Some Thoughts on Monetary Policy in Japan,” Remarks before the Japan Society of Monetary Economics, Tokyo, Japan, May 31, 2003, available at http://www.federalreserve.gov/BOARDDOCS/SPEECHES/2003/20030531/default.htm
Buiter, W. H., 2014, “The Simple Analytics of Helicopter Money: Why It Works – Always”, in Economics, Vol. 8, 2014-28, August 2014.
Galì, J.,2014, “The Effects of a Money-Financed Fiscal Stimulus,” Universitat Pompeu Fabra and Barcelona, available at http://crei.cat/people/gali/gmoney.pdf
Krugman, P., 2015, “Rethinking Japan,” in The New York Times, October 20, 2015, available at http://mobile.nytimes.com/blogs/krugman/2015/10/20/rethinking-japan/
Svensson, L., 2000, “The Zero Lower Bound in an Open Economy: A Foolproof Way of Escaping from a Liquidity Trap,” NBER Working Paper 7957.
Turner, A., 2015, “The Case for Monetary Finance – An Essentially Political Issue”, paper presented at the IMF 16th Jacques Polak Annual Research Conference, November 2015, available at http://www.imf.org/external/np/res/seminars/2015/arc/pdf/adair.pdf