imf country report no. 15/350 islamic republic of iran · islamic republic of iran selected issues...
TRANSCRIPT

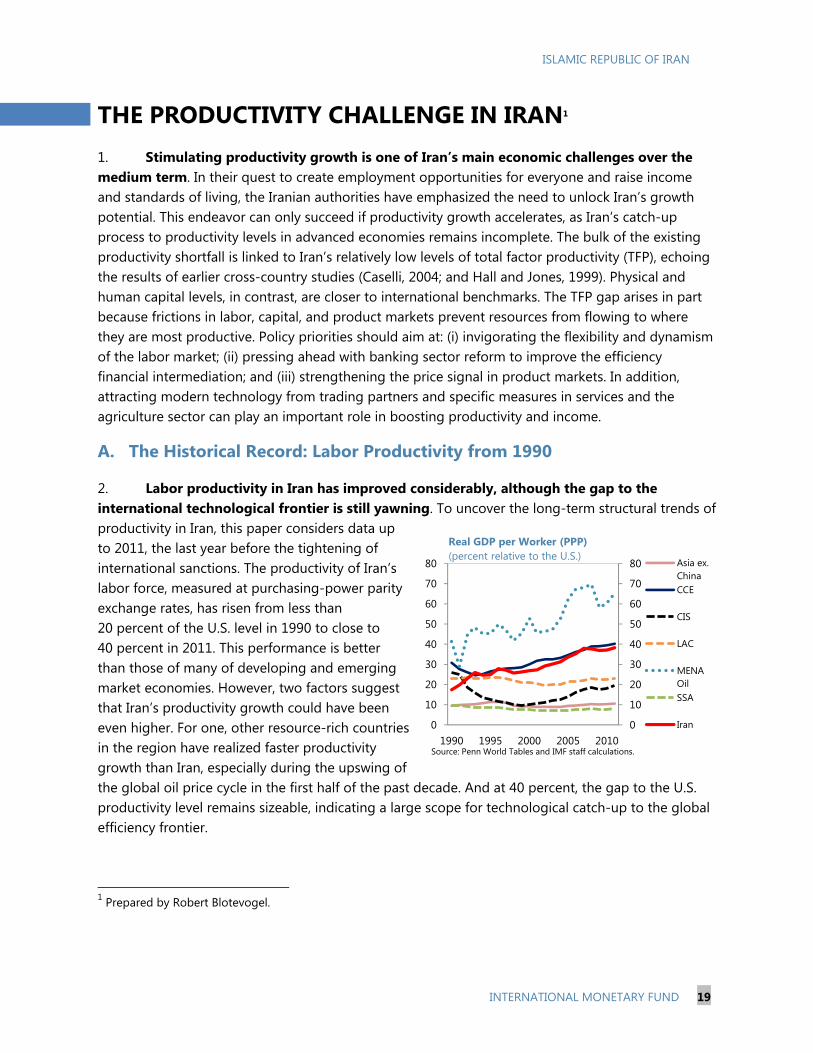
© 2015 International Monetary Fund
IMF Country Report No. 15/350
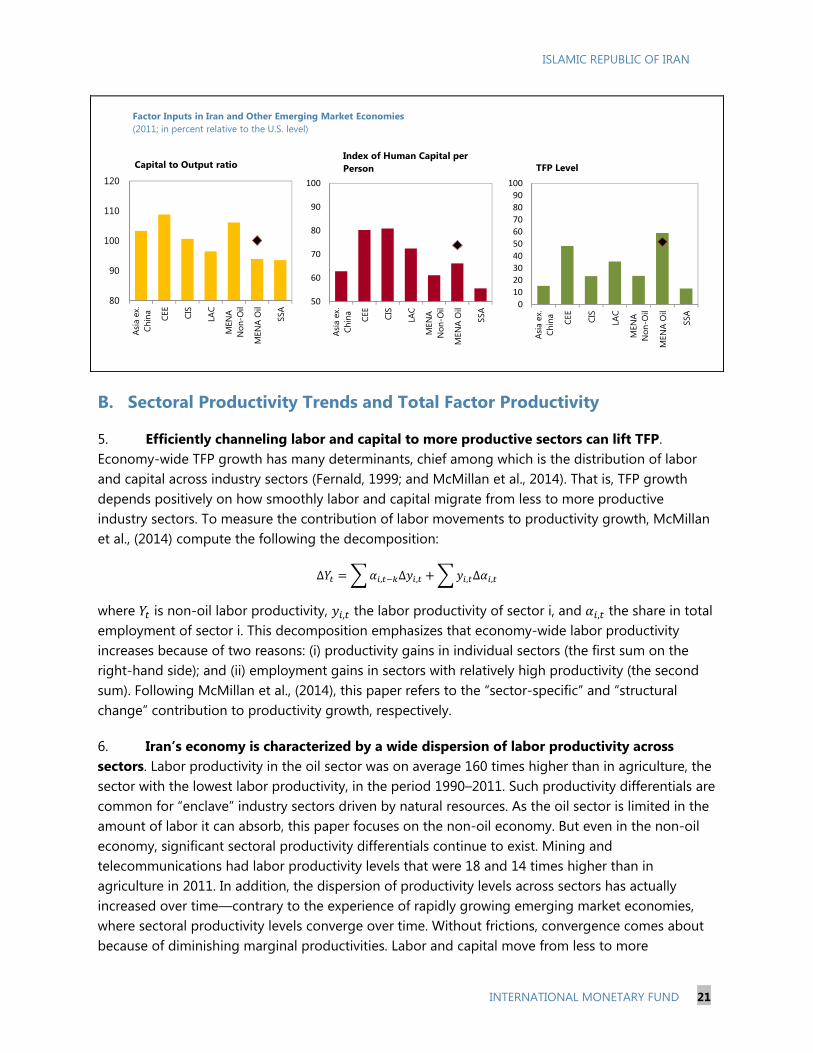
ISLAMIC REPUBLIC OF IRAN SELECTED ISSUES
This Selected Issues paper on the Islamic Republic of Iran was prepared by a staff team of
the International Monetary Fund. It is based on the information available at the time it
was completed on November 19, 2105.
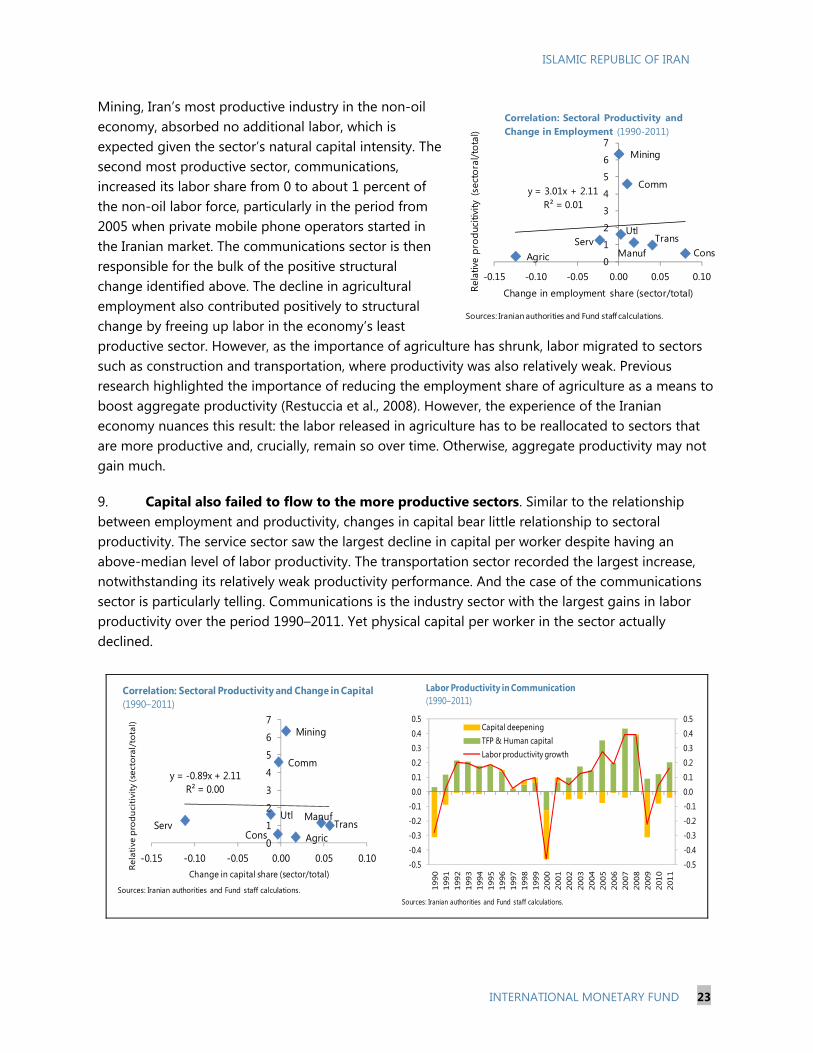
Copies of this report are available to the public from
International Monetary Fund Publication Services
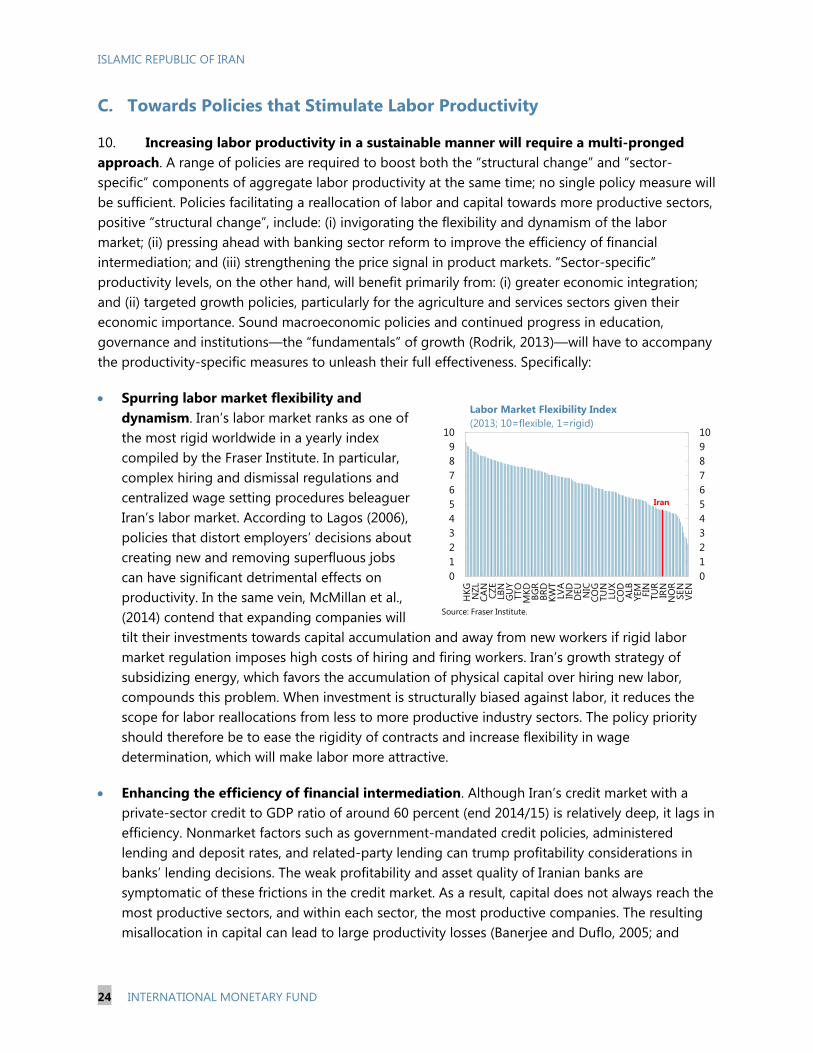
PO Box 92780 Washington, D.C. 20090
Telephone: (202) 623-7430 Fax: (202) 623-7201
E-mail: [email protected] Web: http://www.imf.org
Price: $18.00 per printed copy
International Monetary Fund
Washington, D.C.
December 2015

ISLAMIC REPUBLIC OF IRAN SELECTED ISSUES
Approved By Middle East and Central Asia Department
Prepared By Olivier Basdevant and Robert Blotevogel
A MEDIUM-TERM PERSPECTIVE TO FISCAL POLICY DESIGN __________________________ 2
A. Current Challenges: Limited Fiscal Space for Development Spending __________________ 2
B. Future Challenges: Sustainable use of Oil Revenue, Aging Population, and Debt _______ 4
C. Options for a Medium-Term Fiscal Framework _________________________________________ 7 References _______________________________________________________________________________ 13
TABLE 1. Oil Revenue Management and Public Investment _____________________________________ 10
APPENDIX I. The Permanent Income Hypothesis ____________________________________________________ 16
THE PRODUCTIVITY CHALLENGE IN IRAN ____________________________________________ 19
A. The Historical Record: Labor Productivity from 1990__________________________________ 19
B. Sectoral Productivity Trends and Total Factor Productivity ____________________________ 21
C. Towards Policies that Stimulate Labor Productivity ___________________________________ 24 References _______________________________________________________________________________ 27
CONTENTS
November 19, 2015
ISLAMIC REPUBLIC OF IRAN
2 INTERNATIONAL MONETARY FUND
A MEDIUM-TERM PERSPECTIVE TO FISCAL POLICY DESIGN1 Fiscal policy design in Iran faces numerous challenges. Some are current, such as managing volatile oil revenue while addressing development needs. Other challenges are related to demographic pressures from new entrants to the labor market, as the country needs to prepare from aging pressures in the decades to come. This note provides some options to strengthen Iran’s fiscal framework, highlighting the need for a medium-term framework, anchored on key variables such as the non-oil fiscal deficit. Looking forward, fiscal rules could be considered, once a medium-term fiscal framework is in place.
A. Current Challenges: Limited Fiscal Space for Development Spending
Iran faces a number of fiscal policy challenges, from oil revenue shocks and fuel subsidies, to budget fragmentation and rigidities, all of which have contributed to procyclical policies and low growth performance. With medium-term planning, macroeconomic stability, and adequate spending, fiscal policy could play a critical role in fostering growth. Ultimately, addressing these issues would help Iran achieve its objective of becoming one of the fastest growing emerging economies.
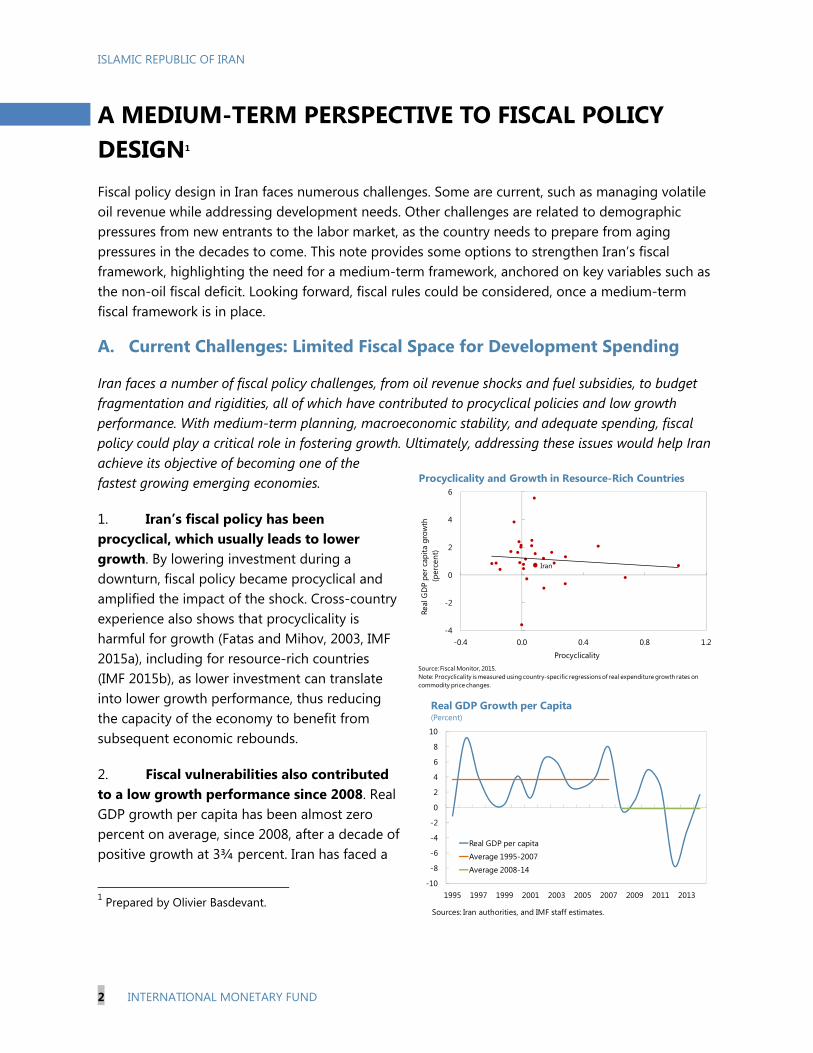
1. Iran’s fiscal policy has been procyclical, which usually leads to lower growth. By lowering investment during a downturn, fiscal policy became procyclical and amplified the impact of the shock. Cross-country experience also shows that procyclicality is harmful for growth (Fatas and Mihov, 2003, IMF 2015a), including for resource-rich countries (IMF 2015b), as lower investment can translate into lower growth performance, thus reducing the capacity of the economy to benefit from subsequent economic rebounds.
2. Fiscal vulnerabilities also contributed to a low growth performance since 2008. Real GDP growth per capita has been almost zero percent on average, since 2008, after a decade of positive growth at 3¾ percent. Iran has faced a
1 Prepared by Olivier Basdevant.
Iran
-4
-2
0
2
4
6
-0.4 0.0 0.4 0.8 1.2
Real
GD
P pe
r cap
ita g
row
th(p
erce
nt)
Procyclicality
Procyclicality and Growth in Resource-Rich Countries
Source: Fiscal Monitor, 2015.Note: Procyclicality is measured using country-specific regressions of real expenditure growth rates on commodity price changes.
-10
-8
-6
-4
-2
0
2
4
6
8
10
1995 1997 1999 2001 2003 2005 2007 2009 2011 2013
Real GDP per capita
Average 1995-2007
Average 2008-14
Real GDP Growth per Capita(Percent)
Sources: Iran authorities, and IMF staff estimates.

ISLAMIC REPUBLIC OF IRAN
INTERNATIONAL MONETARY FUND 3
situation not uncommon to other resource-rich countries: shocks to oil prices have had a large impact on the economy, mostly because of the fiscal consequences of such shocks. Many factors aggravated the growth impact of these shocks, such as limited buffers (which could have otherwise been used to protect spending), large fuel subsidies (which constrain the fiscal space), and budget rigidities (such as arrears to private suppliers arising from limited expenditure controls and poor cash management practices).
3. Adverse oil revenue shocks have led to spending cuts. While the interim agreement with the P5+1 allowed Iran to stabilize its oil exports at about 1 million barrels per day (mbd), they remain below the pre-sanction period (of about 2¼ millions mbd before 2012). Oil exports were also negatively affected by declining oil prices (from $105 per barrel in 2012 to about $96 in 2014). Compared to the pre-sanction period, fiscal oil revenue declined from 12½ percent of GDP to about 6¼ percent. Since Iran had limited access to financing and the Oil Stabilization Fund (OSF) was no longer operational, the declining oil revenue translated into lower fiscal space for public spending. Infrastructure investment declined by 3 percentage points of GDP since 2012, and human capital investment (education and health) declined by 2½ percentage points.
4. Budget fragmentation and rigidities exacerbate the lack of adequate buffers. Three main issues have affected budget execution: (i) the Oil Stabilization Fund (OSF) has not been operational since the creation of the National Development Fund of Iran (NDFI), which legally cannot finance the budget, (ii) Targeted Subsidy Organization (TSO) fiscal operations are not included in the budget and have contributed to the overall deficit, and (iii) weaknesses in expenditure controls and cash management have led to the accumulation of arrears.
Since the OSF is no longer used, the budget does not have a formal stabilization instrument. At present, the formula allocating oil export revenue between the NDFI and the budget does not factor the fiscal risks stemming from oil price fluctuations. The formula can still be adjusted in the budget law, as the authorities did for the 2015/16 budget to compensate for the sharp decline in oil prices. However, the current setup presents risks. The reliance on ad-hoc adjustments in the formula is insufficient to prevent disruptions in budget execution, notably on investment spending. Sudden stops in investment plans contribute to low investment efficiency and arrears, damaging potential growth and revenue collection.
Fiscal accounts cover mostly the central government, while quasi-fiscal operations, as well as contingent liabilities are not formally taken into account. Fiscal operations of the TSO are not fully integrated into the budget, which creates unexpected fiscal pressures when the TSO runs deficits. In addition, not integrating the TSO in the budget creates rigidities, as TSO revenue is de facto earmarked for specific transfers. Beyond the case of the TSO, the government fiscal
0
2
4
6
8
10
12
14
2008/09-2011/12 2012/13-2014/15
Oil revenue
Investment Spending
Education and health
Oil Revenue and Investment Spending(Average, percent of GDP)
Sources: Iran authorities and IMF staff estimates.

ISLAMIC REPUBLIC OF IRAN
4 INTERNATIONAL MONETARY FUND
reports do not cover other entities such as regional governments. Similarly, quasi-fiscal operations for government bodies (e.g., public foundations, nonfinancial public enterprises) are also not reported. Finally, contingent liabilities are not assessed (e.g., potential costs of recapitalizing public banks).
Limited expenditure controls and poor cash management practices led to the accumulation of arrears. Payment arrears have been accumulated and have not been formally accounted for. The vast majority of arrears are reportedly due to multi-year projects, and the authorities are doing a census of government arrears. In addition to weaknesses in expenditure controls, the lack of a formal Treasury single account hampers the ability of the government to manage cash effectively, and in some cases has favored the accumulation of arrears.
B. Future Challenges: Sustainable use of Oil Revenue, Aging Population, and Debt
Among the future challenges facing Iran, at least three would be essential to the need for designing a medium-term fiscal strategy. First and foremost, the sustainable use of oil revenue should be assessed. Second, fiscal policy would need to factor medium-term trends, risks, and vulnerabilities. For example, demographic pressures (in the short-term with new entrants in the labor market, and in the long-term with aging pressures) should be assessed and subsequently factored in the design of fiscal policy. Finally, fiscal policy would also need to factor in other macroeconomic objectives, notably inflation reduction, and limit risks of fiscal dominance for monetary policy.
5. The need for additional development spending has to be balanced with a sustainable use of oil revenue. In the long run, one of the key challenges facing Iran is to balance the need for a sustainable use of its oil resources with the need for addressing development issues, through investment in human capital and infrastructure. Typically, fiscal policy could define the sustainable use of oil revenue through the permanent income hypothesis (PIH, see IMF, 2012 and 2015b), setting a benchmark on nonresource deficit, financed by returns on sovereign wealth. In the case of a country facing development needs like Iran, the PIH would typically be used in a “modified” form, relaxing the benchmark on the deficit over a period of time, to create space for
-12
-10
-8
-6
-4
-2
0
2014 2019 2024 2029 2034 2039 2044 2049
PIH (horizon: infinite)
Modified PIH (horizon: infinite)
PIH (horizon: 70 years)
Current policy
Nonoil Primary Balance(Percent of nonoil GDP)
Sources: Iran authorities, and IMF staff projections.
-6
-5
-4
-3
-2
-1
0
2014 2019 2024 2029 2034 2039 2044 2049
PIH, baseline
PIH, lower oil prices
PIH, lower production
PIH Under Different Assumptions(Percent of nonoil GDP)
Sources: Iran authorities, and IMF staff projections.Sources: Iran authorities, and IMF staff projections.
ISLAMIC REPUBLIC OF IRAN
INTERNATIONAL MONETARY FUND 5
additional development spending (see Baunsgaard and others, 2012, IMF 2012).2 Based on current conditions and IMF projections, the overall position of the general government departs from the standard PIH.3 However, this is not a cause of immediate concern, given the long-lasting hydrocarbon resources available.
6. Nevertheless, fiscal adjustment would be needed in the long term. It could be achieved either in the form of lower spending, increased non-oil revenue, and/or higher growth. From the PIH point of view, current policies are broadly consistent with a PIH restricted to a finite horizon of about 70 years. This would also correspond to Iran trying to take advantage of high and durable oil revenue to foster economic development of the non-oil sector. Finally, using the (modified) PIH, while helpful to quantify the fiscal space available, care should be taken when using it. Indeed, as shown in the graph above, because shocks to oil revenue can be large and persistent (notably on prices), the PIH can also be subject to large revisions following unexpected shocks. A decline of $20 in oil prices from $50 would result in a PIH-consistent deficit to fall from 5½ percent of non-oil GDP to about 3½ percent.
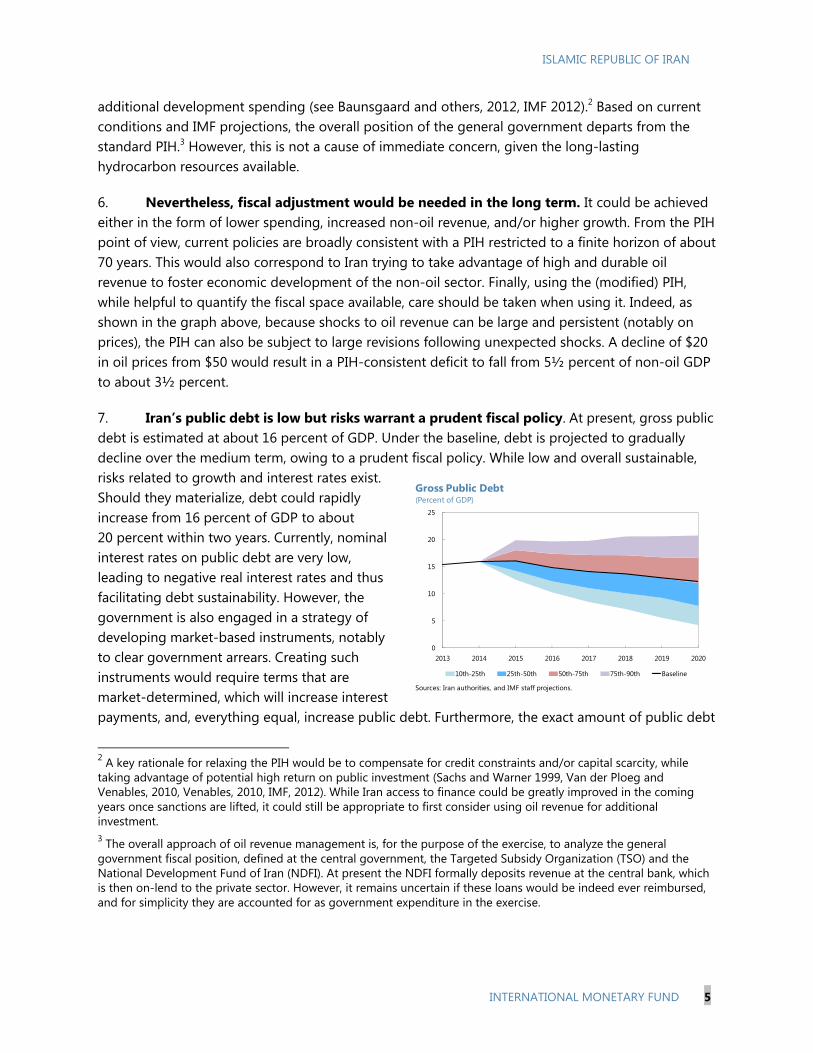
7. Iran’s public debt is low but risks warrant a prudent fiscal policy. At present, gross public debt is estimated at about 16 percent of GDP. Under the baseline, debt is projected to gradually decline over the medium term, owing to a prudent fiscal policy. While low and overall sustainable, risks related to growth and interest rates exist. Should they materialize, debt could rapidly increase from 16 percent of GDP to about 20 percent within two years. Currently, nominal interest rates on public debt are very low, leading to negative real interest rates and thus facilitating debt sustainability. However, the government is also engaged in a strategy of developing market-based instruments, notably to clear government arrears. Creating such instruments would require terms that are market-determined, which will increase interest payments, and, everything equal, increase public debt. Furthermore, the exact amount of public debt
2 A key rationale for relaxing the PIH would be to compensate for credit constraints and/or capital scarcity, while taking advantage of potential high return on public investment (Sachs and Warner 1999, Van der Ploeg and Venables, 2010, Venables, 2010, IMF, 2012). While Iran access to finance could be greatly improved in the coming years once sanctions are lifted, it could still be appropriate to first consider using oil revenue for additional investment. 3 The overall approach of oil revenue management is, for the purpose of the exercise, to analyze the general government fiscal position, defined at the central government, the Targeted Subsidy Organization (TSO) and the National Development Fund of Iran (NDFI). At present the NDFI formally deposits revenue at the central bank, which is then on-lend to the private sector. However, it remains uncertain if these loans would be indeed ever reimbursed, and for simplicity they are accounted for as government expenditure in the exercise.
0
5
10
15
20
25
2013 2014 2015 2016 2017 2018 2019 2020
10th-25th 25th-50th 50th-75th 75th-90th Baseline
Gross Public Debt(Percent of GDP)
Sources: Iran authorities, and IMF staff projections.

ISLAMIC REPUBLIC OF IRAN
6 INTERNATIONAL MONETARY FUND
is not known precisely, as only a limited part of debt is recorded, namely central government debt owed to the banking system. Aware of these challenges, the authorities established a debt management unit within the Treasury in early 2015, with the primary task to identify all government debt. Preliminary estimates of Iran’s public debt are expected by end-2015. Overall, these risks would warrant incorporating them into a medium-term fiscal strategy, so that the government could assess correctly the gross borrowing needs and prepare plans to preserve debt at a sustainable level.
8. Demographic pressures also warrant adequate fiscal planning. In the short term, the demographic pressures will mostly be felt through new entrants into the labor market, which underscored the need to promote a job-creating growth. Fiscal policy could support job creation through public investment (see next section). In the medium to long run, demographic pressures will be mostly felt through an aging population.4 These pressures may require fiscal planning to better prepare for additional age-related cost (health, pension), which could amount to about 2 percent of GDP annually. Cross-country experience shows that Iran may need to implement fiscal adjustment to make room for aging-related costs. In particular, public health spending is, on average, projected to increase by 1 percentage points of GDP annually in emerging countries (of which ⅓ percent is due to aging, the rest being owed to increased health cost, see Soto, Shang and Coady, 2012). However, Iran could incur higher costs, as the old-age dependency ratio would look similar to those of advanced economies in the long run. Those advanced economies are projected to face an increase in health-related spending by 3 percent of GDP over the long-run, of which 1 percentage point would be directly related to aging. Similarly, pension costs are expected to increase with population aging. However, in the case of Iran, potential liabilities are much more difficult to assess. The potential liabilities stem from three main areas: the overall pension system is pay-as-you-go, with defined benefits. This system generates fiscal risks for the future, especially with retirement ages relatively low (60 for men and 55 for women, with 20 years of contributions and options to take full retirement five years earlier with 30 years of contribution). In addition, Iran, like other emerging countries, faces a coverage issue, as some segments of the population are not fully covered, which could also translate into higher liabilities. Finally, pension funds have historically not been fully funded, with the government accumulating arrears in its contributions. Overall, while the pressures coming from population aging are more long term in nature, the magnitude of the potential cost would warrant advance planning,
4 According the UN population projections, the oldage dependency ratio of Iran would sharply increase in about 2030 years, to reach about 50 percent in the long term, a level comparable to other emerging and advanced countries facing serious aging issues.
0
10
20
30
40
50
60
Iran Middle Income Countries High Income Countries
2010 2030 2060
Old-Age Dependency Ratio(Percent)
Sources: Countries authorities, United Nations, Eurostat, and IMF staff calculations.
ISLAMIC REPUBLIC OF IRAN
INTERNATIONAL MONETARY FUND 7
as it could have implications on the level of savings for future generations, and also because aging-related reforms often take some time to be adopted.
C. Options for a Medium-Term Fiscal Framework
In response to these vulnerabilities, the authorities identified fiscal policy as a key factor for stabilization and growth. In the design of their strategy, there are several areas that merit greater focus: (i) investing in infrastructure and human capital; (ii) increasing resilience to shocks, notably from oil prices, by increasing and diversifying sources of fiscal revenue; and (iii) implementing fiscal structural reforms (subsidy reforms, health coverage, improved expenditure management) to improve the overall efficiency and equity of public spending, especially in the domain of social spending.
Setting Fiscal Objectives in a Medium-Term Perspective
9. The main fiscal anchor could be the non-oil fiscal balance, coupled with objectives on the overall fiscal balance and expenditure.
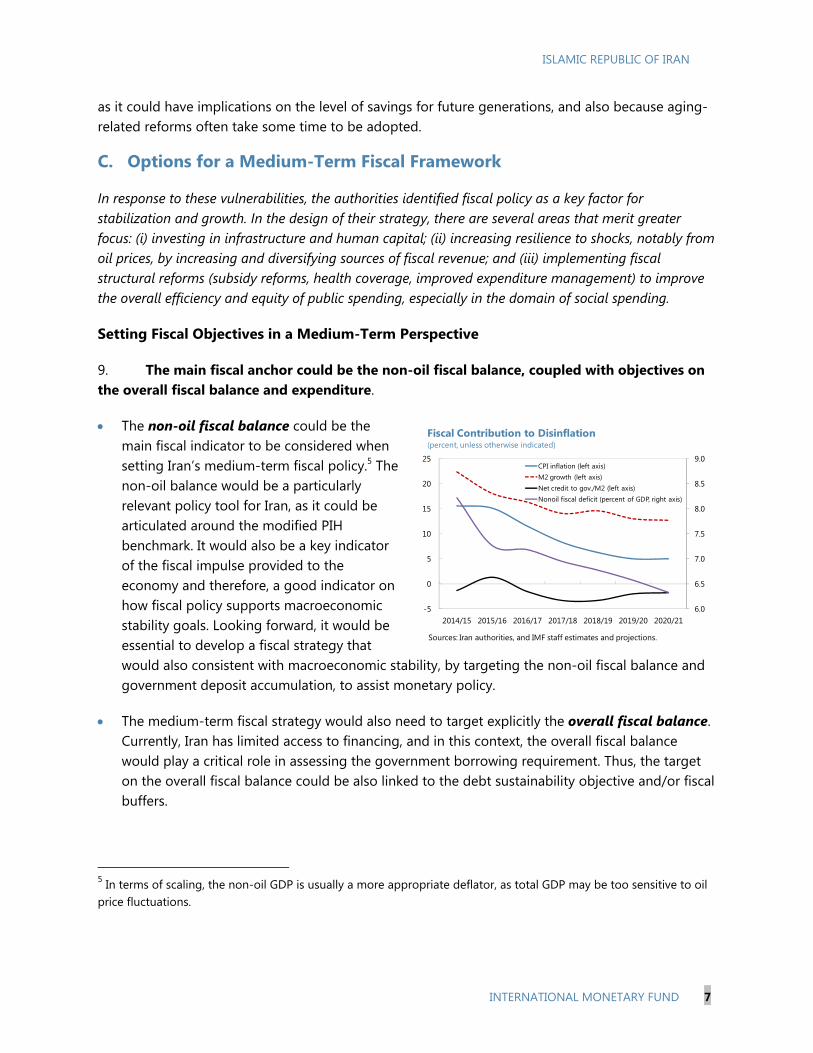
The non-oil fiscal balance could be the main fiscal indicator to be considered when setting Iran’s medium-term fiscal policy.5 The non-oil balance would be a particularly relevant policy tool for Iran, as it could be articulated around the modified PIH benchmark. It would also be a key indicator of the fiscal impulse provided to the economy and therefore, a good indicator on how fiscal policy supports macroeconomic stability goals. Looking forward, it would be essential to develop a fiscal strategy that would also consistent with macroeconomic stability, by targeting the non-oil fiscal balance and government deposit accumulation, to assist monetary policy.
The medium-term fiscal strategy would also need to target explicitly the overall fiscal balance. Currently, Iran has limited access to financing, and in this context, the overall fiscal balance would play a critical role in assessing the government borrowing requirement. Thus, the target on the overall fiscal balance could be also linked to the debt sustainability objective and/or fiscal buffers.
5 In terms of scaling, the non-oil GDP is usually a more appropriate deflator, as total GDP may be too sensitive to oil price fluctuations.
6.0
6.5
7.0
7.5
8.0
8.5
9.0
-5
0
5
10
15
20
25
2014/15 2015/16 2016/17 2017/18 2018/19 2019/20 2020/21
CPI inflation (left axis)M2 growth (left axis)Net credit to gov./M2 (left axis)Nonoil fiscal deficit (percent of GDP, right axis)
Fiscal Contribution to Disinflation(percent, unless otherwise indicated)
Sources: Iran authorities, and IMF staff estimates and projections.
ISLAMIC REPUBLIC OF IRAN
8 INTERNATIONAL MONETARY FUND
With the fiscal objectives set, the medium-term framework could then provide guidance on the expenditure level, consistent with the anchors and the expected revenue. Setting the expenditure level would be particularly helpful to assess (i) the space available for additional development spending in the short and medium term, and (ii) the need for fiscal adjustment to create space for higher age-related spending, or for higher interest payment, in the medium and long term.
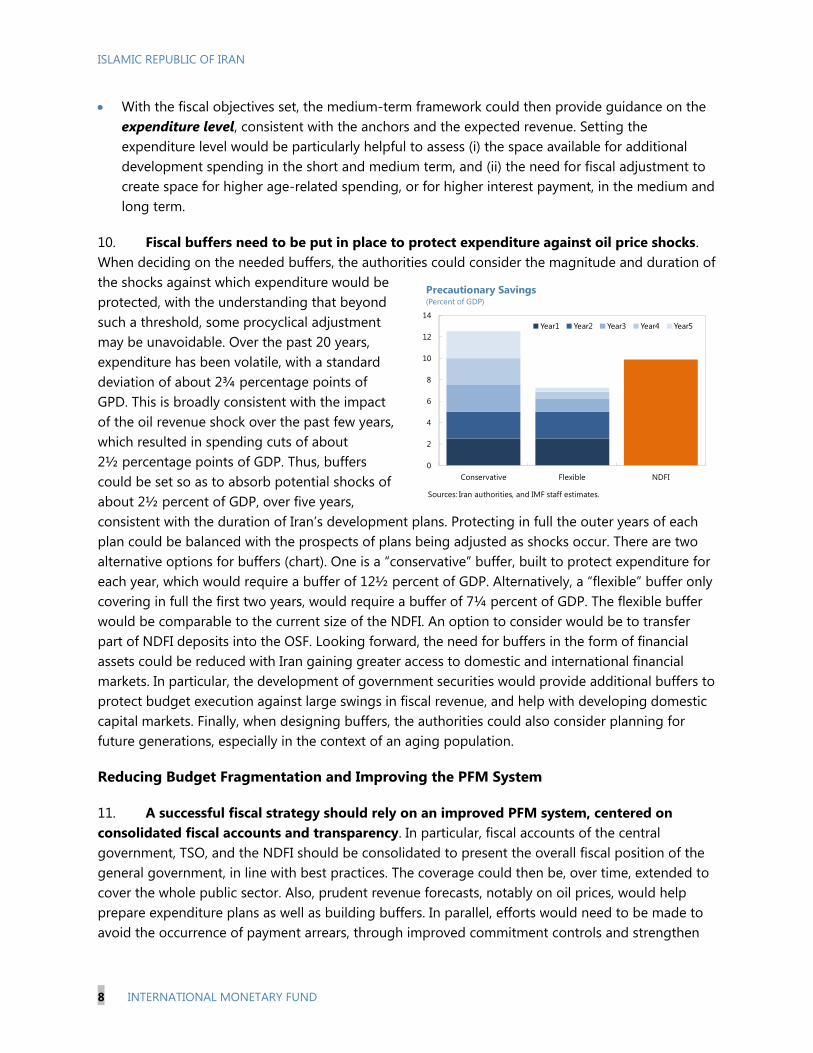
10. Fiscal buffers need to be put in place to protect expenditure against oil price shocks. When deciding on the needed buffers, the authorities could consider the magnitude and duration of the shocks against which expenditure would be protected, with the understanding that beyond such a threshold, some procyclical adjustment may be unavoidable. Over the past 20 years, expenditure has been volatile, with a standard deviation of about 2¾ percentage points of GPD. This is broadly consistent with the impact of the oil revenue shock over the past few years, which resulted in spending cuts of about 2½ percentage points of GDP. Thus, buffers could be set so as to absorb potential shocks of about 2½ percent of GDP, over five years, consistent with the duration of Iran’s development plans. Protecting in full the outer years of each plan could be balanced with the prospects of plans being adjusted as shocks occur. There are two alternative options for buffers (chart). One is a “conservative” buffer, built to protect expenditure for each year, which would require a buffer of 12½ percent of GDP. Alternatively, a “flexible” buffer only covering in full the first two years, would require a buffer of 7¼ percent of GDP. The flexible buffer would be comparable to the current size of the NDFI. An option to consider would be to transfer part of NDFI deposits into the OSF. Looking forward, the need for buffers in the form of financial assets could be reduced with Iran gaining greater access to domestic and international financial markets. In particular, the development of government securities would provide additional buffers to protect budget execution against large swings in fiscal revenue, and help with developing domestic capital markets. Finally, when designing buffers, the authorities could also consider planning for future generations, especially in the context of an aging population.
Reducing Budget Fragmentation and Improving the PFM System
11. A successful fiscal strategy should rely on an improved PFM system, centered on consolidated fiscal accounts and transparency. In particular, fiscal accounts of the central government, TSO, and the NDFI should be consolidated to present the overall fiscal position of the general government, in line with best practices. The coverage could then be, over time, extended to cover the whole public sector. Also, prudent revenue forecasts, notably on oil prices, would help prepare expenditure plans as well as building buffers. In parallel, efforts would need to be made to avoid the occurrence of payment arrears, through improved commitment controls and strengthen
0
2
4
6
8
10
12
14
Conservative Flexible NDFI
Year1 Year2 Year3 Year4 Year5
Precautionary Savings(Percent of GDP)
Sources: Iran authorities, and IMF staff estimates.
ISLAMIC REPUBLIC OF IRAN
INTERNATIONAL MONETARY FUND 9
cash management. Other PFM reforms would be needed to achieve these objectives, such as establishing a single Treasury account or developing a new Government Financial Management Information System (GFMIS).
12. In addition to strengthening the budget process, efforts should be made to disclose fiscal risks and improve transparency. One crucial hurdle in the process of developing buffers and maintaining a prudent fiscal policy will be to gather sufficient political and social support for such a policy. Faced with numerous development challenges, demand for new spending programs is likely to be strong, especially if the fiscal position were to improve following the removal of sanctions. In this context, it would be essential to adhere to sound principles in disclosing fiscal risks, notably those related to oil revenue shocks. This would help muster support for re-establishing and preserving buffers and maintaining a prudent fiscal stance, which are essential to ensure that Iran meets its development goals. Similarly, the cost of fuel subsidies could be fully disclosed in budget documents, and efforts to strengthen public expenditure efficiency (e.g., evaluating investment projects, developing social safety nets), could also be made transparent in order to facilitate a broad consensus over key fiscal objectives.
Meeting Iran’s Development Goals with Scaled-Up Investment
13. Scaling up investment in Iran could support employment and growth goals, provided it is done prudently. In the simulations presented, investment is scaled up from 2016 on for a period of 6 years, followed by fiscal adjustment for 10 years, where fiscal policy would gradually return to the PIH (See Annex I for more details, and Table 1). The magnitude of scaling up is quite significant, with capital expenditure jumping from 4 percent to 7 percent of GDP during that phase. Assuming an elasticity of growth to investment of 0.1, the simulations show an improvement in growth performance, which translates into higher revenue, and eventually reduce the need for an “active” fiscal adjustment (i.e., fiscal measures). The specific numbers retained in the simulations show that the net financial wealth would still be high, thus providing, potentially, enough buffers. However, as shown in past years, adverse shocks to oil revenue can disrupt significantly spending plans, and for that reason prudence is required if net financial wealth was to decline too rapidly. This would strongly advocate for developing adequate fiscal buffers, as well as assessing fiscal risks within a comprehensive fiscal framework.

ISLAMIC REPUBLIC OF IRAN
10 INTERNATIONAL MONETARY FUND
Table 1. Islamic Republic or Iran: Oil Revenue Management and Public Investment
14. Committing to a fiscal adjustment over the medium term, while ensuring productive and growth-friendly investment, is a key objective. Fundamentally, the scaled-up investment would need to be offset by a lower non-oil deficit in the future. There are three main issues to address in order for scaling-up to be successful:
public investment efficiency can be low (Pritchett, 2000, Gupta and others, 2014), which can be mitigated by improved public investment management (Dabla-Norris et al., 2012), as well as fiscal buffers to prevent sudden stops in investment projects due to lack of funding;
supply bottlenecks, which can translate into slower scaling-up, as well as increased prices and wages due to increased demand for raw materials and labor (Sachs and Warner 2001, Van der Ploeg, 2010), thus reinforcing the “Dutch disease” effect of natural resource exploitation; and
the overall quality of public institutions, as political economy pressures can channel public investment towards groups who get more traction from policy makers, at the expense of social and economic goals (Van der Ploeg, 2011, Arezki and Brueckner 2011, Arzeki and others, 2011).
To address these potential vulnerabilities, the authorities could carefully assess the pace at which investment would be increased; ensure that investment projects are properly evaluated in terms of costs and benefits, and that fiscal buffers are developed. More generally, Iran could consider first building up capacity to manage and absorb investment, a process dubbed “investing in investment” (Collier, 2011, Berg and others, 2012).
2014Act. UP1 PIH(70)2 PIH3 MPIH4 UP1 PIH(70)2 PIH3 MPIH4
Total 21.7 19.6 19.5 17.1 20.1 19.1 19.6 17.3 16.3Primary expense 18.5 15.6 15.5 13.1 13.1 14.8 15.6 13.3 13.3Investment 3.2 4.0 4.0 4.0 7.0 4.3 4.0 4.0 3.0
Nonoil primary balance -11.1 -8.0 -7.8 -5.4 -8.4 -7.2 -7.7 -5.4 -4.5Real nonoil GDP growth 2.8 4.0 4.0 4.0 4.2 4.2 4.2 4.2 4.5
Wealth (eop) 361.3 289.9 291.7 314.4 291.9 269.0 189.5 314.4 290.8Source: Iran authorities, and IMF staff estimates and projections.
2016–21 Long Term
1Unchanged policies scenario (UP). The composition and level of expenditure would remain similar to the latest exeduted budget (fiscal year 2014/15) and consistent with a nonoil fiscal balance broadly constant in percent of nonoil GDP.2Permanent income hypothesis with an time horizon of 70 years (PIH(70)). Primary expenditure would be adjusted to a level consistent with a depletion of the wealth generated by oil revenue within the next 70 years.3Permanent income hypothesis with an infinite time horizon (PIH). Primary expenditure would be adjusted to a level consistent with the preservation of a level of the wealth generated by oil revenue consistent with an infinite stream of revenue that would finance the nonoil fiscal balance.4Modified PIH (MPIH). With an investment-scaling-up program, part of the wealth generated by oil revenue would be used upfront to boost growth performances. This would be at the expense of a lower permanent stream of revenue to finance the nonoil fiscal balance.
(Percent of nonoil GDP)

ISLAMIC REPUBLIC OF IRAN
INTERNATIONAL MONETARY FUND 11
Expenditure and Tax Policies to Reduce Dependency on Oil Revenue
15. Increasing the share of non-oil revenue would help build space for development spending while preserving overall fiscal deficit objectives. A key element of the medium-term fiscal strategy would be to increase the share of domestic revenue. The authorities have taken steps in this direction, by gradually increasing the VAT rate over the past few years, removing tax exemptions, and taking steps to strengthen the administrative capacity of the Iranian tax administration. At present the VAT rate is 9 percent, and the authorities have considered increasing it to 10 percent, which would bring Iran closer to the rates in some comparator countries. Increasing the share of VAT in total revenue would also be in line with good practices (IMF 2013c) and tends to provide more growth-enhancing results than increasing the share of income tax (Acosta-Ormaechea and Yoo, 2012). Also, increasing the share of domestic revenue would help reduce dependency on oil revenue, by increasing the share of current expenditure financed by domestic taxes, thus allocating more oil revenue to public investment financing, which would be appropriate with the overall strategy of scaling-up investment over the short and medium term.
16. Implicit fuel subsidies remain large and could be reduced further. Fuel subsidies have been significantly reduced, currently at about 4 percent of GDP, while the TSO had incurred deficits. Iran, like many other oil producers, has provided implicit subsidies to domestic fuel prices and to basic food items. Aware of the inefficiency and costs of such subsidies, the authorities defined a strategy to capture the rent generated by them. Domestic fuel prices have been adjusted in 2014, with price increases ranging from 20 to 75 percent and in mid-2015, with further increases from 20 to 40 percent. Coupled with the decline in international prices, fuel subsidies are projected to decline from 10½ percent of GDP in 2012/13 to about 4 percent in 2015/16. In parallel to reducing implicit subsidies, the TSO was set up to provide cash transfers to the population, financed by the rent captured through fuel price increases. The TSO contributed to pressures on the budget, with annual deficits of about 1½ percent of GDP in 2012/13 and in 2013/14. Thus, a significant part of the strategy should also focus on reducing fuel subsidies further. The authorities could consider a rule-based price adjustment, so that adjustments would become automatic, while developing social safety nets to protect the poor, notably through targeted cash transfers.
0
5
10
15
20
25
30
VAT Rates Accross Ressource-Rich Countries(Percent)
Sources: International Bureau of Fiscal Documentation, IBFD, 2013 (www.ibfd.org).
0.0
0.5
1.0
1.5
2.0
0
2
4
6
8
10
12
2013 2014 2015
Fuel subsidies (left axis) TSO balance (right axis)
Fuel Price Subsidies and TSO Balance(Percent of GDP)
Sources: IEA , Iran authorities, and IMF staff estimates and projections.
ISLAMIC REPUBLIC OF IRAN
12 INTERNATIONAL MONETARY FUND
Would Rules Help Fiscal Policy?
17. Iran could consider introducing fiscal rules to help anchor a sustainable use of oil revenue. A price smoothing rule could be considered, to guard against the large and unpredictable price shocks. It could be coupled with expenditure rules, to guard against too rapid increase in spending during booms, thus protecting the buildup of buffers for bad times (Baunsgaard and others, 2012, IMF, 2005, 2009, and 2010). However, to be effective, such rules would need to be built around a comprehensive medium-term fiscal framework, and adequate PFM system, two key issues that remain to be addressed in Iran. Setting rules, for example, while the coverage of fiscal reports is limited to the central government, and fiscal policy objectives are not clearly defined or articulated in a medium term perspective would jeopardize the effectiveness of such rules. Also, a price smoothing rule would need to rely on reinstating the OSF (or an equivalent mechanism), and care would be needed to ensure that the OSF has an adequate transparency and governance structure, to avoid that governance issues lead to abandoning the mechanism. However, if successful, fiscal rules could lead to additional benefits: higher welfare than discretion (Barro and Gordon 1983, Drazen 2000), as well as lower risk premia (Hallerberg and Wolff, 2006). However, in resource rich countries, while there has been some notable successes (Chile, Norway, and Botswana) cross-country evidence suggests that, in general, rules have not significantly reduced procyclicality (IMF, 2015b). The reasons for this lack of success are varied, and often comes down to the overall fiscal policy framework, with either weak PFM systems leading to off-budget spending, or simply lack of broad political and social support for the rules.
18. Compliance with fiscal rules could also be facilitated by legal foundations (and not just political commitment) and independent monitoring. Another critical issue to address when developing fiscal rules is the incentives they create for nontransparent behaviors and/or “creative accounting”, where policy makers seek to comply only seemingly with the rules. Fiscal rules should imply costs for policy makers in case of nonenforcement, either in terms of reputational costs for ruling parties or in terms of legal sanctions that require specific actions. A law-based rule would imply penalties in case of noncompliance, and thus increases chances for rules to be implemented. In addition, the use of independent bodies to monitor rules can also strengthen incentives for compliance, by increasing the political cost of deviation (IMF, 2013a).

ISLAMIC REPUBLIC OF IRAN
INTERNATIONAL MONETARY FUND 13
References
Acosta-Ormaechea, S., and J. Yoo, 2012, “Tax Composition and Growth: A Broad Cross-Country Perspective,” IMF Working Paper No. 12/257 (Washington: International Monetary Fund). Available via the Internet: http://www.imf.org/external/pubs/ft/wp/2012/wp12257.pdf
Arze del Granado, J., D. Coady, and R. Gillingham, 2012, “The Unequal Benefits of Fuel Subsidies: A Review of Evidence for Developing Countries,” World Development, Vol. 40, Issue 11, (November), pp. 2234-48. Available via the Internet: http://dx.doi.org/10.1016/j.worlddev.2012.05.005
Arezki, R., and M., Bruckner, 2011, “Oil Rents, Corruption, and State Stability: Evidence From Panel Data Regressions,” European Economic Review, Vol. 55, No. 7, pp. 955–63.
Arezki, R., Hamilton, K., and K., Kazimov, 2011, “Resource Windfalls, Macroeconomic Stability and Economic Growth,” IMF Working Paper No. 11/142 (Washington: International Monetary Fund). Available via the Internet: www.imf.org/external/pubs/ft/wp/2011/wp11142.pdf
Barro R. and D. Gordon, 1983, “A Positive Theory of Monetary Policy in a Natural Rate Model” Journal of Political Economy, 91: 589–610.
Baunsgaard, T., M., Villafuerte, M., Poplawski-Ribeiro, and C. Richmond, 2012, “Fiscal Frameworks for Resource Rich Developing Countries,” IMF Staff Discussion Note SDN/12/04. Available via the Internet: http://www.imf.org/external/pubs/ft/sdn/2012/sdn1204.pdf
Berg, A., Portillo, R., Yang, S., and L.-F. Zanna, 2012, “Public Investment in Resource Abundant Low-Income Countries” IMF Working Paper No. WP/12/274. Available via the Internet: www.imf.org/external/pubs/ft/wp/2012/wp12274.pdf
Collier, P., 2011, “Savings and Investment Decisions in Low-Income Resource-Rich Countries.” (Oxford: Center of the Study for African Economies).
Dabla-Norris, E., Brumby, J., Kyobe, A., Mills, Z., and C., Papageorgiou, 2012, “Investing in Public Investment: An Index of Public Investment Efficiency” Journal of Economic Growth, Vol. 17(3), pp. 235–66.
Drazen, A., 2000, Political Economy in Macroeconomics, Princeton University Press, Princeton NJ.
Grigoli, F., and J. Kapsoli, 2013, “Waste Not Want Not: The Efficiency of Health Spending in Developing Countries,” IMF Working Paper No. 13/187 (Washington: International Monetary Fund). Available via the Internet: http://www.imf.org/external/pubs/ft/wp/2013/wp13187.pdf
Gupta, S., Segura-Ubiergo, A., and E., Flores, 2014, “Direct Distribution of Resource Revenues: Worth Considering?” IMF Staff Discussion Note SDN14/05 (Washington: International Monetary Fund). Available via the Internet: http://www.imf.org/external/pubs/ft/sdn/2014/sdn1405.pdf
ISLAMIC REPUBLIC OF IRAN
14 INTERNATIONAL MONETARY FUND
IMF, 2005, Fiscal Responsibility Laws (Washington: International Monetary Fund).
______, 2009, Fiscal Rules—Anchoring Expectations for Sustainable Public Finances (Washington: International Monetary Fund). Available via the Internet: www.imf.org/external/np/pp/eng/2009/121609.pdf
______, 2010, Strategies for Fiscal Consolidation in the Post-Crisis World (Washington: International Monetary Fund). Available via the Internet: www.imf.org/external/np/pp/eng/2010/020410a.pdf
______ 2011, “The Challenge of Public Pension Reform in Advanced and Emerging Economies” (Washington: International Monetary Fund). Available via the Internet: https://www.imf.org/external/np/pp/eng/2011/122811.pdf
______, 2012, “Managing Global Growth Risks and Commodity Price Shocks. Vulnerabilities and Policy Challenges for Low-Income Countries” (Washington: International Monetary Fund). Available via the Internet: http://www.imf.org/external/np/pp/eng/2011/092111.pdf
______, 2013a, “The Function and Impact of Fiscal Councils.” (Washington: International Monetary Fund). Available via the Internet: http://www.imf.org/external/np/pp/eng/2013/071613.pdf
______, 2013b, “Fiscal Rules at a Glance” (Washington: International Monetary Fund). Available via the Internet: http://www.imf.org/external/datamapper/FiscalRules/Fiscal%20Rules%20at%20a%20Glance%20-%20Background%20Paper.pdf
______, 2013c, “Jobs and Growth: Analytical and operational considerations for the Fund” (Washington: International Monetary Fund). Available via the Internet: http://www.imf.org/external/np/pp/eng/2013/031413.pdf
______, 2015a, Fiscal Monitor, April (Washington: International Monetary Fund). Available via the Internet: http://www.imf.org/external/pubs/ft/fm/2015/01/pdf/fm1501.pdf
______, 2015b, Fiscal Monitor, October (Washington: International Monetary Fund). Available via the Internet: http://www.imf.org/external/pubs/ft/fm/2015/02/pdf/fm1502.pdf
Milesi-Ferretti G.M., 1997, “Fiscal Rules and the Budget Process” Giornale degli Economisti, 110(1), pp. 5–40.
Pritchett, L., 2000, “The Tyranny of Concepts: CUDIE (Cumulated, Depreciated, Investment Effort) Is Not Capital” Journal of Economic Growth, Vol (5): pp. 361–84. Available via the Internet: http://piketty.pse.ens.fr/files/Pritchett00.pdf

ISLAMIC REPUBLIC OF IRAN
INTERNATIONAL MONETARY FUND 15
Sachs, J., and A., Warner, 1999, “The Big Push, Natural Resource Booms and Growth” Journal of Development Economics, Vol. 59, pp. 43–76.
Soto, M., Shang. B., and D., Coady, 2012, “New Projections of Public Health Spending, 2010–50,” in The Economics of Public Health Care Reform in Advanced and Emerging Economies, ed. by Clements, B., Coady, D., and S., Gupta (Washington: International Monetary Fund).
Van der Ploeg, Frederick, 2011, “Natural Resources: Curse or Blessing?” Journal of Economic Literature, Vol. 49, No. 2, pp. 366–420.
——— and Anthony J. Venables, 2011, “Harnessing Windfall Revenues: Optimal Policies for Resource-Rich Developing Economies,” The Economic Journal, Vol. 121, pp. 1–30.
Venables, A., 2010, “Resource Rents; When to Spend and How to Save,” International Tax and Public Finance, Vol. 17, pp. 340–56.

ISLAMIC REPUBLIC OF IRAN
16 INTERNATIONAL MONETARY FUND
Appendix I. The Permanent Income Hypothesis
Definition The net present value of expected oil-related fiscal revenue at date t can be viewed as a financial asset, , which can either be used to finance a permanent income (i.e. with an infinite time horizon), or an income over the definite period of time (in our case a time horizon of 40 years), after which the financial asset is fully depleted.
can be defined as:
∏ (1)
With Rt the oil revenue at time t, and it the real interest rate. T is a time horizon for the depletion of oil resources. Assuming a constant interest rate ithroughout the projection horizon the equation becomes:
(2)
With an infinite time horizon, the permanent income that can be derived from the financial wealth (the PIH), is defined as:
∞
⇔ (3)
Under a finite time horizon of T years, the PIH is defined as:
∀ ; ⇔
(4)
∀ ; 0 (5)
ISLAMIC REPUBLIC OF IRAN
INTERNATIONAL MONETARY FUND 17
Evaluating the PIH for Iran
Three broad categories of parameters enter in the computation of the PIH, including the modified version where investment is scaled-up.
Oil revenue throughout the long term. Three key parameters here are total oil production, oil prices, and the share of government revenue in total oil production. In the computations provided in this paper, oil production is assumed to be gradually increased to about 4,000 barrels per day by 2020, before increasing further to 8,000 over the long run. A lower level of production would translate into a lower PIH-compatible deficit. For example, a production of 6,000 bpd over the long term would roughly lead to a PIH deficit lower by ¾ percentage point. Oil prices are based on WEO projections in the baseline. As stressed in IMF (2015), oil prices as hard to predict and basically behave as a random walk. As a result, any computation of PIH for a country like Iran, with long-lasting reserves, is highly uncertain. As an example, oil prices lower by 50 percent would reduce the PIH deficit by about 1 percentage point. Finally, the share of government revenue in total oil revenue has also a critical impact on the PIH. The baseline projection assumes a share corresponding to actual numbers, of about 45 percent. However, this share is de facto primarily driven by oil exports, as domestic fuel prices are still subsidized and reduce the rent captured by the government. Increasing the share of government revenue could also be a tool for government to mitigate the negative risks of negative shocks occurring in the long term.
Long-term growth potential of the non-oil sector. In the assumptions real GDP growth would remain stable at 4¼ percent throughout the medium-term. This would correspond to roughly a GDP per capita increasing, in real terms, at about 3¼ percent over the medium term, and also over the long term, as a result of aging and population gradually declining. Such a growth path would represent a dramatic change from the 2008–14 period, where the economy barely grew in per capita terms, but also an improvement compared to the period 1995–2007, which averaged a GDP growth per capita of 3¾ percent. Iran has the capacity to achieve such a growth rate, given the well-educated population and the growth potential represented by an already large non-oil sector. In addition, the prospects of lifting sanctions could trigger a virtuous cycle of increased integration with the global economy that would help attract investment and develop business opportunities in Iran. However, hurdles remain, as Iran still has a weak business climate by international standards, as assessed by the World Bank’s Doing Business assessment. Also the macroeconomic policy framework would need to promote a private-sector led growth, which in turn could require further public investment, while mitigating inflationary pressures. Overall, while the assumption of a long-term real GDP 4¼ percent is achievable, it will still represent challenges, which could partly be addressed by prudent fiscal policies geared towards quality public investment (see below).

ISLAMIC REPUBLIC OF IRAN
18 INTERNATIONAL MONETARY FUND
Parameters to Compute the PIH
PIH: long-term assumptions ParametersReal non-resource GDP growth (percent) 4.2Nominal non-resource GDP growth (percent) 9.4Inflation (percent) 5.0Real interest rate (percent) 6.0Nominal interest rate (percent) 11.3Non-resource revenue, excluding grants (percent non-resource GDP) 11.8Government share of oil revenue (percent) 48.5
Modified PIH assumptionsInitial year of public investment 2016Number of years with public investment larger than zero 6.0Number of years with adjustment due to frontloading of investment 10.0Year of return to PIH Model 2032
Modified PIH with positive impact on growthSteady state multiplier 1.00Initial year of higher multiplier 2017Tax revenue multiplier due to impact of incremental investment 1.01End-year of the higher multiplier 2033Elasticity of real non-resource growth to investment 0.1Real GDP growth post invesmtent (percent) 4.5Nominal non-resource GDP growth post investment (percent) 9.7
Source: IMF staff.
ISLAMIC REPUBLIC OF IRAN
INTERNATIONAL MONETARY FUND 19
THE PRODUCTIVITY CHALLENGE IN IRAN1 1. Stimulating productivity growth is one of Iran’s main economic challenges over the medium term. In their quest to create employment opportunities for everyone and raise income and standards of living, the Iranian authorities have emphasized the need to unlock Iran’s growth potential. This endeavor can only succeed if productivity growth accelerates, as Iran’s catch-up process to productivity levels in advanced economies remains incomplete. The bulk of the existing productivity shortfall is linked to Iran’s relatively low levels of total factor productivity (TFP), echoing the results of earlier cross-country studies (Caselli, 2004; and Hall and Jones, 1999). Physical and human capital levels, in contrast, are closer to international benchmarks. The TFP gap arises in part because frictions in labor, capital, and product markets prevent resources from flowing to where they are most productive. Policy priorities should aim at: (i) invigorating the flexibility and dynamism of the labor market; (ii) pressing ahead with banking sector reform to improve the efficiency financial intermediation; and (iii) strengthening the price signal in product markets. In addition, attracting modern technology from trading partners and specific measures in services and the agriculture sector can play an important role in boosting productivity and income.
A. The Historical Record: Labor Productivity from 1990
2. Labor productivity in Iran has improved considerably, although the gap to the international technological frontier is still yawning. To uncover the long-term structural trends of productivity in Iran, this paper considers data up to 2011, the last year before the tightening of international sanctions. The productivity of Iran’s labor force, measured at purchasing-power parity exchange rates, has risen from less than 20 percent of the U.S. level in 1990 to close to 40 percent in 2011. This performance is better than those of many of developing and emerging market economies. However, two factors suggest that Iran’s productivity growth could have been even higher. For one, other resource-rich countries in the region have realized faster productivity growth than Iran, especially during the upswing of the global oil price cycle in the first half of the past decade. And at 40 percent, the gap to the U.S. productivity level remains sizeable, indicating a large scope for technological catch-up to the global efficiency frontier.
1 Prepared by Robert Blotevogel.
0
10
20
30
40
50
60
70
80
0
10
20
30
40
50
60
70
80
1990 1995 2000 2005 2010
Real GDP per Worker (PPP)(percent relative to the U.S.)
Asia ex.ChinaCCE
CIS
LAC
MENAOilSSA
Iran
Source: Penn World Tables and IMF staff calculations.

ISLAMIC REPUBLIC OF IRAN
20 INTERNATIONAL MONETARY FUND
3. Sources of productivity gains have fluctuated over time. Jorgensen and Vu’s (2010) growth accounting framework decomposes labor productivity in Iran into contributions from physical capital, human capital, and total factor productivity (TFP).2 This analysis reveals that only human capital has added to labor productivity growth in every year since 1990. But because of Iran’s relatively high level of educational achievement, the marginal impact of human capital has been small. The contribution from physical capital accumulation was particularly important from 2005, coinciding with a period of historically high global oil prices. TFP, on the other hand, significantly boosted labor productivity in the reconstruction phase following the end of the Iran-Iraq war in 1988. Afterwards, its cumulative contribution to labor productivity was about zero, fluctuating from mostly negative in the 1990s to positive in the following decade.
4. The productivity shortfall is mostly related to Iran’s relatively low level of TFP. TFP in Iran, measured at purchasing power parity, was about half of the level found in the U.S. in 2011. The other two determinants of labor productivity, physical and human capital per worker, were at 100 and 74 percent already at or closer to U.S. levels. Elevated levels of capital per worker imply that accumulating more capital will increasingly be subject to diminishing marginal returns, leading to a smaller impact on labor productivity. Diminishing marginal returns will be most pressing for physical capital. By virtue of being an oil-rich country, Iran’s growth model has relied on subsidizing energy. Firms therefore have had incentives to invest in production technologies that use energy, and by consequence capital, intensively. But capital-intensive production technologies have not translated into high labor productivity in Iran, indicating a less efficient use of capital. To make improvements in labor productivity sustainable, they will be based on faster TFP growth.
2 For a development accounting exercise focusing on the level of Iran’s GDP per capita and its cross-country comparability, see the 2014 Article IV Consultation (Country Report 14/93)
-8
-6
-4
-2
0
2
4
6
8
10
-8
-6
-4
-2
0
2
4
6
8
10
1990
1993
1996
1999
2002
2005
2008
2011
TFP Physical capital
Human capital Productivity growth
Source: Penn World Tables and IMF staff calculations.
Decomposing Total Labor Productivity Growth(In percent, 1990–2011)
-0.5
-0.4
-0.3
-0.2
-0.1
0.0
0.1
0.2
0.3
0.4
0.5
-0.5
-0.4
-0.3
-0.2
-0.1
0.0
0.1
0.2
0.3
0.4
0.5
1990
1991
1992
1993
1994
1995
1996
1997
1998
1999
2000
2001
2002
2003
2004
2005
2006
2007
2008
2009
2010
2011
Capital deepeningTFP & Human capitalLabor productivity growth
Labor Productivity in Communication(1990–2011)
Sources: Iranian authorities and Fund staff calculations.
ISLAMIC REPUBLIC OF IRAN
INTERNATIONAL MONETARY FUND 21
B. Sectoral Productivity Trends and Total Factor Productivity
5. Efficiently channeling labor and capital to more productive sectors can lift TFP. Economy-wide TFP growth has many determinants, chief among which is the distribution of labor and capital across industry sectors (Fernald, 1999; and McMillan et al., 2014). That is, TFP growth depends positively on how smoothly labor and capital migrate from less to more productive industry sectors. To measure the contribution of labor movements to productivity growth, McMillan et al., (2014) compute the following the decomposition:
∆ , ∆ , , ∆ ,
where is non-oil labor productivity, , the labor productivity of sector i, and , the share in total employment of sector i. This decomposition emphasizes that economy-wide labor productivity increases because of two reasons: (i) productivity gains in individual sectors (the first sum on the right-hand side); and (ii) employment gains in sectors with relatively high productivity (the second sum). Following McMillan et al., (2014), this paper refers to the “sector-specific” and “structural change” contribution to productivity growth, respectively.
6. Iran’s economy is characterized by a wide dispersion of labor productivity across sectors. Labor productivity in the oil sector was on average 160 times higher than in agriculture, the sector with the lowest labor productivity, in the period 1990–2011. Such productivity differentials are common for “enclave” industry sectors driven by natural resources. As the oil sector is limited in the amount of labor it can absorb, this paper focuses on the non-oil economy. But even in the non-oil economy, significant sectoral productivity differentials continue to exist. Mining and telecommunications had labor productivity levels that were 18 and 14 times higher than in agriculture in 2011. In addition, the dispersion of productivity levels across sectors has actually increased over time—contrary to the experience of rapidly growing emerging market economies, where sectoral productivity levels converge over time. Without frictions, convergence comes about because of diminishing marginal productivities. Labor and capital move from less to more
80
90
100
110
120
Asia
ex.
Chin
a
CEE
CIS
LAC
MEN
AN
on-O
il
MEN
A O
il
SSA
Capital to Output ratio
0
10
20
30
40
50
60
70
80
90
100
Asia
ex.
Chin
a
CEE
CIS
LAC
MEN
AN
on-O
il
MEN
A O
il
SSA
TFP Level
50
60
70
80
90
100
Asia
ex.
Chin
a
CEE
CIS
LAC
MEN
AN
on-O
il
MEN
A O
il
SSA
Index of Human Capital per Person
Factor Inputs in Iran and Other Emerging Market Economies(2011; in percent relative to the U.S. level)

ISLAMIC REPUBLIC OF IRAN
22 INTERNATIONAL MONETARY FUND
productive sectors, raising average productivity in the unproductive sectors and lowering it in the more productive sectors. The weaker the cross-sector movement of labor and capital, the weaker will be tendency for sectoral productivities to converge. Following this argument, frictions in labor, capital, as well as product markets appear to impede resources from flowing efficiently from unproductive to more productive sectors in Iran.
7. “Structural change” has played only a small role in supporting labor productivity and TFP, consistent with the finding of large productivity differentials across sectors. Over the period 1990–2011, structural change accounted for 15 percent of the total increase in labor productivity. Considering that labor productivity increased by a cumulative 110 percent, about 17 percentage points (0.15 x 110) were due to structural change. Compared to the international experience in McMillan et al., (2014), this performance is mixed. On a positive note, Iran benefited from structural change, as its contribution to total labor productivity was positive (though small). Africa (1990–99) and Latin America (2000–05) were less fortunate as these regions experienced labor movements to less productive sectors over the indicated time period. Less encouragingly, structural change in Iran was meager compared to regions with remarkable growth spurts. In Africa (2000–05) and Latin America (1950–75), labor reallocations across sectors accounted for half of the total gains in labor productivity over the relevant time period.
8. Iran’s more productive industry sectors exhibited only a weak tendency to absorb additional labor. A scatter plot of sectoral labor productivity in 2011 and the corresponding change in employment since 1990 shows no significant relationship. The t-statistic is insignificant at 0.2.
-0.01 0.01 0.03 0.05 0.07
1990-2011
1990-1993
1995-2000
2000-2005
2005-2011
Sectoral
Structural
Decomposition of Nonoil Labor Productivity Change(GVA per worker, 1990-2011)
Change in labor productivity (billions of 2004 rials)Sources: Iranian authorities and Fund staff calculations.
0
1
2
3
4
5
6
7
0
1
2
3
4
5
6
7
0 20 40 60 80 100
Ratio
of s
ecto
ral p
rodu
ctiv
ity to
ave
rage
pr
oduc
tivity
Share of total employment in percent
Mining Comm
Utl Serv
Manuf Transp
Cons Agric
Sources: Iranian authorities and Fund staff calculations.
Non-oil Labor Productivity Gaps 2011(in percent of non-oil economy-wide productivity
0.0
0.2
0.4
0.6
0.8
1.0
1.2
0.0
0.2
0.4
0.6
0.8
1.0
1.2
1990 1993 1996 1999 2002 2005 2008 2011
Dispersion in Non-oil Labor Productivity(1990-2011)
Coefficient of variation
Sources: Iranian authorities and Fund staff calculations.
ISLAMIC REPUBLIC OF IRAN
INTERNATIONAL MONETARY FUND 23
Mining, Iran’s most productive industry in the non-oil economy, absorbed no additional labor, which is expected given the sector’s natural capital intensity. The second most productive sector, communications, increased its labor share from 0 to about 1 percent of the non-oil labor force, particularly in the period from 2005 when private mobile phone operators started in the Iranian market. The communications sector is then responsible for the bulk of the positive structural change identified above. The decline in agricultural employment also contributed positively to structural change by freeing up labor in the economy’s least productive sector. However, as the importance of agriculture has shrunk, labor migrated to sectors such as construction and transportation, where productivity was also relatively weak. Previous research highlighted the importance of reducing the employment share of agriculture as a means to boost aggregate productivity (Restuccia et al., 2008). However, the experience of the Iranian economy nuances this result: the labor released in agriculture has to be reallocated to sectors that are more productive and, crucially, remain so over time. Otherwise, aggregate productivity may not gain much.
9. Capital also failed to flow to the more productive sectors. Similar to the relationship between employment and productivity, changes in capital bear little relationship to sectoral productivity. The service sector saw the largest decline in capital per worker despite having an above-median level of labor productivity. The transportation sector recorded the largest increase, notwithstanding its relatively weak productivity performance. And the case of the communications sector is particularly telling. Communications is the industry sector with the largest gains in labor productivity over the period 1990–2011. Yet physical capital per worker in the sector actually declined.
Agric Manuf
Mining
Trans
Comm
Utl
ConsServ
y = 3.01x + 2.11R² = 0.01
0
1
2
3
4
5
6
7
-0.15 -0.10 -0.05 0.00 0.05 0.10
Rela
tive
prod
uciti
vity
(se
ctor
al/t
otal
)
Change in employment share (sector/total)
Correlation: Sectoral Productivity and Change in Employment (1990-2011)
Sources: Iranian authorities and Fund staff calculations.
Agric
Manuf
Mining
Trans
Comm
Utl
ConsServ
y = -0.89x + 2.11R² = 0.00
0
1
2
3
4
5
6
7
-0.15 -0.10 -0.05 0.00 0.05 0.10
Rela
tive
prod
uciti
vity
(sec
tora
l/to
tal)
Change in capital share (sector/total)
Sources: Iranian authorities and Fund staff calculations.
Correlation: Sectoral Productivity and Change in Capital(1990–2011)
-0.5
-0.4
-0.3
-0.2
-0.1
0.0
0.1
0.2
0.3
0.4
0.5
-0.5
-0.4
-0.3
-0.2
-0.1
0.0
0.1
0.2
0.3
0.4
0.5
1990
1991
1992
1993
1994
1995
1996
1997
1998
1999
2000
2001
2002
2003
2004
2005
2006
2007
2008
2009
2010
2011
Capital deepeningTFP & Human capitalLabor productivity growth
Labor Productivity in Communication(1990–2011)
Sources: Iranian authorities and Fund staff calculations.
ISLAMIC REPUBLIC OF IRAN
24 INTERNATIONAL MONETARY FUND
C. Towards Policies that Stimulate Labor Productivity
10. Increasing labor productivity in a sustainable manner will require a multi-pronged approach. A range of policies are required to boost both the “structural change” and “sector-specific” components of aggregate labor productivity at the same time; no single policy measure will be sufficient. Policies facilitating a reallocation of labor and capital towards more productive sectors, positive “structural change”, include: (i) invigorating the flexibility and dynamism of the labor market; (ii) pressing ahead with banking sector reform to improve the efficiency of financial intermediation; and (iii) strengthening the price signal in product markets. “Sector-specific” productivity levels, on the other hand, will benefit primarily from: (i) greater economic integration; and (ii) targeted growth policies, particularly for the agriculture and services sectors given their economic importance. Sound macroeconomic policies and continued progress in education, governance and institutions—the “fundamentals” of growth (Rodrik, 2013)—will have to accompany the productivity-specific measures to unleash their full effectiveness. Specifically:
Spurring labor market flexibility and dynamism. Iran’s labor market ranks as one of the most rigid worldwide in a yearly index compiled by the Fraser Institute. In particular, complex hiring and dismissal regulations and centralized wage setting procedures beleaguer Iran’s labor market. According to Lagos (2006), policies that distort employers’ decisions about creating new and removing superfluous jobs can have significant detrimental effects on productivity. In the same vein, McMillan et al., (2014) contend that expanding companies will tilt their investments towards capital accumulation and away from new workers if rigid labor market regulation imposes high costs of hiring and firing workers. Iran’s growth strategy of subsidizing energy, which favors the accumulation of physical capital over hiring new labor, compounds this problem. When investment is structurally biased against labor, it reduces the scope for labor reallocations from less to more productive industry sectors. The policy priority should therefore be to ease the rigidity of contracts and increase flexibility in wage determination, which will make labor more attractive.
Enhancing the efficiency of financial intermediation. Although Iran’s credit market with a private-sector credit to GDP ratio of around 60 percent (end 2014/15) is relatively deep, it lags in efficiency. Nonmarket factors such as government-mandated credit policies, administered lending and deposit rates, and related-party lending can trump profitability considerations in banks’ lending decisions. The weak profitability and asset quality of Iranian banks are symptomatic of these frictions in the credit market. As a result, capital does not always reach the most productive sectors, and within each sector, the most productive companies. The resulting misallocation in capital can lead to large productivity losses (Banerjee and Duflo, 2005; and
012345678910
0123456789
10
HKG NZL
CAN
CZE
LBN
GU
YTT
OM
KD BGR
BRD
KWT
LVA
IND
DEU NIC
COG
TUN
LUX
COD
ALB
YEM FIN
TUR
IRN
NO
RSE
NVE
N
Labor Market Flexibility Index (2013; 10=flexible, 1=rigid)
Source: Fraser Institute.
Iran
ISLAMIC REPUBLIC OF IRAN
INTERNATIONAL MONETARY FUND 25
Hsieh and Klenow, 2009). Improving the allocation of capital through banking sector reform is therefore a promising avenue towards boosting labor productivity. Specifically, policy should strive to gradually dismantle government-mandated credit policies, empower supervision to enforce prudential limits on related-party exposures, and strengthen governance to ensure that bank management heeds to commercial incentives.
Strengthening the price signal in product markets. In Iran, the government mandates the prices for many outputs of the agriculture, manufacturing, and construction sectors. Yet these administered prices do not always reflect demand and supply forces, thwarting incentives for and profitability of new investment. Giving a greater weight to market forces in the determination of the affected output prices will tend to increase investment in high-productivity sectors and companies. Investment rates biased towards high productivity will help attract labor and capital from other parts of the economy, boosting the potential in Iran for growth-enhancing “structural change.”
11. In addition to fostering “structural change,” aggregate labor productivity will also thrive on the back of measures that propel “sector-specific” productivity levels. In particular:
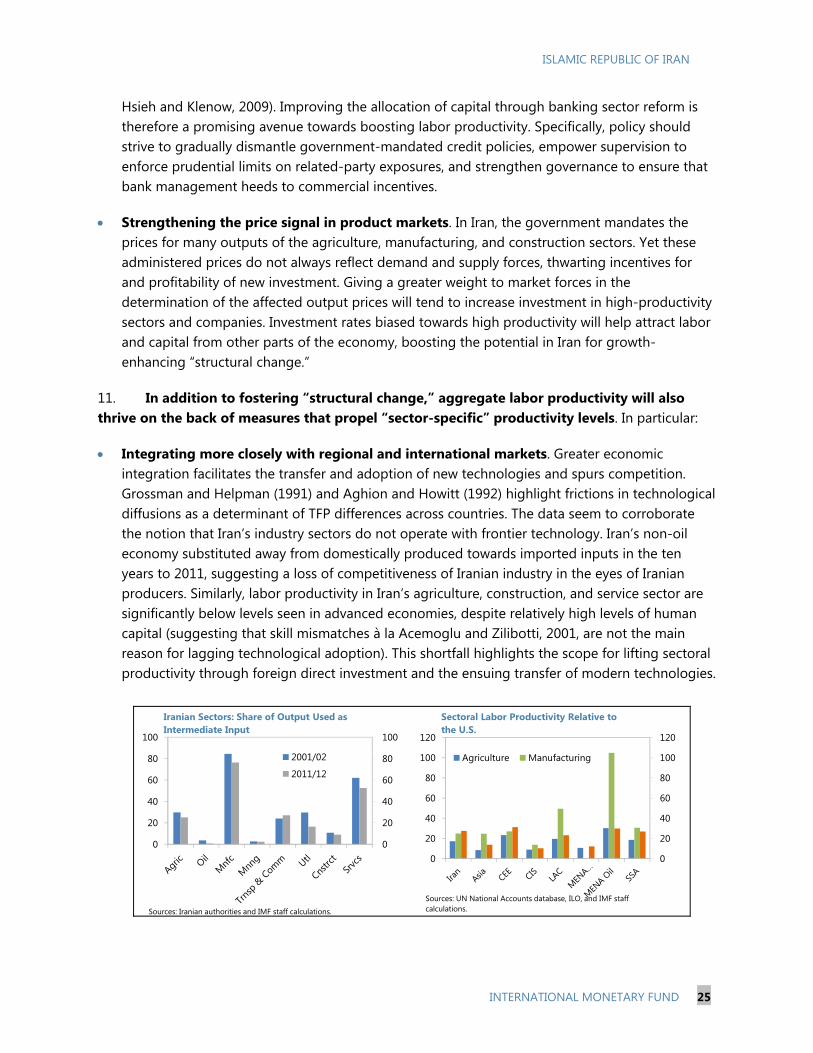
Integrating more closely with regional and international markets. Greater economic integration facilitates the transfer and adoption of new technologies and spurs competition. Grossman and Helpman (1991) and Aghion and Howitt (1992) highlight frictions in technological diffusions as a determinant of TFP differences across countries. The data seem to corroborate the notion that Iran’s industry sectors do not operate with frontier technology. Iran’s non-oil economy substituted away from domestically produced towards imported inputs in the ten years to 2011, suggesting a loss of competitiveness of Iranian industry in the eyes of Iranian producers. Similarly, labor productivity in Iran’s agriculture, construction, and service sector are significantly below levels seen in advanced economies, despite relatively high levels of human capital (suggesting that skill mismatches à la Acemoglu and Zilibotti, 2001, are not the main reason for lagging technological adoption). This shortfall highlights the scope for lifting sectoral productivity through foreign direct investment and the ensuing transfer of modern technologies.
0
20
40
60
80
100
0
20
40
60
80
100
2001/02
2011/12
Iranian Sectors: Share of Output Used as Intermediate Input
Sources: Iranian authorities and IMF staff calculations.
0
20
40
60
80
100
120
0
20
40
60
80
100
120
Agriculture Manufacturing
Sectoral Labor Productivity Relative to the U.S.
Sources: UN National Accounts database, ILO, and IMF staff calculations.

ISLAMIC REPUBLIC OF IRAN
26 INTERNATIONAL MONETARY FUND
Targeting growth policies to agriculture and services sectors. More than half of Iran’s labor force works in agriculture and services. Productivity improvements in these two sectors are therefore crucial to raise economy-wide productivity and growth. The service sector in Iran is ighly regulated and has high barriers of entry, stifling competition. In fact, in a sample of 51 countries in the World Bank’s Services Trade Restriction Database, the Iranian service sector ranks as the most restricted for international trade. Removing regulatory barriers on foreign ownership and operations in the Iranian market with a view to intensify competition seems promising to increase productivity. Competitive pressures are likely to speed up the adoption of IT to reorganize business operations in service sectors such as retailing, consulting, and science. Business reorganizations with the help of IT were significant factors in accelerating TFP growth in the U.S. in the mid-1990s (Fernald and Wang, 2015). As for agriculture, cross-country evidence points to the importance of land and tenancy reform in boosting productivity in agriculture. Iran has already taken steps to develop more modern agricultural practices such as horticulture and floriculture. These activities have higher value-added content than traditional fields such as rice paddy farming.
010203040506070
0 50 100 150
Serv
ice
Rest
rictio
n In
dex
Service sector productivity relative to US
Iran
Services Trade Restrictiveness and Service Sector Productivity(measured in PPP; 2008)
Sources: UN National Accounts database, ILO, World Bank, and IMF staff calculations.

ISLAMIC REPUBLIC OF IRAN
INTERNATIONAL MONETARY FUND 27
References
Acemoglu, Daron, and Fabrizio Zilibotti, 2001, “Productivity differences,” The Quarterly Journal of Economics, No. 116, pp. 563–606.
Aghion, Philippe, and Peter Howitt, 1992, “A Model of Growth Through Creative Destruction,” Econometrica, Vol. 60 No. 2, pp. 323–51.
Banerjee, Abhijit, and Esther Duflo, 2005, “Growth Theory Through the Lens of Development Economics,” in: Handbook of Economic Growth, Vol. 1A, Chapter 7, North-Holland.
Caselli, Francesco, 2004, “The Missing Input: Accounting for Cross-Country Income Differences,” Harvard University,” in: Handbook of Development Economics, North-Holland.
Fernald, John, 1999, “Roads to Prosperity? Assessing the Link Between Public Capital and Productivity,” American Economic Review, 89, pp. 619–38.
Fernald, John, and Bing Wang, 2015, “The Recent Rise and Fall of Rapid Productivity Growth,” FRBSF Economic Letter 2015–04.
Grossman, Gene and Elhanan Helpman, 1991, “Innovation and Growth in the Global Economy” (Cambridge, Massachusetts: MIT Press).
Hall, Robert E., and Charles I. Jones, 1999, “Why Do Some Countries Produce so Much More Output per Worker than Others?” The Quarterly Journal of Economics, Vol. 114 No. 1, pp. 83–116.
Hsieh, Chang-Tai and Paul Klenow, 2009, “Misallocation and Manufacturing TFP in China and India,” The Quarterly Journal of Economics, Vol. 124 No. 4, pp.1403–48.
Jorgenson, Dale W., and Khuong M. Vu, 2010, “Potential Growth of the World Economy,” Journal of Policy Modeling, No. 32, pp.615–31.
Lagos, Ricardo, 2006, “A model of TFP,” Review of Economic Studies, Vol. 73 No. 4, pp. 983–1007.
McMillan, Margaret, Dani Rodrik, and Inigo Verduzco-Gallo, 2014, “Globalization, Structural Change, and Productivity Growth, with an Update on Africa,” World Development, No. 63, pp. 11–32.
Restuccia, Diego, Dennis Tao Yang, and Xiaodong Zhu, 2008, “Agriculture and Aggregate Productivity: A Quantitative Cross-Country Analysis,” Journal of Monetary Economics, No. 55, pp. 234–50.
Rodrik, Dani, 2013, “Structural Change, Fundamentals, and Growth: An Overview,” Introductory Essay for World Bank Case Studies.