imf country report no. 15/198 czech republic
TRANSCRIPT
© 2015 International Monetary Fund
IMF Country Report No. 15/198
CZECH REPUBLIC 2015 ARTICLE IV CONSULTATION—PRESS RELEASE; AND STAFF REPORT
Under Article IV of the IMF’s Articles of Agreement, the IMF holds bilateral discussions with members, usually every year. In the context of the 2015 Article IV consultation with the Czech Republic, the following documents have been released and are included in this package: A Press Release
The Staff Report prepared by a staff team of the IMF for the Executive Board’s consideration on a lapse of time basis, following discussions that ended on May 19, 2015, with the officials of the Czech Republic on economic developments and policies. Based on information available at the time of these discussions, the staff report was completed on June 29, 2015.
An Informational Annex prepared by the IMF staff.
The IMF’s transparency policy allows for the deletion of market-sensitive information and premature disclosure of the authorities’ policy intentions in published staff reports and other documents.
Copies of this report are available to the public from
International Monetary Fund Publication Services PO Box 92780 Washington, D.C. 20090
Telephone: (202) 623-7430 Fax: (202) 623-7201 E-mail: [email protected] Web: http://www.imf.org
Price: $18.00 per printed copy
International Monetary Fund Washington, D.C.
July, 2015

Press Release No. 15/350
FOR IMMEDIATE RELEASE
July 23, 2015
IMF Executive Board Concludes 2015 Article IV Consultation with Czech Republic
On July 15, 2015, the Executive Board of the International Monetary Fund (IMF) concluded the
Article IV consultation1 with the Czech Republic and considered and endorsed the staff appraisal
without a meeting.2
The Czech economy is growing strongly on account of improving domestic demand and robust
exports. Growth accelerated in the first quarter of this year and high frequency indicators,
including retail sales, production and consumer confidence suggest that the growth momentum
has continued in recent months. The labor market also has been recovering fast and the
unemployment rate declined to the lowest level since 2009. Led by an improving trade balance
due to positive terms-of-trade developments, the current account turned to a surplus. In the face
of a drop in energy and food prices, headline inflation decelerated sharply in 2014 and is
hovering just above zero, while core inflation remains stable.
Following substantial pro-cyclical fiscal tightening in 2011–13, fiscal policy has been supportive
of the economic recovery. Specifically, the general government deficit increased from
1.2 percent of GDP in 2013 to 2.0 percent in 2014, implying about a 1 percentage point easing in
the fiscal stance. The relaxation was mainly due to a negative surprise in excise collections, and
an increase in capital spending.
Monetary policy has remained accommodative. In November 2013, constrained by the zero
lower bound and facing deflationary pressures, the Czech National Bank decided to use the
exchange rate as an additional instrument for inflation targeting and announced its commitment
“to prevent excessive appreciation of the koruna below CZK27 per € by intervening in the
1 Under Article IV of the IMF's Articles of Agreement, the IMF holds bilateral discussions with members, usually
every year. A staff team visits the country, collects economic and financial information, and discusses with officials
the country's economic developments and policies. On return to headquarters, the staff prepares a report, which
forms the basis for discussion by the Executive Board.
2 The Executive Board takes decisions under its lapse-of-time procedure when the Board agrees that a proposal can
be considered without convening formal discussions.
International Monetary Fund
700 19th
Street, NW
Washington, D. C. 20431 USA

2
foreign exchange market”. The exchange rate has been hovering above that level without any
official intervention in the foreign exchange market since November 2013.
The banking sector is stable and credit growth shows signs of a recovery. Czech banks are self-
financed with a low system-wide loan-to-deposit ratio and strong capital and liquidity buffers.
Despite a slight increase in the non-performing loan ratio to 5.6 percent last year, the ratio
remains low. Credit growth is slowly recovering driven by demand from the corporate sector and
recent lending surveys point to easing lending standards and gradually rising demand for credit.
Funding costs have declined further.
The outlook is for strong growth and low inflation. Growth is projected to accelerate to 3 percent
in 2015, mainly on account of higher investment and improving household consumption.
Inflation is likely to remain very low in 2015, before rising gradually toward the cenral bank’s
target in 2016, as base effects from the oil price shock fade and declining economic slack starts
to pull inflation up. Over the medium term, output growth is set to stabilize at around
2¼ percent, but a period of faster growth is possible, driven by the strong pipeline of FDI coming
into effect.
Executive Board Assessment
In concluding the 2015 Article IV consultation with the Czech Republic, Executive Directors
endorsed staff’s appraisal, as follows:
The Czech economy is growing strongly but challenges remain. The economic upturn is driven
by robust exports and improving domestic demand being helped by accommodative
macroeconomic policies. The labor market has been recovering fast with strong employment
gains and real wage growth picking up gradually. But while disinflationary pressures seem to
have abated, inflation is still below the central bank’s target. In addition, potential growth is well
below the level necessary to facilitate fast convergence toward the income levels of other
advanced European countries. Thus, the challenge for the authorities is to create the conditions
for sustainable growth while safeguarding macroeconomic stability.
Fiscal policy and the medium-term fiscal objective need to be anchored in fiscal framework
legislation, and the composition of the budget should be improved. The remaining output gap,
low inflation, and the fact that monetary policy is at the zero lower bound warrant maintaining a
slightly accommodative fiscal stance this year, as planned by the authorities. At the same time,
though, modest and very gradual fiscal consolidation will be necessary beginning next year, in
line with the authorities’ commitment to a medium-term objective of a 1 percent of GDP
structural deficit. Moreover, this objective should be cast in fiscal framework legislation that
would include expenditure ceilings, a debt brake rule, and a fiscal council—thus helping anchor
fiscal policy and guard against pro-cyclical tendencies. Finally, there is scope to improve budget

3
composition, with increased capital spending to address infrastructure needs offset by efficiency
gains in current spending and improved revenue administration.
The central bank should continue to focus on inflation targeting. The exchange rate floor has
proven effective in fending off deflationary pressures, and in combination with recovering
demand conditions, inflation is expected to rise toward the central bank’s target in the second
half of 2016, thus facilitating an exit from the exchange rate floor. The central bank should thus
maintain its focus on inflation targeting in its policymaking and communication, while
continuing to evaluate the conditions that would trigger a normalization of monetary policy and
the mechanics of its implementation. However, given the only gradual closing of the output gap
and asymmetric risks at the zero lower bound, monetary policy will likely need to remain
supportive for some time even after abolishment of the exchange rate floor and return to a
floating exchange rate.
Continued vigilance will be needed to sustain the stability of the financial system. The banking
sector is self-financed with low system-wide loan-to-deposit ratio and strong capital and liquidity
buffers, which make it resilient to shocks. Moreover, bank supervision has been strengthened by
increasing supervisory resources, approving a new law on credit unions, and starting utilizing the
macroprudential toolkit of the Capital Requirements Regulation IV. Nevertheless, proactive
supervision remains necessary along with further gradual improvements in the supervisory
architecture, including the transposition of the Bank Recovery and Resolution Directive into
domestic law.
An ambitious structural reform agenda is key to lifting Czech Republic’s potential growth.
Sustained progress on wide-ranging reforms to increase labor market participation, enhance
investment in human and physical capital, and improve the business climate is essential for
higher investment and growth. Reforms of the labor market should aim at increasing labor
participation among women with children and low-skilled workers, while greater emphasis
should be placed on mitigating skills mismatches. Priority should also be given to promoting
research and innovation, enhancing apprenticeship programs, simplifying tax compliance and
other administrative procedures, and improving infrastructure.

4
Czech Republic: Selected Economic Indicators, 2010–20
2010 2011 2012 2013 2014 2015 2016 2017 2018 2019 2020
Staff Proj.
Nominal GDP (USD billions) 207.0 227.3 206.8 208.8 205.6 181.1 188.9 195.7 200.4 202.9 206.2
Population (millions) 10.5 10.5 10.5 10.5 10.5 10.5 10.5 10.6 10.6 10.6 10.6
GDP per capita (USD) 19,787 21,676 19,680 19,855 19,562 17,205 17,917 18,545 18,966 19,193 19,496
Real economy (change in percent, unless stated otherwise)
Real GDP 2.3 2.0 -0.8 -0.7 2.0 3.0 2.8 2.6 2.2 2.2 2.2
Real GDP per capita 1.9 1.7 -1.0 -0.8 2.0 2.8 2.6 2.5 2.1 2.1 2.1
Domestic demand 1.8 0.0 -2.2 -0.8 2.2 3.8 3.3 2.9 2.6 2.6 2.6
Private consumption 1.0 0.2 -1.8 0.4 1.7 3.0 2.8 2.4 2.3 2.3 2.3
Investment 4.4 1.9 -3.7 -5.1 3.1 6.5 5.0 4.5 3.7 3.7 3.7
Exports 14.8 9.3 4.1 0.3 8.8 7.2 6.2 5.0 4.0 4.0 4.0
Imports 14.9 6.7 2.4 0.3 9.5 8.5 7.0 5.5 4.6 4.6 4.6
Ouput gap (percent of potential output) -0.2 0.2 -1.9 -3.6 -2.8 -1.2 0.0 0.5 0.4 0.2 0.0
CPI (average) 1.5 1.9 3.3 1.4 0.4 0.2 1.3 2.0 2.0 2.0 2.0
Unemployment rate (in percent) 7.3 6.7 7.0 7.0 6.1 5.4 5.0 4.7 4.8 5.0 5.0
Gross national savings (percent of GDP) 23.5 24.9 24.8 24.5 25.7 27.4 27.2 27.1 27.1 27.1 27.2
Gross domestic investments (percent of GDP) 27.2 27.0 26.3 25.0 25.1 25.9 26.2 26.5 26.8 27.2 27.5
Public finance (percent of GDP)
General government revenue 38.6 39.7 39.9 40.8 40.1 40.2 39.2 39.4 39.6 39.6 39.7
General government expenditure 43.0 42.4 43.8 41.9 42.0 42.3 40.5 40.5 40.5 40.5 40.6
Net lending / Overall balance -4.4 -2.7 -3.9 -1.2 -2.0 -2.0 -1.3 -1.0 -0.9 -0.9 -1.0
Structural balance (percent of potential GDP) -4.3 -2.7 -1.4 0.1 -0.9 -1.5 -1.4 -1.3 -1.1 -1.0 -1.0
General government debt 38.2 39.9 44.6 45.0 42.6 41.0 40.5 39.9 39.3 38.9 38.5
Money and credit (end of year, percent change)
Broad money (M3) 1.9 2.8 4.8 5.8 4.4 … … … … … …
Private sector credit 3.0 5.5 2.6 3.7 3.1 … … … … … …
Interest rates (in percent, year average)
Three-month interbank rate 1.3 1.2 1.0 0.5 0.4 … … … … … …
Ten-year government bond 3.9 3.7 2.8 2.1 1.6 … … … … … …
Balance of payments (percent of GDP)
Trade balance (goods and services) 3.0 3.9 5.0 5.8 6.9 7.9 7.5 6.9 6.6 6.3 6.0
Current account balance -3.7 -2.1 -1.6 -0.5 0.6 1.5 1.0 0.5 0.2 -0.1 -0.4
Gross international reserves (US$ billion) 42.5 40.3 44.9 56.2 54.5 51.7 53.7 56.6 59.6 62.5 65.9
(in months of imports of goods and services) 3.9 3.2 3.6 4.6 4.1 4.3 4.1 4.0 4.1 4.1 4.2
Exchange rate
Nominal effective exchange rate (index, 2005=100) 119.2 123.2 118.4 116.9 111.7 … … … … … …
Real effective exchange rate (index, CPI-based;
2005=100) 120.1 122.3 118.2 116.2 110.0 … … … … … …
Sources: Czech Statistical Office; Czech National Bank; Ministry of Finance; Haver Analytics, and IMF staff estimates and projections.

CZECH REPUBLIC STAFF REPORT FOR THE 2015 ARTICLE IV CONSULTATION
KEY ISSUES Context. The economy is growing strongly on account of improving domestic demand
and robust exports. Fiscal policy has been supportive of the recovery and the authorities’
medium-term fiscal objective is appropriate, but fiscal framework legislation that would
anchor policy is yet to be approved. The central bank’s use of an exchange rate floor as
an additional instrument to achieve its inflation objective, in the context of the inflation-
targeting framework, has helped stem deflationary pressures, but inflation is still well
below target. The financial system is sound and resilient to shocks. The challenge for the
authorities is to safeguard macroeconomic stability and create conditions for strong and
sustainable growth.
Policy recommendations.
Fiscal policy. Maintain a supportive fiscal stance this year, but embark on a modest
and very gradual fiscal consolidation thereafter, consistent with the medium-term deficit
objective. Embed this objective in a comprehensive framework to enhance its
effectiveness in anchoring fiscal policy. Improve budget composition, with higher capital
spending to address infrastructure needs offset by efficiency gains in current
expenditure and improved revenue administration.
Monetary policy. Continue to focus on inflation targeting in policymaking and
communication, and maintain supportive monetary conditions until deflation risks
recede and inflation expectations become entrenched around the inflation target.
Consider carefully the timing and mechanics of the eventual normalization of monetary
policy.
Financial sector. Remain vigilant and be ready to address possible risks to financial
stability.
Structural reforms. Remove impediments to higher potential growth, including
through policies to increase labor market participation of certain segments of the
population, enhance investment in human and physical capital, and improve the
business climate.
June 26, 2015
CZECH REPUBLIC
2 INTERNATIONAL MONETARY FUND
Approved by Philip Gerson and
Bob Traa
Discussions took place in Prague during May 11–20, 2015. The
staff team comprised Messrs. Christou (Head), Dalgıç and
Thegeya, and Ms. Shabunina (all EUR). Mr. Kollár (OED) attended
some meetings. Mr. Iossifov (EUR) contributed from headquarters
and Mmes. Chen and Moraes Rego (both EUR) assisted in the
preparation of the staff report. The staff team met with Czech
National Bank Governor Singer, Minister of Finance Babis, other
senior officials, and representatives from the private sector and
trade unions. Czech Republic is an Article VIII country
(Informational Annex: Fund Relations). Data provision is adequate
for surveillance (Informational Annex: Statistical Issues).
CONTENTS
CONTEXT_________________________________________________________________________________________ 4
BACKGROUND AND RECENT DEVELOPMENTS ________________________________________________ 4
OUTLOOK AND RISKS ___________________________________________________________________________ 7
POLICY DISCUSSIONS ___________________________________________________________________________ 8
A. Anchoring Fiscal Policy _________________________________________________________________________ 8
B. Achieving the Inflation Target __________________________________________________________________ 9
C. Safeguarding Financial Stability _______________________________________________________________ 11
D. Boosting Potential Growth ____________________________________________________________________ 12
STAFF APPRAISAL _____________________________________________________________________________ 13
BOXES
1. Response to Past Fund Policy Advice __________________________________________________________ 16
2. Competitiveness Assessment __________________________________________________________________ 17
3. Efficiency of Public Spending __________________________________________________________________ 18
4. Gender Gaps in the Labor Market _____________________________________________________________ 22
FIGURES
1. Macroeconomic Developments _______________________________________________________________ 25
2. Inflation _______________________________________________________________________________________ 26
3. Financial Markets ______________________________________________________________________________ 27
4. Bank Lending __________________________________________________________________________________ 28
5. Fiscal Developments and Prospects ___________________________________________________________ 29
6. Competitiveness Indicators ____________________________________________________________________ 30

CZECH REPUBLIC
INTERNATIONAL MONETARY FUND 3
TABLES 1. Selected Economic Indicators, 2010–20 _______________________________________________________ 31 2. Balance of Payments, 2010–20 _________________________________________________________________ 32 3. The Statement of Operations of General Government, 2010–20 (in billions of Koruny) _______ 33 4. The Statement of Operations of General Government, 2010–20 (in percent of GDP) __________ 34 5. Medium-Term Macroeconomic Scenario, 2010–20 ____________________________________________ 35 6. Financial Soundness Indicators ________________________________________________________________ 36 7. Monetary Indicators, 2007–14 _________________________________________________________________ 37 APPENDICES I. Background Note on Drivers of Disinflation ____________________________________________________ 38 II. Debt Sustainability Analysis ____________________________________________________________________ 41

CZECH REPUBLIC
4 INTERNATIONAL MONETARY FUND
CONTEXT
1. The Czech economy is growing at a strong pace but challenges remain. With the
support of accommodative macroeconomic policies, output growth rebounded in 2014. A further
acceleration is in train, with both exports and domestic demand performing well. The central bank’s
use of an exchange rate floor as an additional instrument to achieve its inflation objective has
helped stem deflationary pressures, but inflation remains well below target. At the same time, fiscal
framework legislation that would anchor policy is yet to be approved. The challenge for the
authorities is to create conditions for sustainable growth while maintaining macroeconomic stability.
2. The strong growth performance has helped keep the coalition stable. The
government—a coalition of the Social Democrats, a new center right party (ANO), and the Christian
Democrats—took office in January 2014, roughly simultaneous with the upturn in the business cycle,
following the previous fiscally-conservative and euro-skeptic coalition. Although the new
government is friendlier to the EU policy agenda, it is ideologically diverse. On one hand, its overall
orientation is toward more activist social welfare-enhancing policies, while on the other hand, ANO
has pledged not to increase taxes and to put strong emphasis on improving tax administration.
BACKGROUND AND RECENT DEVELOPMENTS
3. The Czech economy is growing
strongly. Real GDP expanded by 2 percent in
2014, with both exports and domestic demand,
particularly investment, performing well.
Investment benefitted from public resources,
with local government activity and EU-funded
projects being carried out at a higher-than-
expected pace. Consumption growth was
supported by robust labor income gains and
reached the pre-crisis growth rate in 2014:Q4.
The growth momentum continued this year, with
output growth accelerating markedly to
4.2 percent y-o-y in 2015:Q1. While this
performance was probably influenced by tobacco
excise legislation that increased cigarette re-
stocking early in the year, growth was broad-
based and driven by domestic demand.
Moreover, high frequency indicators provide
further evidence of economic growth gaining a
strong footing, with Purchasing Managers’
Indexes showing continued improvements in
output, new orders, and employment.
-6
-4
-2
0
2
4
6
8
10
Jan
-12
Mar-
12
May-1
2
Jul-
12
Sep
-12
No
v-1
2
Jan
-13
Mar-
13
May-1
3
Jul-
13
Sep
-13
No
v-1
3
Jan
-14
Mar-
14
May-1
4
Jul-
14
Sep
-14
No
v-1
4
Jan
-15
Mar-
15
Momentum Indicators
(Moving average over the previous 3 month, SA)
Exports
Retail sales
Industrial production
Source: Haver Analytics.
-8
-6
-4
-2
0
2
4
6
2009Q
1
2009Q
3
2010Q
1
2010Q
3
2011Q
1
2011Q
3
2012Q
1
2012Q
3
2013Q
1
2013Q
3
2014Q
1
2014Q
3
2015Q
1
Contributions to Growth
(Percent)
Domestic demand Net exports Real GDP
Source: Czech Statistical Office.

CZECH REPUBLIC
INTERNATIONAL MONETARY FUND 5
4. The labor market has been recovering fast. Employment growth gathered speed in the
second half of 2014 and reached 1.3 percent y-o-y in 2015:Q1, while the unemployment rate has
declined to 5.7 percent, the lowest level since 2009:Q1. Real wage growth also turned positive
in 2014 (2.1 percent), boosted by the improving labor market as well as a 2 percent public wage
adjustment in 2014 and a 6.3 percent increase in the minimum wage effective August 2013. The
minimum wage was further increased by 8.2 percent in 2015.
5. Inflation has been hovering just above zero. In the face of a drop in energy and food
prices, headline inflation
decelerated sharply to an
average of 0.4 percent in 2014,
and declined further to
0.1 percent in 2015:Q1, before
picking up slightly to
0.7 percent y-o-y in May.
Meanwhile, inflation adjusted
for food, fuel, indirect taxes,
and administered prices (core
inflation) has remained stable at
around 1 percent since mid-
2014. One-year ahead inflation
expectations, which had been boosted by the introduction of the exchange rate floor, declined in
early 2015, while 3-year ahead expectations remain stable at around the 2 percent inflation target,
reflecting the credibility of the central bank (CNB).
6. Fiscal policy has been supportive of the recovery. Following substantial pro-cyclical fiscal
tightening in 2011–13, the general government deficit increased from 1.2 percent of GDP in 2013 to
2.0 percent in 2014, implying about a 1 percentage point deterioration in the cyclically-adjusted
fiscal balance. The relaxation was mainly due to an increase in capital spending and a negative
surprise in excise collections1. The headline deficit widened further as a result of statistical changes
to comply with ESA2010 methodology, which entailed, among other issues, the inclusion of the
Deposit Insurance Agency that had a one-off payout in 2014 in the general government.
7. Monetary conditions remain accomodative. In November 2013, constrained by the zero
lower bound and facing deflationary pressures, the CNB decided to use the exchange rate as an
additional instrument for inflation targeting and announced its commitment “to prevent excessive
appreciation of the koruna below CZK27 per € by intervening in the foreign exchange market.” The
exchange rate floor was considered preferable over purely quantitative easing through purchases of
domestic financial assets given the ample excess liquidity in the banking system, scarcity of private
1 Cigarette excises were increased in January 2014, leading to pre-stocking by retailers and lower-than-forecast sales
under the new excises throughout 2014.
-2
-1
0
1
2
3
Jan-13 Jul-13 Jan-14 Jul-14 Jan-15
Czech Republic
Sources: Eurostat and Fund staff estimates.
-2
-1
0
1
2
3
Jan-13 Jul-13 Jan-14 Jul-14 Jan-15
Euro area
Contributions to Headline Inflation, 2012-15
(Percentage-points contributions to 12-month growth rates of HICP)
Food and energy (incl. adm. price and tax changes)
Core inflation (HICP excl. food and energy)
Harmonised Index of Consumer Prices (HICP)

CZECH REPUBLIC
6 INTERNATIONAL MONETARY FUND
sector assets to purchase, and shallowness of secondary government bond markets. The exchange
rate has been hovering above the floor without any further intervention in the FX market since the
CNB purchases of euro in November 20132 with some limited volatility around the time of oil price
declines (markets braced for the deflationary impact and possibly a weaker koruna) and ECB’s
quantitative easing. 3
8. The banking sector is stable, and credit growth shows some signs of a recovery. Czech
banks are self-financed with a low system-wide loan-to-deposit ratio and strong capital and liquidity
buffers. Despite a slight increase in the non-performing loan (NPL) ratio to 5.6 percent last year, due
to an increase in NPLs of the government-owned Export bank, the ratio remains low. Credit growth
accelerated to 3½ percent y-o-y in April, on account of a pickup in corporate-sector demand, while
household credit growth remains robust.
9. Funding costs remain low. Bond yields have declined to historical lows on expectations of
prolonged monetary policy accomodation earlier in 2015 before starting to rise in line with euro
area trends: the 10-year bond yield recently reached almost 1.2 percent compared with lows of
0.4 percent in April. Czech Republic is rated investment grade with a stable outlook, and five-year
credit default swap rates have been steady at around 50 basis points.
10. The current account turned to a surplus. Led by an improving trade balance, the current
account registered a 0.6 percent of GDP surplus in 2014 compared with a 0.5 percent deficit in 2013.
The trade balance improvement was driven by favorable terms-of-trade developments,
notwithstanding strong import volume growth that outpaced that of exports. Meanwhile, the
income deficit remained stable at around 6 percent of GDP.
2 The gradual reserve accumulation during 2014–15 is due to EU funds and other fiscal inflows.
3 The de facto exchange rate arrangement was retroactively reclassified from other managed to stabilized effective
November 19, 2013.
20
25
30
35
40
45
50
55
60
Jan
-11
Ap
r-11
Jul-
11
Oct
-11
Jan
-12
Ap
r-12
Jul-
12
Oct
-12
Jan
-13
Ap
r-13
Jul-
13
Oct
-13
Jan
-14
Ap
r-14
Jul-
14
Oct
-14
Jan
-15
Ap
r-15
Official Reserves
(EUR billion)
Intervention
and floor
announcement
25.0
25.5
26.0
26.5
27.0
27.5
28.0
28.5
Jan
-13
Ap
r-13
Jul-
13
Oct
-13
Jan
-14
Ap
r-14
Jul-
14
Oct
-14
Feb
-15
May-1
5
Exchange Rate
(EUR /CZK)
CNB's FX floor
appreciation
Intervention
and floor
announcement
Source: Haver Analytics.

CZECH REPUBLIC
INTERNATIONAL MONETARY FUND 7
11. Staff’s assessment is that the real exchange rate is broadly in line with fundamentals.
The EBA methodology yields mixed results for the Czech Republic, with current account balance-
based approaches pointing to marginal undervaluation and the multilateral REER approach showing
an overvaluation (Box 2). Other considerations also point to the absence of evident imbalances in
the external position, or of significant shortcomings in non-price competitiveness indicators
(Figure 6). Overall, staff assesses the exchange rate to be in broad equilibrium.
OUTLOOK AND RISKS
12. Staff expects growth to accelerate to 3 percent in 2015. Investment, supported by
growing business confidence, higher capacity utilization and greater take-up of EU funds, is
expected to be the main driver of growth. At the same time, the strength of the labor market and
improved consumer confidence would provide a boost to private consumption. On the other hand,
while export growth remains robust, the net export contribution is projected to turn negative, as
strong domestic demand would boost imports. Inflation is likely to remain very low in 2015, before
rising toward the target in 2016, as base effects from the oil price shock fade and declining
economic slack starts to pull inflation up. (These projections assume the exchange rate floor remains
in place through mid-2016, as the authorities have announced.) Over the medium term, output
growth is set to stabilize at around 2¼ percent. Finally, the current account is projected to remain in
surplus, thanks to a lower oil import bill, before moving toward a small deficit on account of
improving investment and in line with fundamentals.
13. Risks to the outlook—highlighted in the Risk Assessment Matrix—are broadly balanced.
On the upside, the positive effects from lower oil prices, supportive macroeconomic policies, the
ongoing recovery in Czech Republic’s trade partners, and ECB’s quantitative easing could turn out to
be larger than currently forecast. On the downside, if the euro area recovery were to falter, the Czech
economy would be negatively affected through the trade channel. The impact would be larger still if
low growth turned self-reinforcing through low investment. Moreover, escalation of geopolitical
tensions in the region or reemergence of sovereign stress in Europe could affect exports and also
create negative confidence effects. To this end, financial market turbulance
2013 2014 2015 2016 2017 2018 2019 2020
Real GDP growth (percent) -0.7 2.0 3.0 2.8 2.6 2.2 2.2 2.2
Inflation (period average, percent) 1.4 0.4 0.2 1.3 2.0 2.0 2.0 2.0
General government overall balance -1.2 -2.0 -2.0 -1.3 -1.0 -0.9 -0.9 -1.0
General government gross debt 45.0 42.6 41.0 40.5 39.9 39.3 38.9 38.5
Current account -0.5 0.6 1.5 1.0 0.5 0.2 -0.1 -0.4
Reserves (in billions of euros) 41.0 44.2 46.3 47.6 49.6 51.6 53.5 55.5
Reserves (in billions of dollars) 56.2 54.5 51.7 53.7 56.6 59.6 62.5 65.9
Gross external debt 63.4 66.6 63.4 61.3 60.7 60.5 60.5 60.3
Sources: Czech authorities, and IMF staff projections
Projections
Czech Republic: Key macroeconomic indicators, 2013-20
(in percent of GDP, unless otherwise indicated)

CZECH REPUBLIC
8 INTERNATIONAL MONETARY FUND
could generate safe-haven inflows that would contribute to appreciation pressures in the absence of
the floor.
Authorities’ views
14. The authorities broadly agreed on the near-term outlook, medium-term prospects,
and the balance of risks. Among positive factors affecting the outlook, they emphasized their
stepped-up efforts to boost infrastructure spending, in particular associated with EU-financed
programs. They also saw an upside to medium-term growth on account of a strong pipeline of FDI,
both due to the global investment cycle and gains in Czech Republic’s relative cost position.
Downside risks were, in their view, mostly external, related to the possible intensification of
geopolitical tensions and its negative impact on market sentiment in the region. Finally, they were
somewhat concerned about renewed financial stesss in the euro area, possibly related to
developments in Greece. However, they emphasized that direct spillovers from a prolonged period
of financial market turbulence were quite small, given the very limited exposure of the banking
system to Greece.
POLICY DISCUSSIONS
Discussions focused on the need for a growth-friendly medium-term fiscal strategy, enshrined in
legislation; structural reforms to encourage investment and enhance productivity; and continued
efforts to achieve the central bank’s inflation target and preserve financial stability.
A. Anchoring Fiscal Policy
15. The 2015 fiscal stance is supportive of the recovery. The authorities plan to keep
the 2015 fiscal deficit just below 2 percent of GDP, which appears feasible and would imply a fiscal
impulse of 0.6 percentage points. Key expenditure measures include increases in investment
financed by national sources, in addition to EU funds; salaries; and health care and mandatory social
spending. The introduction of a second reduced VAT rate on pharmaceuticals, books and child
nutrition, and tax credits for families with children will weigh on revenues. Although the projected
fiscal stance is somewhat expansionary, given the remaining output gap, low inflation, and the fact
that monetary policy is at the zero lower bound, staff did not advocate a tightening this year, but
instead encouraged the authorities to allow automatic stabilizers to operate in both directions.
16. The government’s medium-term fiscal objective is appropriate. The Convergence
Program envisages gradual fiscal consolidation over 2016–18 aimed at reaching the medium-term
objective (MTO) of a 1 percent of GDP structural deficit (from the projected 1.5 percent level in
2015). This adjustment relies to a large extent on gains from improvements in revenue
administration, but also includes some savings from rationalization of spending owing to the
introduction of a central purchasing system. Staff welcomed the authorities’ commitment to the
MTO, which will put the debt ratio on a downward path while allowing adequate space for current
fiscal policy priorities. Reaching this objective would require only modest and very gradual fiscal
CZECH REPUBLIC
INTERNATIONAL MONETARY FUND 9
consolidation beginning next year, which accounts for the relative absence of major deficit-
reduction initiatives.
17. Staff emphasized that embedding the medium-term objective in a comprehensive
framework would enhance its effectiveness in anchoring fiscal policy. The updated government
proposal of the fiscal framework reform—which includes expenditure ceilings to guide spending, a
debt brake rule starting at 55 percent of GDP to gradually correct deficit overruns, and a fiscal
council to promote transparency—is under consideration by Parliament. Timely adoption of this
proposal would help anchor fiscal policy and guard against pro-cyclical tendencies in policymaking.
18. Although the overall fiscal position is relatively strong, the budget composition could
be improved, with higher capital spending to address infrastructure needs offset by efficiency
gains in current expenditure and improved revenue administration. Total government spending
is somewhat below the advanced economy average, but spending on social benefits is relatively
high and has been rising (Box 3). Staff thus argued that expansion of means testing and adherence
to the indexation rules for the adjustment of social benefits would help contain spending pressures.
Moreover, health spending is high relative to outcomes, suggesting room for efficiency gains. To
this end, staff welcomed the authorities’ envisaged measures to enhance the transparency of health
insurance companies’ finances, the launching of newly-created standardized diagnostic and
therapeutic algorithms, and improvements in data management and sharing. Conversely, sizeable
infrastructure gaps push transportation costs above the OECD average, pointing to spending needs.
On the revenue side, staff welcomed the authorities’ efforts to strengthen tax administration
through the introduction of electronic VAT reporting and electronic cash registers. However,
budgeted revenue gains should be conservative to avoid putting pressure on deficit outturns.
Authorities’ views
19. The authorities re-affirmed their commitment to gradual fiscal consolidation over the
medium term and to the fiscal framework legislation. They considered the expansionary fiscal
stance this year necessary to support the economic recovery and to lean against downside macro
risks, especially given the moderate level of public debt. Nevertheless, they were determined to
proceed with fiscal consolidation starting next year, in line with their medium-term fiscal objective.
In this regard, their priority would be to increase the effectiveness of tax collections, and they were
optimistic that their efforts—also benefitting from experiences of other countries—would bear fruit.
Finally, they were hopeful that the approval of fiscal framework legislation by Parliament would take
place expeditiously.
B. Achieving the Inflation Target
20. Extreme deflationary risks have declined, and staff projects inflation to gradually rise
toward the central bank’s target in 2016. Although the positive impulse from the exchange rate
floor was counteracted by the slump in energy and other commodity prices, as well as by low core
inflation throughout Europe, Czech core inflation remains stable at around 1 percent. At the same
time, positive dynamics in the real economy and labor markets suggest that a scenario that involves
CZECH REPUBLIC
10 INTERNATIONAL MONETARY FUND
damaging second-round effects of low inflation—such as liquidity hoarding and wage depression—
has become less likely. In fact, retail sales are growing at a healthy pace, and in the key automotive
industry wage agreements have centered on 3–3½ percent wage increases, considerably higher
than last year. Finally, empirical evidence suggests that inflation has been driven by external factors
(accompanying cross-country Selected Issues Paper), while second-round effects have not
contributed measurably to the post-2012 disinflation (Appendix I). Against this backrdrop and based
on current policies remaining in place through 2016:H1 (including the exchange rate floor), inflation
is projected to start rising gradually towards the target in 2016.
21. Staff encouraged the CNB to maintain its focus on inflation targeting in its policy
making and communication, and to consider carefully the timing and mechanics of the
eventual normalization of monetary policy. The policy rate has been at the zero lower bound
since November 2012, and the authorities have committed to maintain the exchange rate floor
through 2016:H1, thus avoiding an open-ended arrangement. The floor has proven effective in
supporting a return to the inflation target, as inflation expectations on current policies are consistent
with achieving the target. With the current level of the exchange rate assessed to be broadly in line
with fundamentals, and no interventions having taken place since the initial few days of the
introduction of the floor, there is little economic reason to expect large moves in the exchange rate
after the exit. Instead, the floor seems to be playing a supportive role both as a clear and credible
signal of the CNB’s commitment to the inflation target and as a type of insurance policy against the
risk of sustained safe-haven inflows in the event of an external shock that would undermine
achievement of the target. The pre-existence of a consistent monetary policy framework and CNB’s
continued transparent communication strategy—appropriately emphasizing the priority of the
inflation objective and the temporary role of the exchange rate floor as an instrument to achieve it—
should facilitate a smooth exit once justified by fundamentals like higher inflation outturns.
22. Monetary policy would likely need to remain supportive. In staff’s view, given the only
gradual closing of the output gap and asymmetric risks at the zero lower bound, monetary policy
would likely need to remain supportive for some time even after abolishment of the exchange rate
floor. Moreover, the CNB has sufficient tools to counter any unintended tightening of monetary
conditions after the exit, including through discretionary interventions. To this end, modestly
negative policy interest rates could be considered, but mainly to discourage capital inflows (amidst
negative interest rates in other currencies). However, too deeply negative policy interest rates could
risk cash hoarding and in turn reduce financial intermediation and weaken monetary transmission,
especially if they were viewed as likely to persist for some time. At the same time, potential
transmission from negative interest rates to activity is likely to be very weak. As for purchases of
domestic assets, the scope for such purchases is very limited, given ample liquidity, already very low
levels of domestic yields, and limited availability of domestic assets.4
4 The local bond market monthly turnover averages about CZK 8–12 billion, or 0.2-0.3 percent of GDP.

CZECH REPUBLIC
INTERNATIONAL MONETARY FUND 11
Authorities’ views
23. The authorities broadly agreed with staff’s inflation outlook, while noting that
monetary policy decisions are becoming more data-dependent. They noted that the real
economy has turned the corner, with domestic demand taking over as the engine of growth and
core inflation trending upwards. Accommodative policies, including the exchange rate floor, have
played a useful role in this regard. However, they noted that wages were growing more moderately
than hoped, perhaps due to: second-round effects from low inflation expectations; greater-than-
believed slack in the job market; and compositional effects that suppress average wage growth.
Coupled with statistical noise from tax-related effects, it was difficult to settle the matter decisively.
The authorities, therefore, leaned towards a wait-and-see attitude and careful observation of
incoming data. They also repeated their commitment to inflation targeting and the floating
exchange rate regime as soon as conditions allow normalization of monetary policy. They saw the
koruna as fairly valued, and together with projected positive inflation differentials with the euro area,
foresaw a smooth exit. The authorities were cautious regarding other unconventional monetary
policies, such as negative policy rates and domestic asset purchases, as they assessed these to be
relatively ineffective and prone to be misinterpreted as negative signals about the economy’s health.
They did not see much scope for euro adoption to be advanced in this government’s term, amidst
domestic unpopularity and ongoing changes in euro area policy frameworks5
C. Safeguarding Financial Stability
24. The financial system is stable and resilient to shocks. Recent stress tests conducted by
the CNB incorporated a scenario of Europe-wide debt deflation coupled with sharp declines in both
domestic and external demand and a rise in long-term yields. These were found to be manageable
with estimated system-wide capital shortfalls of just 0.4 percent of GDP. The relatively low potential
capital need is mainly due to the high initial capitalization, which averages 18 percent across the
system. Moreover, profitability remains strong by advanced country standards, notwithstanding the
low interest rate environment. Among external risk factors, direct exposures to Russia are limited,
and the recent losses of Export bank appear to be linked to problems with risk management and
due diligence rather than economic developments.6
25. Although credit growth remains low, it is expected to be boosted by the strong
recovery underway. Corporate credit demand is reportedly limited due to still-low investment
levels, but also because of corporates’ tendency to utilize internal resources for investment and, to a
lesser extent, other financing sources such as corporate bonds, rather than because of problems
with access to bank credit. Household credit growth has been stable at a slightly higher level, mainly
driven by continued demand for mortgages. At the same time, recent lending surveys point to
easing lending standards and gradually rising demand for credit, which along with the healthy
5 Country Report No. 15/98 discusses pros and cons of euro adoption and pre-requisites for a successful transition.
6 The authorities have already taken measures to change management and strengthen controls.

CZECH REPUBLIC
12 INTERNATIONAL MONETARY FUND
balance sheets in the financial and non-financial sectors and signs of a strong recovery suggest that
credit growth will likely rise going forward—a view shared by the banks.
26. The regulatory and supervisory framework is being improved in the context of local
and global initiatives. The authorities continued to make progress toward implementing the
recommendations of the 2012 FSAP. In addition to the increase in supervisory resources for on-site
inspections, a new law on credit unions brought limits to their size, deposit-interest ratio, borrower
eligibility, and increased contributions to resolution and insurance funds among other provisions
aimed at reducing risks from this small part of the sector. Moreover, the CNB has started
implementing the macroprudential toolkit of the Capital Requirements Regulation IV by requiring
across-the-board “conservation buffers”, supplemented by a “systemic buffer” targeted at the
largest banks. The Bank Recovery and Resolution Directive and Deposit Guarantee Schemes
Directive are expected to be soon transposed into local law and would help introduce new tools and
harmonize resolution frameworks within the EU. The working group on Banking Union opted for
staying out of the Banking Union for now, but decided to re-visit the issue on an annual basis7.
Authorities’ views
27. The authorities broadly shared staff’s assessment. They saw financial sector risks as
mainly relating to domestic economic conditions, which have taken a turn for better in the last year,
and reduced risks of a debt deflation. They noted a nascent recovery in lending activity, amidst
higher demand, positive asset quality trends, tightening interest rate margins, and lower
provisioning. The authorities saw the possibility of countercyclical macroprudential measures, if
credit growth turned out to be much faster than foreseen now. As for external risks, they saw a euro
area wide debt deflation as the main worry, but emphasized that direct linkages between the Czech
financial sector and developments in Greece and Russia were limited.
D. Boosting Potential Growth
28. Raising Czech Republic’s growth prospects remains a key challenge. After averaging
4.5 percent during 2000–07, economic growth fell to 0.9 percent during 2010–14. While this was
mainly due to a slowdown in the euro area, growth performance is unlikely to return to pre-crisis
levels. Potential growth is estimated at 1.4 percent for this year, and, as investment increases, is
projected to increase to 2.2 percent over the medium term—a level insufficient to facilitate fast
convergence towards the income levels of other advanced European economies. This reflects a
number of challenges facing the supply side of the economy. Demographic headwinds are already
evident with the working age population having declined 4.2 percent in the last five years. Moreover,
although important steps have been taken to reduce labor market rigidities, including more flexible
employment arrangements, strengthened public employment services, and affordable high-quality
childcare facilities, labor participation in some segments of the population—women with young
7 Country Report No. 15/98 discusses the potential benefits from joining the Banking Union before euro area
membership.

CZECH REPUBLIC
INTERNATIONAL MONETARY FUND 13
children and low-skilled workers—remains low (Box 4). Finally, skills mismatches and low investment
in research and development (R&D) present headwinds to moving up the value-added chain.
29. Staff thus called for an ambitious reform agenda to remove impediments to faster
potential growth. Addressing low labor participation—and helping achieve the authorities’ goal of
raising overall participation from 70 percent to 75 percent by 2020—calls for targeted policies,
including further progress in providing affordable childcare, and raising the effectiveness and scope
of job search assistance and training services. Emphasis should also be given on upgrading skills and
addressing skill shortages in high technology sectors, including through education and training for
less-advantaged groups, such as improvement of apprenticeship programs and avoiding selectivity
of the education system—these steps should help human capital accumulation and reduce
structural unemployment. Moreover, the business environment could be further enhanced by
simplifying tax compliance and other administrative procedures, and by implementing priorities
identified in the anti-corruption action plan on financial control, management of state-owned
companies, and access to information. Finally, improving transport infrastructure, and strengthening
R&D, would also support faster growth.
Authorities’ views
30. The authorities agreed that further progress with structural reforms is needed to lift
Czech Republic’s potential growth. They broadly shared the mission’s assessment regarding
impediments to stronger growth and pointed to a number of actions envisaged in their National
Reform Program. They were confident that recent measures aimed at raising female labor
participation—namely, extension of the availability of childcare facilities for longer time, tax relief for
private childcare expenditures, and establishment of a government fund to support new public
kindergartens—would bear fruit. They emphasized that improving transport infrastructure was
indeed a key priority and referred to stepped up efforts to increase the utilization of EU funds, and
medium-term plans detailed in their Transport Policy. Additionally, a number of programs are being
implemented to strengthen cooperation between business and research organizations, and support
the development of start-ups. Finally, the authorities pointed to progress in reducing the
administrative burden and reiterated their commitment to push forward with a number of targeted
anti-corruption measures included in the government legislative agenda for 2015.
STAFF APPRAISAL
31. The Czech economy is growing strongly but challenges remain. The economic upturn is
driven by robust exports and improving domestic demand being helped by accommodative
macroeconomic policies. The labor market has been recovering fast with strong employment gains
and real wage growth picking up gradually. But while disinflationary pressures seem to have abated,
inflation is still below the central bank’s target. In addition, potential growth is well below the level
necessary to facilitate fast convergence toward the income levels of other advanced European
countries. Thus, the challenge for the authorities is to create the conditions for sustainable growth
while safeguarding macroeconomic stability.
CZECH REPUBLIC
14 INTERNATIONAL MONETARY FUND
32. Fiscal policy and the medium-term fiscal objective need to be anchored in fiscal
framework legislation, and the composition of the budget should be improved. The remaining
output gap, low inflation, and the fact that monetary policy is at the zero lower bound warrant
maintaining a slightly accommodative fiscal stance this year, as planned by the authorities. At the
same time, though, modest and very gradual fiscal consolidation will be necessary beginning next
year, in line with the authorities’ commitment to a medium-term objective of a 1 percent of GDP
structural deficit. Moreover, this objective should be cast in fiscal framework legislation that would
include expenditure ceilings, a debt brake rule, and a fiscal council—thus helping anchor fiscal policy
and guard against pro-cyclical tendencies. Finally, there is scope to improve budget composition,
with increased capital spending to address infrastructure needs offset by efficiency gains in current
spending and improved revenue administration.
33. The central bank should continue to focus on inflation targeting. The exchange rate
floor has proven effective in fending off deflationary pressures, and in combination with recovering
demand conditions, inflation is expected to rise toward the central bank’s target in the second half
of 2016, thus facilitating an exit from the exchange rate floor. The central bank should thus maintain
its focus on inflation targeting in its policymaking and communication, while continuing to evaluate
the conditions that would trigger a normalization of monetary policy and the mechanics of its
implementation. However, given the only gradual closing of the output gap and asymmetric risks at
the zero lower bound, monetary policy will likely need to remain supportive for some time even
after abolishment of the exchange rate floor and return to a floating exchange rate.
34. Continued vigilance will be needed to sustain the stability of the financial system. The
banking sector is self-financed with low system-wide loan-to-deposit ratio and strong capital and
liquidity buffers, which make it resilient to shocks. Moreover, bank supervision has been
strengthened by increasing supervisory resources, approving a new law on credit unions, and
starting utilizing the macroprudential toolkit of the Capital Requirements Regulation IV.
Nevertheless, proactive supervision remains necessary along with further gradual improvements in
the supervisory architecture, including the transposition of the Bank Recovery and Resolution
Directive into domestic law.
35. An ambitious structural reform agenda is key to lifting Czech Republic’s potential
growth. Sustained progress on wide-ranging reforms to increase labor market participation,
enhance investment in human and physical capital, and improve the business climate is essential for
higher investment and growth. Reforms of the labor market should aim at increasing labor
participation among women with children and low-skilled workers, while greater emphasis should
be placed on mitigating skills mismatches. Priority should also be given to promoting research and
innovation, enhancing apprenticeship programs, simplifying tax compliance and other
administrative procedures, and improving infrastructure.
36. It is recommended that the next Article IV consultation with the Czech Republic be
held on the standard 12-month cycle.

CZECH REPUBLIC
INTERNATIONAL MONETARY FUND 15
Czech Republic—Risk Assessment Matrix1/
Source of Risks Relative Likelihood Impact if Realized Policy Response
Glo
bal
Protracted period
of slower growth in
advanced and
emerging
economies
High/Medium
In the euro area, weak demand
and persistently low inflation
from a failure to fully address
crisis legacies and appropriately
calibrate macro policies leads to
“new mediocre” rate of growth.
In emerging markets, maturing
of the cycle, misallocation of
investment, and incomplete
structural reforms leading to
prolonged slower growth
Medium
Coupled with a fragile recovery
in domestic demand, weaker
export growth would delay the
recovery from the crisis.
Policies supporting domestic
demand, as well as diversifying
trade partners and specialization
could help cushion the impact on
the economy.
Political
fragmentation
erodes the
globalization
process and fosters
inefficiency:
Russia/Ukraine
Medium
The mounting conflict depresses
business confidence and
heightens risk aversion, amid
disturbances in global financial,
trade and commodity markets
Medium
Disruption of gas supply and
increase in gas prices would
adversely affect production.
Russia and Ukraine are not
main markets for Czech
exports, but supply chain
effects can trigger a slowdown.
An easing bias would be
appropriate provided supply
constraints do not become
binding.
Surges in global
financial market
volatility
High
Investors reassess underlying
risk and move to safe-haven
assets given slow and uneven
growth as well as asymmetric
monetary exit, with poor market
liquidity amplifying the impact
on volatility
Low
Czech sovereign and banks are
not reliant on external
borrowing to any significant
extent.
Maintaining accommodative
monetary conditions, while
loosening the fiscal stance would
allow to absorb the shocks
through the trade channel.
Bond market stress
from reassessment
in sovereign risk in
euro area
Medium
Euro area sovereign stress re-
emerges due to policy
uncertainty, faltering reforms,
and political and social
upheaval, particularly in Greece.
High
Through strong trade and
financial ties with Europe, could
lead to a significant economic
slowdown. Banks, while sound,
may turn conservative and limit
credit provision. Households
and firms can postpone
spending as experienced in
2011–12.
Maintaining accommodative
monetary conditions, while
loosening the fiscal stance would
allow shock absorption through
the trade channel. Closer
monitoring of Czech subsidiaries
of euro area parent banks would
be necessary to avoid financial
spillovers, such as excessive
transfer of liquidity and capital
out of the country.
Do
mest
ic
Permanently lower
potential growth
Medium
If the recovery falters, hysteresis
effects could reduce potential
growth, structural reforms
needed to boost potential
growth could be delayed due to
lack of political appetite.
Medium
Potential growth may remain
low for extended periods, and
may even lead to long-term
output losses
Advancing structural reforms and
safeguarding public investment
would help mitigate risks of
further reductions in potential
growth.
1/ The Risk Assessment Matrix (RAM) shows events that could materially alter the baseline path (the scenario most likely to materialize
in the view of IMF staff). The relative likelihood of risks listed is the staff’s subjective assessment of the risks surrounding the baseline
("low" is meant to indicate a probability below 10 percent, "medium" a probability between 10 and 30 percent, and "high" a
probability of 30 percent or more). The RAM reflects staff views on the source of risks at the time of discussions with the authorities.
CZECH REPUBLIC
16 INTERNATIONAL MONETARY FUND
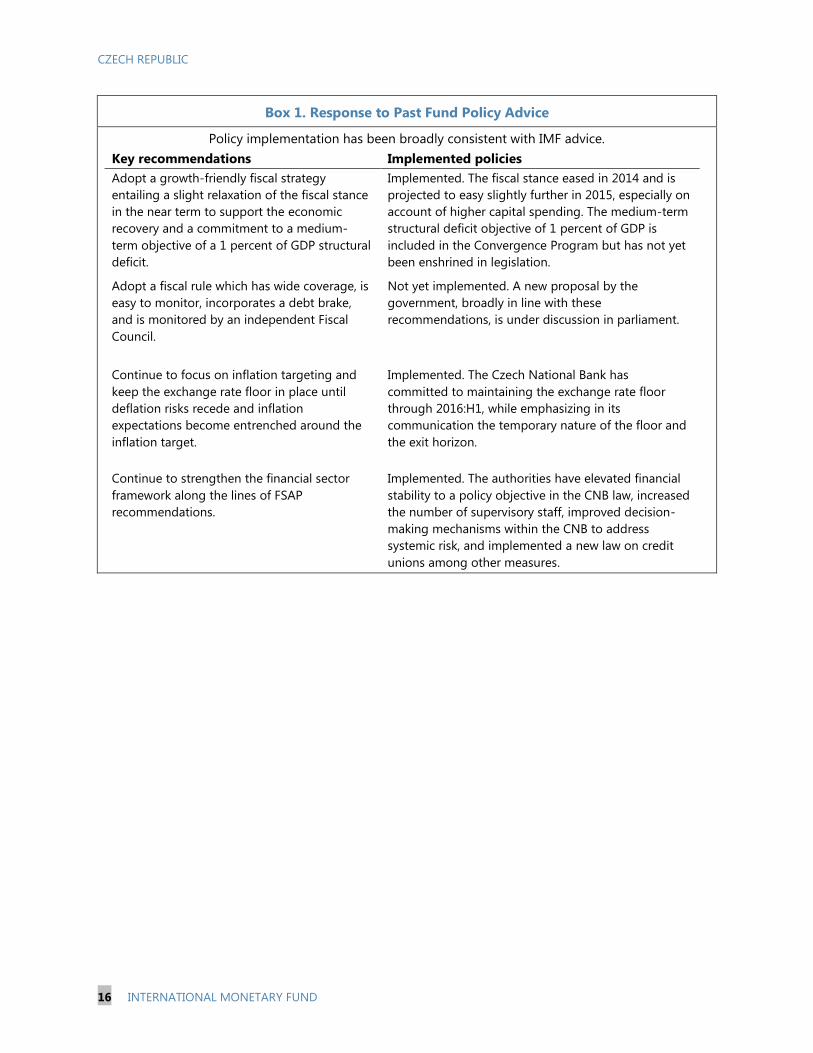
Box 1. Response to Past Fund Policy Advice
Policy implementation has been broadly consistent with IMF advice.
Key recommendations Implemented policies
Adopt a growth-friendly fiscal strategy
entailing a slight relaxation of the fiscal stance
in the near term to support the economic
recovery and a commitment to a medium-
term objective of a 1 percent of GDP structural
deficit.
Implemented. The fiscal stance eased in 2014 and is
projected to easy slightly further in 2015, especially on
account of higher capital spending. The medium-term
structural deficit objective of 1 percent of GDP is
included in the Convergence Program but has not yet
been enshrined in legislation.
Adopt a fiscal rule which has wide coverage, is
easy to monitor, incorporates a debt brake,
and is monitored by an independent Fiscal
Council.
Not yet implemented. A new proposal by the
government, broadly in line with these
recommendations, is under discussion in parliament.
Continue to focus on inflation targeting and
keep the exchange rate floor in place until
deflation risks recede and inflation
expectations become entrenched around the
inflation target.
Implemented. The Czech National Bank has
committed to maintaining the exchange rate floor
through 2016:H1, while emphasizing in its
communication the temporary nature of the floor and
the exit horizon.
Continue to strengthen the financial sector
framework along the lines of FSAP
recommendations.
Implemented. The authorities have elevated financial
stability to a policy objective in the CNB law, increased
the number of supervisory staff, improved decision-
making mechanisms within the CNB to address
systemic risk, and implemented a new law on credit
unions among other measures.

CZECH REPUBLIC
INTERNATIONAL MONETARY FUND 17
Box 2. Competitiveness Assessment
The koruna depreciated moderately in recent years, but
remains stronger than historical averages. Following a
long appreciation trend, the post-2011 depreciation was
mainly driven by nominal exchange rates, as markets re-
evaluated Czech growth prospects in the context of the
euro area turmoil. Since the FX interventions, the currency
has been stable, while in both real and nominal terms it
remains above historical averages. However, the historical
sample is dominated by a period of rapid convergence and
equilibrium appreciation driven by productivity gains.
ULC-based measures suggest that the underlying
competitive position has been more stable and is currently
broadly in line with historical norms.
Current account and international investment positions
reveal no major competitiveness issues. Reflecting the
high FDI stock, Czech Republic traditionally had a large
income deficit that outweighs the trade surplus. The trade
balance has trended higher since 2012, as domestic
demand trailed external demand, and it is likely to stabilize
in the near-term excluding terms-of-trade effects. The
accumulated deficits had led to a moderate negative NIIP
of about 36 percent of GDP. Excluding the net FDI stock of
58 percent at end-2014, the NIIP is comfortably positive.
Market share has also been relatively stable.
The EBA assessment yields mixed results. Specifically,
the Current Account Balance approach suggests that the
current account balance is stronger than the norm of
1 percent of GDP deficit, indicating a marginal
undervaluation of 3 percent in 2014. Benchmarked against
the 1.9 percent deficit that would stabilize the net foreign
asset position, the 2014 outturn suggests an
undervaluation of 5.4 percent. In contrast, the multilateral
REER approach finds a 10.4 percent overvaluation, as the
real exchange rate remains above what would be predicted
on the basis of selected fundamental determinants. Using
latest REER data and the projected 2015 current account
balance does not change the results.
Reserves remain at a comfortable level. While there have been no further interventions, CNB continues to
accumulate reserves due to EU funds and other fiscal
inflows. Capital flows have been on the whole subdued
with evidence of some external build-up of assets by
households and corporates in the last few quarters.
Reactions to events such as the Swiss peg exit and the ECB
QE announcement, both in January 2015, have been limited
to the exchange rate and the financial account.
80
90
100
110
120
130
140
150
160
Real Exchange Rate
(2001Q1=100)
NEER
REER (CPI-based)
REER (ULC manufacturing-based)
Sources: Czech Statistical Office; Czech National Bank; and IMF staff estimates.
-50
-45
-40
-35
-30
-25
-20
-15
-10
-5
0
-6
-4
-2
0
2
4
6
8
20
00
Q4
20
01
Q4
20
02
Q4
20
03
Q4
20
04
Q4
20
05
Q4
20
06
Q4
20
07
Q4
20
08
Q4
20
09
Q4
20
10
Q4
20
11
Q4
20
12
Q4
20
13
Q4
20
14
Q4
Current Account and International Investment Position
Current account (percent of GDP, LHS)
Trade balance (percent of GDP, LHS)
NIIP (percent of GDP, RHS)
Sources: Czech Statistical Office; Czech National Bank; and IMF staff estimates.
50
70
90
110
130
150
170
190
210
230
250
Share of World Imports
(Percent of total imports, 2000=100)
Czech Republic
Hungary
Poland
Slovak Republic
Source: Direction of Trade Statistics.
0%
20%
40%
60%
80%
100%
120%
140%
160%
2006 2007 2008 2009 2010 2011 2012 2013 2014 2015
Reserves as Percent of Metric
Suggested Adequacy Range
Sources: Czech Statistical Office; Czech National Bank; and IMF staff estimates.

CZECH REPUBLIC
18 INTERNATIONAL MONETARY FUND
Box 3. Efficiency of Public Spending
Total government spending in the Czech Republic is not high in comparison with other advanced
economies; however, there is scope for
improving its composition. Government
spending at 42 percent of GDP is still lower than
the advanced economy average of 45 percent.
Interest spending is particularly low due to low
debt and interest rate levels; while the public
wage bill is also lower than in most advanced
economies. Capital spending is somewhat high
compared to advanced economies but lower
than in Poland and the Slovak Republic. On the
other hand, spending on social benefits,
equivalent to 20 percent of GDP, exceeds the
advanced economies’ average by
2½ percentage points.
Compressed capital spending in recent years
has resulted in stagnant public capital stock.
Although the capital stock in advanced
economies has been declining for many years,
yet the current gap with the Czech Republic is
even larger than it was in 2000. Within the
medium-term envelope of a 1 percent of GDP
structural deficit, improvements in efficiency of
social spending can help create space for higher
capital spending.
Health outcomes (measured by life expectancy) are below those of countries with similar level of
public health spending. Efficiency frontier analysis for public health spending indicates a potential for
savings in the range of 2-4 percent of GDP. Input efficiency score based on life expectancy as an output
indicator and real public health spending as input is estimated at 0.32, which is significantly lower than a
score of 1 for an “efficient/frontier” country and suggests that 68 percent of public resources could be saved
to achieve the same outcome. If infant mortality is used as an output indicator, the efficiency score measure
is higher, at 0.7, suggesting savings of 30 percent. Several factors might have contributed to the relatively
low health sector efficiency. Those include a high number of doctor consultations and hospital discharges, a
high share of pharmaceutical expenditure in total spending, and a relatively low share of general physicians.
AUSAUT
BEL
CAN
CHL
CZE
DNK
EST
FIN
FRA
DEU
GRC
HUN
ISL
IRE
ISR
ITA
JPN
KORLUX
MEX
NZL NOR
POL
PRT
SVK
SVN
ESPSWE
CHE
TUR
GBR
USA
70
72
74
76
78
80
82
84
0 1000 2000 3000 4000 5000
Public Expenditure on Health and Life Expectancy
(Average 2007-12)
Life
Exp
ect
an
cy (Years
)
Real Public Health Expenditure Per Capita ($US PPP)
Sources: OECD and IMF staff calculations.
AUS
AUT
BEL
CAN
CHL
CZE
DNK
ESTFIN
FRA
DEU
GRC
HUN
ISL
IRE
ISR
ITA
JPNKOR
LUX
MEX
NZL
NOR
POLPRT
SVK
SVN
ESP
SWE
CHETUR
GBR
USA
0.0
0.2
0.4
0.6
0.8
1.0
1.2
0 1000 2000 3000 4000 5000
Efficiency of Public Expenditure on Health
(Average 2007-12)
Eff
icie
ncy
Sco
res:
Lif
e E
xpect
an
cy
Real Public Health Expenditure Per Capita ($US PPP)
0
10
20
30
40
50
60
USA
AU
S
CZ
E
IRL
SV
K
ISR
PO
L
NO
R
ESP
DEU
NLD
GR
C
HU
N
PR
T
SW
E
ITA
BEL
SV
N
FRA
Other Capital spending Interest Wages Social benefits expenditure
Composition of Government Spending, 2013
(percent of GDP)
Source: WEO.
30
35
40
45
50
55
60
1995
1996
1997
1998
1999
2000
2001
2002
2003
2004
2005
2006
2007
2008
2009
2010
2011
2012
2013
2014
Public Capital Stock
(percent of GDP)
Czech Republic Advanced economies
Sources: Center for International Comparisons (2013); Organisation for
Economic Co-operation and Development; and IMF staff estimates.

CZECH REPUBLIC
INTERNATIONAL MONETARY FUND 19
Box 3. Efficiency of Public Spending (continued)
Increasing health spending efficiency would entail policies aimed at containing both cost pressures
and excess demand for health services. Specifically, there could be room to trim excess bed capacity,
reduce pharmaceutical costs, and introduce means-tested co-payments to contain growing pressure on the
public healthcare system. Introducing soft-gate keeping (e.g.,
requirement of referral from the general physician) would help
manage demand. Moreover, substantial scope exists in
providers’ network streamlining, and increased transparency of
service delivery contracts.
The education system appears to be efficient in delivering
strong average scores on international standardized tests.
However, there could be medium-term challenges in supplying
appropriately skilled workers for the shifting labor market.
Reforms should thus aim at seeking greater cost recovery in
areas where public spending provides significant private
benefits. For example, there could be room to increase out-of-
pocket tuition fees. Additionally, it is important to ensure that
the supply of secondary education in some regions meets the
growing demand for pre-university educational streams, to
avoid a mismatch in the supply and demand for skilled labor.
Sources: OECD Education Database and Author's
calculations.
1/ Spending data is up to 2011, while the PISA
scores refer to 2012.
AUS
AUTBEL
CHL
CZE
DNK
FINFRA
DEU
HUN
ISL
IRE
ISR
ITA
JPN
KOR
LUX
MEX
NZL
NOR
POL
PRT
SVK
SPN
SWE CHE
GBR
USA
0.0
0.2
0.4
0.6
0.8
1.0
1.2
0 5000 10000 15000 20000
Efficiency of Public Expenditure on Education
(Average 2007-2011) 1/
Annual Spending per Student on Primary and
Secondary Education (US$ PPP)
Eff
icie
ncy
Sco
res

CZECH REPUBLIC
20 INTERNATIONAL MONETARY FUND
Box 3. Efficiency of Public Spending (continued)
Czech Republic and OECD Countries: Health Care Spending and Outcomes
Source: OECD Health Statistics Database and OECD National Accounts Database.
1/ Use 2011 value instead.
2/ Use 2010 value instead.
3/ Use 2009 value instead.
0
1
2
3
4
5
6
7
8
9
10
Denm
ark
France
Germ
any
Jap
an
Aust
ria
New
Zeala
nd
1/
Belg
ium
United
Sta
tes
No
rway
United
Kin
gd
om
Sw
ed
en
Canad
aSw
itze
rland
Icela
nd
Italy
Sp
ain
1/
Finla
nd
Slo
venia
Po
rtug
al 1
/O
EC
DC
zech
Rep
ub
licG
reece
Aust
ralia
1/
Irela
nd
Luxe
mb
ourg
Slo
vak R
ep
ub
licH
ung
ary
Po
land
Est
onia
Isra
el
Ko
rea
Turk
ey
Chile
Mexi
co
Public Expenditure on Health
(In percent of GDP, 2012)
55
60
65
70
75
80
85
Mexi
coTurk
ey
Hung
ary
Slo
vak R
ep
ub
licEst
onia
Po
land
Cze
ch R
ep
ub
licU
nited
Sta
tes
Chile
Denm
ark
OEC
DSlo
venia
Belg
ium
Po
rtug
al
Finla
nd
Gre
ece
Aust
ria
Germ
any
Irela
nd
United
Kin
gd
om
Neth
erl
and
sK
ore
aC
anad
aLu
xem
bo
urg
New
Zeala
nd
No
rway
Isra
el
Sw
ed
en
Aust
ralia
France
Italy
Sp
ain
Sw
itze
rland
Icela
nd
Jap
an
Life Expectancy
(Years, total population at birth,2012)
0
2
4
6
8
10
12
14
16
18
Slo
vak R
ep
ub
lic
Gre
ece
Jap
an
1/
Czech
Rep
ub
lic
Irela
nd
Hu
ng
ary
Sp
ain
1/
Fra
nce
Ko
rea
Est
on
iaG
erm
an
yP
ort
ug
al 1
/Slo
ven
iaB
elg
ium
OEC
DA
ust
ria
Fin
lan
dA
ust
ralia 1
/N
eth
erl
an
ds
1/
Lu
xem
bo
urg
Italy
Po
lan
dSw
ed
en
Sw
itze
rlan
dC
an
ad
a 1
/N
ew
Zeala
nd
1/
Icela
nd
Un
ited
Sta
tes
No
rway
Den
mark
Ch
ile
Pharmaceutical Spending
(In percent of total health expenditure, 2012)
0
5,000
10,000
15,000
20,000
25,000
30,000
Mexi
coC
anad
a 1
/C
hile
1/
Sp
ain
Po
rtug
al 3
/N
eth
erl
and
sU
nited
Sta
tes
2/
Italy
Irela
nd
Icela
nd
3/
United
Kin
gd
om
1/
New
Zeala
nd
Luxe
mb
ourg
OEC
DTurk
ey
Po
land
Sw
ed
en 2
/Is
rael
Sw
itze
rland
France
Belg
ium
1/
Slo
venia
Denm
ark
2/
Aust
ralia
1/
Est
onia
No
rway
2/
Finla
nd
Slo
vak R
ep
ub
licC
zech
Rep
ub
licH
ung
ary
Germ
any
Aust
ria
Hospital Discharges, 2012
(Discharge rates by diagnostic categories, per 100,000 population)
0
2
4
6
8
10
12
14
16
Finla
nd
Mexi
co
Chile
1/
New
Zeala
nd
United
Sta
tes
2/
No
rway
Po
rtug
al
Denm
ark
United
Kin
gd
om
Icela
nd
Neth
erl
and
s
Slo
venia
Est
onia
Luxe
mb
ourg
France
Aust
ria
Aust
ralia
OEC
D
Po
land
Belg
ium
1/
Canad
a 1
/
Turk
ey
Germ
any
Cze
ch R
ep
ub
lic
Slo
vak R
ep
ub
lic
Hung
ary
Jap
an
2012 2007
Doctor Consultation
(Number per capita)
0
2
4
6
8
10
12
14
16
Icela
nd
Slo
venia
Jap
an
Finla
nd
Luxe
mb
ourg
No
rway
Cze
ch R
ep
ub
licSw
ed
en
Gre
ece
Italy
Ko
rea
Sp
ain
Aust
ria
Aust
ralia
Germ
any
Denm
ark
Po
rtug
al
France
Irela
nd
Est
onia
Isra
el
Sw
itze
rland
Neth
erl
and
sBelg
ium
OEC
DU
nited
Kin
gd
om
Po
land
Canad
aH
ung
ary
New
Zeala
nd
Slo
vak R
ep
ub
licU
nited
Sta
tes
Turk
ey
Chile
Mexi
co
2012 2007
Infant Mortality Rate
(Deaths per 1,000 live births)
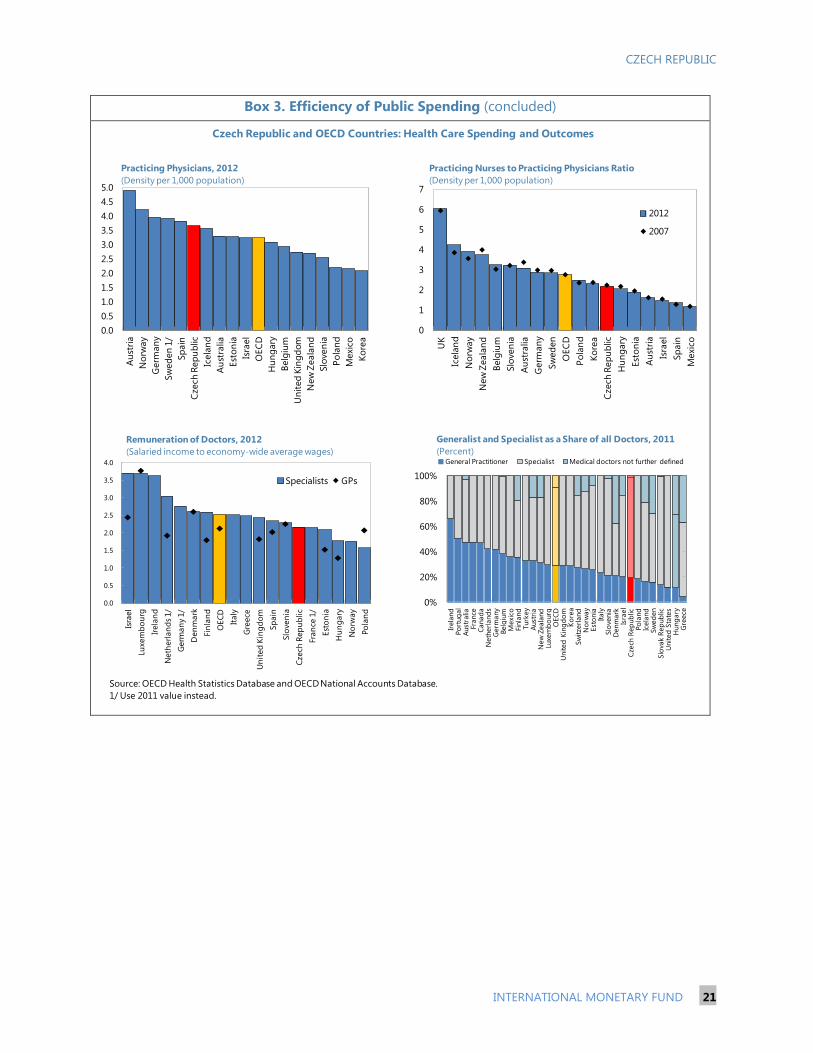
CZECH REPUBLIC
INTERNATIONAL MONETARY FUND 21
Box 3. Efficiency of Public Spending (concluded)
Czech Republic and OECD Countries: Health Care Spending and Outcomes
0%
20%
40%
60%
80%
100%
Gre
ece
Hung
ary
United
Sta
tes
Slo
vak R
ep
ub
licSw
ed
en
Icela
nd
Po
land
Cze
ch R
ep
ub
licIs
rael
Denm
ark
Slo
venia
Italy
Est
onia
No
rway
Sw
itze
rland
Ko
rea
United
Kin
gd
om
OEC
DLu
xem
bo
urg
New
Zeala
nd
Aust
ria
Turk
ey
Finla
nd
Mexi
coBelg
ium
Germ
any
Neth
erl
and
sC
anad
aFr
ance
Aust
ralia
Po
rtug
al
Irela
nd
General Practitioner Specialist Medical doctors not further defined
Generalist and Specialist as a Share of all Doctors, 2011
(Percent)
0.0
0.5
1.0
1.5
2.0
2.5
3.0
3.5
4.0
Isra
el
Luxe
mb
ou
rg
Irela
nd
Neth
erl
an
ds
1/
Germ
an
y 1/
Den
mark
Fin
lan
d
OEC
D
Italy
Gre
ece
Un
ited
Kin
gd
om
Sp
ain
Slo
ven
ia
Cze
ch R
ep
ub
lic
Fran
ce 1
/
Est
on
ia
Hu
ng
ary
No
rway
Po
lan
d
Specialists GPs
Remuneration of Doctors, 2012
(Salaried income to economy-wide average wages)
0.0
0.5
1.0
1.5
2.0
2.5
3.0
3.5
4.0
4.5
5.0
Ko
rea
Mexi
co
Po
lan
d
Slo
ven
ia
New
Zeala
nd
Un
ited
Kin
gd
om
Belg
ium
Hu
ng
ary
OEC
D
Isra
el
Est
on
ia
Au
stra
lia
Icela
nd
Czech
Rep
ub
lic
Sp
ain
Sw
ed
en
1/
Germ
an
y
No
rway
Au
stri
a
Practicing Physicians, 2012
(Density per 1,000 population)
0
1
2
3
4
5
6
7
Mexic
o
Sp
ain
Isra
el
Au
stri
a
Est
on
ia
Hu
ng
ary
Cze
ch R
ep
ub
lic
Ko
rea
Po
lan
d
OEC
D
Sw
ed
en
Germ
an
y
Au
stra
lia
Slo
ven
ia
Belg
ium
New
Zeala
nd
No
rway
Icela
nd
UK
2012
2007
Practicing Nurses to Practicing Physicians Ratio
(Density per 1,000 population)
Source: OECD Health Statistics Database and OECDNational Accounts Database.
1/ Use 2011 value instead.

CZECH REPUBLIC
22 INTERNATIONAL MONETARY FUND
Box 4. Gender Gaps in the Labor Market
Female labor market participation (FLMP) in the
Czech Republic is low. It is below the OECD average,
and also lags rates in peer countries in the region. In
particular, employment of mothers with children under
3 (at about 20 percent in 2008) is the second lowest in
the OECD.
Increasing FLMP could help shore up long-term
growth. Like many other advanced economies,
population ageing and low fertility rates are
compressing Czech Republic’s active labor force. On
current trends, the labor force will shrink by around
10 percent by 2030. Increasing low FLMP could help
offset these adverse trends and boost long-term
growth. The OECD estimates that full convergence in
participation rates by 2030 can increase Czech annual
per capita growth rates by 0.8 percent, on average.
A number of factors affect FLMP. The lack of flexible
work options and shortage of affordable child care are
the key factors limiting the labor participation of
women with children (see: Female Labor Force
Participation, European Commission, 2014); the latter is
most acute for children under three and Czech
Republic has the lowest share of formal childcare for children of that age group.
There seems to be scope for policies to increase female labor participation, especially for lower
education groups. The overall female labor force participation rate (FLFPR) increased by 4.6 percentage
points during 2008–14, to 65.6 percent in 2014. This was largely driven by the increase in the participation
rates of women with secondary education, as well as the decline in the share of women with primary
education only, which have the lowest participation ratio of 27 percent. Moreover, a much larger share of
working-age women now hold tertiary degrees (20 percent vs. 12 percent in 2008), and are exhibiting an
already high level of 78 percent participation. At the
same time, participation rates of women with primary
education have declined even further. These trends
suggest that policies—such as the provision of
affordable childcare—aimed at lower education
groups could be effective in raising overall female
labor participation. The authorities have taken a
number of measures to increase availability of
childcare, including tax relief for private child care
expenditures by companies and individuals and an
establishment of a government fund to support new
public kindergartens.
0
10
20
30
40
50
60
70
80
90
100
HU
N
PO
L
ITA
SV
K
GR
C
ESP
JPN
CZ
E
DEU
LUX
IRL
BEL
FR
A
OEC
D 1
/
GB
R
AU
S
NZ
L
AU
T
USA
PR
T
ND
L
CH
E
CA
N
FIN
DN
K
SW
E
ISL
0-16 <3 3-5 6-16
1/ Average of 26 countries.
Source: OECD.
Maternal Employment Rates by Age of Youngest Child
(Percent)
4,500
4,700
4,900
5,100
5,300
5,500
Constant Convergence in rates Convergence in intencity
The Effect of Converging Participation Rates Between Men and
Women on the Size of the Labour Force
('000s)
Source: OECD.
-6
-4
-2
0
2
4
6
8
10
Less than primary,
primary and lower
secondary education
(levels 0-2)
Upper secondary and
post-secondary
non-tertiary education
(levels 3 and 4)
Tertiary education
(levels 5-8)
Participation
Demographics
Change in FLFPR between 2008 and 2014 by Education Level
Sources: Eurostat and IMF staff calculations.

CZECH REPUBLIC
INTERNATIONAL MONETARY FUND 23
Box 4. Gender Gaps in the Labor Market (continued)
Czech Republic: Selected Indicators Affecting Female Labor Force Participation
0
5
10
15
20
25
30
35
40
45
BG
RC
ZE
HR
VLV
AH
UN
PO
LSV
KD
NK
PR
TEST
CYP
SV
NLT
UR
OU
FIN
GR
CIT
AD
EU
AU
TFR
AM
LT IRL
ESP
BEL
SW
ELU
XG
BR
ND
L
EU28
FFormal Childcare under the Age of 3, 2013 1/
(Percent over population)
AUT
BEL
CAN
CZE
DNK
EST
FIN
FRADEU
GRC
HUN
ITAJPN
LUXNLD
NZL
POL
PRT
SVK
SVNESP
SWE
CHE
TUR
GBR
USA
0
20
40
60
80
100
120
140
160
180
200
10 20 30 40 50 60 70 80
Leave
du
rati
on
(in
weeks
)
Employment rates of mothers with child under age 3
Employment Rates for Mothers with Children below Age 3
and Leave Duration
0
10
20
30
40
50
60
70
RU
SSV
KIN
DH
UN
CZ
ESV
NEST
PO
LZ
AF
PR
TG
RC
KO
RFI
NU
SA
SW
EIS
RFR
AESP
CH
LTU
RIS
LD
NK
BR
AC
AN
LU
XM
EX
NO
RB
EL
ITA
AU
TN
ZL
IRL
JPN
DEU
AU
SG
BR
CH
EN
DL
OECD average
Share of Women in Part-Time Employment, 2013 2/
(Percent)
0
20
40
60
80
100
120
140N
DL
SW
E
DN
K
CH
E
FIN
NO
R
AU
T
DEU
TU
R
BEL
GB
R
LUX
GR
C
ITA
CZ
E
SV
N
PO
L
FRA
IRL
EST
SV
K
HU
N
ESP
PR
T
Entirely set by the employee
Can adapt working hours within certain limits
Can choose between several fixed working schedule
Entirely set by the company
Proportion of Employees Having Working Time Set, 2009
(Percent)
Sources: Eurostat SILC 2013, and OECD.
1/ 2012 data for Lithuania
2/ Brazil, India, Russia and South Africa are not OECD members. 2012 data for Russia.

CZECH REPUBLIC
24 INTERNATIONAL MONETARY FUND
Box 4. Gender Gaps in the Labor Market (concluded)
Czech Republic: Gender Gaps
Sources: European Comission, Eurostat, and OECD.
0
10
20
30
40
50
60
70
KO
RC
AN
JPN
NO
RIR
LD
NK
NZ
LA
US
ISR
*FIN
BEL
SW
EFR
ALU
XG
BR
USA
EST
ESP
ND
LP
OL
ISL
SV
NC
HE
CH
LG
RC
HU
NP
OR
DEU
SV
KA
UT
CZ
EM
EX
TU
RIT
A
Men Women
OECD (men) OECD (women)
Proportion of the Population with Tertiary Education, 2009
(24-35 years old)
440
460
480
500
520
Boys Girls Boys Girls Boys Girls
Reading Mathematics Science
Czech Republic OECD average
Student Performance by Gender, 2012
(Mean score PISA)
0
10
20
30
40
50
60
70
80
90
SW
ED
NK
ND
LFI
ND
EU
GBR
EST
LVA
AU
TLT
UPO
RESP
CYP
FRA
SV
NC
ZE
BG
RLU
XIR
LSV
NBEL
PO
LH
UN
GR
CR
OU
HR
VIT
AM
LT
EU28
Female Labour Force Participation Rate, 2013
(Percent)
0
5
10
15
20
25
30
35
EST
AU
TC
ZE
DEU
SV
KG
BR
EST
FIN
HU
ND
NK
ND
LC
YP
FRA
SW
ELV
ABG
RLT
UPO
RBEL
RO
ULU
XH
RV
ITA
PO
LM
LTSV
N
EU28
Gender Pay Gap
(Unadjusted, percent)
0
5
10
15
20
25
30
35
FRA
LVA
FIN
SW
EN
DL
BEL
SV
NH
RV
BG
RSV
KA
UT
LTU
ESP
PO
LH
UN
LUX
DN
KD
EU
ITA
GBR
IRL
RO
UC
YP
GR
CPR
TEST
CZE
MLT
EU28
Proportion of Women in Political and Economic
Decision-Making: Board Members of Largest Publicly
Listed Companies, 2013
(Percent)
0
10
20
30
40
50
60
FIN
SW
EFR
AEST
DEU
ND
LSV
NESP
AU
TBG
RD
NK
PO
LLU
XIT
AG
BR
BEL
IRL
LTU
RO
UH
RV
CZE
PR
TLV
AM
LTC
YP
GR
CSV
KH
UN
EU28
Proportion of Women in Political and Economic
Decision-Making: Cabinet, 2013
(Percent)

CZECH REPUBLIC
INTERNATIONAL MONETARY FUND 25
Figure 1. Czech Republic: Macroeconomic Developments
Sources: Haver; Eurostat; EMED; and IMF staff calculations.
...with consumption supported by strong labor
income gains
...but total hours worked are lagging behind due to
wider use of part-time work
Domestic demand is driving the recovery...
Unemployment fell below 6 percent for the first time
since 2009...
...and confidence indicators are at post-crisis highs.
-8
-6
-4
-2
0
2
4
6
2009Q
1
2009Q
3
2010Q
1
2010Q
3
2011Q
1
2011Q
3
2012Q
1
2012Q
3
2013Q
1
2013Q
3
2014Q
1
2014Q
3
2015Q
1
Contributions to growth
(y-o-y percent)
Public consumption
Private consumption
Investment
Net exports
Real GDP
-40
-30
-20
-10
0
10
20Ja
n-0
9
Jul-
09
Jan-1
0
Jul-
10
Jan-1
1
Jul-
11
Jan-1
2
Jul-
12
Jan-1
3
Jul-
13
Jan-1
4
Jul-
14
Jan-1
5
Confidence Indicators
(y-o-y percent)
Consumer Confidence
Business Indicator-25
-20
-15
-10
-5
0
5
10
15
Jan-0
9
Jul-
09
Jan-1
0
Jul-
10
Jan-1
1
Jul-
11
Jan-1
2
Jul-
12
Jan-1
3
Jul-
13
Jan-1
4
Jul-
14
Jan-1
5
Retail Trade and Industrial Production
(y-o-y percent )
Retail trade
Industrial production
0
1
2
3
4
5
6
7
8
9
-4
-3
-2
-1
0
1
2
3
2007Q
1
2007Q
3
2008Q
1
2008Q
3
2009Q
1
2009Q
3
2010Q
1
2010Q
3
2011Q
1
2011Q
3
2012Q
1
2012Q
3
2013Q
1
2013Q
3
2014Q
1
2014Q
3
Employment and Unemployment Rate
(y-o-y percent change)
Employment (LHS)
Unemployment Rate, ILO-definition (RHS)
Retail sales and production are growing briskly...
-4
-3
-2
-1
0
1
2
3
4
5
2009Q
1
2009Q
3
2010Q
1
2010Q
3
2011Q
1
2011Q
3
2012Q
1
2012Q
3
2013Q
1
2013Q
3
2014Q
1
2014Q
3
2015Q
1
Private consumption and real wages
(y-o-y percent)
Private consumption
Real wages
85
90
95
100
105
110
115
120
2007Q
1
2007Q
3
2008Q
1
2008Q
3
2009Q
1
2009Q
3
2010Q
1
2010Q
3
2011Q
1
2011Q
3
2012Q
1
2012Q
3
2013Q
1
2013Q
3
2014Q
1
2014Q
3
Hours worked in industry excl. construction
Hours Worked
(Index, 2010=100)

CZECH REPUBLIC
26 INTERNATIONAL MONETARY FUND
Figure 2. Czech Republic: Inflation
...driven by cost factors primarily from energy
and, to a lesser extent, food prices
Sources: Czech Statistical Office, Czech National Bank, and Haver Analytics.
-1
0
1
2
3
4
5
6
-1
0
1
2
3
4
5
6
Jan-0
9
Jul-
09
Jan-1
0
Jul-
10
Jan-1
1
Jul-
11
Jan-1
2
Jul-
12
Jan-1
3
Jul-
13
Jan-1
4
Jul-
14
Jan-1
5
HICP Inflation
(y-o-y percent change)
EU 27 HICP Inflation
Czech Republic HICP Inflation
-30
-20
-10
0
10
20
30
-6
-4
-2
0
2
4
6
Jan-0
9
Jul-
09
Jan-1
0
Jul-
10
Jan-1
1
Jul-
11
Jan-1
2
Jul-
12
Jan-1
3
Jul-
13
Jan-1
4
Jul-
14
Jan-1
5
Prices
(y-o-y percent change)
Core inflation
Food prices
Fuel prices (RHS)
-15
-10
-5
0
5
10
15Ja
n-0
9
Jul-
09
Jan-1
0
Jul-
10
Jan
-11
Jul-
11
Jan
-12
Jul-
12
Jan-1
3
Jul-
13
Jan-1
4
Jul-
14
Jan
-15
Import price and exchange rate
(y-o-y percent change)
EUR/CZK Import price
0.0
0.5
1.0
1.5
2.0
2.5
3.0
3.5
Jan-0
9
Jul-
09
Jan-1
0
Jul-
10
Jan-1
1
Jul-
11
Jan-1
2
Jul-
12
Jan-1
3
Jul-
13
Jan-1
4
Jul-
14
Jan-1
5
Inflation expectations
(y-o-y percent change)
Inflation expectations (12 months ahead)
Inflation expectations (36 months ahead)
Inflation target
Inflation has continued to track Europe-wide inflation
trends...
The oil price shock has also delayed effects
through administered energy prices.
Short-term inflation expectations dipped again-but
not medium-term expectations.
The boost from the exchange rate floor faded away
against this background.
Jan
-09
Jul-
09
Jan
-10
Jul-
10
Jan
-11
Jul-
11
Jan
-12
Jul-
12
Jan
-13
Jul-
13
Jan
-14
Jul-
14
Jan
-15
-70
-50
-30
-10
10
30
50
70
-5
-3
-1
1
3
5
7
9
11
13
15
Prices
(y-o-y percent change)
Administered prices (RHS)
Brent oil in Koruna
-4
-3
-2
-1
0
1
2
3
4
5
2009Q
1
2009Q
3
2010Q
1
2010Q
3
2011Q
1
2011Q
3
2012Q
1
2012Q
3
2013Q
1
2013Q
3
2014Q
1
2014Q
3
2015Q
1
Nominal wages
(y-o-y percent change)
Nominal wage growth is picking up.

CZECH REPUBLIC
INTERNATIONAL MONETARY FUND 27
Figure 3. Czech Republic: Financial Markets
Sources: Bloomberg; Dealogic; Haver; BIS; and Global Insight.
The koruna has followed regional trends but in a much
tighter range.
Longer bond yields have reached new lows, as
the yield curve flattened.
Equities have underperformed most regional and global
markets...
Markets deem Czech Republic a good credit... ...while expecting low policy rates to be sustained.
...while real estate prices continue their mild recovery.
90
95
100
105
110
115
120
2011 2012 2013 2014 2015
Spot Exchange Rate
(Index, 2010 = 100)
CZK/Euro
HUN/Euro
PLN/Euro
-0.5
0.0
0.5
1.0
1.5
2.0
2.5
3.0
3.5
4.0
4.5
5.0
2011 2012 2013 2014 2015
Government Bond Yields
(Percent)
10-year
5-year
2-year
0.0
0.5
1.0
1.5
2.0
2.5
3.0
3.5
2011 2012 2013 2014 2015
Money Market Rates
(Percent)
PRIBOR 3M
FRA 6x9
FRA 12x15
Policy rate
50
70
90
110
130
150
170
190
210
2011 2012 2013 2014 2015
Stock Markets
(2010=100)
Germany
USA
Czech Rep.
Hungary
Poland
60
70
80
90
100
110
120
2004Q
1
2005Q
1
2006Q
1
2007Q
1
2008Q
1
2009Q
1
2010Q
1
2011Q
1
2012Q
1
2013Q
1
2014Q
1
2015Q
1
Apartment Price Index
(2010=100)
0
50
100
150
200
250
300
350
400
2011 2012 2013 2014 2015
5-year CDS
(Basis Points)
Czech Republic
Poland
Slovak Republic
Germany
France

CZECH REPUBLIC
28 INTERNATIONAL MONETARY FUND
Figure 4. Czech Republic: Bank Lending
Sources: Haver; CNB; and IMF staff calculations.
-10
-5
0
5
10
15
20
25
30
35
40
Jan-08 Jan-09 Jan-10 Jan-11 Jan-12 Jan-13 Jan-14 Jan-15
Credit Growth by Selected Categories
(Percent)
Non-Financial Corporations
Households
...but credit growth remains weak...
0
2
4
6
8
10
12
14
16
18
2008Q1 2009Q1 2010Q1 2011Q1 2012Q1 2013Q1 2014Q1
Financial Soundness Indicators
(Percent)
Capital to RWA
NPL to Total Loans
-6
-4
-2
0
2
4
6
8
10
12
14
16
Deposit Growth by Selected Categories
(Percent)
Non-Financial Corporations
Households
70
72
74
76
78
80
82
84
86
88
Household and Non-Financial Corporrations
Loan-to-Deposit Ratio
(Percent)
...underpinning record low loan-to-deposit ratios.
Banks are financially sound...
...and is outpaced by deposit growth...
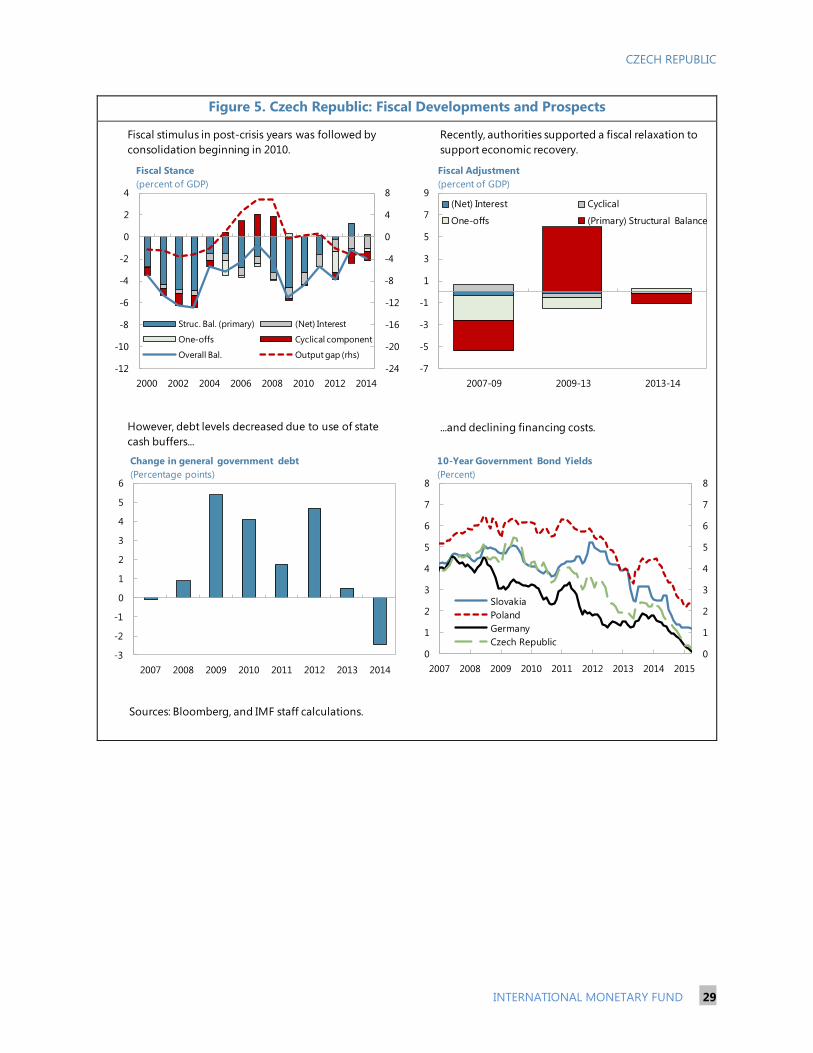
CZECH REPUBLIC
INTERNATIONAL MONETARY FUND 29
Figure 5. Czech Republic: Fiscal Developments and Prospects
Sources: Bloomberg, and IMF staff calculations.
-24
-20
-16
-12
-8
-4
0
4
8
-12
-10
-8
-6
-4
-2
0
2
4
2000 2002 2004 2006 2008 2010 2012 2014
Struc. Bal. (primary) (Net) Interest
One-offs Cyclical component
Overall Bal. Output gap (rhs)
Fiscal Stance
(percent of GDP)
-7
-5
-3
-1
1
3
5
7
9
2007-09 2009-13 2013-14
(Net) Interest Cyclical
One-offs (Primary) Structural Balance
Fiscal Adjustment
(percent of GDP)
-3
-2
-1
0
1
2
3
4
5
6
2007 2008 2009 2010 2011 2012 2013 2014
Change in general government debt
(Percentage points)
0
1
2
3
4
5
6
7
8
0
1
2
3
4
5
6
7
8
2007 2008 2009 2010 2011 2012 2013 2014 2015
Slovakia
Poland
Germany
Czech Republic
10-Year Government Bond Yields
(Percent)
Fiscal stimulus in post-crisis years was followed by
consolidation beginning in 2010.
Recently, authorities supported a fiscal relaxation to
support economic recovery.
However, debt levels decreased due to use of state
cash buffers...
...and declining financing costs.

CZECH REPUBLIC
30 INTERNATIONAL MONETARY FUND
Figure 6. Czech Republic: Competitiveness Indicators
BIH
BGR
HRV
CZE
EST
HUN
KAZ
LVA
LTUMKD
MNE
POL
ROM
RUSSRB
SVK
UKR
0
250
500
750
1000
1250
0
250
500
750
1000
1250
0 5 10 15 20
Wages are in line with income per capita,...
Avera
ge m
onth
ly g
ross w
ag
e (
Euro
s)
Nominal GDP per capita (Thousands of USD)
GDP Per Capita and Wages, 2014
Sources: Czech Republic authorities; Haver; OECD; World Bank, Doing Business Indicators; IMF, IFS; DxTime; IMF, World
Economic Outlook; and IMF staff estimates and calculations.
1/ Covers the period June, 2014. Rank out of 189 countries.
2/ Rank for 2014–15. Ranking out of 144 countries.
0 50 100 150
Bosnia
Serbia
Albania
Croatia
Hungary
Slovenia
Romania
NMS Avg.
Czech Rep.
Bulgaria
Slovak Rep.
Montenegro
Poland
Macedonia
Lithuania
Latvia
EstoniaDoing Business Ranking 1/
0 50 100 150
Albania
Serbia
Croatia
Slovak Rep.
Slovenia
Montenegro
Macedonia
Hungary
Romania
NMS Avg.
Bulgaria
Poland
Latvia
Lithuania
Czech Rep.
Estonia
Global Competitiveness Ranking 2/
0 50 100 150
Resolving Insolvency
Getting Credit
Registering Property
Enforcing Contracts
Trading Across Borders
Protecting Minority …
Starting a Business
Paying Taxes
Getting Electricity
Dealing with Constr. Permits
World Bank: Doing Business Report
2015
2014
0 20 40 60
Higher education and training
Business sophistication
Technological readiness
Health and primary education
Innovation
Macroeconomic environment
Infrastructure
Market size
Financial market development
Goods market efficiency
Global Competitiveness Rankings
2014
BIH
BGR
HRV
CZE
EST
HUN
KAZ
LVA
LTU
MKD
MNE
POL
ROM
RUS
SRB
SVK
UKR
0
250
500
750
1000
1250
0
250
500
750
1000
1250
0 10 20 30 40 50
...and relative to productivity.
Avera
ge m
onth
ly g
ross w
ag
e (
Euro
s)
Labor Productivity (Euro area = 100)
Labor Productivity and Wages, 2014

CZECH REPUBLIC
INTERNATIONAL MONETARY FUND 31
Table 1. Czech Republic: Selected Economic Indicators, 2010–20
2010 2011 2012 2013 2014 2015 2016 2017 2018 2019 2020
Nominal GDP (USD billions) 207.0 227.3 206.8 208.8 205.6 181.1 188.9 195.7 200.4 202.9 206.2
Population (millions) 10.5 10.5 10.5 10.5 10.5 10.5 10.5 10.6 10.6 10.6 10.6
GDP per capita (USD) 19,787 21,676 19,680 19,855 19,562 17,205 17,917 18,545 18,966 19,193 19,496
Real economy (change in percent, unless stated otherwise)
Real GDP 2.3 2.0 -0.8 -0.7 2.0 3.0 2.8 2.6 2.2 2.2 2.2
Real GDP per capita 1.9 1.7 -1.0 -0.8 2.0 2.8 2.6 2.5 2.1 2.1 2.1
Domestic demand 1.8 0.0 -2.2 -0.8 2.2 3.8 3.3 2.9 2.6 2.6 2.6
Private consumption 1.0 0.2 -1.8 0.4 1.7 3.0 2.8 2.4 2.3 2.3 2.3
Investment 4.4 1.9 -3.7 -5.1 3.1 6.5 5.0 4.5 3.7 3.7 3.7
Exports 14.8 9.3 4.1 0.3 8.8 7.2 6.2 5.0 4.0 4.0 4.0
Imports 14.9 6.7 2.4 0.3 9.5 8.5 7.0 5.5 4.6 4.6 4.6
Ouput gap (percent of potential output) -0.2 0.2 -1.9 -3.6 -2.8 -1.2 0.0 0.5 0.4 0.2 0.0
CPI (average) 1.5 1.9 3.3 1.4 0.4 0.2 1.3 2.0 2.0 2.0 2.0
Unemployment rate (in percent) 7.3 6.7 7.0 7.0 6.1 5.4 5.0 4.7 4.8 5.0 5.0
Gross national savings (percent of GDP) 23.5 24.9 24.8 24.5 25.7 27.4 27.2 27.1 27.1 27.1 27.2
Gross domestic investments (percent of GDP) 27.2 27.0 26.3 25.0 25.1 25.9 26.2 26.5 26.8 27.2 27.5
Public finance (percent of GDP)
General government revenue 38.6 39.7 39.9 40.8 40.1 40.2 39.2 39.4 39.6 39.6 39.7
General government expenditure 43.0 42.4 43.8 41.9 42.0 42.3 40.5 40.5 40.5 40.5 40.6
Net lending / Overall balance -4.4 -2.7 -3.9 -1.2 -2.0 -2.0 -1.3 -1.0 -0.9 -0.9 -1.0
Structural balance (percent of potential GDP) -4.3 -2.7 -1.4 0.1 -0.9 -1.5 -1.4 -1.3 -1.1 -1.0 -1.0
General government debt 38.2 39.9 44.6 45.0 42.6 41.0 40.5 39.9 39.3 38.9 38.5
Money and credit (end of year, percent change)
Broad money (M3) 1.9 2.8 4.8 5.8 4.4 … … … … … …
Private sector credit 3.0 5.5 2.6 3.7 3.1 … … … … … …
Interest rates (in percent, year average)
Three-month interbank rate 1.3 1.2 1.0 0.5 0.4 … … … … … …
Ten-year government bond 3.9 3.7 2.8 2.1 1.6 … … … … … …
Balance of payments (percent of GDP)
Trade balance (goods and services) 3.0 3.9 5.0 5.8 6.9 7.9 7.5 6.9 6.6 6.3 6.0
Current account balance -3.7 -2.1 -1.6 -0.5 0.6 1.5 1.0 0.5 0.2 -0.1 -0.4
Gross international reserves (US$ billion) 42.5 40.3 44.9 56.2 54.5 51.7 53.7 56.6 59.6 62.5 65.9
(in months of imports of goods and services) 3.9 3.2 3.6 4.6 4.1 4.3 4.1 4.0 4.1 4.1 4.2
Exchange rate
Nominal effective exchange rate (index, 2005=100) 119.2 123.2 118.4 116.9 111.7 … … … … … …
Real effective exchange rate (index, CPI-based; 2005=100) 120.1 122.3 118.2 116.2 110.0 … … … … … …
Sources: Czech Statistical Office; Czech National Bank; Ministry of Finance; Haver Analytics, and IMF staff estimates and projections.
Staff Proj.

CZECH REPUBLIC
32 INTERNATIONAL MONETARY FUND
Table 2. Czech Republic: Balance of Payments, 2010–20
2010 2011 2012 2013 2014 2015 2016 2017 2018 2019 2020
Current account balance -3.7 -2.1 -1.6 -0.5 0.6 1.5 1.0 0.5 0.2 -0.1 -0.4
Trade balance 1.0 1.9 3.1 4.1 5.6 6.5 6.1 5.6 5.3 5.0 4.7
Exports 55.8 60.0 65.0 65.1 71.4 74.7 78.0 80.0 81.4 82.9 84.4
Imports 54.8 58.2 62.0 61.0 65.8 68.2 71.9 74.4 76.2 77.9 79.6
Nonfactor services 2.0 2.0 1.9 1.7 1.3 1.4 1.4 1.4 1.3 1.3 1.3
Receipts 10.7 10.9 11.8 11.4 12.3 12.5 12.7 12.9 13.1 13.3 13.6
Payments 8.7 8.8 9.8 9.7 10.9 11.1 11.3 11.5 11.8 12.0 12.3
Factor income (net) -6.4 -5.5 -5.9 -6.0 -6.1 -6.2 -6.2 -6.2 -6.1 -6.1 -6.1
Transfers -0.3 -0.4 -0.7 -0.3 -0.2 -0.2 -0.2 -0.2 -0.2 -0.2 -0.3
Capital account 1.0 0.3 1.3 2.0 0.8 0.7 0.7 0.7 0.8 0.8 0.8
Financial account -3.2 -1.9 0.3 1.7 1.1 2.2 1.8 1.2 1.0 0.7 0.4
Direct investment, net -2.4 -1.1 -3.0 0.2 -3.1 -1.1 -1.1 -1.1 -1.2 -1.3 -1.4
Portfolio investment, net -3.8 -0.1 -1.4 -2.2 2.1 1.7 1.6 1.5 1.1 0.5 0.3
Other investment and financial derivatives, net 1.9 -0.2 2.9 -0.5 0.6 0.7 0.4 -0.3 0.0 0.3 0.3
Errors and omissions -0.5 -0.1 0.6 0.2 -0.2 0.0 0.0 0.0 0.0 0.0 0.0
Change in reserves 1.1 -0.4 2.0 4.4 1.7 0.9 0.9 1.2 1.1 1.1 1.1
Memorandum items:
Gross official reserves (US$ billions) 42.5 40.3 44.9 56.2 54.5 51.7 53.7 56.6 59.6 62.5 65.9
in months of the current year's imports 3.9 3.2 3.6 4.6 4.1 4.3 4.1 4.0 4.1 4.1 4.2
as a ratio to the short-term debt 91.0 76.7 94.4 103.2 92.4 99.3 102.2 105.1 108.6 112.8 117.3
External debt, percent of GDP 55.4 54.9 60.2 63.4 66.6 63.4 61.3 60.7 60.5 60.5 60.3
Sources: Czech Statistical Office; Czech National Bank; and IMF staff estimates and projections.
Staff Projections
(percent of GDP)

CZECH REPUBLIC
INTERNATIONAL MONETARY FUND 33
Table 3. Czech Republic: The Statement of Operations of General Government, 2010–20 1/
(in billions of koruny)
2010 2011 2012 2013 2014 2015 2016 2017 2018 2019 2020
Revenue 1,524.3 1,598.1 1,613.9 1,665.7 1,709.3 1,795.9 1,829.3 1,924.8 2,013.9 2,100.7 2,191.7
Taxes 702.8 755.5 776.3 812.3 823.8 859.0 906.6 949.2 992.3 1,030.7 1,071.1
Personal income tax 131.3 142.7 144.1 150.6 156.7 158.4 164.4 172.0 179.2 186.8 194.7
Corporate Income tax 127.4 129.0 127.5 132.6 147.1 153.9 163.0 170.4 177.5 185.0 192.9
VAT 263.5 276.5 286.1 303.8 319.5 325.5 343.8 359.9 376.9 393.1 410.1
Excise 148.0 170.7 175.7 183.1 158.2 173.2 181.5 186.9 192.5 196.8 201.4
Other taxes 32.7 36.5 42.9 42.2 42.3 48.0 53.8 60.0 66.2 69.0 71.9
Social contributions 577.8 592.3 600.0 606.4 628.3 653.5 684.3 721.5 751.8 783.6 816.9
Grants 85.7 84.3 71.6 76.8 89.2 113.0 68.6 76.7 85.0 93.6 102.5
Other revenue 158.0 166.0 166.0 170.2 168.1 170.3 169.8 177.3 184.9 192.8 201.1
Property income 36.9 34.7 35.0 37.5 36.5 43.3 37.5 39.1 40.7 42.4 44.2
Sales of goods and services 116.9 127.2 126.6 127.7 129.0 124.4 129.6 135.3 141.1 147.2 153.6
Other revenue 4.3 4.1 4.3 5.0 2.5 2.7 2.8 2.9 3.0 3.2 3.3
Expenditure 1,698.7 1,707.2 1,771.8 1,712.9 1,793.6 1,886.8 1,890.0 1,974.8 2,057.7 2,149.4 2,245.3
Expense 1,511.5 1,540.6 1,615.5 1,571.9 1,628.0 1,671.0 1,722.4 1,794.0 1,863.4 1,940.8 2,021.8
Compensation of employees 285.8 280.2 286.7 294.0 304.2 316.7 327.7 340.9 354.5 368.7 383.4
Use of goods and services 226.7 218.9 197.8 207.2 210.7 214.9 218.1 223.6 229.1 234.9 240.7
Interest 52.6 53.0 57.8 55.0 56.3 51.9 52.7 54.3 56.9 58.3 60.0
Subsidies 79.0 99.3 99.7 109.4 116.3 113.7 118.9 124.3 129.5 135.0 140.8
Grants 32.9 36.8 34.8 22.4 19.3 20.2 21.1 22.1 23.0 24.0 25.0
Social benefits 739.8 754.5 766.2 778.8 804.5 839.0 863.9 903.4 939.6 983.6 1,029.8
Other expenses 94.7 97.9 172.5 105.0 116.7 114.7 120.0 125.5 130.7 136.3 142.1
Net acquisition of nonfinancial assets 187.2 166.6 156.2 141.0 165.6 215.7 167.6 180.8 194.4 208.6 223.5
Gross Operating Balance 12.8 57.5 -1.7 93.8 81.3 124.9 106.9 130.8 150.6 159.9 169.8
Net lending/borrowing (overall balance) -174.4 -109.1 -157.9 -47.2 -84.3 -90.9 -60.7 -50.0 -43.8 -48.7 -53.6
Net financial transactions -180.7 -108.9 -157.9 -47.2 -84.6 -90.9 -60.7 -50.0 -43.8 -48.7 -53.6
Net acquisition of financial assets -22.6 24.2 65.5 -20.7 -104.2 -77.3 0.0 0.0 0.0 0.0 0.0
Net incurrence of liabilities 158.1 128.7 223.3 21.4 -21.8 13.6 60.7 50.0 43.8 48.7 53.6
Adjustment and statistical discrepancies 1/ 0.0 -4.4 -0.1 -5.2 -2.2 0.0 0.0 0.0 0.0 0.0 0.0
Memorandum item:
General government debt 1,508.5 1,604.0 1,803.6 1,839.7 1,816.1 1,828.9 1,891.6 1,947.5 1,999.5 2,059.9 2,125.7
Primary balance -121.8 -56.1 -100.1 7.8 -27.9 -39.0 -8.0 4.2 13.0 9.6 6.4
Structural balance 2/ -172.0 -107.0 -56.1 5.3 -37.7 -66.7 -64.3 -61.1 -53.3 -51.9 -54.3
Cyclically adjusted primary balance -129.8 -67.9 -86.3 46.2 1.0 -31.2 -17.8 -13.6 -3.6 -4.9 -6.0
Change in cyclically adjusted primary balance 40.1 61.9 -18.4 132.6 -45.2 -32.2 13.3 4.3 10.0 -1.3 -1.1
Sources: Ministry of Finance and IMF staff estimates and projections.
1/ Adjustments for cash-accrual differences, valuation changes and other discrepancies.
2/ In percent of potential GDP.
Staff Projections

CZECH REPUBLIC
34 INTERNATIONAL MONETARY FUND
Table 4. Czech Republic: The Statement of Operations of General Government, 2010–20 1/
(in percent of GDP)
2010 2011 2012 2013 2014 2015 2016 2017 2018 2019 2020
Revenue 38.6 39.7 39.9 40.8 40.1 40.2 39.2 39.4 39.6 39.6 39.7
Taxes 17.8 18.8 19.2 19.9 19.3 19.3 19.4 19.4 19.5 19.4 19.4
Personal income tax 3.3 3.5 3.6 3.7 3.7 3.5 3.5 3.5 3.5 3.5 3.5
Corporate Income tax 3.2 3.2 3.1 3.2 3.4 3.4 3.5 3.5 3.5 3.5 3.5
VAT 6.7 6.9 7.1 7.4 7.5 7.3 7.4 7.4 7.4 7.4 7.4
Excise 3.7 4.2 4.3 4.5 3.7 3.9 3.9 3.8 3.8 3.7 3.6
Other taxes 0.8 0.9 1.1 1.0 1.0 1.1 1.2 1.2 1.3 1.3 1.3
Social contributions 14.6 14.7 14.8 14.8 14.7 14.6 14.7 14.8 14.8 14.8 14.8
Grants 2.2 2.1 1.8 1.9 2.1 2.5 1.5 1.6 1.7 1.8 1.9
Other revenue 4.0 4.1 4.1 4.2 3.9 3.8 3.6 3.6 3.6 3.6 3.6
Property income 0.9 0.9 0.9 0.9 0.9 1.0 0.8 0.8 0.8 0.8 0.8
Sales of goods and services 3.0 3.2 3.1 3.1 3.0 2.8 2.8 2.8 2.8 2.8 2.8
Other revenue 0.1 0.1 0.1 0.1 0.1 0.1 0.1 0.1 0.1 0.1 0.1
Expenditure 43.0 42.4 43.8 41.9 42.0 42.3 40.5 40.5 40.5 40.5 40.6
Expense 38.2 38.3 39.9 38.5 38.2 37.4 36.9 36.8 36.6 36.6 36.6
Compensation of employees 7.2 7.0 7.1 7.2 7.1 7.1 7.0 7.0 7.0 7.0 6.9
Use of goods and services 5.7 5.4 4.9 5.1 4.9 4.8 4.7 4.6 4.5 4.4 4.4
Interest 1.3 1.3 1.4 1.3 1.3 1.2 1.1 1.1 1.1 1.1 1.1
Subsidies 2.0 2.5 2.5 2.7 2.7 2.5 2.5 2.5 2.5 2.5 2.5
Grants 0.8 0.9 0.9 0.5 0.5 0.5 0.5 0.5 0.5 0.5 0.5
Social benefits 18.7 18.8 18.9 19.1 18.9 18.8 18.5 18.5 18.5 18.6 18.6
Other expenses 2.4 2.4 4.3 2.6 2.7 2.6 2.6 2.6 2.6 2.6 2.6
Net acquisition of nonfinancial assets 4.7 4.1 3.9 3.5 3.9 4.8 3.6 3.7 3.8 3.9 4.0
Gross Operating Balance 0.3 1.4 0.0 2.3 1.9 2.8 2.3 2.7 3.0 3.0 3.1
Net lending/borrowing (overall balance) -4.4 -2.7 -3.9 -1.2 -2.0 -2.0 -1.3 -1.0 -0.9 -0.9 -1.0
Net financial transactions -4.6 -2.7 -3.9 -1.2 -2.0 -2.0 -1.3 -1.0 -0.9 -0.9 -1.0
Net acquisition of financial assets -0.6 0.6 1.6 -0.5 -2.4 -1.7 0.0 0.0 0.0 0.0 0.0
Net incurrence of liabilities 4.0 3.2 5.5 0.5 -0.5 0.3 1.3 1.0 0.9 0.9 1.0
Adjustment and statistical discrepancies 1/ 0.0 -0.1 0.0 -0.1 -0.1 0.0 0.0 0.0 0.0 0.0 0.0
Memorandum item:
General government debt 38.2 39.9 44.6 45.0 42.6 41.0 40.5 39.9 39.3 38.9 38.5
Primary balance -3.1 -1.4 -2.5 0.2 -0.7 -0.9 -0.2 0.1 0.3 0.2 0.1
Structural balance 2/ -4.3 -2.7 -1.4 0.1 -0.9 -1.5 -1.4 -1.3 -1.1 -1.0 -1.0
Cyclically adjusted primary balance -3.3 -1.7 -2.1 1.1 0.0 -0.7 -0.4 -0.3 -0.1 -0.1 -0.1
Change in cyclically adjusted primary balance 1.0 1.6 -0.4 3.3 -1.1 -0.7 0.3 0.1 0.2 0.0 0.0
Output gap -0.2 0.2 -1.9 -3.6 -2.8 -1.2 0.0 0.5 0.4 0.2 0.0
Nominal GDP (billions of Koruny) 3,954 4,022 4,048 4,086 4,266 4,463 4,667 4,881 5,086 5,301 5,527
Sources: Ministry of Finance and IMF staff estimates and projections.
1/ Adjustments for cash-accrual differences, valuation changes and other discrepancies.
2/ In percent of potential GDP.
Staff Projections

CZECH REPUBLIC
INTERNATIONAL MONETARY FUND 35
Table 5. Czech Republic: Medium-Term Macroeconomic Scenario, 2010–20
2010 2011 2012 2013 2014 2015 2016 2017 2018 2019 2020
Real sector
Real GDP 2.3 2.0 -0.8 -0.7 2.0 3.0 2.8 2.6 2.2 2.2 2.2
Private consumption 1.0 0.2 -1.8 0.4 1.7 3.0 2.8 2.4 2.3 2.3 2.3
Public consumption 0.4 -2.9 -1.0 2.3 2.3 2.0 2.0 1.9 1.9 1.9 1.9
Investment 4.4 1.9 -3.7 -5.1 3.1 6.5 5.0 4.5 3.7 3.7 3.7
Fixed investment 1.3 1.1 -2.9 -4.4 4.5 6.5 5.0 4.5 3.7 3.7 3.7
Exports, goods and services 14.8 9.3 4.1 0.3 8.8 7.2 6.2 5.0 4.0 4.0 4.0
Imports, goods and services 14.9 6.7 2.4 0.3 9.5 8.5 7.0 5.5 4.6 4.6 4.6
contribution of net exports (percent) 0.4 1.9 1.3 0.0 0.0 -0.5 -0.3 -0.2 -0.3 -0.3 -0.4
Inflation (CPI, percent) 1.5 1.9 3.3 1.4 0.4 0.2 1.3 2.0 2.0 2.0 2.0
Unemployment (percent of labor force) 7.3 6.7 7.0 7.0 6.1 5.4 5.0 4.7 4.8 5.0 5.0
Output gap 1/ -0.2 0.2 -1.9 -3.6 -2.8 -1.2 0.0 0.5 0.4 0.2 0.0
Gross domestic savings (in percent of GDP) 23.5 24.9 24.8 24.5 25.7 27.4 27.2 27.1 27.1 27.1 27.2
Public 10.3 11.7 12.5 13.0 12.4 13.0 13.2 13.5 13.6 13.6 13.7
Private 13.2 13.2 12.3 11.5 13.4 14.5 14.0 13.6 13.5 13.5 13.5
Gross capital formation (in percent of GDP) 27.2 27.0 26.3 25.0 25.1 25.9 26.2 26.6 26.9 27.2 27.5
Public finances
Revenues 38.6 39.7 39.9 40.8 40.1 40.2 39.2 39.4 39.6 39.6 39.7
Expenditures 43.0 42.4 43.8 41.9 42.0 42.3 40.5 40.5 40.5 40.6 40.6
Net lending -4.4 -2.7 -3.9 -1.2 -2.0 -2.0 -1.3 -1.0 -0.9 -0.9 -1.0
Structural balance 1/ -4.3 -2.7 -1.4 0.1 -0.9 -1.5 -1.4 -1.3 -1.1 -1.0 -1.0
General government debt 38.2 39.9 44.6 45.0 42.6 41.0 40.5 39.9 39.3 38.9 38.5
Balance of payments
Current account balance -3.7 -2.1 -1.6 -0.5 0.6 1.5 1.0 0.5 0.2 -0.1 -0.4
Trade balance 1.0 1.9 3.1 4.1 5.6 6.5 6.1 5.6 5.3 5.0 4.7
Services balance 2.0 2.0 1.9 1.7 1.3 1.4 1.4 1.4 1.3 1.3 1.3
Net factor income -6.4 -5.5 -5.9 -6.0 -6.1 -6.2 -6.2 -6.2 -6.1 -6.1 -6.1
Current transfers -0.3 -0.4 -0.7 -0.3 -0.2 -0.2 -0.2 -0.2 -0.2 -0.2 -0.3
Capital account balance 1.0 0.3 1.3 2.0 0.8 0.7 0.7 0.7 0.8 0.8 0.8
Financial account balance -2.2 -1.6 1.6 3.7 1.9 3.0 2.5 2.0 1.7 1.5 1.2
Direct investment, net -2.4 -1.1 -3.0 0.2 -3.1 -1.1 -1.1 -1.1 -1.2 -1.3 -1.4
Portfolio investment, net -3.8 -0.1 -1.4 -2.2 2.1 1.7 1.6 1.5 1.1 0.5 0.3
Other investment & derivatives, net 1.9 -0.2 2.9 -0.5 0.6 0.7 0.4 -0.3 0.0 0.3 0.3
Errors and omissions, net -0.5 -0.1 0.6 0.2 -0.2 0.0 0.0 0.0 0.0 0.0 0.0
Change in reserves (- increase) 1.1 -0.4 2.0 4.4 1.7 0.9 0.9 1.2 1.1 1.1 1.1
Sources: Czech Statistical Office, Czech National Bank, Ministry of Finance, and IMF staff estimates and projections.
1/ In percent of potential GDP.
(in percent of GDP)
(in percent of GDP)
(percent change, unless stated otherwise)
Staff projections

CZECH REPUBLIC
36 INTERNATIONAL MONETARY FUND
Table 6. Czech Republic: Financial Soundness Indicators
(in percent unless indicated otherwise)
2009 2010 2011 2012 2013 2014
Capital
Regulatory capital to risk-weighted assets 14.0 15.3 15.0 15.6 16.5 17.0
Regulatory Tier 1 capital to risk-weighted assets 12.6 13.9 13.9 15.2 16.2 16.5
Capital to assets 6.1 6.5 6.5 6.9 7.2 7.3
Profitability
Return on assets 1.4 1.3 1.2 1.4 1.2 1.2
Return on equity 26.4 19.7 18.3 20.4 16.2 16.5
Interest margin to gross income 55.8 63.1 64.5 60.7 59.9 61.8
Noninterest expenses to gross income 42.0 46.8 47.2 46.9 46.8 47.2
Trading income to total income 9.5 4.6 4.1 8.9 8.7 6.3
Personnel expenses to noninterest expenses 40.5 39.7 41.0 41.2 41.4 40.1
Liquidity
Liquid assets to total assets 27.1 29.4 29.9 32.6 33.8 30.5
Liquid assets to short-term liabilities 70.0 71.1 72.2 71.4 67.4 64.9
Customer deposits to total (noninterbank) loans 128.2 129.6 126.0 133.1 128.3 123.2
Foreign-currency-denominated loans to total loans 1/ 21.2 21.6 22.2 20.9 29.1 28.9
Foreign-currency-denominated liabilities to total liabilities 1/ 14.2 14.3 15.0 14.1 21.5 23.3
Sensitivity to market risk
Net open position in foreign exchange to capital 0.5 0.4 -3.2 5.1 1.2 1.2
Gross asset position in financial derivatives to capital 54.0 43.2 57.5 46.5 29.5 37.5
Gross liability position in financial derivatives to capital 50.9 41.2 53.5 40.5 29.7 34.3
Net open position in equities to capital 1/ 8.3 8.1 9.3 7.8 6.2 6.6
Memo item
Nonperforming loans to total gross loans 4.6 5.4 5.2 5.2 5.2 5.6
Source: Czech National Bank
1/ 2014Q2 value is used instead.

CZECH REPUBLIC
INTERNATIONAL MONETARY FUND 37
Table 7. Czech Republic: Monetary Indicators, 2007–14
(billions of koruny)
2007 2008 2009 2010 2011 2012 2013 2014
Monetary Aggregates
M2 2478 2641 2753 2845 2994 3129 3279 3430
M1 1439 1545 1662 1911 2042 2213 2380 2654
Quasi Money 1040 1096 1091 934 953 917 898 776
Net Domestic Assets 1508 1666 1750 1830 2001 1982 1964 2111
Net Domestic Credit to the Government Sector 72 23 166 225 335 316 319 469
Domestic Credits to the Rest of the Economy 1628 1890 1905 1962 2070 2124 2202 2282
Net Foreign Assets 970 975 1003 1015 993 1148 1315 1319
Central Bank Accounts
Currency in Circulation 324 366 354 358 378 389 405 432
Net Foreign Assets 633 720 770 799 805 860 1121 1198
Credit
Private Sector 1451 1700 1723 1809 1923 1968 2048 2103
Corporations 743 848 782 780 828 835 867 875
Households 708 851 940 1028 1095 1132 1181 1228
Foreign Currency 128 157 147 146 160 152 194 202
Corporations 127 156 146 144 159 151 193 200
Households 1 1 1 1 2 2 2 2
Deposits
Private Sector 1904 2031 2162 2274 2384 2486 2589 2762
Corporations 614 591 611 633 673 716 777 838
Households 1290 1440 1551 1642 1711 1770 1812 1923
Foreign Currency 187 191 185 183 188 205 221 266
Corporations 128 125 118 121 128 145 160 192
Households 58 66 67 62 60 60 62 75
Interest Rates (percent)
Discount Rate 2.5 1.3 0.3 0.3 0.3 0.1 0.1 0.1
Lombard Rate 4.5 3.3 2.0 1.8 1.8 0.3 0.3 0.3
Repo Rate - 2 Weeks 3.5 2.3 1.0 0.8 0.8 0.1 0.1 0.1
PRIBOR - 1 Week 3.6 2.8 1.3 0.8 0.8 0.3 0.2 0.2
Source: Czech National Bank.
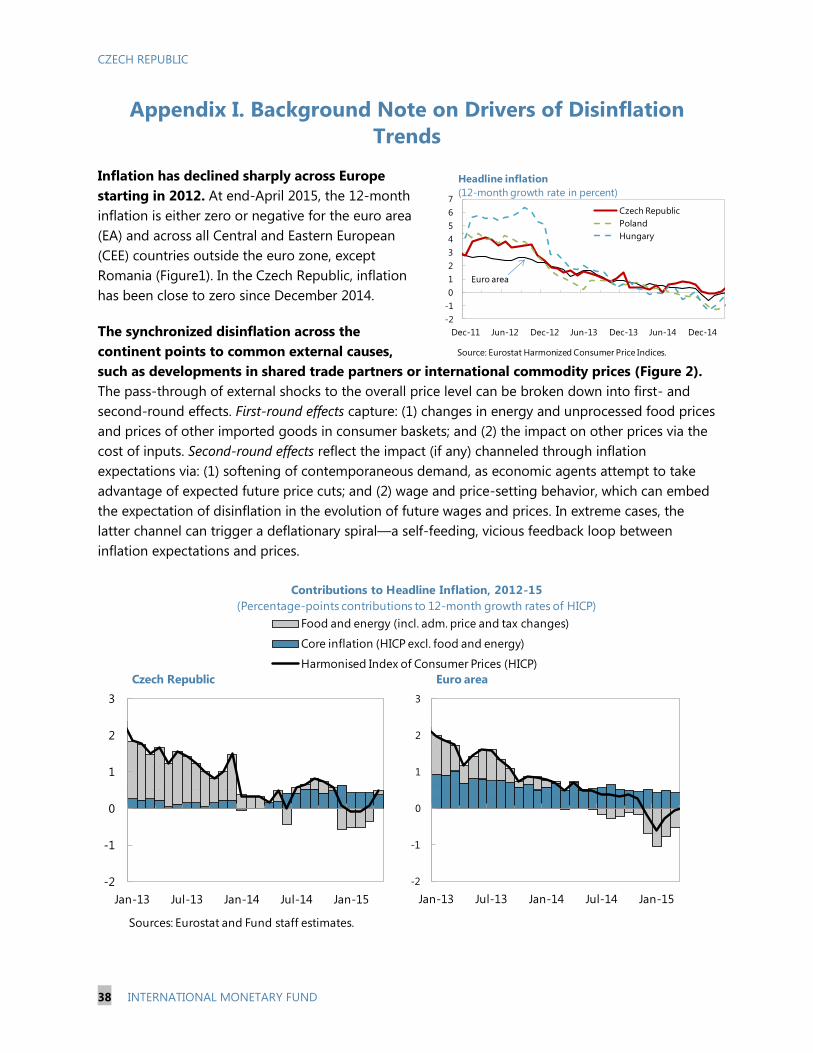
CZECH REPUBLIC
38 INTERNATIONAL MONETARY FUND
Appendix I. Background Note on Drivers of Disinflation
Trends
Inflation has declined sharply across Europe
starting in 2012. At end-April 2015, the 12-month
inflation is either zero or negative for the euro area
(EA) and across all Central and Eastern European
(CEE) countries outside the euro zone, except
Romania (Figure1). In the Czech Republic, inflation
has been close to zero since December 2014.
The synchronized disinflation across the
continent points to common external causes,
such as developments in shared trade partners or international commodity prices (Figure 2).
The pass-through of external shocks to the overall price level can be broken down into first- and
second-round effects. First-round effects capture: (1) changes in energy and unprocessed food prices
and prices of other imported goods in consumer baskets; and (2) the impact on other prices via the
cost of inputs. Second-round effects reflect the impact (if any) channeled through inflation
expectations via: (1) softening of contemporaneous demand, as economic agents attempt to take
advantage of expected future price cuts; and (2) wage and price-setting behavior, which can embed
the expectation of disinflation in the evolution of future wages and prices. In extreme cases, the
latter channel can trigger a deflationary spiral—a self-feeding, vicious feedback loop between
inflation expectations and prices.
-2
-1
0
1
2
3
Jan-13 Jul-13 Jan-14 Jul-14 Jan-15
Czech Republic
Sources: Eurostat and Fund staff estimates.
-2
-1
0
1
2
3
Jan-13 Jul-13 Jan-14 Jul-14 Jan-15
Euro area
Contributions to Headline Inflation, 2012-15
(Percentage-points contributions to 12-month growth rates of HICP)
Food and energy (incl. adm. price and tax changes)
Core inflation (HICP excl. food and energy)
Harmonised Index of Consumer Prices (HICP)
-2
-1
0
1
2
3
4
5
6
7
Dec-11 Jun-12 Dec-12 Jun-13 Dec-13 Jun-14 Dec-14
Czech Republic
Poland
Hungary
Headline inflation
(12-month growth rate in percent)
Source: Eurostat Harmonized Consumer Price Indices.
Euro area

CZECH REPUBLIC
INTERNATIONAL MONETARY FUND 39
We analyze the main drivers of disinflation in the Czech Republic in two steps:
We first apply the panel coefficients from an updated version of the open-economy, New
Keynesian, Phillips curve for the CEE region in Iossifov and Podpiera (2014) to Czech data. We
re-estimate the regression with quarterly data for ten CEE countries over 2004–14, and consider
separately the effect of forward-looking expectations and the autonomous dynamics of inflation.
This allows a breakdown of the impact of external shocks into first- and second-round effects.
We then estimate regression models of households’ and firms’ inflation expectations in CEE,
using data until the onset of disinflation in 2012. Analysis of the out-of-sample forecasting
performance of the model helps identify the normal (i.e., fitted) reaction of inflation expectations
to oil prices and other external shocks and any overshooting (i.e., abnormally large negative
residuals) that can signal unanchoring of inflation expectations.
Decomposition of inflation variance into contributions by the explanatory variables in the
regression model shows that (Figure 3):
First-round effects of lower commodity prices, as
captured by the combined impact of world food
and energy prices and administered prices1,
account for the largest share of the inflation decline
both in the Czech Republic and across other CEE
inflation targeters;
Disinflation spillovers from the euro area have been
an important factor in the Czech Republic and other
CEE inflation targeters, in light of their close trade
links with the euro area and the high import-
content in domestic demand;
Nominal effective exchange rates have played an
important role in other CEE inflation targeters, but
not in the Czech Republic if we consider the entire
2012–14 period. However, they have contributed
positively since the introduction of the FX-floor
instrument by the Czech National Bank in
November 2013;
Changes in indirect taxes have contributed sizably to the easing of domestic price pressures in
the Czech Republic and to a lesser extent in other CEE inflation targeters. This reflects base
1 Administered prices are mostly of energy products (electricity, gas, and heating) consumed by households, but also
include healthcare. The inflation target is a medium-term one, and as such short-run deviations from the target are
tolerated particularly when caused by first-round effects of exogenous supply shocks, such as administered price
changes. Monetary policy is, however, concerned about second-round effects of supply shocks.
0
20
40
60
80
100
CEE inflation
targeters
Czech
Republic
Euro Area core inflation
World food and energy prices
Administered prices
Taxes
Nominal effective exchange rate
Second-round effects
Unemployment gap
Sources of Disinflation 2012-14
(Contributions to inflation variance, percent)
Source: IMF staff calculations.

CZECH REPUBLIC
40 INTERNATIONAL MONETARY FUND
effects from the significant fiscal consolidation efforts across the region in 2011/12, aimed at
exiting the EU’s Excessive Deficit Procedure.
The domestic economic cycle— measured by the unemployment gap—has had no measurable
impact in the recent disinflationary episode.
Second-round effects, as measured by the contribution of forward-looking inflation
expectations, have not contributed to the post-2012 disinflation in the Czech Republic and can
account for 12 percent of the observed inflation variance across all CEE inflation targeters over
the period.
Analysis of the out-of-sample forecasting performance of CEE-wide regressions of
households’ and firms’ inflation expectations suggests that these models cannot fully explain
the fall in inflation expectations of both professional forecasters and the general public in the
Czech Republic in 2012–14 (Figure 4). Until mid-2014, the forecasts have eventually reverted back
to the actual realizations. It remains to be seen whether the same will occur in 2015. But, as seen
above, this has not had discernible impact on inflation so far.
Looking forward, consumer inflation expectations—which have historically been a good
predictor of inflation developments—show tentative signs of bottoming out. It remains to be
seen whether this will turn into a sustained trend in the remainder of 2015. However, both measures
of inflation expectations have a long way to go to return to where they were prior to the onset of
disinflation. Furthermore, it should be kept in mind that survey-based indicators can be wrong. For
example, Moghadam, Teja, and Berkmen (2014) point out that long-term inflation expectations had
also been positive on the eve of the three deflationary episodes in Japan.
Czech Republic: Gap Between Actual and Fitted Inflation Expectations, 2012-15
10
20
30
40
50
Dec-11 Dec-12 Dec-13 Dec-14
Actual
Fitted values
Consumer expectations of average inflation
over the next 12 months
(index)
1.0
1.5
2.0
2.5
3.0
3.5
4.0
Dec-11 Dec-12 Dec-13 Dec-14
Actual
Fitted values
Consensus forecasts of next year inflation
(percent)
Sources: European Commission, Consensus Economics Forecasts, and Fund staff estimates.
Note: Fitted values from a fixed-effects regression over the period prior to the latest episode of falling world oil prices
(2004-2011) of the two proxies of inflation expectations on their first-lags (interacted by a dummy variable for exchange
rate regime) and the log of the world price of oil in USD, multiplied by the fraction of consumer basket spent on energy.
Consensus forecasts are for the average inflation in the years shown on the horizontal axes, made 12 months prior to the
month, for which actual inflation is shown. Consumer inflationary expectations index reflect survey responses to the
question on price trends over next 12 months. It is calculated as +1* ( "Pecentage thinking it will rise a lot")+ 1/2 *
("Pecentage thinking it will rise moderately"- 1/2 * ("Pecentage thinking it will stay about the same") - 1 * ("Pecentage
thinking it will fall").
CZECH REPUBLIC
INTERNATIONAL MONETARY FUND 41
Appendix II. Debt Sustainability Analysis
Public debt declined to 43 percent of GDP in 2014 despite the fiscal relaxation, due to the favorable
cyclical developments and as the authorities used available treasury liquidity. Provided the fiscal
targets specified in the government’s convergence program are met, public debt is projected to stay
on a downward path, reaching 39 percent of GDP over the medium-term on the back of the
economic recovery and strong revenue collection. Public debt and gross financing needs are
relatively immune to a variety of isolated shocks, including a shock to real GDP growth.
Baseline and Realism of Projections
The baseline scenario assumes a structural relaxation from a deficit of 0.9 percent of GDP in
2014 to 1.5 percent in 2015 with the structural deficit gradually declining to 1 percent of GDP
by 2020. This year’s structural relaxation is mostly due to an increase in capital expenditure, and
higher health and pension spending. Projections assume a recovery of growth underpinned by
strong domestic demand, with real GDP increasing by 3.0 percent in 2015 and 2.8 percent in 2016,
and medium-term growth converging at 2.2 percent. The inflation rate is projected to gradually
move toward the 2 percent target in 2016.
The outlook for the fiscal path is benign under the baseline. Staff projects that the debt-to-GDP
ratio will decline steadily from 43 percent in 2014 to 39 percent in 2020. The ratio would also decline
in 2015 despite the expansionary fiscal stance as the authorities plan to continue relying on available
treasury liquidity. Gross financing needs are projected to stay below 8 percent of GDP throughout
the projection period.
Shock and Stress Tests
A shock to real GDP growth is the main risk over the short term. Assuming that a shock to real
GDP growth occurs with a consequent impact on the primary balance, inflation, and the real interest
rate, public debt would rise to 51 percent of GDP and gross financing needs would increase to
12 percent of GDP by 2017. Thereafter, debt would decline to 50 percent of GDP and gross financing
needs would drop to 9 percent of GDP by 2020.

CZECH REPUBLIC
42 INTERNATIONAL MONETARY FUND
Czech Republic Public Sector Debt Sustainability Analysis (DSA) – Baseline Scenario
As of June 18, 20152/
2013 2014 2015 2016 2017 2018 2019 2020 Sovereign Spreads
Nominal gross public debt 33.1 45.0 42.6 41.0 40.6 39.9 39.3 38.9 38.5 EMBIG (bp) 3/ 38
Public gross financing needs 3.0 1.2 2.0 7.5 7.8 6.8 7.1 7.3 7.1 5Y CDS (bp) 50
Real GDP growth (in percent) 2.8 -0.7 2.0 3.0 2.8 2.6 2.2 2.2 2.2 Ratings Foreign Local
Inflation (GDP deflator, in percent) 1.4 1.7 2.4 1.6 1.8 1.9 2.0 2.0 2.0 Moody's A1 A1
Nominal GDP growth (in percent) 4.3 1.0 4.4 4.6 4.6 4.6 4.2 4.2 4.3 S&Ps AA- AA
Effective interest rate (in percent) 4/ 3.9 3.0 3.1 2.9 2.7 2.8 3.0 3.0 3.2 Fitch A+ AA-
2013 2014 2015 2016 2017 2018 2019 2020 cumulative
Change in gross public sector debt 1.8 0.5 -2.5 -1.6 -0.5 -0.6 -0.6 -0.5 -0.4 -4.1
Identified debt-creating flows 2.4 2.2 1.0 0.4 -0.3 -0.5 -0.5 -0.4 -0.3 -1.7
Primary deficit 2.2 0.1 0.9 1.1 0.4 0.1 0.0 0.0 0.1 1.7
Primary (noninterest) revenue and grants38.6 40.5 39.9 40.0 39.0 39.2 39.4 39.4 39.4 236.5
Primary (noninterest) expenditure 40.8 40.6 40.7 41.1 39.4 39.3 39.3 39.4 39.5 238.2
Automatic debt dynamics 5/
0.7 2.2 0.2 -0.7 -0.7 -0.7 -0.5 -0.4 -0.4 -3.4
Interest rate/growth differential 6/
0.8 1.4 0.1 -0.7 -0.7 -0.7 -0.5 -0.4 -0.4 -3.4
Of which: real interest rate 1.5 1.1 1.0 0.5 0.4 0.3 0.4 0.4 0.4 2.3
Of which: real GDP growth -0.7 0.3 -0.9 -1.2 -1.1 -1.0 -0.8 -0.8 -0.8 -5.8
Exchange rate depreciation 7/
-0.1 0.7 0.0 … … … … … … …
Other identified debt-creating flows -0.5 0.0 0.0 0.0 0.0 0.0 0.0 0.0 0.0 0.0
General government net privatization proceeds (negative)-0.5 0.0 0.0 0.0 0.0 0.0 0.0 0.0 0.0 0.0
Contingent liabilities 0.0 0.0 0.0 0.0 0.0 0.0 0.0 0.0 0.0 0.0
Please specify (2) (e.g., ESM and Euroarea loans)0.0 0.0 0.0 0.0 0.0 0.0 0.0 0.0 0.0 0.0
Residual, including asset changes 8/
-0.6 -1.8 -3.5 -1.9 -0.1 -0.1 -0.1 -0.1 -0.1 -2.3
Source: IMF staff.
1/ Public sector is defined as general government.
2/ Based on available data.
3/ Long-term bond spread over German bonds.
4/ Defined as interest payments divided by debt stock (excluding guarantees) at the end of previous year.
5/ Derived as [(r - π(1+g) - g + ae(1+r)]/(1+g+π+gπ)) times previous period debt ratio, with r = interest rate; π = growth rate of GDP deflator; g = real GDP growth rate;
a = share of foreign-currency denominated debt; and e = nominal exchange rate depreciation (measured by increase in local currency value of U.S. dollar).
6/ The real interest rate contribution is derived from the numerator in footnote 5 as r - π (1+g) and the real growth contribution as -g.
7/ The exchange rate contribution is derived from the numerator in footnote 5 as ae(1+r).
8/ Includes asset changes and interest revenues (if any). For projections, includes exchange rate changes during the projection period.
9/ Assumes that key variables (real GDP growth, real interest rate, and other identified debt-creating flows) remain at the level of the last projection year.
-0.4
balance 9/
primary
(in percent of GDP unless otherwise indicated)
Debt, Economic and Market Indicators 1/
2004-2012
Actual
Projections
Contribution to Changes in Public Debt
Projections
2004-2012
Actual
debt-stabilizing
-6
-4
-2
0
2
4
6
8
2004 2005 2006 2007 2008 2009 2010 2011 2012 2013 2014 2015 2016 2017 2018 2019 2020
Debt-Creating Flows
Primary deficit Real GDP growth Real interest rate
Exchange rate depreciation Other debt-creating flows Residual
Change in gross public sector debt
projection
(in percent of GDP)
-10
-8
-6
-4
-2
0
2
4
6
cumulative

CZECH REPUBLIC
INTERNATIONAL MONETARY FUND 43
Czech Republic Public DSA - Composition of Public Debt and Alternative Scenarios
Baseline Scenario 2015 2016 2017 2018 2019 2020 Historical Scenario 2015 2016 2017 2018 2019 2020
Real GDP growth 3.0 2.8 2.6 2.2 2.2 2.2 Real GDP growth 3.0 2.1 2.1 2.1 2.1 2.1
Inflation 1.6 1.8 1.9 2.0 2.0 2.0 Inflation 1.6 1.8 1.9 2.0 2.0 2.0
Primary Balance -1.1 -0.4 -0.1 0.0 0.0 -0.1 Primary Balance -1.1 -1.9 -1.9 -1.9 -1.9 -1.9
Effective interest rate 2.9 2.7 2.8 3.0 3.0 3.2 Effective interest rate 2.9 2.6 3.0 3.2 3.4 3.6
Constant Primary Balance Scenario
Real GDP growth 3.0 2.8 2.6 2.2 2.2 2.2
Inflation 1.6 1.8 1.9 2.0 2.0 2.0
Primary Balance -1.1 -1.1 -1.1 -1.1 -1.1 -1.1
Effective interest rate 2.9 2.6 2.7 2.8 2.8 2.9
Real GDP growth
Real GDP growth 3.0 -0.9 -1.0 2.2 2.2 2.2
Inflation 1.6 0.9 1.0 2.0 2.0 2.0
Primary Balance -1.1 -2.2 -3.8 0.0 0.0 -0.1
Effective interest rate 2.9 2.6 2.8 2.9 2.9 3.0
Source: IMF staff.
Underlying Assumptions(in percent)
Alternative Scenarios
Composition of Public Debt
Real GDP growth
Baseline Historical Constant Primary Balance
0
10
20
30
40
50
60
2013 2014 2015 2016 2017 2018 2019 2020
Gross Nominal Public Debt
(in percent of GDP)
projection
0
2
4
6
8
10
12
14
2013 2014 2015 2016 2017 2018 2019 2020
Public Gross Financing Needs
(in percent of GDP)
projection
0
5
10
15
20
25
30
35
40
45
50
2004 2006 2008 2010 2012 2014 2016 2018 2020
By Maturity
Medium and long-term
Short-term
projection
(in percent of GDP)
0
5
10
15
20
25
30
35
40
45
50
2004 2006 2008 2010 2012 2014 2016 2018 2020
By Currency
Local currency-denominated
Foreign currency-denominated
projection
(in percent of GDP)

CZECH REPUBLIC STAFF REPORT FOR THE 2015 ARTICLE IV
CONSULTATION—INFORMATIONAL ANNEX
Prepared By
European Department
FUND RELATIONS _______________________________________________________________________ 2
STATISTICAL ISSUES ____________________________________________________________________ 5
CONTENTS
June 26, 2015

CZECH REPUBLIC
2 INTERNATIONAL MONETARY FUND
FUND RELATIONS
(As of June 10, 2015; unless specified otherwise)
Membership Status: Joined 01/01/1993; Article VIII
General Resources Account
SDR Million Percent of Quota
Quota 1,002.20 100.0
Fund Holdings of Currency 651.85 65.04
Reserve position in Fund 350.35 34.96
Lending to the Fund
Borrowing Agreement 27.70
SDR Department:
SDR Million Percent Allocation
Net Cumulative Allocation 780.20 100.0
Holdings 751.61 96.34
Outstanding Purchases and Loans: None
Financial Arrangements:
Amount Approval Amount Expiration Approved Drawn
Type Date Date (SDR Million) (SDR Million)
Stand-by 3/17/1993 3/16/1994 177.00 70.00
Projected Payments to Fund:
(SDR Million; based on existing use of resources and present holdings of SDRs):
Forthcoming
2015 2016 2017 2018 2019
Principal
Charges/Interest 0.01 0.03 0.03 0.03 0.03
Total 0.01 0.03 0.03 0.03 0.03
Exchange Rate Arrangement:
The currency of the Czech Republic is the Czech koruna, created on February 8, 1993 upon the
dissolution of the currency union with the Slovak Republic, which had used the Czechoslovak koruna
as its currency. From May 3, 1993 to May 27, 1997, the exchange rate was pegged to a basket of two
currencies: the deutsche mark (65 percent) and the U.S. dollar (35 percent). On February 28, 1996,
the Czech National Bank (CNB) widened the exchange rate band from ±0.5 percent to ±7.5 percent
around the central rate. On May 27, 1997, managed floating was introduced. Between 2002

CZECH REPUBLIC
INTERNATIONAL MONETARY FUND 3
and 2013, the CNB had not engaged in direct interventions in the foreign exchange market, and the
de facto exchange rate regime was classified as a free float. In November 2013, facing the zero lower
bound for policy rates and a persistent and large undershooting of its inflation target, the CNB
intervened in the market to weaken the currency, and announced its commitment to resist any
appreciation beyond CZK 27 per euro. Since then, the koruna traded between CZK 27.0 and
CZK 28.33 per euro. The de facto exchange rate arrangement was retroactively reclassified from
other managed to a stabilized arrangement, effective November 19, 2013. The de jure exchange rate
arrangement remains floating. On June 10, 2015, the exchange rate stood at CZK 27.27 per euro and
CZK 24.10 per U.S. dollar.
The Czech Republic has accepted the obligations of Article VIII and maintains an exchange system
that is free of restrictions on the making of payments and transfers for current international
transactions. The Czech Republic maintains exchange restrictions for security reasons, based on
UN Security Council Resolutions and Council of the European Union Regulations that have been
notified to the Fund for approval under the procedures set forth in Executive Board Decision
No. 144-(52/51).
Last Article IV Consultation:
The last Article IV consultation with the Czech Republic was concluded on August 27, 2014. The staff
report and the press release were published on September 2, 2014.
FSAP Participation and ROSCs:
An FSAP was carried out in late 2000/ early 2001. The Financial System Stability Assessment was
considered by the Executive Board on July 16, 2001, concurrently with the staff report for the
2001 Article IV Consultation. An FSAP update was carried out in 2011. ROSCs on: banking
supervision; data dissemination; fiscal transparency; securities market; and transparency of monetary
and financial policies were published on the Fund’s external website on July 1, 2000.
Technical Assistance: See attached table.
Implementation of HIPC Initiative: Not Applicable.
Implementation of Multilateral Debt Relief Initiative (MDRI): Not Applicable.
Implementation of Post-Catastrophic Debt Relief (PCDR): Not Applicable.
Safeguards Assessments: Not Applicable.
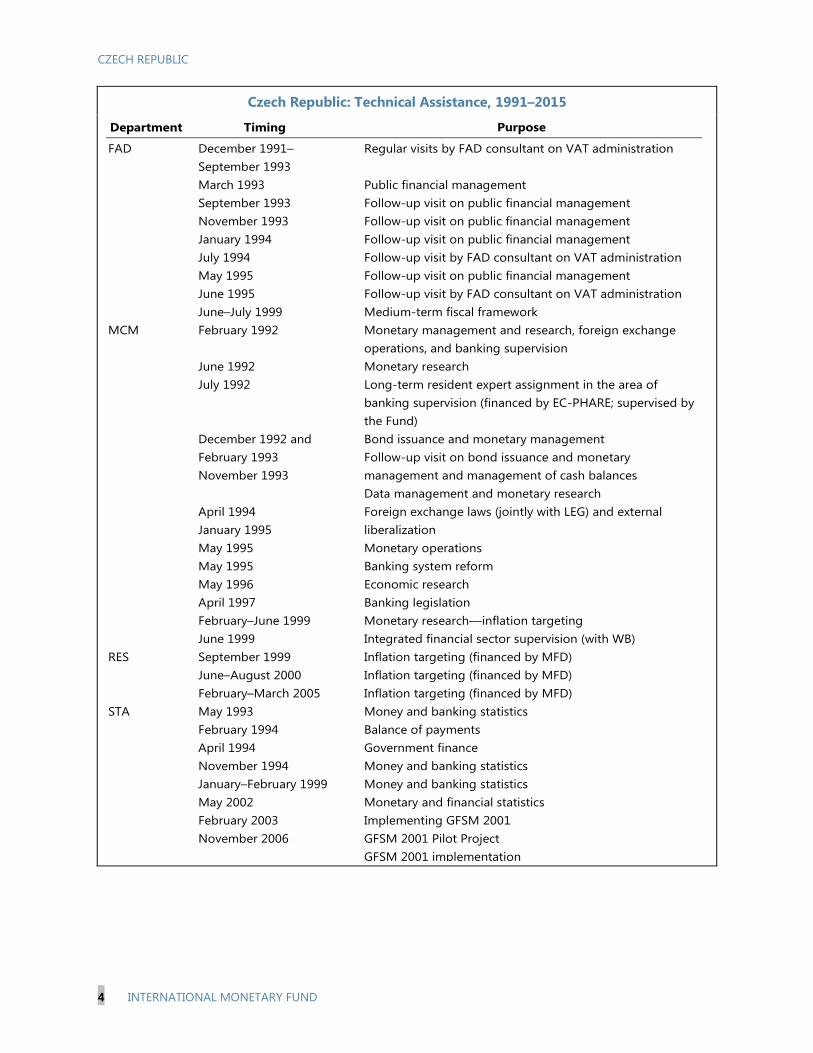
CZECH REPUBLIC
4 INTERNATIONAL MONETARY FUND
Czech Republic: Technical Assistance, 1991–2015
Department Timing Purpose
FAD December 1991–
September 1993
March 1993
September 1993
November 1993
January 1994
July 1994
May 1995
June 1995
June–July 1999
Regular visits by FAD consultant on VAT administration
Public financial management
Follow-up visit on public financial management
Follow-up visit on public financial management
Follow-up visit on public financial management
Follow-up visit by FAD consultant on VAT administration
Follow-up visit on public financial management
Follow-up visit by FAD consultant on VAT administration
Medium-term fiscal framework
MCM February 1992
June 1992
July 1992
December 1992 and
February 1993
November 1993
April 1994
January 1995
May 1995
May 1995
May 1996
April 1997
February–June 1999
June 1999
Monetary management and research, foreign exchange
operations, and banking supervision
Monetary research
Long-term resident expert assignment in the area of
banking supervision (financed by EC-PHARE; supervised by
the Fund)
Bond issuance and monetary management
Follow-up visit on bond issuance and monetary
management and management of cash balances
Data management and monetary research
Foreign exchange laws (jointly with LEG) and external
liberalization
Monetary operations
Banking system reform
Economic research
Banking legislation
Monetary research––inflation targeting
Integrated financial sector supervision (with WB)
RES September 1999
June–August 2000
February–March 2005
Inflation targeting (financed by MFD)
Inflation targeting (financed by MFD)
Inflation targeting (financed by MFD)
STA May 1993
February 1994
April 1994
November 1994
January–February 1999
May 2002
February 2003
November 2006
Money and banking statistics
Balance of payments
Government finance
Money and banking statistics
Money and banking statistics
Monetary and financial statistics
Implementing GFSM 2001
GFSM 2001 Pilot Project
GFSM 2001 implementation

CZECH REPUBLIC
INTERNATIONAL MONETARY FUND 5
STATISTICAL ISSUES
I. Assessment of Data Adequacy for Surveillance
General:
Data provision is adequate for surveillance.
National Accounts:
National accounts data are subject to certain weaknesses. Value added in the small scale
private sector is likely to be underestimated, as the mechanisms for data collection on this
sector are not yet fully developed and a significant proportion of unrecorded activity stems
from tax evasion. Discrepancies between GDP estimates based on the production method
and the expenditure method are large and are subsumed under change in stocks. Quarterly
estimates of national accounts are derived from quarterly reports of enterprises and surveys.
The estimates are subject to bias because of nonresponse (while annual reporting of
bookkeeping accounts is mandatory for enterprises, quarterly reporting is not) and lumping
of several expenditure categories in particular quarters by respondents. The Czech Republic
adopted the European System of Accounts 2010 (ESA 2010) in September 2014. The
transition from the ESA 1995 (ESA95) required the revision of national accounts data.
Price Statistics:
The Czech Statistical Office (CSO) compiles and disseminates a monthly consumer price
index (CPI) using a weighting structure based on expenditure data collected during 2012.
Weights are updated biannually. A monthly Harmonized Index of Consumer Prices (HICP) is
disseminated according to European regulations. The producer price index is released
monthly with coverage including manufacturing, construction, agriculture, and select
business services (business to business only). The CSO also compiles and releases monthly
import and export price indexes based on data collected directly from establishments
engaged in export and/or import activities.
Government Finance Statistics:
Annual and quarterly fiscal data are compiled on ESA2010 basis by the Czech Statistical
Office, including non-financial accounts, financial accounts, and financial balance sheets. The
Ministry of Finance uses the ESA methodology for the Convergence Program targets. The
ESA 2010 methodology includes a wider coverage of the general government sector,
different classification of some government transactions, and impacts the calculation of
GDP. Government transactions are recorded on an accrual basis.

CZECH REPUBLIC
6 INTERNATIONAL MONETARY FUND
Monetary and Financial Statistics:
Monetary survey data provided to the European Department are generally adequate for
policy purposes. However, large variations in the interbank clearing account float, especially
at the end of the year, require caution in interpreting monetary developments. The data
published in the International Financial Statistics (IFS) are based on monetary accounts
derived from the ECB’s framework. The same set of accounts also forms the basis for
monetary statistics published in the CNB’s bulletins and on the website, which are thereby
effectively harmonized with the monetary statistics published in IFS, although the
presentation in IFS differs somewhat from the CNB’s.
Financial sector surveillance:
CNB is reporting Financial Soundness Indicators for Deposit Takers on a quarterly basis.
External sector statistics:
Starting in 2014, external sector statistics are compiled according to the Balance of Payments
and International Investment Position Manual, sixth edition (BPM6) and in accordance with
legal requirements of the ECB and Eurostat. Balance of payments financial account
transactions are generally derived from changes in stock data adjusted by exchange rate,
price, and other changes; they are not directly based on the value of current transactions.
Quarterly external debt statistics are reported to the Quarterly External Debt Statistics
(QEDS) database.
II. Data Standards and Quality
Subscriber to the Fund’s Special Data Dissemination
Standard since April 1998.
Data ROSC was published on July 1, 2000.

CZECH REPUBLIC
INTERNATIONAL MONETARY FUND 7
Table of Common Indicators Required for Surveillance
(As of June 10, 2015)
Date of Latest
Observation
Date
Received
Frequency
of Data7
Frequency
of
Reporting7
Frequency of
Publication7
Exchange Rates current current D D D
International Reserve Assets and Reserve Liabilities
of the Monetary Authorities1
May 2015 Jun. 2015 D M M
Reserve/Base Money Apr. 2015 May 2015 M M M
Broad Money Apr. 2015 May 2015 M M M
Central Bank Balance Sheet Apr. 2015 May 2015 M M M
Consolidated Balance Sheet of the
Banking System
Apr. 2015 May 2015 M M M
Interest Rates2
current current D D D
Consumer Price Index May 2015 Jun. 2015 M M M
Revenue, Expenditure, Balance and
Composition of Financing3 – General Government
4
2014 Q4 Jun. 2015 Q Q Q
Revenue, Expenditure, Balance and
Composition of Financing3– Central
Government
May 2015 Jun. 2015 M M M
Stocks of Central Government and Central
Government-Guaranteed Debt5
2014 Q4 May 2015 Q Q Q
External Current Account Balance Mar. 2015 May 2015 M M M
Exports and Imports of Goods and Services Mar. 2015 May 2015 M M M
GDP/GNP 2015 Q1 May 2015 Q Q Q
Gross External Debt
2014 Q4 Mar. 2015 Q Q Q
International Investment Position6 2014 Q4 Mar. 2015 Q Q Q
1Includes reserve assets pledged or otherwise encumbered as well as net derivative positions.
2 Both market-based and officially-determined, including discount rates, money market rates, rates on treasury bills, notes and bonds.
3 Foreign, domestic bank, and domestic nonbank financing.
4 The general government consists of the central government (budgetary funds, extra budgetary funds, and social security funds) and state
and local governments. Data for the state budget are available with monthly frequency and timeliness, while data on extra budgetary funds
are available only on an annual basis. 5 Including currency and maturity composition.
6 Includes external gross financial asset and liability positions vis-à-vis nonresidents.
7 Daily (D); Weekly (W); Monthly (M); Quarterly (Q); Annually (A); Irregular (I); Not Available (NA).