imf country report no. 13/187 ghana · in the popular vote, but a sizeable parliamentary majority....
TRANSCRIPT

©2013 International Monetary Fund
IMF Country Report No. 13/187
GHANA 2013 ARTICLE IV CONSULTATION
Under Article IV of the IMF’s Articles of Agreement, the IMF holds bilateral discussions with members, usually every year. In the context of the 2013 Article IV consultation with Ghana, the following documents have been released and are included in this package: Staff Report for the 2013 Article IV consultation, prepared by a staff team of the IMF, following discussions that ended on April 12, 2013, with the officials of Ghana on economic developments and policies. Based on information available at the time of these discussions, the staff report was completed on May 29, 2013. The views expressed in the staff report are those of the staff team and do not necessarily reflect the views of the Executive Board of the IMF.
Debt Sustainability Analysis prepared by the staffs of the IMF and the World Bank.
Enhancing Financial Sector Surveillance
Informational Annex
Public Information Notice (PIN) summarizing the views of the Executive Board as expressed during its June 12, 2013 discussion of the staff report that concluded the Article IV consultation.
Statement by the Executive Director for Ghana.
The policy of publication of staff reports and other documents allows for the deletion of market-sensitive information.
Copies of this report are available to the public from
International Monetary Fund Publication Services 700 19th Street, N.W. Washington, D.C. 20431
Telephone: (202) 623-7430 Telefax: (202) 623-7201 E-mail: [email protected] Internet: http://www.imf.org
International Monetary Fund Washington, D.C.
June 2013

GHANA STAFF REPORT FOR THE 2013 ARTICLE IV CONSULTATION
KEY ISSUES Near-term outlook: Strong growth momentum, but significant stability risks. GDP growth of 8 percent in 2012 is projected to continue into 2013, with inflation back above 10 percent. Ghana’s strong democratic institutions and favorable prospects for oil and gas are attracting significant foreign direct investment (FDI). Yet, a large current account deficit, thin external buffers, and rising public debt expose the economy to serious risks. Energy sector problems could curtail growth, while heavy government borrowing is raising the cost of credit to the private sector. Economic policy agenda: Advancing middle-income status. Ghana has made great strides in reducing poverty and has recently reached lower middle-income status. The economy, however, still relies heavily on agriculture and natural resources, particularly for exports, and most jobs are in the informal sector. The newly elected government has adopted an ambitious transformation agenda, centered on economic diversification, shared growth and job creation, and macroeconomic stability. Macroeconomic policy mix: Need for realignment. With a near tripling of the cash deficit relative to 2011 to almost 12 percent of GDP, fiscal policy was highly expansionary in 2012. Monetary policy was tightened with some delay to halt a rapid currency depreciation, but success in stabilizing the currency came at the cost of double digit real interest rates. The immediate policy priority is to safeguard stability by rebuilding fiscal and external buffers and reduce debt, while keeping a tight monetary policy stance. Decisive fiscal consolidation will, in due course, allow for a reduction in interest rates. Going forward, successful economic transformation will require a realignment of spending away from wages and subsidies toward investment in infrastructure, while structural fiscal reforms are needed to restore policy credibility and build institutional resilience to the political cycle. Financial sector: Containing vulnerabilities and removing structural constraints. The banking system has grown steadily in assets and profitability, but high interest rates are pricing out profitable investment projects, while raising the risk of a renewed increase in nonperforming loans. The Bank of Ghana should consider requiring banks to hold higher minimum capital buffers against a future downturn, while addressing gaps and inconsistencies in the banking laws, and deepening cooperation with regional counterparts to improve the regulation and supervision of foreign banks.
May 29, 2013
GH
ANA

GHANA
2 INTERNATIONAL MONETARY FUND
Approved By Michael Atingi-Ego and Mark Flanagan
Discussions were held in Accra during April 2–12, 2013. The staff team comprised Christina Daseking (head), Javier Arze del Granado, Alfredo Baldini, Kevin Wiseman (all AFR), Monique Newiak (SPR), and Samir Jahjah, (Resident Representative). Martin Fukac (RES) participated to advise the Bank of Ghana on improvements to their inflation-targeting framework. Susan George (MCM) and Cedric Mousset (World Bank) headed the advance mission for enhancing financial sector surveillance. Messrs. Mojarrad (ED) and Abradu-Otoo (OED) participated in the discussions. The mission met with President Mahama, Vice-President Amissah-Arthur, Finance Minister Terkper, Bank of Ghana Governor Wampah, other senior officials, members of parliament, and representatives of the private sector, think tanks, trade unions, and civil society. For the preparation of this report, Imededdine Jerbi and Jean Vibar provided research and administrative support, respectively.
CONTENTS
RECENT DEVELOPMENTS AND OUTLOOK: HIGH POTENTIAL BUT SHORT-TERM RISK ______ 4
POLICY DISCUSSIONS ___________________________________________________________________________ 7
ECONOMIC POLICY AGENDA: ADVANCING MIDDLE-INCOME STATUS ______________________ 7
FISCAL POLICY: REALIGNING PRIORITIES ______________________________________________________ 8
MONETARY POLICY: LITTLE ROOM FOR EASING ____________________________________________ 16
STAFF APPRAISAL _____________________________________________________________________________ 23
BOXES 1. Assessing Reserve Adequacy in Ghana _______________________________________________________ 12 2. External Sustainability Assessment ____________________________________________________________ 13 3. Six Years of Inflation Targeting in Ghana: Policy Lessons and Challenges _____________________ 19 4. Enhanced Financial Sector Surveillance: Main Conclusions____________________________________ 22 FIGURES 1. Real Sector Indicators __________________________________________________________________________ 5 2. External Indicators _____________________________________________________________________________ 6 3. Fiscal Indicators ________________________________________________________________________________ 9 4. Monetary and Financial Indicators ____________________________________________________________ 17
GHANA
INTERNATIONAL MONETARY FUND 3
TABLES 1. Selected Economic and Financial Indicators, 2011–18 _________________________________________ 26 2A. Summary of Central Government Budgetary Operations, 2011–18 (in percent of GDP) ______ 27 2B. Summary of Central Government Budgetary Operations, 2011–18 (in millions of GHc) ______ 28 2C. Summary of Budgetary Central Government Operations, 2008–18 (in percent of GDP) ______ 29 2D. Summary of Budgetary Central Government Operations, 2008–18 (millions of GHc) ________ 30 3. Monetary Survey, 2011–18 ____________________________________________________________________ 31 4. Balance of Payments, 2011–18 ________________________________________________________________ 32 5. Financial Soundness Indicators, 2007–12 ______________________________________________________ 33 APPENDIXES I. Risk Assessment Matrix ________________________________________________________________________ 34 II. Inclusive Growth Successes and Challenges ___________________________________________________ 36 III. Public Investment, Growth, and Debt Sustainability ___________________________________________ 45 IV. Implementation of the 2011 FSAP Update-Key Policy Recommendations ____________________ 49
GHANA
4 INTERNATIONAL MONETARY FUND
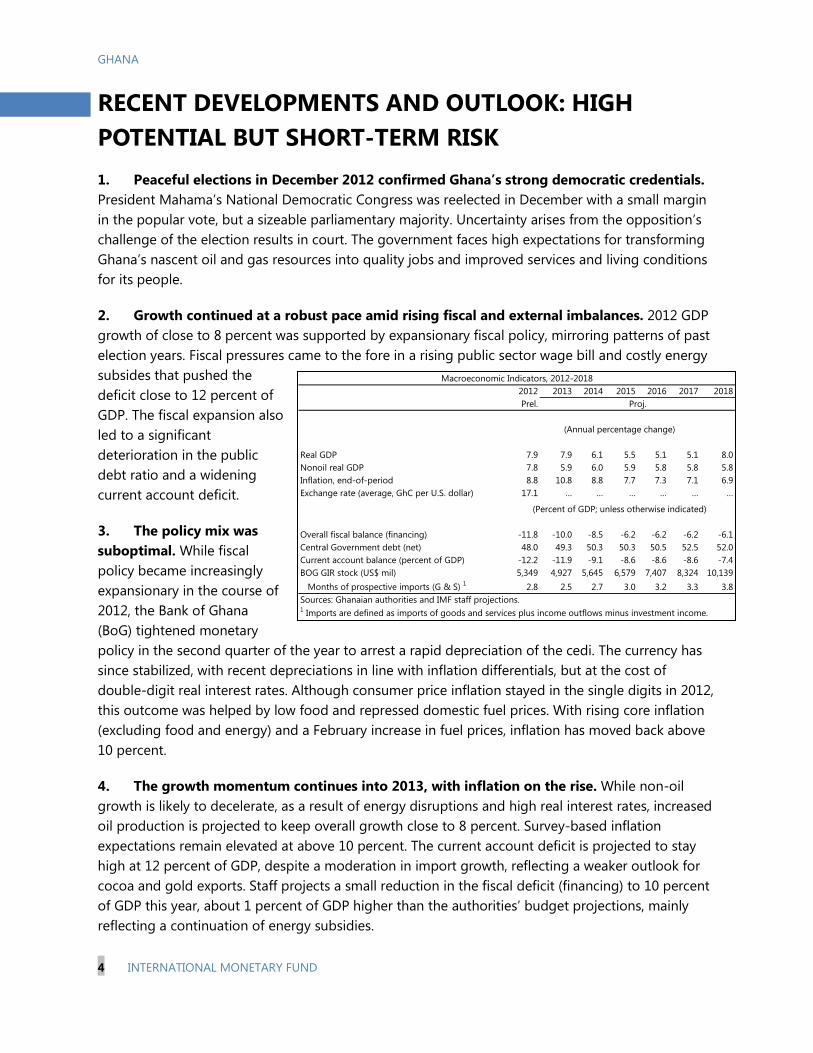
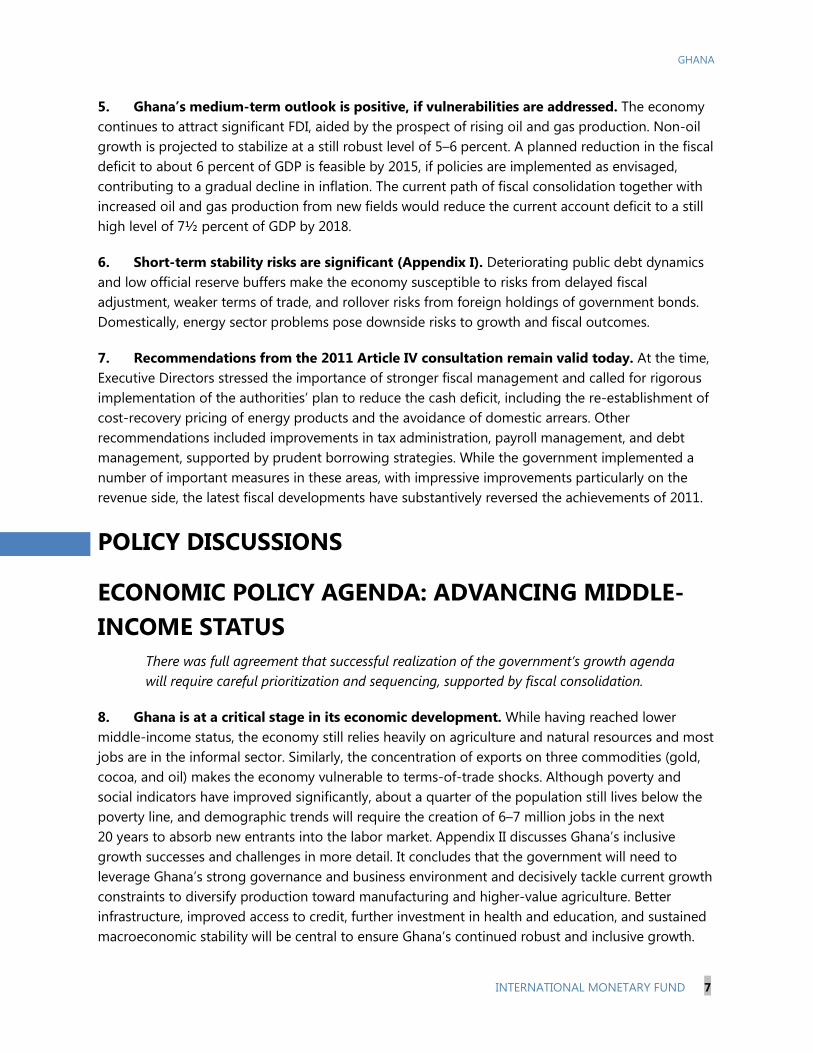
RECENT DEVELOPMENTS AND OUTLOOK: HIGH POTENTIAL BUT SHORT-TERM RISK 1. Peaceful elections in December 2012 confirmed Ghana’s strong democratic credentials. President Mahama’s National Democratic Congress was reelected in December with a small margin in the popular vote, but a sizeable parliamentary majority. Uncertainty arises from the opposition’s challenge of the election results in court. The government faces high expectations for transforming Ghana’s nascent oil and gas resources into quality jobs and improved services and living conditions for its people.
2. Growth continued at a robust pace amid rising fiscal and external imbalances. 2012 GDP growth of close to 8 percent was supported by expansionary fiscal policy, mirroring patterns of past election years. Fiscal pressures came to the fore in a rising public sector wage bill and costly energy subsides that pushed the deficit close to 12 percent of GDP. The fiscal expansion also led to a significant deterioration in the public debt ratio and a widening current account deficit.
3. The policy mix was suboptimal. While fiscal policy became increasingly expansionary in the course of 2012, the Bank of Ghana (BoG) tightened monetary policy in the second quarter of the year to arrest a rapid depreciation of the cedi. The currency has since stabilized, with recent depreciations in line with inflation differentials, but at the cost of double-digit real interest rates. Although consumer price inflation stayed in the single digits in 2012, this outcome was helped by low food and repressed domestic fuel prices. With rising core inflation (excluding food and energy) and a February increase in fuel prices, inflation has moved back above 10 percent.
4. The growth momentum continues into 2013, with inflation on the rise. While non-oil growth is likely to decelerate, as a result of energy disruptions and high real interest rates, increased oil production is projected to keep overall growth close to 8 percent. Survey-based inflation expectations remain elevated at above 10 percent. The current account deficit is projected to stay high at 12 percent of GDP, despite a moderation in import growth, reflecting a weaker outlook for cocoa and gold exports. Staff projects a small reduction in the fiscal deficit (financing) to 10 percent of GDP this year, about 1 percent of GDP higher than the authorities’ budget projections, mainly reflecting a continuation of energy subsidies.
2012 2013 2014 2015 2016 2017 2018Prel.
Real GDP 7.9 7.9 6.1 5.5 5.1 5.1 8.0Nonoil real GDP 7.8 5.9 6.0 5.9 5.8 5.8 5.8Inflation, end-of-period 8.8 10.8 8.8 7.7 7.3 7.1 6.9Exchange rate (average, GhC per U.S. dollar) 17.1 … … … … … …
Overall fiscal balance (financing) -11.8 -10.0 -8.5 -6.2 -6.2 -6.2 -6.1Central Government debt (net) 48.0 49.3 50.3 50.3 50.5 52.5 52.0Current account balance (percent of GDP) -12.2 -11.9 -9.1 -8.6 -8.6 -8.6 -7.4BOG GIR stock (US$ mil) 5,349 4,927 5,645 6,579 7,407 8,324 10,139 Months of prospective imports (G & S) 1 2.8 2.5 2.7 3.0 3.2 3.3 3.8Sources: Ghanaian authorities and IMF staff projections.1 Imports are defined as imports of goods and services plus income outflows minus investment income.
Proj.
(Annual percentage change)
(Percent of GDP; unless otherwise indicated)
Macroeconomic Indicators, 2012-2018

GHANA
INTERNATIONAL MONETARY FUND 5
Figure 1. Ghana: Real Sector Indicators
Source: Ghanaian authorities and IMF staff estimates and projections.1 The CIEA is the Bank of Ghana's composite index of real economic activity.
-2
3
8
13
18
2010 2011 2012 2013
(Per
cent
)
Non-Oil real GDP growth
Real GDP growth
....and growth is expected to be sustained on a broad basis.
0
5
10
15
20
25
30
35
Sep-
07
Mar
-08
Sep-
08
Mar
-09
Sep-
09
Mar
-10
Sep-
10
Mar
-11
Sep-
11
Mar
-12
Sep-
12
(per
cent
age
chan
ges,
yoy
)
After growing strongly in 2011 helped by new oil production, the economy has continued to expand at a robust pace in 2012,...
Quarterly real GDP growthQuarterly CIEA growth
Sep 2007 - Dec 2013
0.5 0.6 0.8 0.9 1.1 1.2 1.4 1.5 1.7 1.8 2.0 2.1 2.3 2.4 2.6 2.7
Jan-
08M
ay-…
Sep-
08Ja
n-09
May
-…Se
p-09
Jan-
10M
ay-…
Sep-
10Ja
n-11
May
-…Se
p-11
Jan-
12M
ay-…
Sep-
12Ja
n-13
US $
Euro
... and the recent cedi depreciation in the first half of 2012
(Increase = depreciation)
0
5
10
15
20
25
30
Jan-
07
Jul-0
7
Jan-
08
Jul-0
8
Jan-
09
Jul-0
9
Jan-
10
Jul-1
0
Jan-
11
Jul-1
1
Jan-
12
Jul-1
2
Jan-
13
Although inflation remained in single digits at 8.8 percent in January, the outcome was helped by low food and repressed domestic fuel prices...Headline
FoodNonfood
0
5
10
15
20
25
30
Jan-
07
Jul-0
7
Jan-
08
Jul-0
8
Jan-
09
Jul-0
9
Jan-
10
Jul-1
0
Jan-
11
Jul-1
1
Jan-
12
Jul-1
2
Jan-
13
(12-
mon
th g
row
th, p
erce
nt)
Although inflation remained in single digits at 8.8 percent in January, the outcome was helped by low food and repressed domestic fuel prices...
HeadlineFoodNonfood
0.5 0.6 0.8 0.9 1.1 1.2 1.4 1.5 1.7 1.8 2.0 2.1 2.3 2.4 2.6 2.7 2.9
Apr-
08Au
g-08
Dec
-08
Apr-
09Au
g-09
Dec
-09
Apr-
10Au
g-10
Dec
-10
Apr-
11Au
g-11
Dec
-11
Apr-
12Au
g-12
Dec
-12
Apr-
13
US $
Euro
... and the cedi, after firming in the second half of 2012, has begun to depreciate again.
(Increase = depreciation)
0
5
10
15
20
25
30
Mar
-07
Sep-
07
Mar
-08
Sep-
08
Mar
-09
Sep-
09
Mar
-10
Sep-
10
Mar
-11
Sep-
11
Mar
-12
Sep-
12
Mar
-13
(12-
mon
th g
row
th, p
erce
nt)
Inflation has recently edged back up into the low double digits...
HeadlineFoodNonfood
1.081.19 1.23
1.51 1.59
0.0
0.4
0.8
1.2
1.6
2.0
Ghana Benin Togo Burkina Faso
Cote d' Ivoire
(US$
per
lite
r) O
ctob
er 2
011
…but are still below those in neighboring countries.
0.0
0.4
0.8
1.2
1.6
2.0
Mar
-08
Jul-0
8N
ov-0
8M
ar-0
9Ju
l-09
Nov
-09
Mar
-10
Jul-1
0N
ov-1
0M
ar-1
1Ju
l-11
Nov
-11
Mar
-12
Jul-1
2N
ov-1
2M
ar-1
3
GH
c/lit
er
Import cost, cifAdministered price, before taxes and margins
Petroleum pump prices were raised in February,to reduce subsidies...
GHANA
6 INTERNATIONAL MONETARY FUND
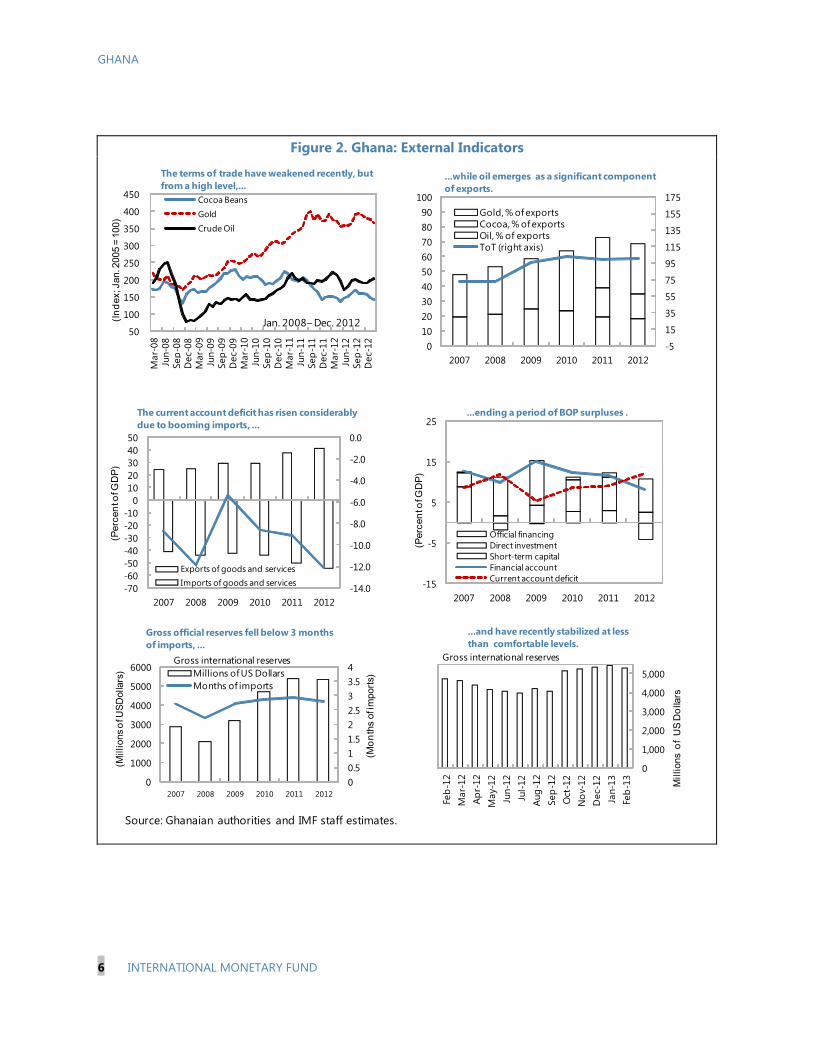
Figure 2. Ghana: External Indicators
Source: Ghanaian authorities and IMF staff estimates.
50
100
150
200
250
300
350
400
450
Mar
-08
Jun-
08Se
p-08
Dec
-08
Mar
-09
Jun-
09Se
p-09
Dec
-09
Mar
-10
Jun-
10Se
p-10
Dec
-10
Mar
-11
Jun-
11Se
p-11
Dec
-11
Mar
-12
Jun-
12Se
p-12
Dec
-12
(Inde
x; J
an. 2
005
= 10
0)
The terms of trade have weakened recently, but from a high level,...
Cocoa BeansGoldCrude Oil
Jan. 2008– Dec. 2012
-14.0
-12.0
-10.0
-8.0
-6.0
-4.0
-2.0
0.0
-70-60-50-40-30-20-10
01020304050
2007 2008 2009 2010 2011 2012
(Per
cent
of G
DP)
Exports of goods and servicesImports of goods and services
The current account deficit has risen considerably due to booming imports, ...
-15
-5
5
15
25
2007 2008 2009 2010 2011 2012
(Per
cent
of G
DP)
Official financingDirect investmentShort-term capitalFinancial accountCurrent account deficit
...ending a period of BOP surpluses .
00.511.522.533.54
0
1000
2000
3000
4000
5000
6000
2007 2008 2009 2010 2011 2012
(Mon
ths
of im
ports
)
(Mill
ions
of U
SDol
lars
) Millions of US DollarsMonths of imports
Gross international reserves
Gross official reserves fell below 3 months of imports, ...
-5
15
35
55
75
95
115
135
155
175
0102030405060708090
100
2007 2008 2009 2010 2011 2012
Gold, % of exportsCocoa, % of exportsOil, % of exportsToT (right axis)
...while oil emerges as a significant component of exports.
Feb-
12M
ar-1
2Ap
r-12
May
-12
Jun-
12Ju
l-12
Aug-
12Se
p-12
Oct
-12
Nov
-12
Dec
-12
Jan-
13Fe
b-13
0
1,000
2,000
3,000
4,000
5,000M
illio
ns o
f U
S D
olla
rs
...and have recently stabilized at less than comfortable levels.
Gross international reserves
GHANA
INTERNATIONAL MONETARY FUND 7
5. Ghana’s medium-term outlook is positive, if vulnerabilities are addressed. The economy continues to attract significant FDI, aided by the prospect of rising oil and gas production. Non-oil growth is projected to stabilize at a still robust level of 5–6 percent. A planned reduction in the fiscal deficit to about 6 percent of GDP is feasible by 2015, if policies are implemented as envisaged, contributing to a gradual decline in inflation. The current path of fiscal consolidation together with increased oil and gas production from new fields would reduce the current account deficit to a still high level of 7½ percent of GDP by 2018.
6. Short-term stability risks are significant (Appendix I). Deteriorating public debt dynamics and low official reserve buffers make the economy susceptible to risks from delayed fiscal adjustment, weaker terms of trade, and rollover risks from foreign holdings of government bonds. Domestically, energy sector problems pose downside risks to growth and fiscal outcomes.
7. Recommendations from the 2011 Article IV consultation remain valid today. At the time, Executive Directors stressed the importance of stronger fiscal management and called for rigorous implementation of the authorities’ plan to reduce the cash deficit, including the re-establishment of cost-recovery pricing of energy products and the avoidance of domestic arrears. Other recommendations included improvements in tax administration, payroll management, and debt management, supported by prudent borrowing strategies. While the government implemented a number of important measures in these areas, with impressive improvements particularly on the revenue side, the latest fiscal developments have substantively reversed the achievements of 2011.
POLICY DISCUSSIONS
ECONOMIC POLICY AGENDA: ADVANCING MIDDLE-INCOME STATUS
There was full agreement that successful realization of the government’s growth agenda will require careful prioritization and sequencing, supported by fiscal consolidation.
8. Ghana is at a critical stage in its economic development. While having reached lower middle-income status, the economy still relies heavily on agriculture and natural resources and most jobs are in the informal sector. Similarly, the concentration of exports on three commodities (gold, cocoa, and oil) makes the economy vulnerable to terms-of-trade shocks. Although poverty and social indicators have improved significantly, about a quarter of the population still lives below the poverty line, and demographic trends will require the creation of 6–7 million jobs in the next 20 years to absorb new entrants into the labor market. Appendix II discusses Ghana’s inclusive growth successes and challenges in more detail. It concludes that the government will need to leverage Ghana’s strong governance and business environment and decisively tackle current growth constraints to diversify production toward manufacturing and higher-value agriculture. Better infrastructure, improved access to credit, further investment in health and education, and sustained macroeconomic stability will be central to ensure Ghana’s continued robust and inclusive growth.

GHANA
8 INTERNATIONAL MONETARY FUND
9. The government’s transformation agenda provided the context for the discussions. It pursues three broad objectives:
• Economic diversification. Leveraging oil and gas resources to create a robust job-creating manufacturing sector will require significant infrastructure investments and removal of the main bottlenecks to growth—inadequate and unreliable energy provision and lack of affordable private sector financing.
• Social inclusion. To make further advancements in poverty reduction, ensure that the benefits of growth are widely shared, and build a workforce ready to take on higher-skilled jobs, the government wants to further strengthen Ghana’s social safety net and continue investments in utilities, health, and education, while improving the quality of social spending.
• Macroeconomic and debt sustainability. An updated debt sustainability analysis suggests that Ghana’s risk of debt distress has risen, but remains moderate, provided the government successfully implements a sizeable fiscal adjustment (see supplement).
10. The government’s immediate priority is to restore macroeconomic stability. Fiscal consolidation is needed to reduce existing vulnerabilities and allow for a gradual realignment in the policy mix in support of private investment and growth. At the same time, the government recognized that successful transformation requires administrative and institutional reforms to promote reliable policy implementation—including resilience to the political cycle—higher efficiency of public infrastructure investment, and deeper financial intermediation.
FISCAL POLICY: REALIGNING PRIORITIES There was agreement that fiscal consolidation and a shift in the composition of spending from wages and subsidies to investment are needed to support growth, reduce external pressures, and keep debt sustainable. The mission strongly supported the government’s plans for improving public financial management, while advocating more ambitious fiscal consolidation than currently planned.
11. The government’s main policy task is to reverse the large fiscal slippages of 2012. The fiscal deficit (financing basis) rose to almost 12 percent of GDP—nearly twice the level anticipated in the revised budget (Figure 3). The government also accumulated net arrears of 2.8 percent of GDP, of which nearly half was to state-owned enterprises, mainly linked to the under-pricing of fuel and utilities. A shortfall in revenue and grants added to the deficit, but the main cause for the large fiscal deterioration was higher spending.
12. Failure to control the public wage bill was the key driver behind the larger deficit. Recurrent spending rose by 4¼ percentage points of GDP between 2011 and 2012, reflecting higher interest cost, energy subsidies and, in particular, a much larger wage bill, which grew by 47 percent

GHANA
INTERNATIONAL MONETARY FUND 9
Figure 3. Ghana: Fiscal Indicators
Source: Ghanaian authorities and IMF staff estimates.
0
5
10
15
20
25
30
2009 2010 2011 2012
(Per
cent
of
GD
P) Taxes on international trade and transactionsDomestic taxes on goods and servicesTaxes on income, profits, and capital gains
While tax revenue has improved significantly since 2009,...
-1500
-1000
-500
0
500
1000
1500
2000
2500
2008 2009 2010 2011 2012
(GH
c m
illio
ns)
Net increase in domestic arrears
... while the government accumulated sizeable new arrears.Stock of domestic arrears (excluding arrears to state- owned enterprises)
0
5
10
15
20
25
30
2007 2008 2009 2010 2011 2012
(per
cent
of d
omes
tic d
ebt)
Domestic debtNon-residentsResidentsAverage nominal interest rate
... at increasing interest rates and with non-residents holding a growing share.
0
10
20
30
40
50
60
2005 2006 2007 2008 2009 2010 2011 2012
(per
cent
of G
DP)
Government debt now exceeds pre-HIPC levels, with the bulk of borrowing in domestic currency...
Foreign debt
Domestic debt
-14
-12
-10
-8
-6
-4
-2
0
2008 2009 2010 2011 2012
(Per
cent
of
GD
P)
The fiscal deficit rose sharply in 2012.
Overall balance (cash)
Overall balance (commitment)
0
5
10
15
20
25
30
2009 2010 2011 2012
(Per
cent
of
GD
P)
... spending has grown even faster, with wages crowding out investment,...
OtherWages and salariesCapital expenditure

GHANA
10 INTERNATIONAL MONETARY FUND
in nominal terms. An 18 percent pay hike explains part of this increase, and new hiring appears to have offset the smaller-than-expected savings from the recent payroll audit, but many of the factors that could explain the increase have not yet been quantified. In addition, deferred wage payments from the single spine salary reform amounted to 2½ percent of GDP, twice the level included in the mid-year revised budget. The government has initiated a thorough examination of the payroll, realizing that its ability to control wages in the future hinges on its understanding of the significant overruns in 2012.
13. The mission saw difficulties in meeting the 2013 fiscal target in the absence of additional policy measures. The budget foresees a deficit of 9 percent of GDP on a cash basis, assuming a 12 percent nominal increase in the wage bill and higher tax revenue, mainly as a result of further efforts to strengthen the performance of the Ghana Revenue Authority (GRA). Other revenue measures—an audit and subsequent streamlining of VAT exemptions, an improved VAT bill (including VAT on financial services), and a windfall profit tax on mining—are expected to become effective only in 2014. Pressures on the expenditure side arise from the need to cover subsidies on fuel and utilities. While the former were significantly reduced with the February price increases, utility tariffs remain below cost-recovery levels. Without price adjustments, compensation to state-owned energy companies could exceed the budgeted amount by 1 percent of GDP by the end of the third quarter. Incorporating these additional expenditures, a delayed impact from the envisaged revenue measures, but also a higher nominal GDP (as a result of recent upward revisions to the 2012 data), staff projects a deficit of 10 percent of GDP this year.
14. The authorities acknowledged the challenges, but were positive that their deficit target could be achieved. They anticipated that the repair of the West African Gas Pipeline and new domestic power facilities would restore stable energy supply soon, which would then allow regular adjustments in utility tariffs. Spending control would be significantly strengthened with the full rollout of the Ghana Integrated Financial Management Information System (GIFMIS) and improved cash management, including closer scrutiny of monthly expenditure relative to forecasts. In response to revenue shortfalls in the first four months of the year, the authorities announced in late May their plans to submit new tax measures to parliament. These include the reintroduction of a stabilization levy—a temporary additional profit tax on certain sectors, such as financial services and mining which was in place also in 2009-11—levies on certain imports, increases in excise duties, a review of fees and charges, and administrative measures to raise GRA collections. The estimated combined impact is close to ½ percent of GDP for the six months starting in July, which would be broadly sufficient to offset the revenue shortfall through April. In addition, the government plans to undertake a major mid-term review of its policies in the summer, to assess the need for additional measures. The mission welcomed this review, stressing the urgency of reducing vulnerabilities.
15. Staff deemed the government’s medium-term deficit target of 6 percent of GDP feasible by 2015, but saw implementation risks. Factors expected to support consolidation include: (i) the elimination of energy subsidies, deferred single spine wage payments, and past arrears; (ii) implementation of the envisaged tax policy measures and improvements in revenue

GHANA
INTERNATIONAL MONETARY FUND 11
administration; (iii) full rollout of GIFMIS; (iv) complete migration of all nonsecurity subvented agencies to the mechanized payroll and set up of an integrated HR management system; (v) strengthening of cash management, with a consolidation of government accounts; and (vi) ongoing improvements in the integrated public investment and debt management framework. Success, however, depends on whether politically difficult measures—such as adjustments of energy prices to full cost-recovery levels—will be implemented in a timely and durable manner. The mission also pointed to implementation risks from possible delays and difficulties in implementing public financial management reforms, as has been the case in the past.
16. Irrespective of feasibility, the mission viewed a deficit target of 6 percent of GDP as insufficiently ambitious. Informed by its external sustainability assessment, staff made the case for an additional adjustment in public consumption of 3-4 percent of GDP by 2017 to reduce the large current account deficit, while making room for increased public and private investment (Box 1). A lower fiscal and external current account deficit would also allow the buildup of official reserves toward the authorities’ target of more than 4 months of imports—up from 2.8 months of imports in December 2012. This target is consistent with staff’s analysis of optimal reserves, which suggests that a cover of 4.2 months of imports would provide a reasonable cushion against plausible shocks, such as deteriorating terms of trade or reversals of capital inflows invested in government bonds (Box 2).
17. An updated debt sustainability analysis supports the case for a more ambitious fiscal consolidation effort.1
1 See Supplement on Update of Joint IMF and World Bank Debt Sustainability Analysis.
Ghana’s risk of debt distress remains moderate, provided fiscal adjustment continues beyond the medium term. This would stabilize the debt ratio at its relatively high current level of about 50 percent of GDP (baseline). Absent further medium-term adjustment, the debt ratio would continue to rise (passive scenario). A more front-loaded adjustment, with additional savings of 3 percent of GDP by 2015, would set the debt ratio on a much more benign trend (active scenario).
0
10
20
30
40
50
60
70
80
90
2013 2015 2017 2019 2021 2023 2025 2027 2029 2031 2033
Baseline 1/
Passive scenario: No further adjustment 2/
Active scenario: Front-loaded adjustment 3/
1/ Incorporates budget provisions for 2013-15, and gradual further adjustment in primary balance.2/ Incorporates budget provisions for 2013-15, and no further adjustment in primary balance. 3/ Incorporates additional adjustment of 3 percent of GDP by 2015, and unchanged primary balance thereafter.
PV of Debt-to-GDP ratio, 2013-2033
Projected Fiscal Savings, Change: 2012-15
Total improvement in fiscal balance (financing basis) 5.6Revenue and grants (positive = increase) 1.8
Revenue 2.5Tax policy measures 1/ 2.1Tax administration 0.4
Grants (exogenous) -0.7Expenditure (positive = reduction) 2.6
Non-interest recurrent 0.2Interest -0.6Capital -2.0Below-the-line changes 5.0
Deferred wage payments 2.6Arrears clearance 2.4
Other (oil revenue, statistical discrepancy, tax refunds) 1.1
Source: IMF staff estimates and Ghanaian authorities.
1/ Includes projected reduction of tax exemptions, and adoption of: a new Value Added Tax bill, including VAT on financial services, a customs and excise tax bill, and a windfall profit tax on mining.

GHANA
12 INTERNATIONAL MONETARY FUND
Box 1. Assessing Reserve Adequacy in Ghana Ghana’s official reserves are low compared to its sub-Saharan peer group and rule-of-thumb benchmarks. Ghana’s reserves have recovered since 2008, but still fall short of the standard import threshold of 3 months. In relation to monetary aggregates, reserves have fallen and were just above the minimum benchmark of 20 percent of M2 at the end of 2012.
While the above measures give some guidance of reserve adequacy, they have been criticized to provide only imprecise benchmarks. A conceptually superior approach is to estimate the “optimal” level of reserves which maximizes their net benefits. Following the method applied by Dabla-Norris et al. (2011), the net benefits depend on the expected cost of a crisis given the stock of reserves, a vector of fundamentals (exchange rate regime, fiscal balance, institutions), the exposure to shocks (external demand, FDI, aid), and the opportunity cost of holding reserves (interest differential).1
The approach implies optimal reserve holdings of 4.2 months of imports ($8.1 billion) for 2012, compared with actual reserves of 2.8 months of imports ($5.3 billion). Raising reserves to the suggested level would reduce the predicted cost of a crisis, in the event of a large shock, by about 24 percent.
The assessment of Ghana’s reserve buffer must also be seen in the context of strong terms of trade in 2012 and increased foreign holdings of government paper. Oil, gold, and cocoa account for 85 percent of Ghana’s total exports of goods, and the value of gold and cocoa exports alone has risen by more than 90 percent since 2009. A return of gold and cocoa exports to their 2009 levels could curb net current account inflows by $1.6 billion. At the same time, high yields on government bonds have increased foreign participation, with nonresidents now holding about one-third of government domestic debt (in three and five-year bonds). This creates potential for net portfolio inflows, as bonds are typically held to maturity and those maturing in 2013 had very low foreign participation. However, if instead foreigners decided to reduce their exposure by selling, for example, half of their holdings (arguably at a significant discount) on the secondary market, this would translate into capital outflows of $1.4 billion. Thus, a confluence of adverse developments could seriously weaken the balance of payments, lending strong support to the model-based conclusion that current reserve levels provide an inadequate buffer against plausible country-specific shocks.
_____________ 1 See Dabla-Norris, Kim and Shorono (2011): “Optimal Precautionary Reserves for Low-Income Countries: A Cost-Benefit Analysis”, WP/11/249.
0
2
4
6
8
10
GHANA Low Income Countries (SSA)Oil-exporting Countries (SSA) Sub Saharan AfricaSouth Africa Middle-income Countries (SSA)
Ghana has been outperformed by its peers in terms of reserves per months of imports...
Sources: IMF staff estimates based on World Economic Outlook
0
0.2
0.4
0.6
0.8
1Reserves as share of M2 Reserves as share of M3
...and its gross reserve holdings as a share of monetary aggregates have been declining.
Sources: IMF staff estimates based on World Economic Outlook
0.00
2.00
4.00
6.00
8.00
1.5 2 2.5 3 3.5
Gap (optimal minus actual)
Optimal Reserve Holdings in Months of ImportsActual Coverage (2012)
Cost of Holding Reserves in Percent
Ghana: Optimal Reserve Holdings in Months of Imports (2012)
Sources: Staff estimates and projections based on Dabla-Norris, Kim and Shirono (2011).
Optimal reserve holdings, inputsData Shocks1
Government balance, % of GDP (2012) -11.8 External demand growth (%)2 -1.7CPIA, average of three last years 3.9 Terms of trade growth (%) -13.6Flexible exchange rate yes FDI as % of GDP -4.1Availability of IMF program yes Aid in % of GDP -1.7
spread over 10-yrs US treasury bond (%) 3.0
Source: IMF staff estimates based on Dabla-Norris, Kim, and Shirono (2011).
1 Shocks defined as one standard deviation of respective time series (2000-2012)2 Worst deterioration of exports since 2000 used as high s.d. driven by large upward swings

GHANA
INTERNATIONAL MONETARY FUND 13
Box 2. External Sustainability Assessment1
Medium-term current account benchmarks for Ghana range from -4 to -2.8 percent of GDP. Ghana’s optimal path in the next five years should lead to a reduction in the current account deficit combined with a significant fiscal consolidation and a shift from public consumption to public investment.
The three methodologies used—external sustainability (ES), macroeconomic balance (MB), and model-based—approach the assessment from different perspectives. Combining their results provides a richer picture of Ghana’s external position. The ES approach provides a current account benchmark consistent with stabilizing NFA at a certain level, but abstracts from the country’s underlying internal fundamentals. The MB approach estimates a benchmark based on the country’s fundamentals relative to its trading partners, but does not capture Ghana’s recent oil windfall and its potential use for infrastructure investment. In a capital-scarce economy, like Ghana, this may warrant higher current account deficits. By calibrating the dynamic neoclassical model by Araujo et al. (2012) to the case of Ghana, the recent discovery of offshore oil and gas reserves is explicitly incorporated into the assessment of the current account.
Both the ES and MB approaches suggest that the current account deficit should decline in the medium run, but magnitudes of adjustment differ. Stabilizing Ghana’s NFA-to-GDP ratio at its 2009 pre-oil discovery level of -26.8 percent implies a current account benchmark of -2.8 percent of GDP. The MB approach predicts a medium-run benchmark of -3.5 percent of GDP which is strongly influenced by Ghana’s relatively high rates of GDP per capita and population growth. Under this approach a fiscal adjustment would narrow the gap from two sides: directly, by reducing the actual current account deficit, and indirectly by lowering the benchmark, with every percentage point improvement in Ghana’s fiscal balance translating into a 0.3 percentage point increase in the sustainable current account deficit.
A model-based approach is used to qualify the above results and to provide quantitative indications of the optimal composition of consumption and investment in Ghana in the medium run.2 The paths of the current account, as well as private and public consumption and investment implied by the model, are the result of the optimal choice of a social planner maximizing social welfare. The optimal choice takes account of the need for infrastructure scaling up and incorporates inefficiencies inherent in investment projects in developing countries, given a long-run level of NFA (note that FDI is treated as decreasing NFA in the model). Once calibrated to Ghana’s economy, the model can provide a current account benchmark, as well as information on the optimal composition of consumption and investment.
First, the optimal composition of spending is estimated consistent with the projected current account deficit in the medium run. This step reveals the long-run level of NFA under which the currently projected deficit for 2017 would be optimal and the optimal levels of private and public consumption and investment given this projection. A current account benchmark broadly in line with the projected path of the current account deficit in the medium run is consistent with a long-run NFA level of -78 percent of GDP. This level would place Ghana in the lowest 20th-percentile within the group of middle income countries.3 Given this long-run NFA level, the model predicts that recurrent government expenditure is around 4.5 percentage points of GDP above and public investment more than 2 percentage points below the optimal value in 2012. In 2017, government consumption is projected to be more than 3 percentage points of GDP higher than its benchmark and public investment almost 0.5 percentage point below its optimal value.
-14
-12
-10
-8
-6
-4
-2
02012 2013 2014 2015 2016 2017
Macrobalance
External Sustainability
projected
Model, optimal path, NFA/GDP=-0.40
Current Account: All approaches suggest that the current account deficit has to decline in the medium term.
Sources: Staff projections and calibration based on Araujo et al. (2012).
MB ES Model
short-run (2012)
CA projection -12.2% -12.2% -12.2%
CA benchmark -7.7% -2.8% -9.8%
CA gap -4.4% -9.4% -2.4%
medium-run (2017)
CA projection -8.6% -8.6% -8.6%
CA benchmark -3.5% -2.8% -4.0%
CA gap -5.1% -5.8% -4.6%
Sources: Staff projections and calibration based on Araujo et al. (2012).
GHANA
14 INTERNATIONAL MONETARY FUND
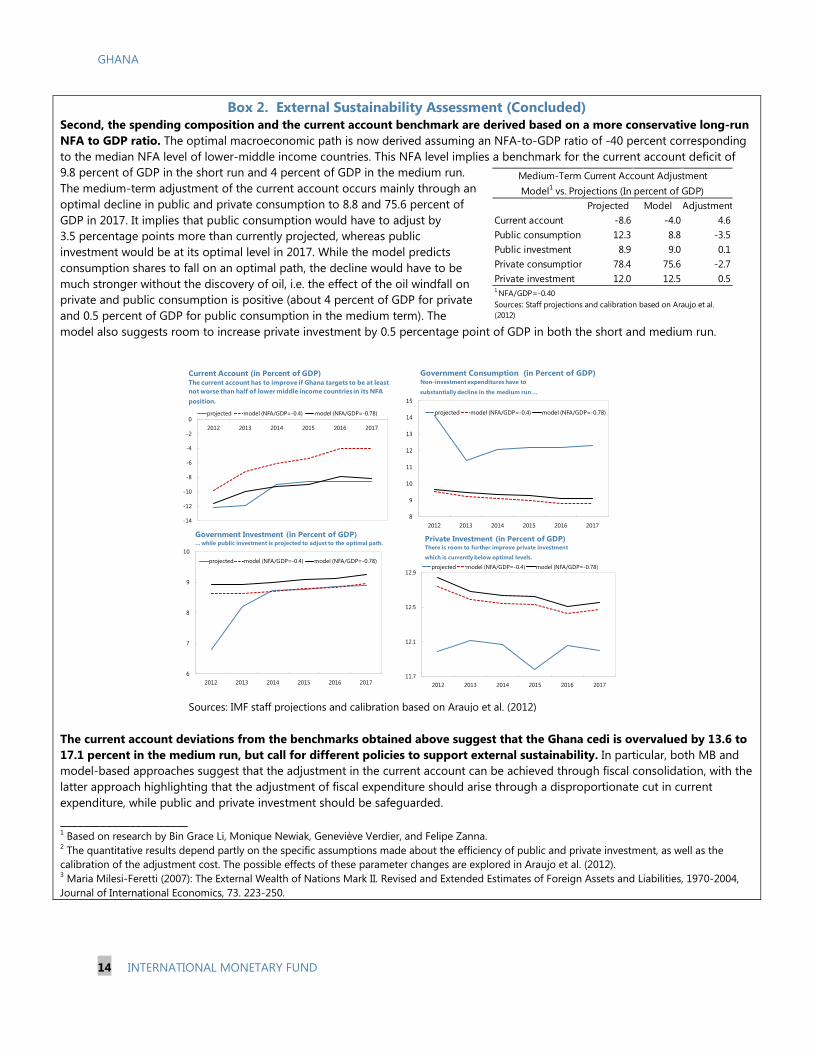
Box 2. External Sustainability Assessment (Concluded) Second, the spending composition and the current account benchmark are derived based on a more conservative long-run NFA to GDP ratio. The optimal macroeconomic path is now derived assuming an NFA-to-GDP ratio of -40 percent corresponding to the median NFA level of lower-middle income countries. This NFA level implies a benchmark for the current account deficit of 9.8 percent of GDP in the short run and 4 percent of GDP in the medium run. The medium-term adjustment of the current account occurs mainly through an optimal decline in public and private consumption to 8.8 and 75.6 percent of GDP in 2017. It implies that public consumption would have to adjust by 3.5 percentage points more than currently projected, whereas public investment would be at its optimal level in 2017. While the model predicts consumption shares to fall on an optimal path, the decline would have to be much stronger without the discovery of oil, i.e. the effect of the oil windfall on private and public consumption is positive (about 4 percent of GDP for private and 0.5 percent of GDP for public consumption in the medium term). The model also suggests room to increase private investment by 0.5 percentage point of GDP in both the short and medium run.
The current account deviations from the benchmarks obtained above suggest that the Ghana cedi is overvalued by 13.6 to 17.1 percent in the medium run, but call for different policies to support external sustainability. In particular, both MB and model-based approaches suggest that the adjustment in the current account can be achieved through fiscal consolidation, with the latter approach highlighting that the adjustment of fiscal expenditure should arise through a disproportionate cut in current expenditure, while public and private investment should be safeguarded. ______________________ 1 Based on research by Bin Grace Li, Monique Newiak, Geneviève Verdier, and Felipe Zanna. 2 The quantitative results depend partly on the specific assumptions made about the efficiency of public and private investment, as well as the calibration of the adjustment cost. The possible effects of these parameter changes are explored in Araujo et al. (2012). 3 Maria Milesi-Feretti (2007): The External Wealth of Nations Mark II. Revised and Extended Estimates of Foreign Assets and Liabilities, 1970-2004, Journal of International Economics, 73. 223-250.
Projected Model AdjustmentCurrent account -8.6 -4.0 4.6Public consumption 12.3 8.8 -3.5Public investment 8.9 9.0 0.1Private consumption 78.4 75.6 -2.7Private investment 12.0 12.5 0.5
Medium-Term Current Account AdjustmentModel1 vs. Projections (In percent of GDP)
1 NFA/GDP=-0.40Sources: Staff projections and calibration based on Araujo et al. (2012)
-14
-12
-10
-8
-6
-4
-2
02012 2013 2014 2015 2016 2017
projected model (NFA/GDP=-0.4) model (NFA/GDP=-0.78)
Current Account (in Percent of GDP)The current account has to improve if Ghana targets to be at least not worse than half of lower middle income countries in its NFA position.
8
9
10
11
12
13
14
15
2012 2013 2014 2015 2016 2017
projected model (NFA/GDP=-0.4) model (NFA/GDP=-0.78)
Government Consumption (in Percent of GDP) Non-investment expenditures have to
substantially decline in the medium run ...
6
7
8
9
10
2012 2013 2014 2015 2016 2017
projected model (NFA/GDP=-0.4) model (NFA/GDP=-0.78)
Government Investment (in Percent of GDP)... while public investment is projected to adjust to the optimal path.
11.7
12.1
12.5
12.9
2012 2013 2014 2015 2016 2017
projected model (NFA/GDP=-0.4) model (NFA/GDP=-0.78)
Private Investment (in Percent of GDP)There is room to further improve private investment
which is currently below optimal levels.
Sources: IMF staff projections and calibration based on Araujo et al. (2012)

GHANA
INTERNATIONAL MONETARY FUND 15
18. A model-based analysis confirms these conclusions and provides further insights on the trade-offs between different policy choices. Appendix III presents the results of a dynamic stochastic general equilibrium (DSGE) model, capturing the interaction between public investment, growth, and debt sustainability, calibrated to the Ghanaian economy. The analysis illustrates that achieving a long-term debt ratio of about 50 percent may require a stronger fiscal effort than assumed in the standard DSA. It confirms that further upfront consolidation would reduce the debt ratio significantly with only small reductions in the growth dividend. Alternative policy scenarios suggest that such a front-loaded adjustment could generate significant benefits if combined with reforms to enhance investment efficiency. The latter would even create scope for a more ambitious scaling up of public investment and a larger growth dividend, without endangering the debt dynamics. A more ambitious investment profile without improved efficiency, however, would raise the debt ratio significantly.
19. In light of these findings, the mission recommended policy measures to generate savings of another 3 percent of GDP by 2015, complemented by further institutional reforms. While there are limits to achieving faster consolidation in 2013, staff viewed prompt action on measures that can be implemented quickly as critical to reduce fiscal and external risks. This, together with an ambitious and credible action plan for the coming years, would go a long way in reinforcing confidence. The mission suggested a thorough expenditure review, with possible support from the Fund’s Fiscal Affairs Department, to identify areas for savings and reprioritization, consistent with the government’s own agenda.
20. There was broad consensus on the areas for reform:
• On the expenditure side, it was agreed that a return to full cost-recovery pricing for fuel and utilities—cushioned by targeted social programs—should be pursued as soon as possible, not only to generate savings, but also to restore the financial viability of the public energy companies, as part of a comprehensive reform of the sector. The largest potential for savings could be achieved by rationalizing the wage bill, including actions to streamline, discontinue, or commercialize the activities of subvented agencies. A public sector reform secretariat has been established under the office of the president to develop specific plans. The authorities saw benefits in the mission’s proposal to move to multi-year wage agreements and to negotiate salary increases before the budget is finalized to enhance predictability. Decisive action on these and other fronts, in the context of a broad public expenditure review, could reasonably generate savings of another 2 percent of GDP by 2015. On wages alone, savings of 1¾ percent of GDP could be achieved, relative to current projections, by limiting pay increases to inflation, while keeping the size of the public sector unchanged.
• On the revenue side, a far-reaching removal of exemptions, together with further tax policy measures, for example in the area of property taxes, could generate additional revenue of 1 percent of GDP by 2015.
These measures, taken together, would help rebuild external buffers, establish favorable debt dynamics, improve the composition of fiscal spending toward priority areas, and allow a readjustment in the policy mix to reduce high real interest rates.

GHANA
16 INTERNATIONAL MONETARY FUND
21. The authorities also recognized the importance of institutional reforms to strengthen budgetary control and predictability:
• Debt management and investment planning. Building on past achievements, the authorities are committed to further strengthen their performance in these key areas that will only increase in importance with growing reliance on nonconcessional financing. The planned issuance of another Eurobond of up to $1 billion is part of their strategy to smooth rollover needs and reduce debt-servicing costs—by replacing more expensive borrowing from the less liquid domestic market—while shoring up international reserves. The authorities are also taking a more systematic approach to the implementation of investment projects, prioritizing completion of existing over new projects.
• Budget allocation rules for statutory funds. Fixed allocation to these funds, established for priority areas, such as roads, education, and fiscal decentralization, limit budget flexibility but are constitutionally mandated. Rather than attempting to change the underlying principle, the authorities saw scope in reviewing the transfers and associated spending obligations, with a view to streamlining overall government expenditure and creating more flexibility to adjust spending in response to shocks or changed priorities.
• Fiscal rules. The authorities were open to renew the dialogue over the adoption of comprehensive fiscal rules to support fiscal prudence and debt sustainability, once consolidation is firmly on track and fiscal predictability has been established.
MONETARY POLICY: LITTLE ROOM FOR EASING
There was broad agreement that monetary policy needs to remain tight until fiscal consolidation is firmly established.
22. The mission raised concerns about the BoG’s direct financing of the fiscal deficit in the run-up to the 2012 elections. The sharp increase in net credit to the government far exceeded the statutory limit of 10 percent of revenue for total bank financing and risked weakening the perception of the BoG’s independence, as well as the credibility of the inflation targeting regime. The authorities explained that the high recourse to BoG financing reflected revenue shortfalls at the end of 2012, when the BoG had already covered government payments on the basis of higher revenue projections. Going forward, they expected that ongoing improvement in cash management and forecasting would allow them to 0
500100015002000250030003500400045005000
2007Q1 2008Q1 2009Q1 2010Q1 2011Q1 2012Q1
Net Claims on Central Government (BOG)
stock levels , GhC mil.
2008 elections
2012elections
Sources: Bank of Ghana and IMF staff estimates.
GHANA
INTERNATIONAL MONETARY FUND 17
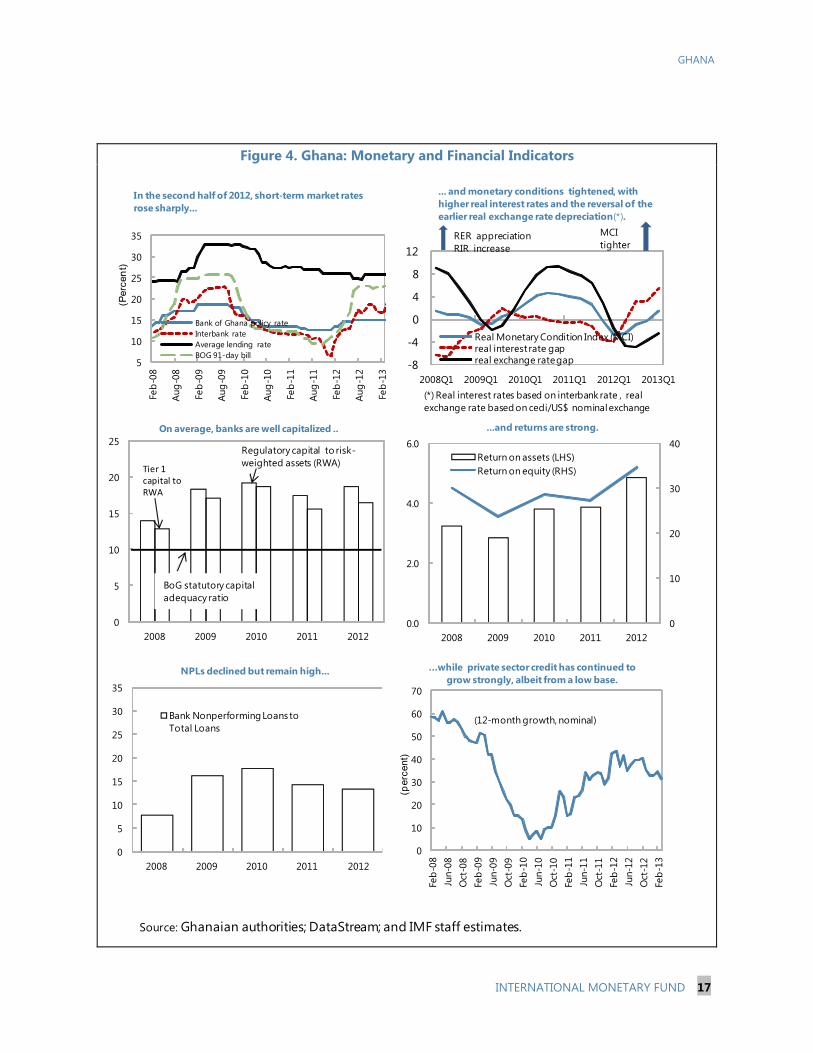
Figure 4. Ghana: Monetary and Financial Indicators
Source: Ghanaian authorities; DataStream; and IMF staff estimates.
5
10
15
20
25
30
35
Feb-
08
Aug-
08
Feb-
09
Aug-
09
Feb-
10
Aug-
10
Feb-
11
Aug-
11
Feb-
12
Aug-
12
Feb-
13
(Per
cent
)
Bank of Ghana policy rateInterbank rateAverage lending rateBOG 91-day bill
In the second half of 2012, short-term market rates rose sharply...
0
5
10
15
20
25
2008 2009 2010 2011 2012
Regulatory capital to risk-weighted assets (RWA)
On average, banks are well capitalized ..
BoG statutory capital adequacy ratio
Tier 1 capital to RWA
0
10
20
30
40
0.0
2.0
4.0
6.0
2008 2009 2010 2011 2012
Return on assets (LHS)Return on equity (RHS)
...and returns are strong.
0
10
20
30
40
50
60
70
Feb-
08Ju
n-08
Oct
-08
Feb-
09Ju
n-09
Oct
-09
Feb-
10Ju
n-10
Oct
-10
Feb-
11Ju
n-11
Oct
-11
Feb-
12Ju
n-12
Oct
-12
Feb-
13
(per
cent
)
…while private sector credit has continued to grow strongly, albeit from a low base.
(12-month growth, nominal)
0
5
10
15
20
25
30
35
2008 2009 2010 2011 2012
Bank Nonperforming Loans to Total Loans
NPLs declined but remain high...
-8
-4
0
4
8
12
2008Q1 2009Q1 2010Q1 2011Q1 2012Q1 2013Q1
Real Monetary Condition Index (MCI)real interest rate gapreal exchange rate gap
... and monetary conditions tightened, with higher real interest rates and the reversal of the earlier real exchange rate depreciation(*).
MCI tighter
(*) Real interest rates based on interbank rate , real exchange rate based on cedi/US$ nominal exchange
RER appreciationRIR increase

GHANA
18 INTERNATIONAL MONETARY FUND
significantly reduce such unintentional recourse to BoG’s financing, but did not think that a full elimination was practical. The mission agreed with the BoG’s proposal to establish a separate ceiling for its component of government financing that is consistent with macroeconomic stability objectives and enforced.
23. Faced with a rapidly depreciating currency, the BoG took a number of measures in 2012 to tighten domestic liquidity. Apart from raising its policy rate by 250 basis points and directly mopping up liquidity, the BoG reduced banks’ maximum net open forex position and required them to hold mandatory reserves on foreign currency deposits in cedi, rather than foreign currency. These measures were successful in absorbing excess liquidity and stabilizing the cedi, while raising interbank rates well above the policy rate. Thus, the effective policy stance, as evidenced by market rates, has been tighter than suggested by the policy rate.
24. There was agreement that interest rates will need to remain high until inflationary expectations decline and fiscal consolidation is firmly established. Both actual inflation and inflation expectations have risen recently in the context of aggregate demand pressures from expansionary fiscal policies, consistent with staff’s assessment of a positive output gap (text chart and analysis in Box 3). With upside risks from the sharp increase in reserve money, driven by net credit to the government, the mission advised keeping a tight monetary stance at this juncture.
0
5
10
15
20
25
0500
1,0001,5002,0002,5003,000
Jul' 0
7
Oct' 0
7
Jan'
08
Apr'
08
Jul' 0
8
Oct' 0
8
Jan '
09
Apr '
09
Jul '0
9
Oct '0
9
Jan '
10
Apr '
10
Jul '1
0
Oct '1
0
Jan '
11
Apr '
11
Jul '1
1
Oct
'11
Jan '
12
Apr
'12
Jul '
12
Oct
'12
Excess Reserves Required ReservesBOG Policy Rate (RHS) Interbank Rate (RHS)
June 2012: BOG changes coverage in required reserve to include FX
deposits
Ghana: Bank Liquidity and Interest RatesJuly 2007 - February 2013
Sources: Bank of Ghana and IMF estimates.

GHANA
INTERNATIONAL MONETARY FUND 19
Box 3. Six Years of Inflation Targeting in Ghana: Policy Lessons and Challenges1
Ghana is one of the few lower-middle income countries that adopted inflation targeting (IT) as a formal framework for its monetary policy. This box summarizes the key findings of a joint study by the IMF African and Research Departments on the performance of Ghana’s IT regime over the six years of its existence (2007–12). It applies a stylized macroeconomic model of the kind typically used by central banks to guide their policy in the early phases of their IT experience.2 The key findings and policy conclusions are: the IT regime has been successful in bringing inflation down to single digits, but there remain significant operational challenges to make the framework more transparent and accountable.
Inflation Record and Monetary Transmission
The IT regime has been successful in delivering on its goal of reducing inflation and keeping it stable at the authorities’ target level. The Bank of Ghana (BoG) reduced headline inflation from 20-percent levels in 2004 to 10.7 percent by end-2010 (above the 8.6 percent mid-point target, but within the target band); since then, inflation has stayed within the official target bands (Figure 1). This was helped, however, by low food inflation and administered energy prices; core inflation, excluding food and energy, has been persistently in double digits throughout the IT period (2007-to date) and within the upper limit of the official target bands since 2011.
The interest rate channel, a key channel of IT policy, seems to function in a standard way. This conclusion takes account of the fact that the overnight interbank market rate has at times deviated quite significantly from the official policy rate. Because the former is a better proxy of the BoG’s effective policy stance, it is used instead of the official policy rate to analyze the implementation of the IT framework. Figure 2 shows the correlation between the interbank market rate and economic activity, measured by the output gap (the difference between actual output and its potential level). Past interest rate tightening is associated with moderating economic activity in the future (Figure 2, SW quadrant showing negative correlation), indicating that the BoG is forward-looking by tightening rates when an output gap is expected to open up. Also, the BoG seems to appropriately tighten the policy rate in response to past increases in the output gap (Figure 2, NE quadrant showing positive correlation).
Interpreting interest rates, inflation, and economic activity over the IT period
The six-year experience of IT in Ghana can be divided into three sub-periods: (i) transition period (2007-2008), (ii) IT-gaining-credibility period (2009-2010), and (iii) complacent period (2011-2012). A macroeconomic model is used to shed light on the key drivers of economic cycles and the policy transmission mechanism during those periods. The model reflects the essence of the macroeconomic relationship between output, prices, interest rates, and exchange rates as predicted by economic theory. Specifically, monetary policy follows a Taylor-type rule in which the policy interest rate responds to expected future deviations of inflation from the target and to the output gap. Formally, the behavior of output and inflation is captured by an IS curve, which captures demand shocks, including fiscal policy changes, and a Phillips curve. As a small open economy, Ghanaian economic activity is further affected by foreign factors. The exchange rate, satisfying risk-adjusted uncovered interest-rate parity, is a nominal shock absorber between the domestic and foreign developments.
-1.00
-0.75
-0.50
-0.25
0.00
0.25
0.50
0.75
1.00
-6 -5 -4 -3 -2 -1 0 1 2 3 4 5 6Corr
elat
ion
Betw
een
Out
put G
ap a
nd B
oG P
olic
y Ra
te
Quarter
Note: The level of economic activity is proxied by the Indicator of Real Economic Activity estimated by the Bank of Ghana (RCIEA). Output gap is estimated by detrending the RCIEA with an HP-filter over the 2004 Q4 - 2012Q4 period.
SW quadrant
NEquadrant
Correlations between output gap at time t=0 and policy rate leading by 1, ...,6 quarters ahead.
Correlations between output gap at time t=0 and policy rate lagging by 1, ...,6 quarters behind.
Figure 2. Stylized facts on monetary policy transmission (2004–12)
Source: Bank of Ghana and IMF Staff estimates

GHANA
20 INTERNATIONAL MONETARY FUND
Box 3. Six Years of Inflation Targeting in Ghana: Policy Lessons and Challenges (Concluded)
The model can explain volatility in interest rates, prices, and output by underlying (model-estimated) “fundamentals.” Figure 3 shows the actual interbank rate and the fundamental rate estimated by the model. Figure 4 decomposes the interbank (policy) rate into its structural components, including unexpected shocks (other factors). During the IT transition period, the actual rate was close to its fundamental level, but policy still lacked credibility: when the food and fuel price shock hit the economy in 2008, inflation expectations surged (Figure 5). This prompted the authorities to increase rates by more than warranted by economic fundamentals (Figure 3) in an attempt to gain credibility and anchor inflation expectations. During the following five quarters (2009Q3–2010Q4), inflation declined, reaching its 9 percent target by end-2010. Subsequently, the monetary stance turned too accommodative, planting the seeds for yet another credibility test. As the economy entered an expansionary period with the start of oil production, liquidity conditions eased rapidly. The interest rate fell below its fundamental rate, and associated capital outflows triggered a sharp exchange rate depreciation. Inflation expectations accelerated again (light green bars in Figure 5). At this point, breaking the cycle required aggressive action, leading to double–digits real interest rates.
What are the conclusions?
Stronger commitment to single-digit inflation could have benefited the real economy through lower financing costs. The ‘lack of credibility’ premium in interest rates, comes from different sources: an imperfect alignment of market rates with the BoG policy rate, delayed reaction to growing liquidity pressures, and insufficient communication of the policy stance. Credibility of the IT framework could also be enhanced by setting a medium-term inflation target to better anchor expectations. The BoG may want to adopt a more ambitious medium-term inflation target of 5-6 percent, to realize the significant welfare gains from a lower inflation environment. Looking forward, the BoG should make further improvements in the systematic use of a model-based forecasting and policy analysis (FPAS) and in communicating effectively to the public its policy decisions, including policy and forecasting mistakes, in line with best practice in IT-based monetary policy frameworks.
Considerations beyond the model-based analysis
A successful implementation of the IT framework cannot be seen in isolation from fiscal policy shocks which may threaten the inflation target. An expansionary fiscal policy that relies directly on BoG financing, as it has occurred in Ghana in the past two elections (2008 and 2012), makes it difficult to achieve and sustain lower inflation rates. Such a policy of monetizing the fiscal deficit raises inflation directly, while also entrenching it through higher inflationary expectations. _______________________ 1The authors of this box are Alfredo Baldini (AFR) and Martin Fukac (RES). 2See Douglas Laxton, Alasdair Scott, and David Rose, 2009. "Developing a Structured Forecasting and Policy Analysis System to Support Inflation-Forecast Targeting (IFT)," IMF Working Papers 09/65, International Monetary Fund.
Source: Bank of Ghana and IMF Staff estimates.

GHANA
INTERNATIONAL MONETARY FUND 21
It recommended an increase in the policy rate to counter inflationary pressures, supported by active liquidity management that keeps market rates appropriately tight. This would also strengthen the signaling role of the policy rate within the inflation-targeting framework by narrowing the gap with current interbank rates. The mission suggested that a further tightening of the policy stance could be warranted, should recent hikes in domestic fuel prices create second-round effects, or should the cedi come under renewed pressure. In the latter case, the mission cautioned against direct interventions that would further deplete an already low reserve cover. Subsequent to the mission, during its May meeting, the Monetary Policy Committee (MPC) raised the policy rate by 100 basis points to 16 percent.
25. The mission also advised the BoG to strengthen the implementation of the inflation-targeting framework. It welcomed the BoG’s interest in improving its liquidity management, based on a consistent and user-friendly liquidity-forecasting framework. To strengthen its policy effectiveness, the BoG should manage liquidity in a manner that results in a close alignment of market rates with its policy rate. Following the May MPC meeting, the BoG announced two welcome changes to its monetary operations to strengthen the effectiveness and signaling functioning of the policy rate: (i) a widening of the interest rate corridor by raising the upper bound to 200 basis points above the policy rate (with the lower bound remaining at 100 basis points); and (ii) introduction of a standing facility to manage liquidity more effectively in the interbank market, enhancing the transmission mechanism. Looking forward, the mission encouraged the BoG to make further improvements in the systematic use of a structural model-based inflation forecasting tool, and in communicating effectively to the public its policy decisions—including policy and forecasting mistakes—in line with best practice in IT-based monetary policy frameworks. Finally, it suggested that credibility of the IT framework would be further enhanced by setting a one- to two-year rolling inflation target, as opposed to the current end-year target, to better anchor expectations. The mission also noted that a more ambitious target could generate significant welfare gains from a lower inflation environment.
FINANCIAL SECTOR: CONTAINING VULNERABILITIES AND REMOVING STRUCTURAL CONSTRAINTS
The Bank of Ghana is focused on strengthening its regulatory and supervisory powers, in line with the 2011 FSAP recommendations, and to keep pace with new risks in the financial sector. The mission’s advice benefited from enhanced financial sector surveillance (Box 4).
26. The authorities shared the missions concerns about high interest rates pricing out profitable investment projects. While private credit has grown strongly in 2012, this has occurred from a low base. Banks’ lucrative investments in government securities have reduced their incentives to actively seek lending 0
10
20
30
40
2002 2004 2006 2008 2010
GHA WAEMU Avg KEN SSA Avg
Private Credit to GDP, 2002–2011(Percent of GDP)
Sources: World Bank, FINSTATS Database, 2013, and IMF staff estimates.

GHANA
22 INTERNATIONAL MONETARY FUND
opportunities to the private sector. The authorities fully agreed that decisive fiscal consolidation was necessary to reduce the crowding out of private investment.
27. While the banking system has grown steadily in assets and profitability, the mission cautioned about the buildup of new risks. Despite strong credit growth, the ratio of non-performing loans (NPLs) has not fallen since mid-2012, but merely stabilized at around 13 percent, and high interest rates spell risks of a renewed deterioration in banks’ credit portfolios. Moreover, strong profits from high treasury-bill rates can reduce banks’ incentives to improve efficiency,
Box 4. Enhanced Financial Sector Surveillance: Main Conclusions1
Ghana was selected as one of the pilot cases for enhancing surveillance of financial systems in low-income countries. The purpose is to go beyond the traditional surveillance focus on banking system soundness and solvency, by analyzing in more depth the interplay between financial development, macroeconomic and financial stability, and effectiveness of macroeconomic policies. The main conclusions of the study are as follows:
• While the banking system has grown rapidly and is competitive by standard metrics (barriers to entry and concentration of assets), private credit has remained relatively low as a share of GDP and access to affordable credit is a major constraint on growth.
• High real interest rates—a result of structural factors, such as high operating cost, but also excessive government borrowing—are constraining private sector access and create risks of a renewed increase in nonperforming loans (NPLs).
• An upgrading of financial sector legislation and supervisory practices is ongoing and is needed to deal with the growing complexities of an evolving financial landscape with increased foreign participation and a growing role of microfinance institutions.
• Rural and Community Banks have become a main channel for financial inclusion, though only about 30 percent of adults have an account at a formal institution. A sizeable part of the population relies instead on the services of about 600 microfinance companies, as well as 3,000-5,000 individual susu collectors that serve over half a million customers.
• The ownership role of the state, especially of the BoG, in the financial sector raises concerns about a level playing field and reputational risks to the BoG’s credibility as an independent regulator and supervisor. Risks also arise from the slow decision-making and resolution process for the two remaining weak banks.
• The BoG has the tools to conduct effective inflation targeting, but there is room to improve its forecasting and liquidity management framework to restore the signaling role of its policy rate.
• A return to fiscal discipline and effective policy coordination are needed for successful further disinflation and increased financial deepening.
__________ 1 See accompanying Supplement on Enhancing Financial Sector Surveillance.

GHANA
INTERNATIONAL MONETARY FUND 23
potentially delaying otherwise warranted consolidation and cost reduction in the industry. Overhead costs relative to total assets are already significantly above peer countries, and the cost-to-income ratio is high. While, on average, only 30 percent of banks’ income results from treasury bills, retaining profitability in some institutions may prove challenging, once the government’s high borrowing demands are reversed. Concentration is also high with large exposures to single obligors and economic sectors. In light of these risks, the BoG is encouraging banks to make effective use of the existing credit reference bureaus and was open to suggestions to raise minimum capital buffers against a future downturn.
28. Building on recent improvements in supervisory practices, the mission urged the BoG to focus on the remaining gaps and challenges identified in the 2011 FSAP.2
STAFF APPRAISAL
The BoG has greatly improved its offsite supervision, backed by enhanced risk-assessment processes. It is now focusing on strengthening its regulatory powers and standards in areas such as consolidated supervision and has requested Fund technical assistance to help address gaps and inconsistencies in the laws that constrain its ability to set and enforce prudential regulations. Further areas for improvement include deepened cross-border supervision, where the BoG has signed MoUs and begun to supervise some foreign-owned banks jointly with its relevant supervisory counterparts. Finally, while the number of weak banks has declined since the 2011 FSAP, the mission encouraged the authorities to address the risks posed by the two remaining problem banks, either through their sale or orderly liquidation, while developing contingency plans in case of further stress. This would also reduce reputational risks to the BoG’s credibility as a supervisor, arising from its ownership stake in one of the banks.
29. Despite a strong growth momentum, short-term stability risks are significant. Ghana’s strong democratic credentials and favorable prospects for oil and gas production continue to attract significant FDI. Yet, low external buffers and a rising domestic debt ratio expose the economy to risks, such as weaker terms of trade, reduced capital inflows, or unanticipated spending needs. Energy sector problems could curtail growth, while excessive domestic government borrowing is raising the cost of credit to the private sector. Both factors have been identified as key constraints to growth.
30. Ghana’s positive medium-term outlook is contingent on strong political will to confront these challenges decisively. The immediate policy priority is to safeguard stability by rebuilding fiscal and external buffers. Decisive fiscal consolidation will, in due course, also allow for a reduction in interest rates. Going forward, successful economic transformation will require a realignment of spending away from wages and subsidies toward investment in infrastructure, while structural fiscal reforms are needed to restore policy credibility and build institutional resilience to the political cycle. Ultimately, better infrastructure, improved access to credit, further investment in
2 See Appendix IV on the status of implementation of key FSAP recommendations.
GHANA
24 INTERNATIONAL MONETARY FUND
health and education, and sustained macroeconomic stability will be central for Ghana’s ambition of achieving full middle-income status and raising the living standards of all its citizens.
31. The government’s primary policy task is to reverse the large fiscal slippages of 2012. Gaining control over the wage bill is the first priority, starting with a thorough examination, already initiated by the government, of the factors that drove the spending overrun in 2012. Improvements in revenue administration and new tax measures are welcome, but much of their impact is likely to be felt only in the coming years. The announced reintroduction of the stabilization levy combined with other immediate measures will provide an important offset for early-year revenue shortfalls, but prompt action is also needed to curtail tax exemptions and bring fuel and utility prices back to full cost-recovery levels. The latter is essential not only to eliminate costly subsidies, but also to restore the financial viability of the power sector companies as a requirement for tackling Ghana’s energy problems. In the absence of additional policy measures, and assuming a delayed removal of energy subsidies, staff sees significant risks that this year’s deficit target of 9 percent of GDP will be missed.
32. The government’s deficit target of 6 percent of GDP by 2015 is achievable, but would keep public debt high and external buffers low. Staff recommends an additional fiscal adjustment of 3 percent of GDP by 2015, using a combination of revenue and expenditure measures, including a reduction in the wage bill as a share of GDP to make room for investment in critical infrastructure and social priority areas. Without the additional fiscal adjustment, Ghana’s public debt burden would likely remain high, and official reserves would continue to fall short of the authorities’ target of 4 months of imports, leaving the economy exposed to terms-of-trade shocks and destabilizing shifts in confidence.
33. Staff’s external stability assessment confirms the need for reducing recurrent government spending. Ghana’s projected medium-term current account deficit exceeds the sustainability benchmarks, suggesting an overvaluation of the real exchange rate by 13½ to 17 percent in the absence of further policy adjustment. An additional reduction in public consumption of 3-4 percent of GDP by 2017, would facilitate a reduction in the current account deficit to a sustainable level of about 4 percent of GDP, without the need for an exchange rate adjustment, while making room for increased public and private investment.
34. The monetary policy stance will need to remain tight until inflationary pressures decline and fiscal consolidation is firmly established. Both actual inflation and inflation expectations have risen recently, with upside risks from the sharp increase in government borrowing and a still positive output gap. The latest increase in the policy rate was warranted to counter inflationary pressures and should continue to be supported by active liquidity management to keep market rates appropriately tight. A further tightening of the policy stance could be warranted in the event of second-round effects from recent hikes in domestic fuel prices or renewed pressure on the cedi, while foreign reserves should be protected. Successful fiscal consolidation would provide scope for lowering interest rates in due course.
GHANA
INTERNATIONAL MONETARY FUND 25
35. The Bank of Ghana has room to improve the functioning of its inflation targeting framework. Recent decisions to raise the policy rate, combined with measures to steer market rates back into the policy corridor, are welcome and important steps to restore the policy rate’s signaling role within the inflation-targeting framework. Going forward, the BoG should manage liquidity consistently in a manner that maintains a close alignment of market rates with the policy rate, with the latter being set at a level consistent with the inflation target. The process for selecting the policy rate could be strengthen by the systematic use of a model-based inflation forecasting tool which—together with improved communication to the public—would bring the BoG closer to best practice in IT-based monetary policy frameworks. Credibility of the IT framework could be further enhanced by setting a one- to two-year inflation target to better anchor expectations, while a more ambitious target could generate significant welfare gains from a lower inflation environment.
36. The priority in the financial sector is to contain vulnerabilities and remove structural constraints. Ghana’s banking sector has grown steadily in assets and profitability, but high interest rates are pricing out profitable investment projects, while raising the risk of a renewed increase in nonperforming loans. Higher minimum capital buffers may be warranted as protection against a future downturn. The BoG has implemented important actions over the past years to improve bank supervision. It should now focus on addressing gaps and inconsistencies in the banking laws, and deepening cooperation with regional counterparts to improve the regulation and supervision of foreign banks active in Ghana. Dealing with the remaining two weak banks is also a priority, as is the divestiture of the BoG’s financial stake in banks that it supervises.
37. It is recommended that the next Article IV Consultation be held on the regular twelve-month cycle.

GHANA
26 INTERNATIONAL MONETARY FUND
Table 1. Ghana: Selected Economic and Financial Indicators, 2011–18
2011 2014 2015 2016 2017 20186-7 ECF Est.
(Annual percentage change; unless otherwise indicated)
National account and pricesGDP at constant prices 1/ 15.0 8.2 7.9 7.9 6.1 5.5 5.1 5.1 8.0Real GDP (nonoil) 9.4 8.8 7.8 5.9 6.0 5.9 5.8 5.8 5.8Real GDP per capita 12.1 4.5 5.2 5.2 3.4 2.9 2.5 2.4 5.3GDP deflator 13.0 15.3 13.3 13.7 12.8 11.1 10.3 8.8 7.4Consumer pricesConsumer price index (annual average) 8.7 9.8 9.2 10.3 9.8 8.2 7.5 7.2 7.0Consumer price index (end of period) 8.6 11.5 8.8 10.8 8.8 7.7 7.3 7.1 6.9Consumer price index (excl. food, annual average) 15.0 14.3 11.6 11.0 7.8 8.2 8.0 7.6 7.3
Money and creditNet domestic assets2 28.7 29.1 51.9 44.8 19.5 15.6 17.6 17.4 12.1Credit to the private sector2 29.0 20.1 32.9 38.4 21.7 28.0 16.7 9.0 19.2Broad money (M3, including foreign currency deposits) 32.2 34.8 24.3 27.8 23.4 20.4 19.7 19.1 18.5Velocity (GDP/M2, end of period) 3.1 3.7 3.0 2.9 2.8 2.7 2.7 2.6 2.5Base money 31.1 25.1 36.0 24.0 21.7 18.4 17.1 16.3 15.3Banks' lending rate (weighted average; percent) 25.9 … 25.7 … … … … … …Policy rate (in percent, end of period) 12.5 … 15.0 … … … … … …
National accountsGross capital formation 18.5 19.8 18.8 20.3 20.8 20.6 20.9 20.9 21.3
Government 6.2 7.8 6.8 8.2 8.7 8.8 8.9 8.9 9.3Private 12.3 12.0 12.0 12.1 12.1 11.8 12.1 12.0 12.0
National savings 9.4 10.7 6.6 8.5 11.7 11.9 12.3 12.3 13.9Government 5.5 5.6 0.3 5.2 4.9 5.1 5.3 5.4 5.8Private3 3.8 5.1 6.3 3.2 6.8 6.8 7.0 6.9 8.0
Foreign savings -9.1 -9.1 -12.2 -11.9 -9.1 -8.6 -8.6 -8.6 -7.4
External sectorCurrent account balance
(including official grants) -9.1 -9.1 -12.2 -11.9 -9.1 -8.6 -8.6 -8.6 -7.4(excluding official grants) -9.7 -9.7 -12.8 -12.4 -9.4 -9.0 -9.0 -8.9 -7.6
External public debt (including IMF) 21.0 21.5 21.9 22.5 23.5 24.5 25.7 26.9 27.5NPV of external debt outstanding 11.5 13.6 10.8 9.4 12.2 14.9 17.7 20.5 22.5
percent of exports of goods and services 30.6 36.2 26.0 26.9 36.3 46.3 57.1 67.9 71.3Gross international reserves (millions of US$) 5,383 5,517 5,349 4,927 5,645 6,579 7,407 8,324 10,139
Months of prospective imports of goods and services 2.9 2.9 2.8 2.5 2.7 3.0 3.2 3.3 3.8Total donor support (millions of US$) 1,477 1,416 1,132 1,630 1,288 1,284 1,335 1,182 1,110
percent of GDP 2.5 3.5 2.8 3.6 2.5 2.3 2.2 1.8 1.5
Central government budgetTotal revenue 17.3 18.7 17.7 19.1 19.9 20.5 20.6 20.8 21.6Grants 2.0 2.1 1.6 1.4 1.0 0.9 0.9 0.8 0.6Total expenditure 20.7 25.0 27.7 28.0 27.5 27.4 27.6 27.7 28.3Arrears clearance and VAT refunds 2.1 -2.2 0.1 0.9 0.9 -0.1 -0.1 -0.1 -0.1Overall balance (financing basis) -4.0 -6.3 -11.8 -10.0 -8.8 -6.2 -6.2 -6.2 -6.2Net domestic financing 3.3 3.7 9.3 7.1 5.8 3.2 3.1 4.2 3.1Central government debt (gross) 43.7 44.8 50.2 51.4 52.5 52.5 52.9 54.9 54.8
Domestic debt 22.8 21.1 28.3 29.0 29.0 28.0 27.2 28.1 27.3External debt 21.0 23.7 21.9 22.5 23.5 24.5 25.7 26.9 27.5
Central government debt (net) 39.9 42.4 48.0 49.5 50.5 50.5 50.7 52.6 52.1
Memorandum items:
Nominal GDP (millions of GHc) 59,816 73,919 73,109 89,689 107,335 125,800 145,743 166,573 193,204GDP per capita (millions of U.S. dollars) 1,594 1,610 1,622 1,786 1,930 2,071 2,214 2,346 2,528
Sources: Ghanaian authorities; and Fund staff estimates and projections.1 Based on new national accounts rebased to 2006, including ECF program indicators. For 2018, it is assumed that new oil fields will come to stream.2 Percent of broad money (including foreign currency deposits) at the beginning of the period. 3 Including public enterprises and errors and omissions.
(Percent of GDP)
(Percent of GDP)
2012 2013Proj.

GHANA
INTERNATIONAL MONETARY FUND 27
Table 2A. Ghana: Summary of Central Government Budgetary Operations, 2011–18
2014 2015 2016 2017 2018Prel. 6-7 ECF Prel.
Total revenue and grants 19.3 20.8 19.3 20.5 21.0 21.3 21.4 21.6 22.3Revenue 17.3 18.7 17.7 19.1 19.9 20.5 20.6 20.8 21.6
Oil revenue 1.1 1.7 1.3 1.2 1.5 1.5 1.7 1.7 2.5Nonoil revenue 16.1 17.0 16.4 17.9 18.5 18.9 18.9 19.1 19.1
Tax revenue 15.1 15.7 15.9 17.4 18.0 18.4 18.4 18.6 18.6Direct taxes 6.7 7.9 7.2 8.0 8.4 8.5 8.5 8.6 8.6Indirect taxes 6.1 5.9 5.9 6.4 6.6 6.7 6.7 6.7 6.8Trade taxes 2.5 2.8 2.7 2.9 3.0 3.1 3.2 3.3 3.2
Nontax revenue 1.0 1.2 0.5 0.5 0.5 0.5 0.5 0.5 0.5Total Grants 2.0 2.1 1.6 1.4 1.0 0.9 0.9 0.8 0.6
Project grants 0.9 1.1 0.9 0.9 0.6 0.5 0.6 0.6 0.4Program grants 0.5 0.6 0.7 0.5 0.4 0.3 0.4 0.3 0.2HIPC & MDRI assistance 0.4 0.4 0.2 0.4 0.3 0.2 0.2 0.3 0.2
Total expenditure 20.1 25.0 25.1 27.8 27.5 27.4 27.6 27.7 28.3Recurrent expenditure 14.0 15.9 18.3 19.6 18.8 18.6 18.7 18.8 19.0
Recurrent Non-interest expenditure 11.3 12.9 15.0 16.0 15.0 14.8 14.8 14.9 14.8Wages and salaries1 7.6 7.6 9.1 8.3 8.8 9.0 8.9 8.9 8.9Goods and services 1.2 1.2 1.8 1.9 1.9 1.9 1.9 1.9 2.0Transfers 1.9 3.1 2.6 5.0 3.1 2.7 2.8 2.8 2.8Reserve Fund 0.6 1.0 1.5 0.8 1.1 1.1 1.2 1.2 1.2
Interest 2.7 3.0 3.3 3.6 3.8 3.9 3.9 3.9 4.2domestic 2.2 2.3 2.6 2.9 3.1 3.3 3.1 2.9 2.9foreign 0.5 0.7 0.8 0.7 0.7 0.6 0.7 1.0 1.3
Capital Expenditure 6.2 7.8 6.8 8.2 8.7 8.8 8.9 8.9 9.3Domestic financed 3.3 3.4 3.3 4.2 4.7 4.8 4.9 5.0 5.3Foreign financed 2.9 4.4 3.5 4.0 4.0 4.0 3.9 3.9 4.0
Overall balance (before arrears) -1.0 -4.4 -6.1 -7.6 -6.6 -6.2 -6.2 -6.2 -6.2
Arrears clearance2 -2.5 -1.9 -2.4 -2.1 -2.2 0.0 0.0 0.0 0.0Deferred wage payments -0.6 -1.3 -2.6 0.0 0.0 0.0 0.0 0.0 0.0VAT refunds -0.1 -0.1 -0.2 -0.4 -0.1 -0.1 -0.1 -0.1 -0.1
Overall balance (after arrears) -4.1 -7.7 -11.0 -10.0 -8.8 -6.2 -6.2 -6.2 -6.2
Discrepancy -0.1 -1.3 0.8 0.0 0.0 0.0 0.0 0.0 0.0
Financing 4.0 6.3 11.8 10.0 8.8 6.2 6.2 6.2 6.2Divestiture receipts (net) -1.0 0.0 0.0 0.0 0.0 0.0 0.0 0.0 0.0Foreign (net) 1.4 2.4 2.4 2.7 2.9 2.9 3.1 1.9 3.0Exceptional financing (debt relief, bilateral) 0.2 0.2 0.1 0.1 0.1 0.1 0.1 0.1 0.1Domestic financing (net) 3.3 3.7 9.3 7.1 5.8 3.2 3.1 4.2 3.1
Memorandum items:Poverty-reducing expenditures 4.8 4.6 7.3 6.0 6.2 6.5 6.5 6.5 6.5Domestic arrears3
New arrears 0.5 0.0 2.1 0.0 0.0 0.0 0.0 0.0 0.0Arrears cleared4 2.3 1.9 0.6 1.3 1.0 0.0 0.0 0.0 0.0
Arrears outstanding 1.8 0.9 3.0 1.2 0.0 0.0 0.0 0.0 0.0Total government debt (gross) 43.7 44.8 50.2 51.4 52.5 52.5 52.9 54.9 54.8
Domestic debt 22.8 21.1 28.3 29.0 29.0 28.0 27.2 28.1 27.3External debt 21.0 23.7 21.9 22.5 23.5 24.5 25.7 26.9 27.5
Total government debt (net) 39.9 42.4 48.0 49.5 50.5 50.5 50.7 52.6 52.1
Sources: Ghanaian authorities; and IMF staff estimates and projections.
4 Excludes clearance of government liabilities to state-owned enterprises, includes 0.1 percent of GDP of reconciliation and 0.3 percent of GDP of securitization.
2011 2012
1Excludes deferred wage payments.2 Includes clearance of liabilities of government to state-owned enterprises. For 2012, includes carry over payments from 2011 of 1.8 percent of 2012 GDP.
2013Proj.
(In percent of GDP)
3 Excludes government liabilities to State-owned enterprises, non-cash payments and deferred wage payments.

GHANA
28 INTERNATIONAL MONETARY FUND
Table 2B. Ghana: Summary of Central Government Budgetary Operations, 2011–18
2014 2015 2016 2017 20186-7 ECF Prel.
Total revenue and grants 11,530 15,341 14,099 18,404 22,516 26,808 31,255 36,044 43,045Revenue 10,320 13,791 12,939 17,130 21,409 25,732 29,964 34,705 41,799
Oil revenue 666 1,240 970 1,098 1,565 1,940 2,445 2,910 4,912Nonoil revenue 9,654 12,551 11,969 16,033 19,845 23,791 27,519 31,795 36,887
Tax revenue 9,036 11,639 11,606 15,596 19,306 23,153 26,772 30,933 35,902Direct taxes 4,037 5,874 5,266 7,210 9,032 10,753 12,400 14,269 16,588Indirect taxes 3,667 4,324 4,350 5,767 7,067 8,486 9,759 11,219 13,093Trade taxes 1,516 2,061 1,990 2,619 3,207 3,914 4,612 5,445 6,222
Nontax revenue 618 913 363 437 539 638 747 862 985Total Grants 1,210 1,550 1,160 1,274 1,107 1,076 1,291 1,339 1,246
Project grants 523 794 648 812 657 689 891 926 814Program grants 281 436 503 465 378 396 583 500 386HIPC & MDRI assistance 242 320 146 347 279 293 308 427 428
Total expenditure 12,052 18,503 18,375 24,947 29,512 34,513 40,168 46,186 54,691Recurrent expenditure 8,348 11,723 13,404 17,571 20,155 23,457 27,266 31,376 36,731
Recurrent Non-interest expenditure 6,737 9,531 10,968 14,386 16,055 18,566 21,598 24,815 28,665Wages and salaries1 4,535 5,637 6,666 7,466 9,421 11,300 12,937 14,832 17,132Goods and services 724 897 1,322 1,742 2,091 2,376 2,750 3,184 3,820Transfers 1,148 2,289 1,908 4,451 3,348 3,458 4,116 4,729 5,348Reserve Fund 330 708 1,072 727 1,195 1,433 1,795 2,070 2,365
Interest 1,611 2,191 2,436 3,185 4,100 4,890 5,668 6,561 8,065Domestic 1,308 1,683 1,880 2,572 3,364 4,122 4,579 4,882 5,540Foreign 303 508 556 613 736 768 1,089 1,679 2,525
Capital Expenditure 3,704 5,789 4,971 7,376 9,357 11,057 12,902 14,810 17,960Domestic 1,963 2,508 2,437 3,751 5,018 5,987 7,206 8,394 10,292Foreign 1,741 3,281 2,535 3,625 4,339 5,070 5,696 6,416 7,668
Overall balance (before arrears) -611 -3,239 -4,440 -6,859 -7,122 -7,859 -9,088 -10,345 -11,882
Arrears clearance2 -1,505 -1,430 -1,755 -1,928 -2,316 0 0 0 0Deferred wage payments -343 -991 -1,872 -142 0 0 0 0 0VAT refunds -89 -77 -164 -317 -127 -153 -175 -203 -236
Overall balance (after arrears) -2,459 -5,660 -8,067 -8,929 -9,438 -7,859 -9,088 -10,345 -11,882
Discrepancy -71 -991 581 0 0 0 0 0 0
Financing 2,388 4,669 8,649 8,929 9,438 7,859 9,088 10,345 11,882Divestiture receipts (net) -572 0 0 0 0 0 0 0 0Foreign (net) 856 1,778 1,773 2,430 3,122 3,684 4,499 3,161 5,799Exceptional financing (debt relief, bilateral) 116 131 44 118 113 113 108 109 98Domestic financing (net) 1,988 2,761 6,831 6,382 6,203 4,062 4,482 7,074 5,985
Memorandum items: Nominal GDP (millions of GHc) 59,816 73,919 73,109 89,689 107,335 125,800 145,743 166,573 193,204
Poverty-reducing expenditures 2,883 3,434 5,350 5,366 6,623 8,198 9,497 10,855 12,590Domestic arrears3
New arrears 281 0 1,561 0 0 0 0 0 0Arrears cleared4 1,362 1,430 471 1,128 1,052 0 0 0 0
Arrears outstanding 1,090 655 2,180 1,052 0 0 0 0 0Total government debt (gross) 26,169 33,123 36,690 46,137 56,318 66,008 77,048 91,520 105,934
Domestic debt 13,622 15,572 20,715 25,968 31,120 35,182 39,663 46,738 52,723External debt 12,547 17,551 15,975 20,168 25,198 30,826 37,385 44,782 53,211
Total government debt (net) 23,866 31,313 35,123 44,370 54,232 63,518 73,954 87,652 100,694
Sources: Ghanaian authorities; and IMF staff estimates and projections.1 Excludes deferred wage payments.
3 Excludes liabilities to state-owned enterprises, non-cash payments, and deferred wage payments.
2011 2012 2013Proj.
(In millions of GHc, unless otherwise specified)
2 Includes clearance of government liabilities to state-owned enterprises. For 2012, includes carry over payments from 2011 of GHc 1,335 million.
4 Excludes liabilities to state-owned enterprises, includes GHc 48 million of reconciliation and GHc 203 million of securitization.
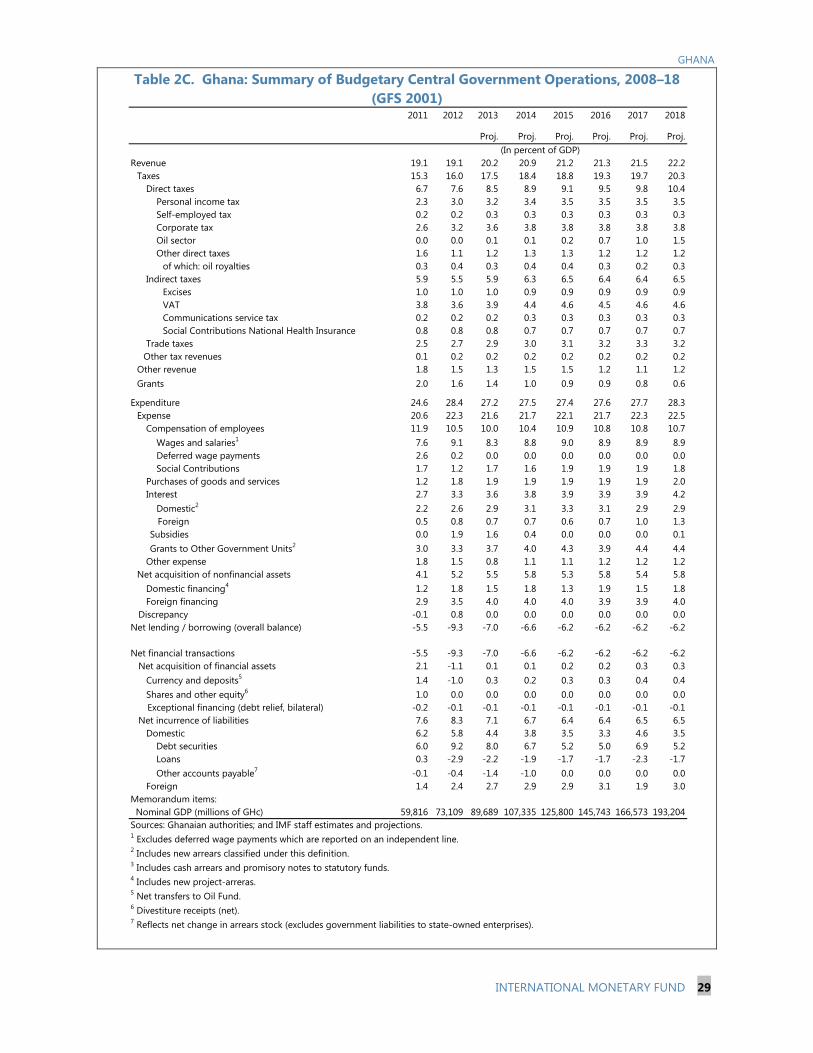
GHANA
INTERNATIONAL MONETARY FUND 29
Table 2C. Ghana: Summary of Budgetary Central Government Operations, 2008–18 (GFS 2001)
2011 2012 2013 2014 2015 2016 2017 2018
Proj. Proj. Proj. Proj. Proj. Proj.
Revenue 19.1 19.1 20.2 20.9 21.2 21.3 21.5 22.2Taxes 15.3 16.0 17.5 18.4 18.8 19.3 19.7 20.3
Direct taxes 6.7 7.6 8.5 8.9 9.1 9.5 9.8 10.4 Personal income tax 2.3 3.0 3.2 3.4 3.5 3.5 3.5 3.5
Self-employed tax 0.2 0.2 0.3 0.3 0.3 0.3 0.3 0.3Corporate tax 2.6 3.2 3.6 3.8 3.8 3.8 3.8 3.8Oil sector 0.0 0.0 0.1 0.1 0.2 0.7 1.0 1.5Other direct taxes 1.6 1.1 1.2 1.3 1.3 1.2 1.2 1.2
of which: oil royalties 0.3 0.4 0.3 0.4 0.4 0.3 0.2 0.3 Indirect taxes 5.9 5.5 5.9 6.3 6.5 6.4 6.4 6.5
Excises 1.0 1.0 1.0 0.9 0.9 0.9 0.9 0.9VAT 3.8 3.6 3.9 4.4 4.6 4.5 4.6 4.6Communications service tax 0.2 0.2 0.2 0.3 0.3 0.3 0.3 0.3Social Contributions National Health Insurance 0.8 0.8 0.8 0.7 0.7 0.7 0.7 0.7
Trade taxes 2.5 2.7 2.9 3.0 3.1 3.2 3.3 3.2Other tax revenues 0.1 0.2 0.2 0.2 0.2 0.2 0.2 0.2
Other revenue 1.8 1.5 1.3 1.5 1.5 1.2 1.1 1.2Grants 2.0 1.6 1.4 1.0 0.9 0.9 0.8 0.6
Expenditure 24.6 28.4 27.2 27.5 27.4 27.6 27.7 28.3Expense 20.6 22.3 21.6 21.7 22.1 21.7 22.3 22.5
Compensation of employees 11.9 10.5 10.0 10.4 10.9 10.8 10.8 10.7 Wages and salaries1 7.6 9.1 8.3 8.8 9.0 8.9 8.9 8.9 Deferred wage payments 2.6 0.2 0.0 0.0 0.0 0.0 0.0 0.0
Social Contributions 1.7 1.2 1.7 1.6 1.9 1.9 1.9 1.8 Purchases of goods and services 1.2 1.8 1.9 1.9 1.9 1.9 1.9 2.0 Interest 2.7 3.3 3.6 3.8 3.9 3.9 3.9 4.2 Domestic2 2.2 2.6 2.9 3.1 3.3 3.1 2.9 2.9
Foreign 0.5 0.8 0.7 0.7 0.6 0.7 1.0 1.3Subsidies 0.0 1.9 1.6 0.4 0.0 0.0 0.0 0.1Grants to Other Government Units2 3.0 3.3 3.7 4.0 4.3 3.9 4.4 4.4
Other expense 1.8 1.5 0.8 1.1 1.1 1.2 1.2 1.2Net acquisition of nonfinancial assets 4.1 5.2 5.5 5.8 5.3 5.8 5.4 5.8
Domestic financing4 1.2 1.8 1.5 1.8 1.3 1.9 1.5 1.8 Foreign financing 2.9 3.5 4.0 4.0 4.0 3.9 3.9 4.0
Discrepancy -0.1 0.8 0.0 0.0 0.0 0.0 0.0 0.0Net lending / borrowing (overall balance) -5.5 -9.3 -7.0 -6.6 -6.2 -6.2 -6.2 -6.2
Net financial transactions -5.5 -9.3 -7.0 -6.6 -6.2 -6.2 -6.2 -6.2 Net acquisition of financial assets 2.1 -1.1 0.1 0.1 0.2 0.2 0.3 0.3 Currency and deposits5 1.4 -1.0 0.3 0.2 0.3 0.3 0.4 0.4 Shares and other equity6 1.0 0.0 0.0 0.0 0.0 0.0 0.0 0.0
Exceptional financing (debt relief, bilateral) -0.2 -0.1 -0.1 -0.1 -0.1 -0.1 -0.1 -0.1 Net incurrence of liabilities 7.6 8.3 7.1 6.7 6.4 6.4 6.5 6.5 Domestic 6.2 5.8 4.4 3.8 3.5 3.3 4.6 3.5
Debt securities 6.0 9.2 8.0 6.7 5.2 5.0 6.9 5.2Loans 0.3 -2.9 -2.2 -1.9 -1.7 -1.7 -2.3 -1.7Other accounts payable7 -0.1 -0.4 -1.4 -1.0 0.0 0.0 0.0 0.0
Foreign 1.4 2.4 2.7 2.9 2.9 3.1 1.9 3.0Memorandum items: Nominal GDP (millions of GHc) 59,816 73,109 89,689 107,335 125,800 145,743 166,573 193,204Sources: Ghanaian authorities; and IMF staff estimates and projections.1 Excludes deferred wage payments which are reported on an independent line.2 Includes new arrears classified under this definition.3 Includes cash arrears and promisory notes to statutory funds.4 Includes new project-arreras.5 Net transfers to Oil Fund.6 Divestiture receipts (net).7 Reflects net change in arrears stock (excludes government liabilities to state-owned enterprises).
(In percent of GDP)

GHANA
30 INTERNATIONAL MONETARY FUND
Table 2D. Ghana: Summary of Budgetary Central Government Operations, 2008–18 (GFS 2001)
2011 2012 2013 2014 2015 2016 2017 2018Proj. Proj. Proj. Proj. Proj. Proj.
Revenue 11,441 13,935 18,087 22,390 26,654 31,080 35,841 42,809Taxes 9,131 11,712 15,663 19,726 23,678 28,109 32,744 39,209
Direct taxes 4,037 5,536 7,594 9,579 11,431 13,912 16,283 20,131 Personal income tax 1,361 2,204 2,893 3,655 4,362 5,110 5,891 6,831
Self-employed tax 132 164 248 299 372 414 478 637Corporate tax 1,568 2,362 3,241 4,083 4,834 5,538 6,330 7,342Oil sector 0 0 108 153 190 1,087 1,605 2,916Other direct taxes 975 806 1,103 1,390 1,673 1,763 1,980 2,405
of which: oil royalties 184 270 277 394 488 425 409 627 Indirect taxes 3,500 4,048 5,280 6,762 8,121 9,337 10,731 12,530
Excises 606 730 904 966 1,144 1,340 1,465 1,765VAT 2,287 2,614 3,470 4,753 5,742 6,551 7,598 8,859Communications service tax 135 128 151 279 330 387 446 509Social Contributions National Health Insurance 472 576 754 765 905 1,060 1,222 1,397
Trade taxes 1,516 1,990 2,619 3,207 3,914 4,612 5,445 6,222Other tax revenues 79 138 170 179 211 248 285 326
Other revenue 1,100 1,062 1,151 1,557 1,900 1,681 1,758 2,354Grants 1,210 1,160 1,274 1,107 1,076 1,291 1,339 1,246
Expenditure 14,710 20,752 24,361 29,512 34,513 40,168 46,186 54,691Expense 12,339 16,336 19,416 23,272 27,863 31,681 37,201 43,541
Compensation of employees 7,106 7,683 9,004 11,163 13,693 15,692 17,996 20,595 Wages and salaries1 4,535 6,666 7,466 9,421 11,300 12,937 14,832 17,132 Deferred wages 1,558 142 0 0 0 0 0 0
Social Contributions 1,013 876 1,538 1,742 2,393 2,755 3,163 3,462 Purchases of goods and services 724 1,322 1,742 2,091 2,376 2,750 3,184 3,820 Interest 1,611 2,436 3,185 4,100 4,890 5,668 6,561 8,065 Domestic2 1,308 1,880 2,572 3,364 4,122 4,579 4,882 5,540
Foreign 303 556 613 736 768 1,089 1,679 2,525Subsidies2 0 1,395 1,403 443 48 53 58 163Grants to Other Government Units2 1,820 2,428 3,355 4,281 5,423 5,722 7,333 8,533
Other expense 1,078 1,072 727 1,195 1,433 1,795 2,070 2,365 Reserve Fund 330 1,072 727 1,195 1,433 1,795 2,070 2,365
Net acquisition of nonfinancial assets 2,442 3,834 4,945 6,239 6,650 8,487 8,985 11,150 Domestic financing4 701 1,300 1,320 1,900 1,580 2,792 2,569 3,482 Foreign financing 1,741 2,535 3,625 4,339 5,070 5,696 6,416 7,668
Discrepancy -71 581 0 0 0 0 0 0Net lending / borrowing (overall balance) -3,269 -6,817 -6,273 -7,122 -7,859 -9,088 -10,345 -11,882
Net financial transactions -3,269 -6,817 -6,273 -7,122 -7,859 -9,088 -10,345 -11,882 Net acquisition of financial assets 1,273 -781 108 86 204 291 480 633 Currency and deposits5 817 -736 226 200 317 398 589 732 Shares and other equity6 572 0 0 0 0 0 0 0
Exceptional financing (debt relief, bilateral) -116 -44 -118 -113 -113 -108 -109 -98 Net incurrence of liabilities 4,542 6,036 6,382 7,208 8,063 9,378 10,825 12,516 Domestic 3,686 4,263 3,952 4,087 4,379 4,880 7,664 6,717
Debt securities 3,561 6,694 7,173 7,157 6,542 7,290 11,449 10,035Loans 157 -2,105 -1,952 -2,018 -2,163 -2,410 -3,785 -3,318Other accounts payable7 -32 -326 -1,270 -1,052 0 0 0 0
Foreign 856 1,773 2,430 3,122 3,684 4,499 3,161 5,799
Memorandum items: Nominal GDP (millions of GHc) 59,816 73,109 89,689 107,335 125,800 145,743 166,573 193,204Sources: Ghanaian authorities; and IMF staff estimates and projections.1 Excludes deferred wage payments which are reported on an independent line.2 Includes new arrears classified under this definition.3 Includes cash arrears and promisory notes to statutory funds.4 Includes new project-arreras.5 Net transfers to Oil Fund.6 Divestiture receipts (net).7 Reflects net change in arrears stock (excludes government liabilities to state-owned enterprises).
(Millions of GHc, unless otherwise specified)

GHANA
INTERNATIONAL MONETARY FUND 31
Table 3. Ghana: Monetary Survey, 2011–18
2013Q1 2013 2014 2015 2016 2017 2018Prel. 6-7 ECF Prel. Prel. Proj.
Net foreign assets 7,880 11,202 6,953 6,483 6,225 8,572 11,627 14,581 18,011 24,135
Net Domestic Assets 10,315 13,323 15,665 16,508 22,676 27,101 31,340 36,841 43,252 48,480 Domestic Claims 15,675 14,897 22,628 24,862 28,780 33,809 40,493 45,908 50,222 56,619 Net Claims on Central Government 5,181 2,696 7,735 9,105 9,011 10,252 11,064 11,960 13,375 13,375 Claims on Other Sectors 10,494 12,201 14,893 15,757 19,769 23,558 29,429 33,948 36,847 43,244 Claims on Other Financial Corporations -7 0 -12 -18 0 … … … … … Claims on State and Local Government 0 0 0 0 0 … … … … … Claims on Public Non-financial Corporations 1,351 1,209 2,743 2,907 1,793 1,932 2,076 2,223 -6,970 -8,140 Claims on Private Sector 9,150 10,992 12,161 12,868 16,830 20,479 26,207 30,578 33,324 39,721 Other Items (Net) -5,360 -1,574 -6,963 -8,354 -6,104 -6,708 -9,153 -9,067 -6,970 -8,140
Money and quasi-money (M3) 18,195 24,525 22,618 22,991 28,901 35,673 42,967 51,422 61,263 72,615Broad money (M2) 14,241 18,701 17,501 17,481 21,990 26,773 31,698 37,128 43,174 49,765Foreign exchange deposits 3,954 5,824 5,117 5,510 6,911 8,901 11,269 14,295 18,089 22,850
Net foreign assets 6,670 8,544 5,781 5,832 5,709 7,759 10,553 13,321 16,525 22,406
Net domestic assets -890 -1,352 2,079 1,596 4,037 4,106 3,495 3,134 2,609 -351 Net Domestic Claims 297 -1,746 3,588 3,904 6,515 6,584 5,973 5,612 5,088 2,127
Claims on Other Depository Corporations -2,299 -5,230 -2,305 -2,640 -1,697 -1,448 81 -700 -3,817 -5,689 Net Claims on Central Government 1,943 2,761 4,140 4,695 6,382 6,203 4,062 4,482 7,074 5,985
Claims on Other Sectors2 653 724 1,754 1,849 1,830 1,830 1,830 1,830 1,830 1,830Other Items (Net)3 -1,187 394 -1,509 -2,308 -2,478 -2,478 -2,478 -2,478 -2,478 -2,478
Base money 5,780 7,193 7,860 7,428 9,746 11,865 14,048 16,454 19,134 22,055Currency In Circulation (net of cash in vaults) 3,763 4,838 4,919 4,502 6,087 7,514 9,122 11,050 13,181 15,720Liabilities To Other Depository Corporations 1,840 2,178 2,678 2,844 3,384 4,075 4,650 5,129 5,678 6,059 Required Reserves 1,283 … … … … … … … … … Excess Reserves 553 … … … … … … … … …Liabilities To Other Sectors 176 176 275 268 275 275 275 275 275 275
Memorandum items:
Base money 31.1 24.5 36.0 47.3 24.0 21.7 18.4 17.1 16.3 15.3M3 32.2 34.8 24.3 24.3 27.8 23.4 20.4 19.7 19.1 18.5Credit to the private sector 29.0 20.1 32.9 31.4 38.4 21.7 28.0 16.7 9.0 19.2M3-to-GDP ratio (in percent) 30.4 33.2 30.9 25.3 32.2 33.2 34.2 35.3 36.8 37.6Base money multiplier (M2/base money) 2.5 2.6 2.2 2.4 2.3 2.3 2.3 2.3 2.3 2.3Credit to the private sector (in percent of GDP) 15.3 14.9 16.6 14.2 18.8 19.1 20.8 21.0 20.0 20.6
Sources: Ghanaian authorities; and Fund staff estimates and projections.1 End of period.2 Include public enterprises and the local government.3 Including valuation.
(In 12-month percentage change; unless otherwise indicated)
II. Central Bank
(In millions of GHc, unless otherwise indicated)
I. Depository Corporation Survey
2011 2012

GHANA
32 INTERNATIONAL MONETARY FUND
Table 4. Ghana: Balance of Payments, 2011–18
2013 2014 2015 2016 2017 20186-7 ECF Prel.
Current account -3,541 -3,651 -4,924 -5,424 -4,581 -4,811 -5,251 -5,728 -5,459
Trade balance -3,052 -2,561 -4,220 -5,279 -4,631 -4,905 -5,479 -6,011.7 -5,293Exports, f.o.b. 12,785 14,814 13,543 13,231 14,284 15,136 15,993 17,010 19,978Imports, f.o.b -15,838 -17,375 -17,763 -18,510 -18,915 -20,041 -21,472 -23,022 -25,271
Of which: oil -3,165 -3,100 -3,331 -3,500 -3,221 -3,262 -3,341 -3,469 -3,621 Services (net) -1,856 -1,928 -977 -1,794 -1,912 -1,872 -1,829 -1,782 -2,086
Income (net) -1,230 -1,497 -2,132 -1,137 -997 -1,216 -1,424 -1,583 -1,525
Of which: interest on public debt -223 -355 -224 -719 -279 -358 -468 -642 -773
Transfers 2,597 2,335 2,405 2,786 2,960 3,182 3,480 3,649 3,445Official transfers 229 237 258 237 178 175 244 199 147Other transfers 2,369 2,098 2,148 2,549 2,782 3,007 3,236 3,450 3,299
Capital and financial account 4,954 3,546 3,597 5,036 5,333 5,813 6,152 6,711 7,340
Capital account 445 431 283 235 212 171 168 164 164
Financial account 4,509 3,115 3,313 4,801 5,121 5,642 5,984 6,547 7,176Foreign direct investment (net) 3,222 3,124 3,293 3,342 3,440 3,786 4,152 4,511 4,984Portfolio investment (net) 118 210 1,122 476 506 557 427 464 513Other investment (net) 1,169 -219 -1,102 984 1,175 1,299 1,405 1,571 1,678
Medium and long term (net) 766 916 736 1,228 1,323 1,501 1,766 1,903 2,091Short-term (net) 404 -1,135 -1,695 -205 -148 -203 -361 -332 -413
Errors and omissions -894 0 116 0 0 0 0 0 0
Overall balance 519 -105 -1,211 -387 752 1,002 901 983 1,880
Net international reserves (-, incr.) -519 105 1,211 387 -752 -1,002 -901 -983 -1,880
Memorandum items:
Current account -9.1 -9.1 -12.2 -11.9 -9.1 -8.6 -8.6 -8.6 -7.4Trade Balance -7.9 -6.4 -10.4 -11.6 -9.2 -8.8 -9.0 -9.1 -7.2Capital and Financial Account 12.8 8.8 8.9 11.0 10.5 10.4 10.1 10.1 10.0Overall Balance 1.3 -0.3 -3.0 -0.8 1.5 1.8 1.5 1.5 2.6Official grants 0.6 0.6 0.6 0.5 0.4 0.3 0.4 0.3 0.2
Gross International Reserves(in millions of U.S. dollars) 5,383 5,517 5,349 4,927 5,645 6,579 7,407 8,324 10,139Months of imports 2.9 2.9 2.8 2.5 2.7 3.0 3.2 3.3 3.8
Sources: Ghanaian authorities; and Fund staff estimates and projections.
Proj.
(In millions of U.S. dollars)
(Percent of GDP)
2011 2012

GHANA
INTERNATIONAL MONETARY FUND 33
Table 5. Ghana: Financial Soundness Indicators, 2007–12
2007 2008 2009 2010 2011 2012Dec
Capital adequacy: Regulatory capital ratio 15.7 13.8 18.2 19.1 17.4 18.6Regulatory tier 1 capital ratio 13.6 12.8 17.0 18.6 15.5 16.4
Asset quality:Nonperforming loans to total gross loans 6.9 7.7 16.2 17.6 14.1 13.2Credit to total assets 50.3 52.3 43.8 40.1 37.8 42.9Loan provision to Gross loan 4.7 6.3 9.4 9.4 7.7 6.4Bank Provisions to NPLs … … 68.7 70.6 76.2 77.9
Earnings and profitability:Return on assets, before taxes (average) 3.3 3.7 2.8 3.8 3.9 4.8Return on equity, before taxes (average) 3.7 23.7 2.1 2.7 2.8 3.6
Interest margin to gross income 46.1 41.3 39.4 50.1 46.8 48.5 Interest spread1 18.3 20.8 25.9 22.7 22.2 21.4
Liquidity: Core liquid assets to total assets ratio 23.3 25.2 26.3 25.3 27.8 24.1 Broad liquid assets to total assets ratio 40.7 39.4 47.2 51.3 54.9 51.0 Core liquid assets to short-term liabilities ratio 31.3 33.5 34.5 32.9 35.3 30.7 Broad liquid assets to short-term liabilities ratio 54.7 52.4 62.0 66.6 69.6 64.8
Exposure to foreign exchange risk: Share of foreign currency deposits in total deposits 22.3 28.4 32.7 25.4 27.4 28.9 Share of foreign liabilities in total liabilities 8.1 7.0 6.2 4.7 3.4 3.5
Source: Bank of Ghana.1 Average lending rate minus average (saving and demand) deposit rate.

GHANA
34 INTERNATIONAL MONETARY FUND
Appendix I: Risk Assessment Matrix1
Nature/Source of Main Threats
Likelihood of Severe Realization of Threats in the Next 1–3 Years
(high, medium or low)
Impact if Realized (high, medium or low)
1. Delayed fiscal adjustment
Medium • The fiscal adjustment in 2013 falls significantly short of the budget target.
• Opposition from politically important groups could make it difficult for the new government to significantly reduce current spending, such as wages and energy subsidies.
High
• Stronger domestic demand could renew inflationary pressures and prompt cedi depreciation, requiring the central bank to increase already high interest rates.
• High real domestic interest rates could increase the fiscal debt service, create risks to banks’ loan portfolios, and reduce funding available for the private sector, hurting growth.
• Continued subsidies could further undermine the financial viability of energy-sector SOEs.
• Debt dynamics could worsen, further reducing capacity to handle shocks given thin fiscal buffers
2. Sudden stop or reversal of capital inflows
Medium • The large 2012 deficit was primarily financed by domestic debt, and the 2013 budget assumes a continued heavy reliance on domestic financing.
• As of end-2012, 30 percent of domestic debt was held by non-residents, putting the economy at risk of a sudden stop or reversal of capital inflows.
Medium
• Foreign reserve cover remains thin at less than 3 months of imports. If nonresidents decided to roll over only 50 percent of their existing bond holdings, reserves would drop by $1.4 billion (about one month of imports).
• Significant currency depreciation could reignite inflationary pressures and raise the cost of foreign debt service.
1 The RAM shows relatively low probability events that could materially alter the baseline discussed in this report. The relative likelihood of risks listed is the staff’s subjective assessment of risks surrounding this baseline.

GHANA
INTERNATIONAL MONETARY FUND 35
Nature/Source of Main Threats
Likelihood of Severe Realization of
Threats in the Next 1–3 Years (high, medium or low)
Impact if Realized (high, medium or low)
3. Protracted slowdown in external demand and lower terms of trade
Medium • The current account deficit has widened to 12 percent of GDP, despite strong terms of trade.
Medium
• A further increase in the current account deficit would weaken the already low reserve buffer.
• A fall in commodity prices, in particular gold or cocoa, could result in a sharp contraction of exports—though part of this would be offset by lower profit and dividend payments.
• Significant currency depreciation could reignite inflationary pressures and raise the cost of foreign debt service.
4. Spike in domestic prices
Medium • Inflationary pressures are understated by temporarily low dynamics in food prices and unsustainable government subsidies that keep energy prices below market levels.
Low
• Higher inflation from rising energy and food prices could require a further monetary policy tightening to prevent second-round effects, raising funding costs for the government.
• A generalized increase in inflation would disproportionately affect lower income groups.

GHANA
36 INTERNATIONAL MONETARY FUND
Appendix II: Inclusive Growth Successes and Challenges1
Ghana has experienced strong and broadly inclusive growth over the last 20 years, defined as growth that raises the income of most or all in society, including the poorest groups. Significant progress in poverty reduction has been achieved as well as the establishment of a highly rated governance and business environment. Growth over the medium term will depend more heavily on extractive industries, which will need to be complemented by diversified, private sector-led growth, particularly in more labor-intensive industries. This note reviews past successes and focuses on three major challenges: access to credit, energy infrastructure, and growth in labor-intensive sectors. In all three areas current macroeconomic challenges constrain the government’s ability to promote robust, inclusive growth. Fiscal consolidation followed by policies targeted at these critical issues will be crucial for Ghana to advance to full middle-income status while creating 6–7 million quality jobs in the next 20 years.
Background
1. Ghana has experienced strong per capita GDP growth over the last 20 years, consistently outperforming Sub-Saharan Africa and the world. Growth has accelerated over the last 5 years, with strong performance in 2011, in particular, due to investment in oil extraction. This growth experience has recently vaulted the country into lower-middle income status. Yet over the same two decades middle-income countries as a group have experienced even stronger performance, suggesting that the government’s objective of achieving full middle-income status will require sustained improvements in growth over the medium term.
1 Prepared by Kevin Wiseman.
-2.0
-1.0
0.0
1.0
2.0
3.0
4.0
5.0
6.0
1993 1996 1999 2002 2005 2008 2011Per C
apita
GD
P G
row
th (1
0 ye
ar ro
lling
ave
rage
, PPP
)
Middle income Sub-Saharan Africa World Ghana
Per Capita Growth
Sources: World Bank, World Development Indicators, 2013; Staff estimates.
0
1000
2000
3000
4000
5000
6000
7000
GD
P pe
r ca
pita
, PPP
1990 2011
Per Capita GDP
Sources: World Bank, World Development Indicators, 2013.
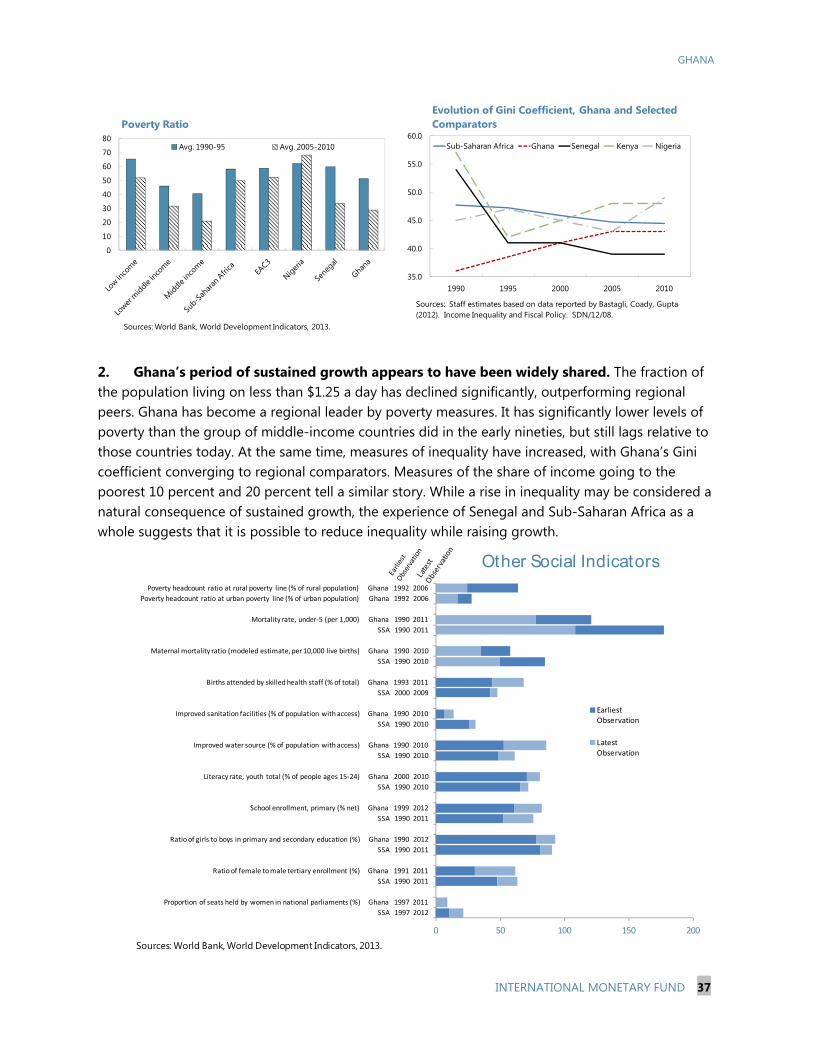
GHANA
INTERNATIONAL MONETARY FUND 37
0 50 100 150 200
SSA 1997 2012
Proportion of seats held by women in national parliaments (%) Ghana 1997 2011
SSA 1990 2011
Ratio of female to male tertiary enrollment (%) Ghana 1991 2011
SSA 1990 2011
Ratio of girls to boys in primary and secondary education (%) Ghana 1990 2012
SSA 1990 2011
School enrollment, primary (% net) Ghana 1999 2012
SSA 1990 2010
Literacy rate, youth total (% of people ages 15-24) Ghana 2000 2010
SSA 1990 2010
Improved water source (% of population with access) Ghana 1990 2010
SSA 1990 2010
Improved sanitation facilities (% of population with access) Ghana 1990 2010
SSA 2000 2009
Births attended by skilled health staff (% of total) Ghana 1993 2011
SSA 1990 2010
Maternal mortality ratio (modeled estimate, per 10,000 live births) Ghana 1990 2010
SSA 1990 2011
Mortality rate, under-5 (per 1,000) Ghana 1990 2011
Poverty headcount ratio at urban poverty line (% of urban population) Ghana 1992 2006
Poverty headcount ratio at rural poverty line (% of rural population) Ghana 1992 2006
Earliest Observation
Latest Observation
Other Social Indicators
Sources: World Bank, World Development Indicators, 2013.
2. Ghana’s period of sustained growth appears to have been widely shared. The fraction of the population living on less than $1.25 a day has declined significantly, outperforming regional peers. Ghana has become a regional leader by poverty measures. It has significantly lower levels of poverty than the group of middle-income countries did in the early nineties, but still lags relative to those countries today. At the same time, measures of inequality have increased, with Ghana’s Gini coefficient converging to regional comparators. Measures of the share of income going to the poorest 10 percent and 20 percent tell a similar story. While a rise in inequality may be considered a natural consequence of sustained growth, the experience of Senegal and Sub-Saharan Africa as a whole suggests that it is possible to reduce inequality while raising growth.
0
10
20
30
40
50
60
70
80Avg. 1990-95 Avg. 2005-2010
Poverty Ratio
Sources: World Bank, World Development Indicators, 2013.
35.0
40.0
45.0
50.0
55.0
60.0
1990 1995 2000 2005 2010
Sub-Saharan Africa Ghana Senegal Kenya Nigeria
Evolution of Gini Coefficient, Ghana and Selected Comparators
Sources: Staff estimates based on data reported by Bastagli, Coady, Gupta (2012). Income Inequality and Fiscal Policy. SDN/12/08.
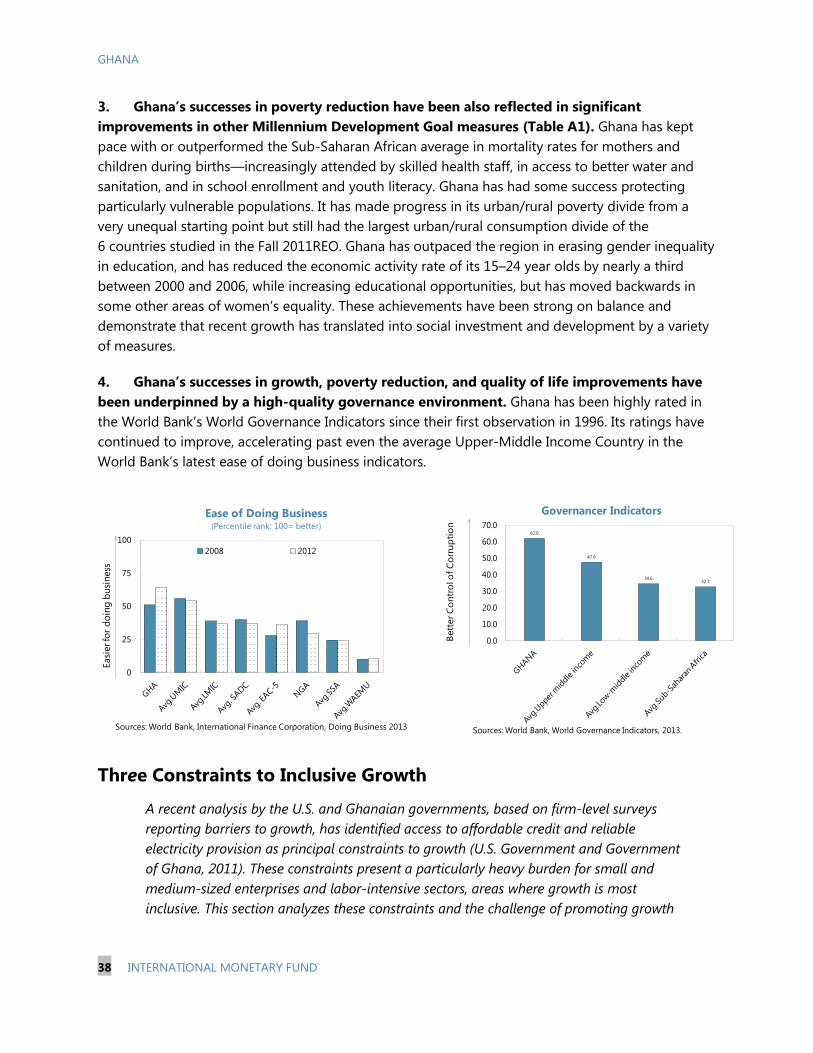
GHANA
38 INTERNATIONAL MONETARY FUND
3. Ghana’s successes in poverty reduction have been also reflected in significant improvements in other Millennium Development Goal measures (Table A1). Ghana has kept pace with or outperformed the Sub-Saharan African average in mortality rates for mothers and children during births—increasingly attended by skilled health staff, in access to better water and sanitation, and in school enrollment and youth literacy. Ghana has had some success protecting particularly vulnerable populations. It has made progress in its urban/rural poverty divide from a very unequal starting point but still had the largest urban/rural consumption divide of the 6 countries studied in the Fall 2011REO. Ghana has outpaced the region in erasing gender inequality in education, and has reduced the economic activity rate of its 15–24 year olds by nearly a third between 2000 and 2006, while increasing educational opportunities, but has moved backwards in some other areas of women’s equality. These achievements have been strong on balance and demonstrate that recent growth has translated into social investment and development by a variety of measures.
4. Ghana’s successes in growth, poverty reduction, and quality of life improvements have been underpinned by a high-quality governance environment. Ghana has been highly rated in the World Bank’s World Governance Indicators since their first observation in 1996. Its ratings have continued to improve, accelerating past even the average Upper-Middle Income Country in the World Bank’s latest ease of doing business indicators.
Three Constraints to Inclusive Growth
A recent analysis by the U.S. and Ghanaian governments, based on firm-level surveys reporting barriers to growth, has identified access to affordable credit and reliable electricity provision as principal constraints to growth (U.S. Government and Government of Ghana, 2011). These constraints present a particularly heavy burden for small and medium-sized enterprises and labor-intensive sectors, areas where growth is most inclusive. This section analyzes these constraints and the challenge of promoting growth
62.0
47.6
34.632.7
0.0
10.0
20.0
30.0
40.0
50.0
60.0
70.0
Bett
er C
ontr
ol o
f Cor
rupt
ion
Governancer Indicators
Sources: World Bank, World Governance Indicators, 2013.
0
25
50
75
100
Easi
er fo
r doi
ng b
usin
ess
2008 2012
Ease of Doing Business(Percentile rank; 100= better)
Sources: World Bank, International Finance Corporation, Doing Business 2013

GHANA
INTERNATIONAL MONETARY FUND 39
in employment-producing sectors, and suggests policies which can ensure that growth in Ghana continues to be broad-based and robust.
A. Improving Access to Credit
5. Access to affordable credit in Ghana is significantly constrained in spite of good governance indicators. The lending-deposit spread in Ghana is large relative to comparator countries and persistent over time. On one hand, the real return to savings is negative, leaving domestic savings well below that of countries with less developed financial markets. On the other hand, high real borrowing rates suppresses private sector credit which is also underdeveloped relative to similar and even less developed markets.
6. The banking system is relatively well developed, as measured by financial access. Ghana’s banking system had more bank accounts and branches per capita than the regional average in 2010, and more than its income level and other structural indicators would suggest according to the World Bank’s FINSTATS data. Nevertheless, it has fallen behind Kenya by these measures since 2005 and trails Nigeria by a significant margin. While Rural and Community Banks have become a key channel for financial inclusion in Ghana, only about 30 percent of adults have an account at a formal institution. A sizeable part of the population relies instead on the services of about 600 microfinance companies, as well as 3,000–5,000 individual susu collectors that serve over half a million customers.2
7. A strong institutional ranking and increased competition have not delivered cheaper financial intermediation or reduced bank profitability. Ghana is ranked 23rd in the world and 4th in Sub-Saharan Africa in the World Bank’s Access to Credit ranking in its Doing Business Indicators. The high ranking is due importantly to its establishment of a credit rating agency covering 5.7 percent of adults. According to the most recent FSAP the use of this information by lenders is in
Country comparisons of firms’ access to financial services provide a similarly mixed picture; Ghana has slightly more firms with access to credit than the benchmark predicts, but fewer small firms.
2 See Supplement on Enhancing Financial Sector Surveillance for a discussion of the different institutions, their purposes, and associated challenges.
0
4
8
12
16
20
Ghana Kenya Zambia Lower-Middle Income
Sub-Saharan Africa
Lending-Deposit Spread
Sources: World Bank, FINSTATS Database, 2013; IMF staff calculations.
0
5
10
15
20
25
30
35 Base Lending Rate Savings Deposit Rate
Spread
Lending-Deposit Spread
Source: Bank of Ghana.
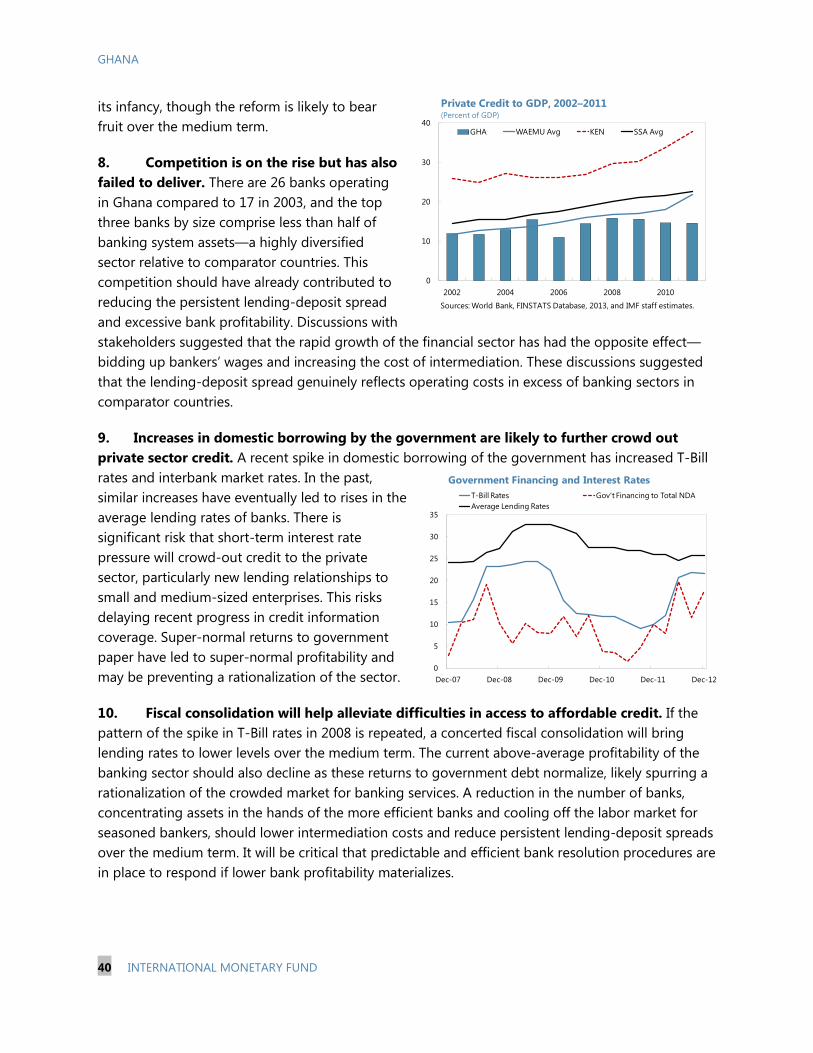
GHANA
40 INTERNATIONAL MONETARY FUND
its infancy, though the reform is likely to bear fruit over the medium term.
8. Competition is on the rise but has also failed to deliver. There are 26 banks operating in Ghana compared to 17 in 2003, and the top three banks by size comprise less than half of banking system assets—a highly diversified sector relative to comparator countries. This competition should have already contributed to reducing the persistent lending-deposit spread and excessive bank profitability. Discussions with stakeholders suggested that the rapid growth of the financial sector has had the opposite effect—bidding up bankers’ wages and increasing the cost of intermediation. These discussions suggested that the lending-deposit spread genuinely reflects operating costs in excess of banking sectors in comparator countries.
9. Increases in domestic borrowing by the government are likely to further crowd out private sector credit. A recent spike in domestic borrowing of the government has increased T-Bill rates and interbank market rates. In the past, similar increases have eventually led to rises in the average lending rates of banks. There is significant risk that short-term interest rate pressure will crowd-out credit to the private sector, particularly new lending relationships to small and medium-sized enterprises. This risks delaying recent progress in credit information coverage. Super-normal returns to government paper have led to super-normal profitability and may be preventing a rationalization of the sector.
10. Fiscal consolidation will help alleviate difficulties in access to affordable credit. If the pattern of the spike in T-Bill rates in 2008 is repeated, a concerted fiscal consolidation will bring lending rates to lower levels over the medium term. The current above-average profitability of the banking sector should also decline as these returns to government debt normalize, likely spurring a rationalization of the crowded market for banking services. A reduction in the number of banks, concentrating assets in the hands of the more efficient banks and cooling off the labor market for seasoned bankers, should lower intermediation costs and reduce persistent lending-deposit spreads over the medium term. It will be critical that predictable and efficient bank resolution procedures are in place to respond if lower bank profitability materializes.
0
10
20
30
40
2002 2004 2006 2008 2010
GHA WAEMU Avg KEN SSA Avg
Private Credit to GDP, 2002–2011(Percent of GDP)
Sources: World Bank, FINSTATS Database, 2013, and IMF staff estimates.
0
5
10
15
20
25
30
35
Dec-07 Dec-08 Dec-09 Dec-10 Dec-11 Dec-12
T-Bill Rates Gov't Financing to Total NDAAverage Lending Rates
Government Financing and Interest Rates

GHANA
INTERNATIONAL MONETARY FUND 41
B. Improving the Quantity and Quality of Energy Supply
11. Ghana’s infrastructure deficit, and in particular the quantity and reliability of energy supply, has been identified as another major constraint on growth. Entrepreneurs report that unreliable energy supply, the high cost of private generators, and the uncertain future of energy providers is a major concern in investment decisions. These concerns are most acute in sectors which contribute heavily to job growth—manufacturing and downstream agricultural transformation. The government faces significant operational challenges to meet its goal of generating 5,000 Mw by 2016.
12. The financial situation of energy providers is preventing necessary maintenance and additional investment. Reluctance to raise electricity prices to cost-recovery levels, along with relatively high commercial and technical losses in the distribution network, have led the state energy companies to record regular operational losses. The energy production sector is under further temporary strain from the disruption in delivery of natural gas from Nigeria through the West African Gas Pipeline, increasing the share of petroleum-based production at double the marginal cost. The pipeline is expected to resume delivery shortly, but additional energy production slated to come online is facing delays and may not be sufficient to meet growing demand. While raising electricity prices is difficult in an environment of deteriorating delivery, the sector is currently unable to maintain current infrastructure, much less ramp up investment to expand production. Shoring up the financial situation of the ECG and VRA (the state-owned distributor and producer of power, respectively) is a prerequisite to improving the operational efficiency of these bodies.
13. Further investments in new energy production will be necessary to keep pace with demand. Ghana’s dynamic economy is expanding rapidly, and energy output will need to grow by an estimated 200–250 MW/year to match production growth, with more needed to improve reliability. As domestic natural gas production comes on-stream it is important that a financially viable energy sector with reduced policy uncertainty is in place to see this resource converted to electricity.
C. Growing Where the Jobs Are
14. Ghana’s economy will need to add 6-7 million jobs by 2030, according to population and economic activity rate projections. Currently more than 80 percent of Ghana’s jobs are in the informal sector (GSS 2012), and it is unlikely that the formal economy will be able to generate enough stable salary work to absorb the influx of new workers. More than 40 percent of workers are in the agricultural sector which remains poorly paid and largely informal. Among the middle-income SSA countries compared in the Fall 2012 REO, the agriculture share of GDP in Ghana was more than twice as high as in any other country and was declining at the second slowest rate. As discussed below, the sector has registered below-average growth over the past 5 years. While Ghana likely enjoys a natural comparative advantage in agriculture and should not pursue a manufacturing-led growth strategy at all costs, diversifying unskilled labor away from basic agriculture, while increasing
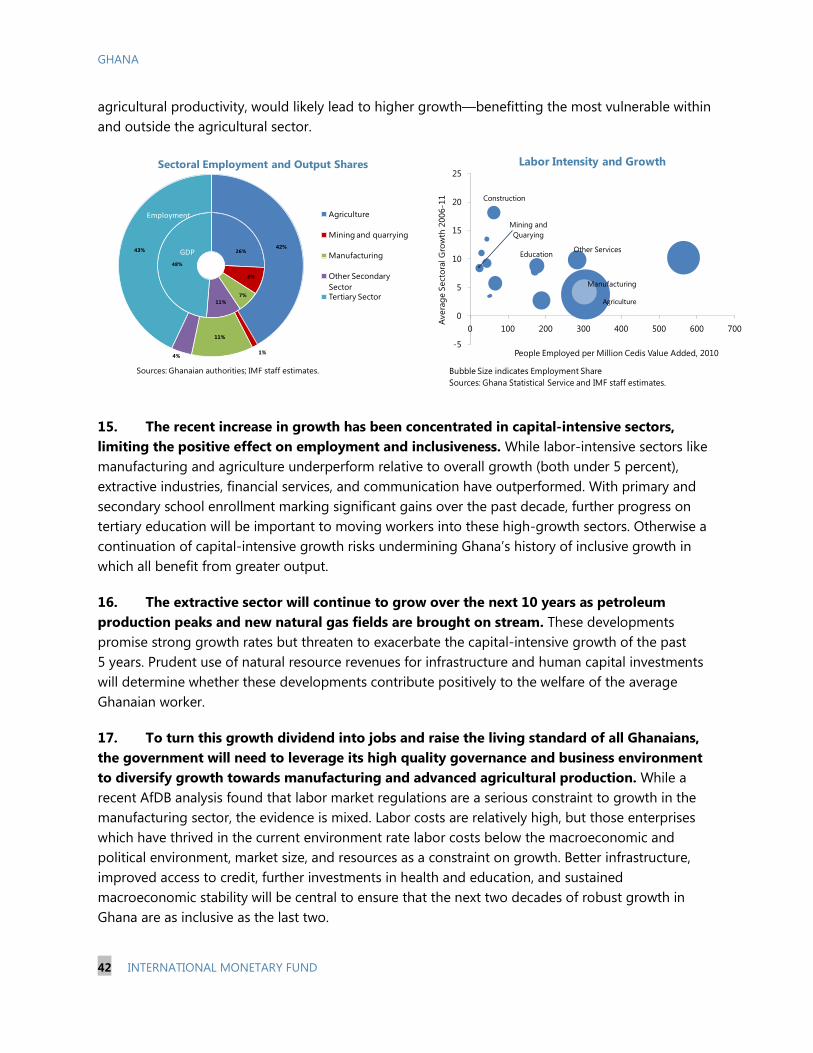
GHANA
42 INTERNATIONAL MONETARY FUND
agricultural productivity, would likely lead to higher growth—benefitting the most vulnerable within and outside the agricultural sector.
15. The recent increase in growth has been concentrated in capital-intensive sectors, limiting the positive effect on employment and inclusiveness. While labor-intensive sectors like manufacturing and agriculture underperform relative to overall growth (both under 5 percent), extractive industries, financial services, and communication have outperformed. With primary and secondary school enrollment marking significant gains over the past decade, further progress on tertiary education will be important to moving workers into these high-growth sectors. Otherwise a continuation of capital-intensive growth risks undermining Ghana’s history of inclusive growth in which all benefit from greater output.
16. The extractive sector will continue to grow over the next 10 years as petroleum production peaks and new natural gas fields are brought on stream. These developments promise strong growth rates but threaten to exacerbate the capital-intensive growth of the past 5 years. Prudent use of natural resource revenues for infrastructure and human capital investments will determine whether these developments contribute positively to the welfare of the average Ghanaian worker.
17. To turn this growth dividend into jobs and raise the living standard of all Ghanaians, the government will need to leverage its high quality governance and business environment to diversify growth towards manufacturing and advanced agricultural production. While a recent AfDB analysis found that labor market regulations are a serious constraint to growth in the manufacturing sector, the evidence is mixed. Labor costs are relatively high, but those enterprises which have thrived in the current environment rate labor costs below the macroeconomic and political environment, market size, and resources as a constraint on growth. Better infrastructure, improved access to credit, further investments in health and education, and sustained macroeconomic stability will be central to ensure that the next two decades of robust growth in Ghana are as inclusive as the last two.
26%
8%
7%11%
48%
42%
1%
11%
4%
43%
Sectoral Employment and Output Shares
Agriculture
Mining and quarrying
Manufacturing
Other Secondary SectorTertiary Sector
Employment
GDP
Sources: Ghanaian authorities; IMF staff estimates.
Mining and Quarying
Manufacturing
Construction
Education Other Services
-5
0
5
10
15
20
25
0 100 200 300 400 500 600 700
Aver
age
Sect
oral
Gro
wth
200
6-11
People Employed per Million Cedis Value Added, 2010
Labor Intensity and Growth
Bubble Size indicates Employment ShareSources: Ghana Statistical Service and IMF staff estimates.
Agriculture
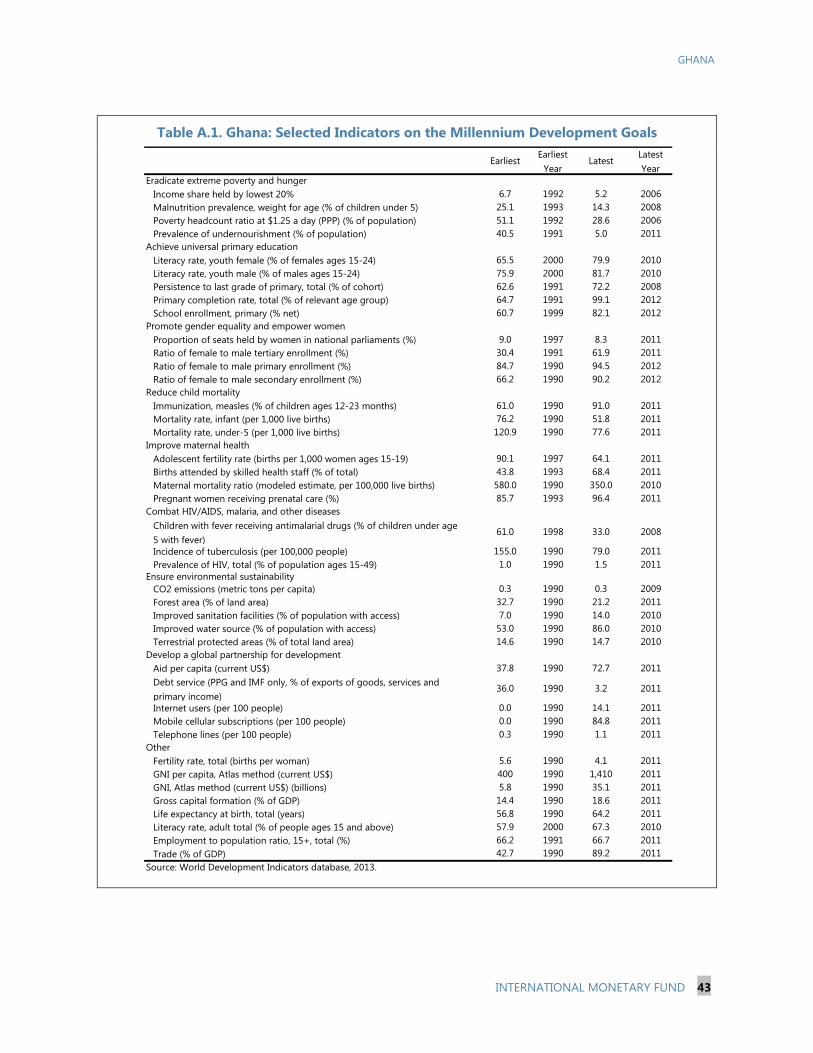
GHANA
INTERNATIONAL MONETARY FUND 43
Table A.1. Ghana: Selected Indicators on the Millennium Development Goals
EarliestEarliest
YearLatest
Latest Year
Income share held by lowest 20% 6.7 1992 5.2 2006Malnutrition prevalence, weight for age (% of children under 5) 25.1 1993 14.3 2008Poverty headcount ratio at $1.25 a day (PPP) (% of population) 51.1 1992 28.6 2006Prevalence of undernourishment (% of population) 40.5 1991 5.0 2011
Literacy rate, youth female (% of females ages 15-24) 65.5 2000 79.9 2010Literacy rate, youth male (% of males ages 15-24) 75.9 2000 81.7 2010Persistence to last grade of primary, total (% of cohort) 62.6 1991 72.2 2008Primary completion rate, total (% of relevant age group) 64.7 1991 99.1 2012School enrollment, primary (% net) 60.7 1999 82.1 2012
Proportion of seats held by women in national parliaments (%) 9.0 1997 8.3 2011Ratio of female to male tertiary enrollment (%) 30.4 1991 61.9 2011Ratio of female to male primary enrollment (%) 84.7 1990 94.5 2012Ratio of female to male secondary enrollment (%) 66.2 1990 90.2 2012
Immunization, measles (% of children ages 12-23 months) 61.0 1990 91.0 2011Mortality rate, infant (per 1,000 live births) 76.2 1990 51.8 2011Mortality rate, under-5 (per 1,000 live births) 120.9 1990 77.6 2011
Adolescent fertility rate (births per 1,000 women ages 15-19) 90.1 1997 64.1 2011Births attended by skilled health staff (% of total) 43.8 1993 68.4 2011Maternal mortality ratio (modeled estimate, per 100,000 live births) 580.0 1990 350.0 2010Pregnant women receiving prenatal care (%) 85.7 1993 96.4 2011
Children with fever receiving antimalarial drugs (% of children under age 5 with fever)
61.0 1998 33.0 2008
Incidence of tuberculosis (per 100,000 people) 155.0 1990 79.0 2011Prevalence of HIV, total (% of population ages 15-49) 1.0 1990 1.5 2011
CO2 emissions (metric tons per capita) 0.3 1990 0.3 2009Forest area (% of land area) 32.7 1990 21.2 2011Improved sanitation facilities (% of population with access) 7.0 1990 14.0 2010Improved water source (% of population with access) 53.0 1990 86.0 2010Terrestrial protected areas (% of total land area) 14.6 1990 14.7 2010
Aid per capita (current US$) 37.8 1990 72.7 2011Debt service (PPG and IMF only, % of exports of goods, services and primary income)
36.0 1990 3.2 2011
Internet users (per 100 people) 0.0 1990 14.1 2011Mobile cellular subscriptions (per 100 people) 0.0 1990 84.8 2011Telephone lines (per 100 people) 0.3 1990 1.1 2011
Fertility rate, total (births per woman) 5.6 1990 4.1 2011GNI per capita, Atlas method (current US$) 400 1990 1,410 2011GNI, Atlas method (current US$) (billions) 5.8 1990 35.1 2011Gross capital formation (% of GDP) 14.4 1990 18.6 2011Life expectancy at birth, total (years) 56.8 1990 64.2 2011Literacy rate, adult total (% of people ages 15 and above) 57.9 2000 67.3 2010Employment to population ratio, 15+, total (%) 66.2 1991 66.7 2011Trade (% of GDP) 42.7 1990 89.2 2011
Combat HIV/AIDS, malaria, and other diseases
Ensure environmental sustainability
Develop a global partnership for development
Other
Source: World Development Indicators database, 2013.
Eradicate extreme poverty and hunger
Achieve universal primary education
Promote gender equality and empower women
Reduce child mortality
Improve maternal health
GHANA
44 INTERNATIONAL MONETARY FUND
REFERENCES
Commission on Growth and Development, 2008, Growth Report: Strategies for Sustained Growth and Inclusive Development, the World Bank (Washington). Ghana Statistical Service, 2005, “Population Data Analysis Reports” vol.s 1-2, Government of Ghana (Accra). _____, 2008, “Ghana Living Standards Survey: Report of The Fifth Round (GLSS 5)” Government of Ghana (Accra). _____, 2012, “2010 Population and Housing Census: Summary Report of Final Results” Government of Ghana (Accra). International Monetary Fund, 2011, “How Inclusive Has Africa’s Recent High-Growth Episode Been?” Regional Economic Outlook: Sub-Saharan Africa, October (Washington). International Monetary Fund, 2012, “Structural Transformation in Sub-Saharan Africa” Regional Economic Outlook: Sub-Saharan Africa, October (Washington). Lejárraga, Iza, 2010, “Roaring Tiger or Purring Pussycat? A Growth Diagnostic Study of Ghana” African Development Bank, American Economic Association Conference Paper. U.S. Government and Government of Ghana, 2011, “Ghana Constraints Analysis” U.S. Department of State (Washington).

GHANA
INTERNATIONAL MONETARY FUND 45
Appendix III: Public Investment, Growth, and Debt Sustainability1
1. The Ghanaian authorities have emphasized the need to address large infrastructure gaps to secure Ghana’s long-term growth. They intend to focus investments on productivity-enhancing infrastructure, including roads, energy infrastructure, storage facilities, and irrigation systems that would crowd in private investment.
2. While addressing infrastructure gaps is essential, the scope for debt-financed infrastructure investment is contingent on maintaining debt sustainability. Two separate tools are applied to inform the assessment of debt sustainability and the associated policy choices: the standard debt sustainability analysis (DSA) and a model-based approach. The standard DSA confirms previous results, suggesting that Ghana is able to scale up investment from around 6 to 9 percent of GDP, while maintaining a moderate risk of distress.2
A. The Model
This conclusion holds even under conservative assumptions on growth dividends, but is contingent on successful fiscal consolidation. The second tool—and focus of this appendix—is a dynamic stochastic general equilibrium (DSGE) model that is tailored to resource-rich developing countries and explicitly captures the interaction between public investment, growth, and debt sustainability.
3. The DSGE model, based on Buffie et al (2012), is designed to capture many of the economic features prevalent in developing countries.3
4. An additional advantage of the DSGE approach is that it specifically models the relationship between investment and growth. Not surprisingly the model predicts a positive direct relationship between public investment and growth: infrastructure investment increases the productivity of existing capital, both private and public, and spurs further investment (crowding in). At the same time, the model also captures the potentially negative effects of debt-financed public investment, whereby higher real interest rates crowd out private investment.
The model suggests that a comparison of an investment’s rate of return and the cost of funding is not sufficient to assess the viability of a project. Investment efficiency and absorptive capacity play an important role in determining debt sustainability. Public investment may be inefficient, that is a dollar spent on public investment does not necessarily lead to an equivalent increase in public capital, whereas absorptive capacity problems may result in implementation delays and cost overruns.
1 Prepared by Genevieve Verdier and Javier Arze del Granado, based on Niangoran, A., G. Verdier and F. Zanna (2013). “Public Investment, Growth and Debt Sustainability in Ghana”, mimeo. 2 See supplement on Update of Joint IMF and World Bank Debt Sustainability Analysis. 3 Buffie, E., A. Berg, C. Patillo, R. Portillo and F. Zanna, (2012). “Public, Investment, Growth, and Debt Sustainability: Putting together the Pieces”. IMF Working Paper WP/12/144.

GHANA
46 INTERNATIONAL MONETARY FUND
B. Application to Ghana
5. Calibrated to the Ghanaian economy, the model can match the long-run debt-to-GDP ratio projected in the standard DSA, but there are also significant differences (Table 1). First, the model suggests that projections in the DSA may underestimate the positive effect of investment on growth. Trend per capita GDP growth is assumed to be the same at around 3 percent, but the model captures the transitional effects of higher investment on economic growth. Despite higher transitional growth, the average primary balance required to achieve a similar long-term debt ratio is stronger in the model, beyond the initial scaling-up period. The reason is that higher growth in the scaling-up phase is not sufficient to generate the additional revenues needed during the repayment phase to return to the same debt ratio. These additional resource needs are met by a combination of lower current primary expenditures and higher VAT rates. The latter, in turn increases the real interest rate (via lower private savings), dampening private investment during the repayment phase.4
6. The model results suggest that scaling up investment can be beneficial, but maintaining debt sustainability requires considerable effort on various fronts. Table 2 and Figure 1A present
key results for various scenarios, suggesting the following conclusions:
• Baseline: An increase in public investment to about 9 percent of GDP over the medium term, as projected by the authorities in the 2013 budget, can create noticeable growth dividends; real per capita income would be about 15 percent higher in 2032 than without the scaling up (growth dividend). However, the model predicts that despite the projected fiscal adjustment, the debt ratio would follow an inverted U-shape, peaking at around 70 percent of GDP in 2020, and declining to its current level (around 50 percent of GDP) by 2032. The additional investment would raise the public and private capital stocks by about 30 and 10 percent of GDP, respectively.
4 Note that a rising debt-servicing burden is also a feature of the standard DSA, where the debt service-to-revenue ratio approaches the established DSA threshold.
Growth dividend
1/
Debt-to-GDP ratio in 2032
Increase in public capital
by 2032
Increase in private capital
by 2032
Baseline 15.0 51.7 32.2 10.6Front-loaded adjustment 14.2 39.6 31.6 8.7Gradual reform (baseline+reform) 17.6 41.1 42.6 11.3Ambitious scaling up 20.0 68.8 41.2 13.9Ambitious scaling up with gradual reform 23.3 48.5 54.5 15.11/ Difference in real per capita GDP in 2032 relative to trend (without scaling up).Source: IMF staff estimates.
Table 2. Impact of Different Scenarios (In percent of non-oil GDP)
Avg. Avg.2012 2013-18 2019-32 2032
2013 DSAReal per capita GDP growth (percent) 5.2 3.6 2.7 2.8Primary balance -8.4 -3.5 -0.5 -0.5Debt-to GDP ratio 51.3 54.3 55.9 53.3
Baseline (model)Real per capita GDP growth (percent) … 5.4 3.6 3.3Primary balance … -5.1 -0.1 -0.1Debt-to GDP ratio … 64.6 62.4 51.7
Source: IMF staff estimates.
Table 1. Key Macroeconomic Variables(In percent of non-oil GDP)

GHANA
INTERNATIONAL MONETARY FUND 47
• A front-loaded fiscal adjustment of an additional 3 percent of GDP by 2015 (analogous to the active scenario in the DSA), would generate a slightly lower growth dividend but result in a significant decrease in the public debt ratio to less than 40 percent of GDP.
• A more ambitious scaling up of investment can significantly boost the growth dividend, provided there is no correlation between the size of the surge and capacity constraints. More ambitious plans, however, may jeopardize debt sustainability. The model suggests that additional investment scaling up to an average of 12 percent of GDP over the medium term would result in a debt ratio of nearly 70 percent of GDP by 2032.
• Additional reforms to improve investment efficiency (gradually increasing the share of public investment spending that is transformed into productive capital) coupled with an increase in user fees, would raise the growth dividend significantly, while simultaneously strengthening debt sustainability. A scenario assuming a gradual improvement of investment efficiency and user fees of a magnitude attainable over the medium term shows that the debt ratios of the baseline and ambitious investment scenarios could be reduced to about 40 and 50 percent of GDP, respectively.
7. The different investment and reform scenarios have varied implications also for the path of the external current account adjustment. The model suggests that under the baseline scenario the assumed fiscal adjustment would lead to an improvement in the current account of almost 6 percent of GDP by 2032. More ambitious investment plans are associated with an initially smaller current account adjustment—because of the additional investment spending—but this is reversed subsequently as the investment profile adjusts to the baseline and higher tax rates are required during the repayment phase, reducing private consumption. A front-loaded fiscal consolidation would entail a significantly lower current account deficit throughout the projection period.
C. Conclusions
8. The model illustrates that a successful scaling up of public investment in Ghana will require complementary efforts to create fiscal space and improve investment efficiency. Even if the rate of return on projects is high, weak efficiency of public investment can greatly reduce the growth dividends from scaling up and increase the risk of debt distress. In addition, fiscal consolidation (significantly lower primary current spending and higher tax revenue) remains a key ingredient to debt sustainability, even with high investment efficiency; in the absence of reforms to improve the efficiency of public investment, and higher user fees, the fiscal effort required to keep the debt ratio at manageable levels would have to be larger.

GHANA
48 INTERNATIONAL MONETARY FUND
Figure 1A. Key Macroeconomic Scenarios
1/ Fiscal effort is defined as the change in the current primary deficit (i.e., excluding investment spending), net of non-taxand oil revenues) relative to its value in 2012.Source: IMF staff estimates.
0.0
10.0
20.0
30.0
40.0
50.0
60.0
70.0
80.0
90.0
100.0
2012
2013
2014
2015
2016
2017
2018
2019
2020
2021
2022
2023
2024
2025
2026
2027
2028
2029
2030
2031
2032
Total public debt(percent of non-oil GDP)
Baseline
Front-loaded adjustment
Baseline plus reforms
Ambitious scaling up
Ambitious scaling up and reform
0.0
2.0
4.0
6.0
8.0
10.0
12.0
2013
2014
2015
2016
2017
2018
2019
2020
2021
2022
2023
2024
2025
2026
2027
2028
2029
2030
2031
2032
Fiscal Effort 1/(percent of non-oil GDP)
BaselineFront-loaded adjustmentBaseline plus reformsAmbitious scaling upAmbitious scaling up and reform
-14.0
-12.0
-10.0
-8.0
-6.0
-4.0
-2.0
0.0
2012 2013 2014 2015 2016 2017 2018
Current account balance(percent of non-oil GDP)
BaselineFront-loaded adjustmentBaseline plus reformsAmbitious scaling upAmbitious scaling up and reform
0.0
2.0
4.0
6.0
8.0
10.0
12.0
14.0
16.0
2011
2013
2015
2017
2019
2021
2023
2025
2027
2029
2031
Investment scenarios(percent of non-oil GDP)
Ambitious scaling up
Baseline

GHANA
INTERNATIONAL MONETARY FUND 49
Appendix IV: Implementation of the 2011 FSAP Update—Key Policy Recommendations
The FSAP update made wide-ranging recommendations. This appendix presents a summary assessment of progress in key areas.
Banking system stability
• Most of GCB’s exposure to Tema Oil Refinery was restructured. However, fiscal developments, including the re-emergence of arrears, create new concerns over government-related NPLs.
• The authorities chose not to commission an audit of problem banks, instead seeking to raise audit standards through auditor rotation and supervisory meetings with banks and auditors.
• The authorities did not establish a steering committee for bank resolution and no banks have been resolved. While there are now fewer weak public banks, there remain two.
• A Financial Stability Department has been established, training delivered (IMF TA). There are plans for a first publication soon. There has been limited progress with identifying data gaps.
• The authorities have not developed a comprehensive framework for crisis management. Powers to facilitate resolution have not been strengthened with new legislation.
• State ownership or control of the banking sector has not been reduced.
Systemic liquidity management
• Initiatives have been taken to improve the foreign exchange market (screen-based systems, BoG intervention at interbank rates, Code of Conduct), and activity has increased.
• Severe weaknesses remain in liquidity forecasting and there is a need to reform and develop the liquidity management framework and use of monetary policy instruments.
Financial sector regulation and supervision
• BoG’s holdings in banks have not been reduced. For ADB, legislation is planned to change the bank’s status from specialist to commercial bank, facilitating disposal of the BoG’s stake.
• Forbearance remains a feature of the BoG’s supervision, evidenced by its approach to weak banks and readiness to grant waivers from the large exposure (single obligor) limits.
• Plans to amend the Banking Act to strengthen the BoG’s powers have not been progressed.
• Regulations have been drafted to strengthen the licensing framework, but they have not been issued, nor have guidelines to enhance industry risk management.

GHANA STAFF REPORT FOR THE 2013 ARTICLE IV CONSULTATION― DEBT SUSTAINABILITY ANALYSIS—UPDATE
Approved By Michael Atingi-Ego and Mark Joseph Flanagan (IMF) and Jeff Lewis and Marcelo Giugale (IDA)
Prepared by the International Monetary Fund and the World Bank1
The analysis suggests that Ghana’s risk of debt distress has risen, but remains moderate.
Driven by expansionary fiscal policy in 2012, several of Ghana’s public domestic and
external debt indicators have deteriorated, but external debt burden indicators are
projected to remain well below their respective indicative thresholds, provided fiscal
consolidation is realized as planned and continues beyond the medium term. Total public
debt is projected to stabilize at approximately 52 percent of GDP in the long run, with
debt service absorbing more than 40 percent of government revenue. A more front-
loaded adjustment would be needed to set the debt ratio on a declining trend.
1 Prepared in collaboration with Ghanaian authorities. The previous DSA was prepared in November 2011 (IMF Country Report No. 12/36).
May 29, 2013
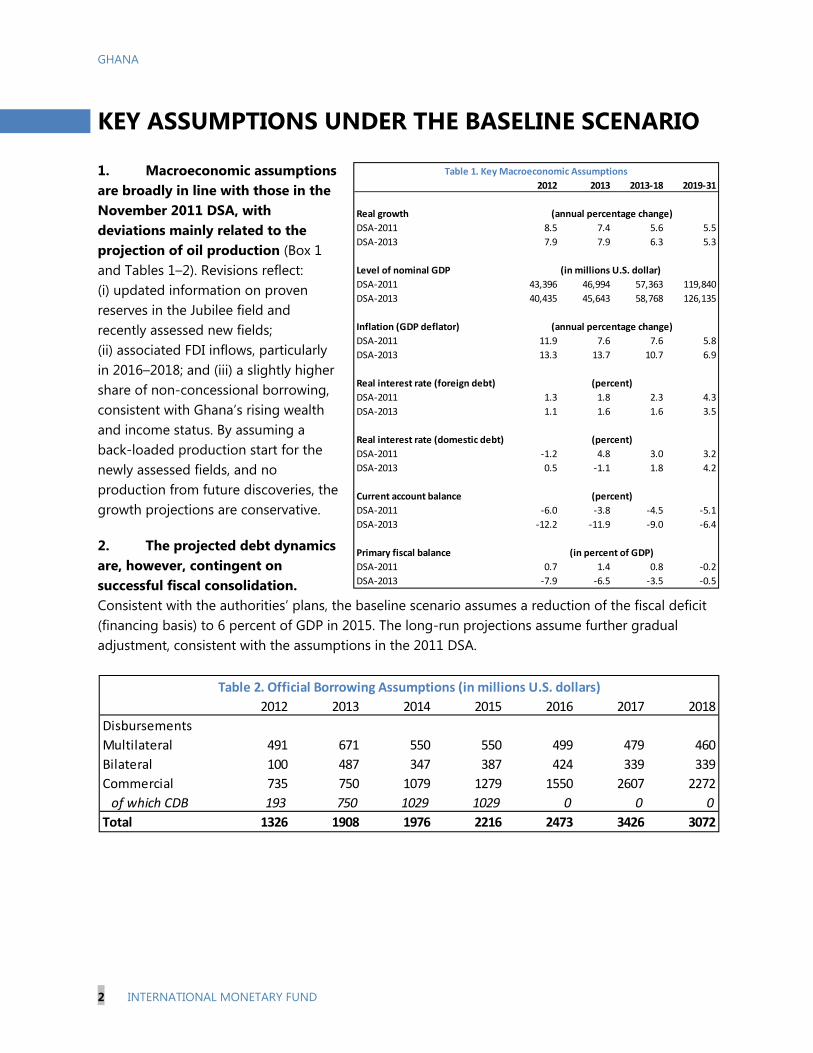
GHANA
2 INTERNATIONAL MONETARY FUND
2012 2013 2013-18 2019-31
Real growth
DSA-2011 8.5 7.4 5.6 5.5
DSA-2013 7.9 7.9 6.3 5.3
Level of nominal GDP
DSA-2011 43,396 46,994 57,363 119,840
DSA-2013 40,435 45,643 58,768 126,135
Inflation (GDP deflator)
DSA-2011 11.9 7.6 7.6 5.8
DSA-2013 13.3 13.7 10.7 6.9
Real interest rate (foreign debt)
DSA-2011 1.3 1.8 2.3 4.3
DSA-2013 1.1 1.6 1.6 3.5
Real interest rate (domestic debt)
DSA-2011 -1.2 4.8 3.0 3.2
DSA-2013 0.5 -1.1 1.8 4.2
Current account balance
DSA-2011 -6.0 -3.8 -4.5 -5.1
DSA-2013 -12.2 -11.9 -9.0 -6.4
Primary fiscal balance
DSA-2011 0.7 1.4 0.8 -0.2
DSA-2013 -7.9 -6.5 -3.5 -0.5
(in percent of GDP)
(percent)
Table 1. Key Macroeconomic Assumptions
(annual percentage change)
(in millions U.S. dollar)
(annual percentage change)
(percent)
(percent)
KEY ASSUMPTIONS UNDER THE BASELINE SCENARIO
1. Macroeconomic assumptions are broadly in line with those in the November 2011 DSA, with deviations mainly related to the projection of oil production (Box 1 and Tables 1–2). Revisions reflect: (i) updated information on proven reserves in the Jubilee field and recently assessed new fields; (ii) associated FDI inflows, particularly in 2016–2018; and (iii) a slightly higher share of non-concessional borrowing, consistent with Ghana’s rising wealth and income status. By assuming a back-loaded production start for the newly assessed fields, and no production from future discoveries, the growth projections are conservative.
2. The projected debt dynamics are, however, contingent on successful fiscal consolidation. Consistent with the authorities’ plans, the baseline scenario assumes a reduction of the fiscal deficit (financing basis) to 6 percent of GDP in 2015. The long-run projections assume further gradual adjustment, consistent with the assumptions in the 2011 DSA.
2012 2013 2014 2015 2016 2017 2018
Disbursements
Multilateral 491 671 550 550 499 479 460
Bilateral 100 487 347 387 424 339 339
Commercial 735 750 1079 1279 1550 2607 2272
of which CDB 193 750 1029 1029 0 0 0
Total 1326 1908 1976 2216 2473 3426 3072
Table 2. Official Borrowing Assumptions (in millions U.S. dollars)
GHANA
INTERNATIONAL MONETARY FUND 3
Box 1. Baseline Macroeconomic Assumptions
Real GDP-growth: After the acceleration of real GDP growth in 2011 to 15 percent, driven by oil production and a considerable expansion of the non-oil economy, Ghana experienced another year of high real GDP growth of almost 8 percent in 2012. Increased oil production is projected to keep the growth rate at this level in 2013. In the medium-term, growth is projected to moderate until production from new oil fields boosts output in 2018. In the long-run, real growth is assumed to stabilize at 5-6 percent, with new oil discoveries implying significant upside potential.
Inflation: CPI inflation increased in late 2012, and survey-based expectations point to a further rise to above 10 percent in 2013. Supported by an improvement in the policy mix, inflation is expected to decline in the medium run, with the GDP deflator stabilizing at 7-8 percent in 2018–2033.
Government balances: After widening to 7.9 percent of GDP in 2012, the primary deficit is projected to improve to 2.2 percent of GDP by 2015, and to gradually fall to less than 1 percent of GDP in the long run.
Current account balance: Notwithstanding strong export growth of 15 percent, the current account deficit widened to 12.2 percent of GDP in 2012, as a result of sharply rising imports. Owing to weaker terms of trade, the current account deficit is expected to remain close to 12 percent in 2013 and above 8 percent of GDP until 2017, driven by strong capital imports. Beginning in 2018, the deficit it is projected to gradually decline to approximately 4 percent of GDP in 2033, broadly in line with its optimal level according to Fund staff’s external balance assessment.
Financing flows: Ghana continued to attract significant FDI of above 8 percent of GDP in 2012, the main part of which was related to the oil sector. Driven by the discovery of new fields, FDI is projected to stay close to 7 percent of GDP until 2018, and then to gradually decline to 4 percent of GDP by 2033. Consistent with Ghana’s improving income status and wealth, inflows from grants are projected to decline to less than ½ percent of GDP in the medium to long term. Borrowing is projected to become increasingly non-concessional with above 90 percent of loans. The Eurobond, which the authorities are considering, is not included in this DSA, but could help smooth rollover needs and actually reduce total debt service cost by replacing more expensive borrowing from the less liquid domestic market.
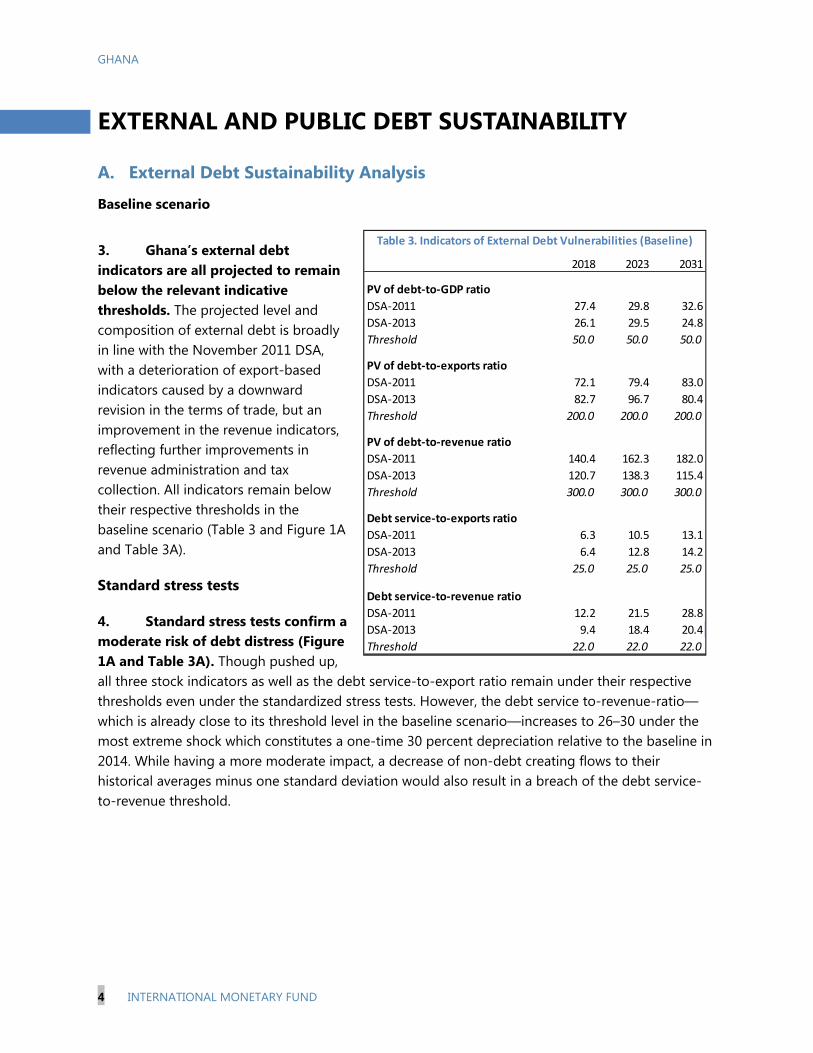
GHANA
4 INTERNATIONAL MONETARY FUND
2018 2023 2031
PV of debt-to-GDP ratio
DSA-2011 27.4 29.8 32.6
DSA-2013 26.1 29.5 24.8
Threshold 50.0 50.0 50.0
PV of debt-to-exports ratio
DSA-2011 72.1 79.4 83.0
DSA-2013 82.7 96.7 80.4
Threshold 200.0 200.0 200.0
PV of debt-to-revenue ratio
DSA-2011 140.4 162.3 182.0
DSA-2013 120.7 138.3 115.4
Threshold 300.0 300.0 300.0
Debt service-to-exports ratio
DSA-2011 6.3 10.5 13.1
DSA-2013 6.4 12.8 14.2
Threshold 25.0 25.0 25.0
Debt service-to-revenue ratio
DSA-2011 12.2 21.5 28.8
DSA-2013 9.4 18.4 20.4
Threshold 22.0 22.0 22.0
Table 3. Indicators of External Debt Vulnerabilities (Baseline)
EXTERNAL AND PUBLIC DEBT SUSTAINABILITY
A. External Debt Sustainability Analysis
Baseline scenario
3. Ghana’s external debt indicators are all projected to remain below the relevant indicative thresholds. The projected level and composition of external debt is broadly in line with the November 2011 DSA, with a deterioration of export-based indicators caused by a downward revision in the terms of trade, but an improvement in the revenue indicators, reflecting further improvements in revenue administration and tax collection. All indicators remain below their respective thresholds in the baseline scenario (Table 3 and Figure 1A and Table 3A).
Standard stress tests
4. Standard stress tests confirm a moderate risk of debt distress (Figure 1A and Table 3A). Though pushed up, all three stock indicators as well as the debt service-to-export ratio remain under their respective thresholds even under the standardized stress tests. However, the debt service to-revenue-ratio—which is already close to its threshold level in the baseline scenario—increases to 26–30 under the most extreme shock which constitutes a one-time 30 percent depreciation relative to the baseline in 2014. While having a more moderate impact, a decrease of non-debt creating flows to their historical averages minus one standard deviation would also result in a breach of the debt service-to-revenue threshold.
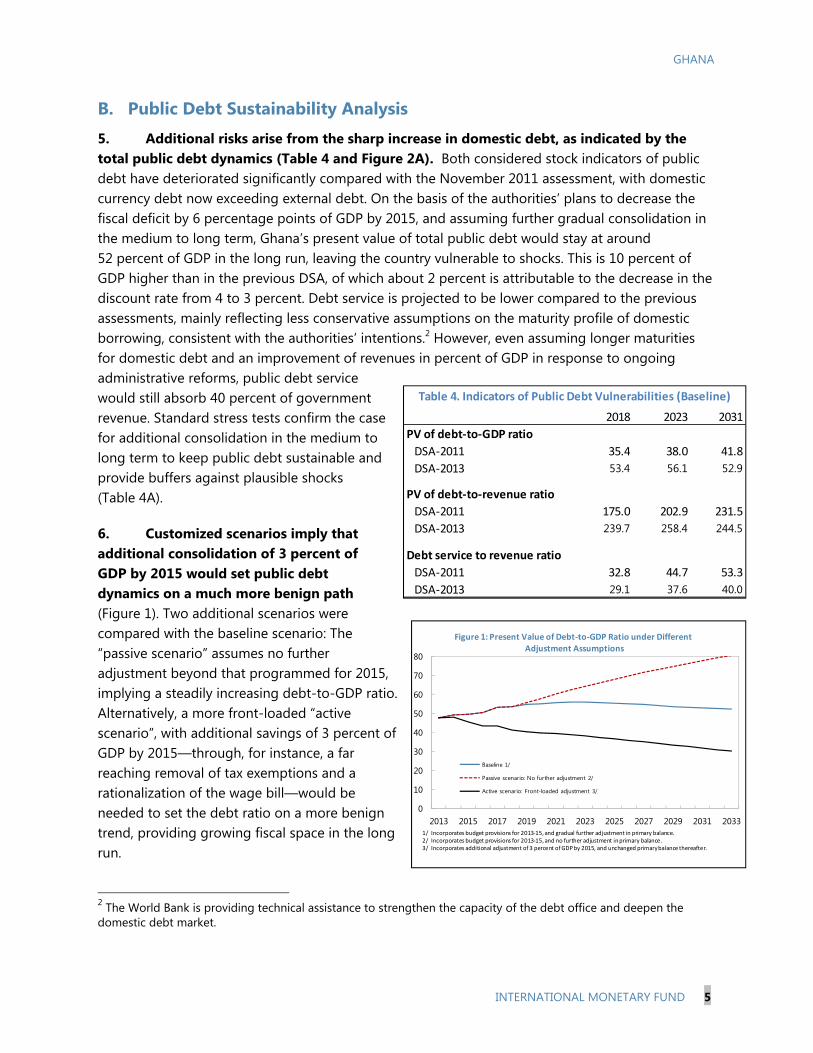
GHANA
INTERNATIONAL MONETARY FUND 5
0
10
20
30
40
50
60
70
80
2013 2015 2017 2019 2021 2023 2025 2027 2029 2031 2033
Baseline 1/
Passive scenario: No further adjustment 2/
Active scenario: Front-loaded adjustment 3/
1/ Incorporates budget provisions for 2013-15, and gradual further adjustment in primary balance. 2/ Incorporates budget provisions for 2013-15, and no further adjustment in primary balance.3/ Incorporates additional adjustment of 3 percent of GDP by 2015, and unchanged primary balance thereafter.
Figure 1: Present Value of Debt-to-GDP Ratio under Different Adjustment Assumptions
2018 2023 2031
PV of debt-to-GDP ratio
DSA-2011 35.4 38.0 41.8
DSA-2013 53.4 56.1 52.9
PV of debt-to-revenue ratio
DSA-2011 175.0 202.9 231.5
DSA-2013 239.7 258.4 244.5
Debt service to revenue ratio
DSA-2011 32.8 44.7 53.3
DSA-2013 29.1 37.6 40.0
Table 4. Indicators of Public Debt Vulnerabilities (Baseline)
B. Public Debt Sustainability Analysis
5. Additional risks arise from the sharp increase in domestic debt, as indicated by the total public debt dynamics (Table 4 and Figure 2A). Both considered stock indicators of public debt have deteriorated significantly compared with the November 2011 assessment, with domestic currency debt now exceeding external debt. On the basis of the authorities’ plans to decrease the fiscal deficit by 6 percentage points of GDP by 2015, and assuming further gradual consolidation in the medium to long term, Ghana’s present value of total public debt would stay at around 52 percent of GDP in the long run, leaving the country vulnerable to shocks. This is 10 percent of GDP higher than in the previous DSA, of which about 2 percent is attributable to the decrease in the discount rate from 4 to 3 percent. Debt service is projected to be lower compared to the previous assessments, mainly reflecting less conservative assumptions on the maturity profile of domestic borrowing, consistent with the authorities’ intentions.2 However, even assuming longer maturities for domestic debt and an improvement of revenues in percent of GDP in response to ongoing administrative reforms, public debt service would still absorb 40 percent of government revenue. Standard stress tests confirm the case for additional consolidation in the medium to long term to keep public debt sustainable and provide buffers against plausible shocks (Table 4A).
6. Customized scenarios imply that additional consolidation of 3 percent of GDP by 2015 would set public debt dynamics on a much more benign path (Figure 1). Two additional scenarios were compared with the baseline scenario: The “passive scenario” assumes no further adjustment beyond that programmed for 2015, implying a steadily increasing debt-to-GDP ratio. Alternatively, a more front-loaded “active scenario”, with additional savings of 3 percent of GDP by 2015—through, for instance, a far reaching removal of tax exemptions and a rationalization of the wage bill—would be needed to set the debt ratio on a more benign trend, providing growing fiscal space in the long run.
2 The World Bank is providing technical assistance to strengthen the capacity of the debt office and deepen the domestic debt market.

GHANA
6 INTERNATIONAL MONETARY FUND
CONCLUSIONS
7. While Ghana’s public debt situation has worsened since the last DSA, risks of distress remain moderate. Deteriorations in the debt indicators relative to exports are mainly driven by a weaker external outlook, while fiscal slippages in 2012 have set total public debt on a less favorable path. Revenue-based indicators have overall improved compared to the last DSA, but the debt service-to-revenue ratio still presents the most pronounced risk.
8. Robust growth, a realization of the planned fiscal consolidation, and further adjustment in the long run are essential to achieving the projected debt paths. The baseline scenario assumes the authorities’ envisaged consolidation of 6 percent of GDP by 2015 followed by gradual further consolidation in the long run. These measures will help stabilize the public debt ratio at a still elevated level of about 52 percent of GDP. More ambitious upfront adjustment could set the debt ratio on a much more favorable path.
9. The authorities broadly agree with the analysis, but consider the projections to be on the conservative side. In particular, they expect larger growth dividends from infrastructure investments in the context of a more rapid development of the oil and gas sector and overall higher potential GDP growth. A more optimistic growth projection would result in stronger debt indicators.

GHANA
INTERNATIONAL MONETARY FUND 7
Sources: Country authorities; and staff estimates and projections.
Figure 1A. Ghana: Indicators of Public and Publicly Guaranteed External Debt under Alternatives Scenarios, 2013–2033 1/
1/ The most extreme stress test is the test that yields the highest ratio in 2023. In figure b. it corresponds to a One-time depreciation shock; in c. to a Terms shock; in d. to a One-time depreciation shock; in e. to a Non-debt flows shock and in figure f. to a One-time depreciation shock
0
5
10
15
20
25
30
35
2013 2018 2023 2028 2033
Baseline Historical scenario Most extreme shock 1/ Threshold
e.Debt service-to-revenue ratio
-25
-20
-15
-10
-5
0
5
-1
0
1
2
3
4
5
2013 2018 2023 2028 2033
Rate of Debt Accumulation
Grant-equivalent financing (% of GDP)
Grant element of new borrowing (% right scale)
0
10
20
30
40
50
60
2013 2018 2023 2028 2033
0
50
100
150
200
250
2013 2018 2023 2028 2033
b. PV of debt-to exports ratio
0
50
100
150
200
250
300
350
2013 2018 2023 2028 2033
c. PV of debt-to-revenue ratio
0
5
10
15
20
25
30
2013 2018 2023 2028 2033
d.Debt service-to-exports ratio
a. PV of debt-to GDP ratio
Appendix
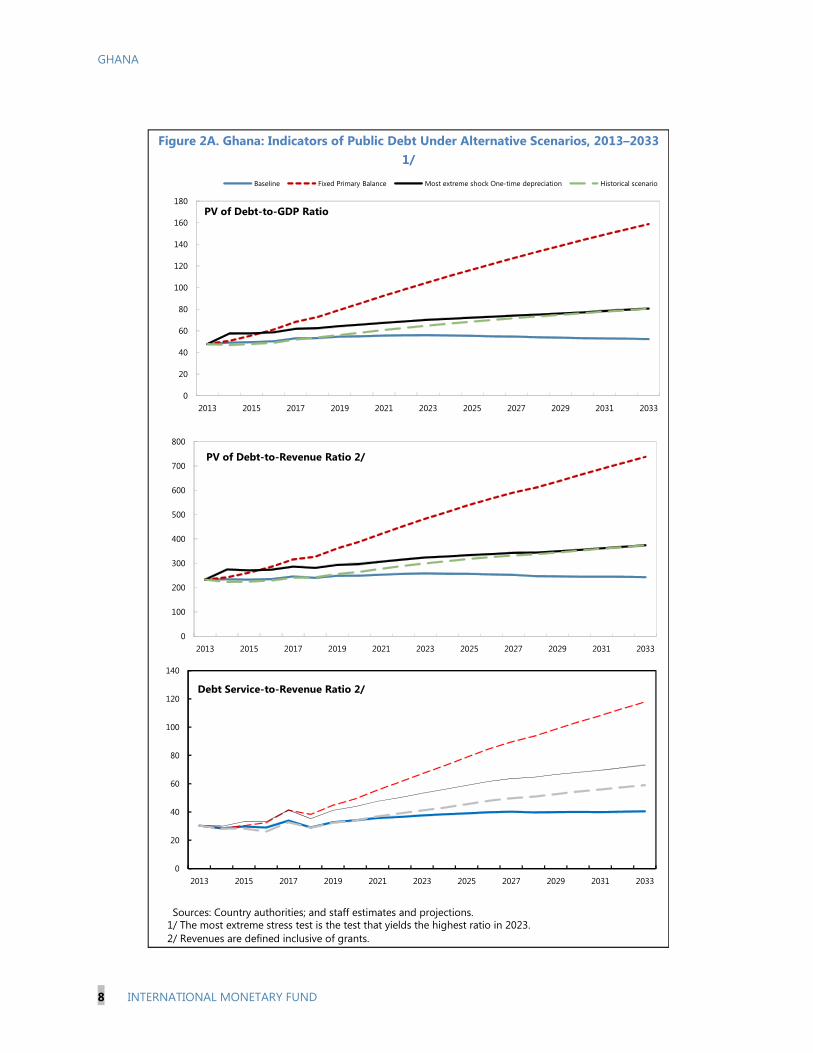
GHANA
8 INTERNATIONAL MONETARY FUND
Sources: Country authorities; and staff estimates and projections.1/ The most extreme stress test is the test that yields the highest ratio in 2023. 2/ Revenues are defined inclusive of grants.
Figure 2A. Ghana: Indicators of Public Debt Under Alternative Scenarios, 2013–2033 1/
0
100
200
300
400
500
600
700
800
2013 2015 2017 2019 2021 2023 2025 2027 2029 2031 2033
PV of Debt-to-Revenue Ratio 2/
0
20
40
60
80
100
120
140
160
180
2013 2015 2017 2019 2021 2023 2025 2027 2029 2031 2033
Baseline Fixed Primary Balance Most extreme shock One-time depreciation Historical scenario
PV of Debt-to-GDP Ratio
0
20
40
60
80
100
120
140
2013 2015 2017 2019 2021 2023 2025 2027 2029 2031 2033
Debt Service-to-Revenue Ratio 2/
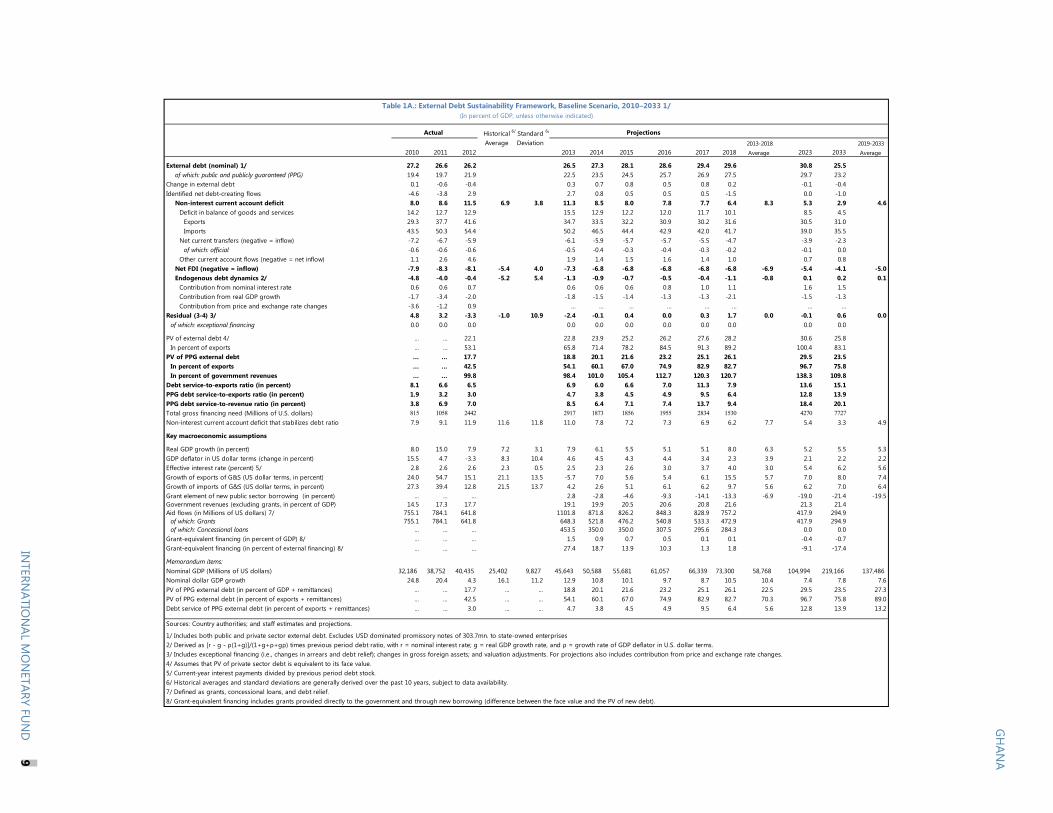
Historical 6/ Standard 6/
Average Deviation 2013-2018 2019-20332010 2011 2012 2013 2014 2015 2016 2017 2018 Average 2023 2033 Average
External debt (nominal) 1/ 27.2 26.6 26.2 26.5 27.3 28.1 28.6 29.4 29.6 30.8 25.5of which: public and publicly guaranteed (PPG) 19.4 19.7 21.9 22.5 23.5 24.5 25.7 26.9 27.5 29.7 23.2
Change in external debt 0.1 -0.6 -0.4 0.3 0.7 0.8 0.5 0.8 0.2 -0.1 -0.4Identified net debt-creating flows -4.6 -3.8 2.9 2.7 0.8 0.5 0.5 0.5 -1.5 0.0 -1.0
Non-interest current account deficit 8.0 8.6 11.5 6.9 3.8 11.3 8.5 8.0 7.8 7.7 6.4 8.3 5.3 2.9 4.6Deficit in balance of goods and services 14.2 12.7 12.9 15.5 12.9 12.2 12.0 11.7 10.1 8.5 4.5
Exports 29.3 37.7 41.6 34.7 33.5 32.2 30.9 30.2 31.6 30.5 31.0Imports 43.5 50.3 54.4 50.2 46.5 44.4 42.9 42.0 41.7 39.0 35.5
Net current transfers (negative = inflow) -7.2 -6.7 -5.9 -6.1 -5.9 -5.7 -5.7 -5.5 -4.7 -3.9 -2.3of which: official -0.6 -0.6 -0.6 -0.5 -0.4 -0.3 -0.4 -0.3 -0.2 -0.1 0.0
Other current account flows (negative = net inflow) 1.1 2.6 4.6 1.9 1.4 1.5 1.6 1.4 1.0 0.7 0.8Net FDI (negative = inflow) -7.9 -8.3 -8.1 -5.4 4.0 -7.3 -6.8 -6.8 -6.8 -6.8 -6.8 -6.9 -5.4 -4.1 -5.0Endogenous debt dynamics 2/ -4.8 -4.0 -0.4 -5.2 5.4 -1.3 -0.9 -0.7 -0.5 -0.4 -1.1 -0.8 0.1 0.2 0.1
Contribution from nominal interest rate 0.6 0.6 0.7 0.6 0.6 0.6 0.8 1.0 1.1 1.6 1.5Contribution from real GDP growth -1.7 -3.4 -2.0 -1.8 -1.5 -1.4 -1.3 -1.3 -2.1 -1.5 -1.3Contribution from price and exchange rate changes -3.6 -1.2 0.9 … … … … … … … …
Residual (3-4) 3/ 4.8 3.2 -3.3 -1.0 10.9 -2.4 -0.1 0.4 0.0 0.3 1.7 0.0 -0.1 0.6 0.0of which: exceptional financing 0.0 0.0 0.0 0.0 0.0 0.0 0.0 0.0 0.0 0.0 0.0
PV of external debt 4/ ... ... 22.1 22.8 23.9 25.2 26.2 27.6 28.2 30.6 25.8In percent of exports ... ... 53.1 65.8 71.4 78.2 84.5 91.3 89.2 100.4 83.1
PV of PPG external debt ... ... 17.7 18.8 20.1 21.6 23.2 25.1 26.1 29.5 23.5In percent of exports ... ... 42.5 54.1 60.1 67.0 74.9 82.9 82.7 96.7 75.8In percent of government revenues ... ... 99.8 98.4 101.0 105.4 112.7 120.3 120.7 138.3 109.8
Debt service-to-exports ratio (in percent) 8.1 6.6 6.5 6.9 6.0 6.6 7.0 11.3 7.9 13.6 15.1PPG debt service-to-exports ratio (in percent) 1.9 3.2 3.0 4.7 3.8 4.5 4.9 9.5 6.4 12.8 13.9PPG debt service-to-revenue ratio (in percent) 3.8 6.9 7.0 8.5 6.4 7.1 7.4 13.7 9.4 18.4 20.1Total gross financing need (Millions of U.S. dollars) 815 1058 2442 2917 1873 1856 1955 2834 1530 4270 7727Non-interest current account deficit that stabilizes debt ratio 7.9 9.1 11.9 11.6 11.8 11.0 7.8 7.2 7.3 6.9 6.2 7.7 5.4 3.3 4.9
Key macroeconomic assumptions
Real GDP growth (in percent) 8.0 15.0 7.9 7.2 3.1 7.9 6.1 5.5 5.1 5.1 8.0 6.3 5.2 5.5 5.3GDP deflator in US dollar terms (change in percent) 15.5 4.7 -3.3 8.3 10.4 4.6 4.5 4.3 4.4 3.4 2.3 3.9 2.1 2.2 2.2Effective interest rate (percent) 5/ 2.8 2.6 2.6 2.3 0.5 2.5 2.3 2.6 3.0 3.7 4.0 3.0 5.4 6.2 5.6Growth of exports of G&S (US dollar terms, in percent) 24.0 54.7 15.1 21.1 13.5 -5.7 7.0 5.6 5.4 6.1 15.5 5.7 7.0 8.0 7.4Growth of imports of G&S (US dollar terms, in percent) 27.3 39.4 12.8 21.5 13.7 4.2 2.6 5.1 6.1 6.2 9.7 5.6 6.2 7.0 6.4Grant element of new public sector borrowing (in percent) ... ... ... 2.8 -2.8 -4.6 -9.3 -14.1 -13.3 -6.9 -19.0 -21.4 -19.5Government revenues (excluding grants, in percent of GDP) 14.5 17.3 17.7 19.1 19.9 20.5 20.6 20.8 21.6 21.3 21.4Aid flows (in Millions of US dollars) 7/ 755.1 784.1 641.8 1101.8 871.8 826.2 848.3 828.9 757.2 417.9 294.9
of which: Grants 755.1 784.1 641.8 648.3 521.8 476.2 540.8 533.3 472.9 417.9 294.9of which: Concessional loans ... ... ... 453.5 350.0 350.0 307.5 295.6 284.3 0.0 0.0
Grant-equivalent financing (in percent of GDP) 8/ ... ... ... 1.5 0.9 0.7 0.5 0.1 0.1 -0.4 -0.7Grant-equivalent financing (in percent of external financing) 8/ ... ... ... 27.4 18.7 13.9 10.3 1.3 1.8 -9.1 -17.4
Memorandum items:Nominal GDP (Millions of US dollars) 32,186 38,752 40,435 25,402 9,827 45,643 50,588 55,681 61,057 66,339 73,300 58,768 104,994 219,166 137,486 Nominal dollar GDP growth 24.8 20.4 4.3 16.1 11.2 12.9 10.8 10.1 9.7 8.7 10.5 10.4 7.4 7.8 7.6PV of PPG external debt (in percent of GDP + remittances) ... ... 17.7 ... ... 18.8 20.1 21.6 23.2 25.1 26.1 22.5 29.5 23.5 27.3PV of PPG external debt (in percent of exports + remittances) ... ... 42.5 ... ... 54.1 60.1 67.0 74.9 82.9 82.7 70.3 96.7 75.8 89.0Debt service of PPG external debt (in percent of exports + remittances) ... ... 3.0 ... ... 4.7 3.8 4.5 4.9 9.5 6.4 5.6 12.8 13.9 13.2
Sources: Country authorities; and staff estimates and projections.
1/ Includes both public and private sector external debt. Excludes USD dominated promissory notes of 303.7mn. to state-owned enterprises2/ Derived as [r - g - ρ(1+g)]/(1+g+ρ+gρ) times previous period debt ratio, with r = nominal interest rate; g = real GDP growth rate, and ρ = growth rate of GDP deflator in U.S. dollar terms. 3/ Includes exceptional financing (i.e., changes in arrears and debt relief); changes in gross foreign assets; and valuation adjustments. For projections also includes contribution from price and exchange rate changes.4/ Assumes that PV of private sector debt is equivalent to its face value.5/ Current-year interest payments divided by previous period debt stock. 6/ Historical averages and standard deviations are generally derived over the past 10 years, subject to data availability. 7/ Defined as grants, concessional loans, and debt relief.8/ Grant-equivalent financing includes grants provided directly to the government and through new borrowing (difference between the face value and the PV of new debt).
Actual
Table 1A.: External Debt Sustainability Framework, Baseline Scenario, 2010–2033 1/(In percent of GDP, unless otherwise indicated)
Projections
INTERN
ATION
AL MO
NETARY FU
ND
2
GH
ANA
INTERN
ATION
ALM
ON
ETARYFU
ND
9

Estimate
2010 2011 2012 Average 5/ Standard D5/ 2013 2014 2015 2016 2017 20182013-18 Average 2023 2033
2019-33 Average
Public sector debt 1/ 45.7 42.5 50.2 51.4 52.5 52.5 52.9 54.9 54.8 56.3 52.1of which: foreign-currency denominated 19.4 19.7 21.9 22.5 23.5 24.5 25.7 26.9 27.5 29.7 23.2
Public Sector debt, excluding arrears 37.4 39.5 47.2 50.3 52.5 52.5 52.9 54.9 54.8 56.3 52.1
Change in public sector debt 9.6 -3.1 7.7 1.3 1.0 0.0 0.4 2.1 -0.1 0.0 -0.4
Identified debt-creating flows 2.4 -3.9 5.5 2.2 1.5 -0.3 0.1 0.7 -0.3 -0.1 -0.4
Primary deficit 4.8 1.3 7.9 3.4 2.6 6.5 5.1 2.3 2.3 2.3 2.2 3.5 0.7 0.3 0.5
Revenue and grants 16.8 19.3 19.3 20.5 21.0 21.3 21.4 21.6 22.3 21.7 21.6
of which: grants 2.3 2.0 1.6 1.4 1.0 0.9 0.9 0.8 0.6 0.4 0.1
Primary (noninterest) expenditure 21.6 20.6 27.2 27.0 26.1 23.6 23.8 23.9 24.5 22.4 21.9
Automatic debt dynamics -3.1 -6.1 -2.2 -4.2 -3.5 -2.6 -2.1 -1.6 -2.5 -0.7 -0.7Contribution from interest rate/growth differential -1.1 -6.2 -2.8 -3.7 -2.7 -1.9 -1.5 -1.2 -2.5 -0.7 -0.7of which: contribution from average real interest rate 1.5 -0.2 0.3 0.0 0.3 0.8 1.0 1.4 1.6 2.0 2.0of which: contribution from real GDP growth -2.7 -6.0 -3.1 -3.7 -3.0 -2.7 -2.5 -2.5 -4.1 -2.8 -2.7Contribution from real exchange rate depreciation -2.0 0.1 0.6 -0.6 -0.8 -0.7 -0.6 -0.4 -0.1 ... ...Other identified debt-creating flows 0.7 0.8 -0.2 -0.1 -0.1 -0.1 -0.1 -0.1 -0.1 0.0 0.0Privatization receipts (negative) 1.0 1.0 0.0 0.0 0.0 0.0 0.0 0.0 0.0 0.0 0.0Recognition of implicit or contingent liabilities 0.0 0.0 0.0 0.0 0.0 0.0 0.0 0.0 0.0 0.0 0.0Debt relief (HIPC and other) -0.3 -0.2 -0.2 -0.1 -0.1 -0.1 -0.1 -0.1 -0.1 0.0 0.0Other (specify, e.g. bank recapitalization) 0.0 0.0 0.0 0.0 0.0 0.0 0.0 0.0 0.0 0.0 0.0Residual, including asset changes 7.2 0.8 2.2 -0.9 -0.5 0.3 0.3 1.4 0.2 0.1 0.0
Other Sustainability IndicatorsPV of public sector debt ... ... 46.0 47.7 49.1 49.5 50.4 53.1 53.4 56.1 52.4of which: foreign-currency denominated ... ... 17.7 18.8 20.1 21.6 23.2 25.1 26.1 29.5 23.5of which: external ... ... 17.7 18.8 20.1 21.6 23.2 25.1 26.1 29.5 23.5PV of contingent liabilities (not included in public sector debt) ... ... ... ... ... ... ... ... ... ... ...Gross financing need 2/ 12.1 11.3 17.8 18.5 19.6 17.3 17.0 18.0 17.2 17.1 17.9PV of public sector debt-to-revenue and grants ratio (in percent) … … 238.6 232.7 234.3 232.4 235.0 245.5 239.7 258.4 243.1PV of public sector debt-to-revenue ratio (in percent) … … 259.9 250.0 246.4 242.1 245.1 254.9 246.8 263.2 244.6of which: external 3/ … … 99.8 98.4 101.0 105.4 112.7 120.3 120.7 138.3 109.8Debt service-to-revenue and grants ratio (in percent) 4/ 23.7 25.4 27.0 30.3 28.5 29.7 29.0 33.9 29.1 37.6 40.5Debt service-to-revenue ratio (in percent) 4/ 27.6 28.4 29.5 32.6 30.0 31.0 30.3 35.2 29.9 38.3 40.7Primary deficit that stabilizes the debt-to-GDP ratio -4.8 4.5 0.2 5.3 4.1 2.3 1.9 0.2 2.3 0.6 0.7
Key macroeconomic and fiscal assumptionsReal GDP growth (in percent) 8.0 15.0 7.9 7.2 3.1 7.9 6.1 5.5 5.1 5.1 8.0 6.3 5.2 5.5 5.3Average nominal interest rate on forex debt (in percent) 0.0 3.6 2.9 0.7 1.4 3.0 2.7 3.0 3.4 4.1 4.3 3.4 5.6 6.8 5.9Average real interest rate on domestic debt (in percent) 1.7 -1.9 0.5 -1.0 3.8 -1.1 0.1 1.9 2.5 3.2 4.1 1.8 4.4 3.7 4.1Real exchange rate depreciation (in percent, + indicates depreciation) -10.2 0.6 3.0 -5.1 7.8 -2.8 -3.6 -2.9 -2.7 -1.5 -0.2 -2.3 0.1 0.0 0.0Inflation rate (GDP deflator, in percent) 16.5 13.0 13.3 17.2 5.2 13.7 12.8 11.1 10.3 8.8 7.4 10.7 6.8 6.9 6.9Growth of real primary spending (deflated by GDP deflator, in percent) 15.2 9.9 42.3 15.1 13.5 7.3 2.4 -4.4 5.7 5.8 10.5 4.5 4.5 4.3 4.5Grant element of new external borrowing (in percent) ... ... ... … … 2.8 -2.8 -4.6 -9.3 -14.1 -13.3 -6.9 -19.0 -21.4 -19.5
Sources: Country authorities; and staff estimates and projections.1/ Excluding arrears to state-owned enterprises.2/ Gross financing need is defined as the primary deficit plus debt service plus the stock of short-term debt at the end of the last period. 3/ Revenues excluding grants.4/ Debt service is defined as the sum of interest and amortization of medium and long-term debt.5/ Historical averages and standard deviations are generally derived over the past 10 years, subject to data availability.
Table 2A. Ghana: Public Sector Debt Sustainability Framework, Baseline Scenario, 2010–2033(In percent of GDP, unless otherwise indicated)
Actual Projections
GH
ANA
10IN
TERNATIO
NAL
MO
NETARY
FUN
D
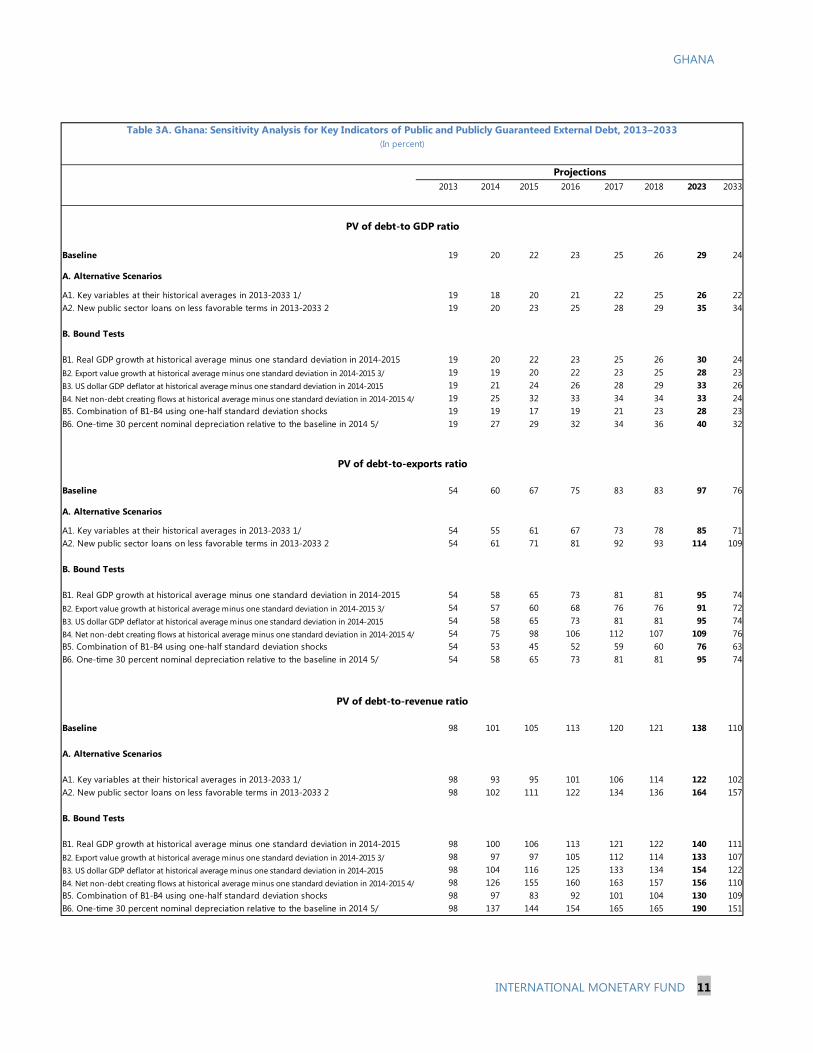
GHANA
INTERNATIONAL MONETARY FUND 11
2013 2014 2015 2016 2017 2018 2023 2033
Baseline 19 20 22 23 25 26 29 24
A. Alternative Scenarios
A1. Key variables at their historical averages in 2013-2033 1/ 19 18 20 21 22 25 26 22A2. New public sector loans on less favorable terms in 2013-2033 2 19 20 23 25 28 29 35 34
B. Bound Tests
B1. Real GDP growth at historical average minus one standard deviation in 2014-2015 19 20 22 23 25 26 30 24B2. Export value growth at historical average minus one standard deviation in 2014-2015 3/ 19 19 20 22 23 25 28 23B3. US dollar GDP deflator at historical average minus one standard deviation in 2014-2015 19 21 24 26 28 29 33 26B4. Net non-debt creating flows at historical average minus one standard deviation in 2014-2015 4/ 19 25 32 33 34 34 33 24B5. Combination of B1-B4 using one-half standard deviation shocks 19 19 17 19 21 23 28 23B6. One-time 30 percent nominal depreciation relative to the baseline in 2014 5/ 19 27 29 32 34 36 40 32
Baseline 54 60 67 75 83 83 97 76
A. Alternative Scenarios
A1. Key variables at their historical averages in 2013-2033 1/ 54 55 61 67 73 78 85 71A2. New public sector loans on less favorable terms in 2013-2033 2 54 61 71 81 92 93 114 109
B. Bound Tests
B1. Real GDP growth at historical average minus one standard deviation in 2014-2015 54 58 65 73 81 81 95 74B2. Export value growth at historical average minus one standard deviation in 2014-2015 3/ 54 57 60 68 76 76 91 72B3. US dollar GDP deflator at historical average minus one standard deviation in 2014-2015 54 58 65 73 81 81 95 74B4. Net non-debt creating flows at historical average minus one standard deviation in 2014-2015 4/ 54 75 98 106 112 107 109 76B5. Combination of B1-B4 using one-half standard deviation shocks 54 53 45 52 59 60 76 63B6. One-time 30 percent nominal depreciation relative to the baseline in 2014 5/ 54 58 65 73 81 81 95 74
Baseline 98 101 105 113 120 121 138 110
A. Alternative Scenarios
A1. Key variables at their historical averages in 2013-2033 1/ 98 93 95 101 106 114 122 102A2. New public sector loans on less favorable terms in 2013-2033 2 98 102 111 122 134 136 164 157
B. Bound Tests
B1. Real GDP growth at historical average minus one standard deviation in 2014-2015 98 100 106 113 121 122 140 111B2. Export value growth at historical average minus one standard deviation in 2014-2015 3/ 98 97 97 105 112 114 133 107B3. US dollar GDP deflator at historical average minus one standard deviation in 2014-2015 98 104 116 125 133 134 154 122B4. Net non-debt creating flows at historical average minus one standard deviation in 2014-2015 4/ 98 126 155 160 163 157 156 110B5. Combination of B1-B4 using one-half standard deviation shocks 98 97 83 92 101 104 130 109B6. One-time 30 percent nominal depreciation relative to the baseline in 2014 5/ 98 137 144 154 165 165 190 151
Table 3A. Ghana: Sensitivity Analysis for Key Indicators of Public and Publicly Guaranteed External Debt, 2013–2033(In percent)
PV of debt-to GDP ratio
Projections
PV of debt-to-exports ratio
PV of debt-to-revenue ratio

GHANA
12 INTERNATIONAL MONETARY FUND
2013 2014 2015 2016 2017 2018 2023 2033
Baseline 5 4 4 5 9 6 13 14
A. Alternative Scenarios
A1. Key variables at their historical averages in 2013-2033 1/ 5 4 4 4 8 5 10 8A2. New public sector loans on less favorable terms in 2013-2033 2/ 5 4 4 4 9 5 14 22
B. Bound Tests
B1. Real GDP growth at historical average minus one standard deviation in 2014-2015 5 4 4 5 9 6 13 14B2. Export value growth at historical average minus one standard deviation in 2014-2015 3/ 5 4 4 5 9 6 12 14B3. US dollar GDP deflator at historical average minus one standard deviation in 2014-2015 5 4 4 5 9 6 13 14B4. Net non-debt creating flows at historical average minus one standard deviation in 2014-2015 4/ 5 4 5 7 12 10 16 14B5. Combination of B1-B4 using one-half standard deviation shocks 5 4 4 4 8 4 10 12B6. One-time 30 percent nominal depreciation relative to the baseline in 2014 5/ 5 4 4 5 9 6 13 14
Baseline 9 6 7 7 14 9 18 20
A. Alternative Scenarios
A1. Key variables at their historical averages in 2013-2033 1/ 9 6 6 6 11 8 14 12A2. New public sector loans on less favorable terms in 2013-2033 2/ 9 6 6 7 13 8 20 32
B. Bound Tests
B1. Real GDP growth at historical average minus one standard deviation in 2014-2015 9 6 7 8 14 10 19 21B2. Export value growth at historical average minus one standard deviation in 2014-2015 3/ 9 6 7 7 13 9 18 20B3. US dollar GDP deflator at historical average minus one standard deviation in 2014-2015 9 7 8 8 16 11 21 23B4. Net non-debt creating flows at historical average minus one standard deviation in 2014-2015 4/ 9 6 8 10 18 14 22 21B5. Combination of B1-B4 using one-half standard deviation shocks 9 6 7 6 13 8 17 20B6. One-time 30 percent nominal depreciation relative to the baseline in 2014 5/ 9 9 10 10 19 13 26 28
Memorandum item:Grant element assumed on residual financing (i.e., financing required above baseline) 6/ -25 -25 -25 -25 -25 -25 -25 -25
Sources: Country authorities; and staff estimates and projections.
an offsetting adjustment in import levels ).
4/ Includes officia l and private transfers and FDI.
5/ Depreciation is defined as percentage decl ine in dol la r/local currency rate, such that i t never exceeds 100 percent.
6/ Appl ies to a l l s tress scenarios except for A2 (less favorable financing) in which the terms on a l l new financing are as speci fied in footnote 2.
3/ Exports va lues are assumed to remain permanently a t the lower level , but the current account as a share of GDP is assumed to return to i ts basel ine level after the shock (impl ici tly assuming
Debt service-to-revenue ratio
1/ Variables include real GDP growth, growth of GDP deflator (in U.S. dol lar terms), non-interest current account in percent of GDP, and non-debt creating flows.
2/ Assumes that the interest rate on new borrowing i s by 2 percentage points higher than in the basel ine., whi le grace and maturi ty periods are the same as in the basel ine.
Projections
Debt service-to-exports ratio
Table 3A. Ghana: Sensitivity Analysis for Key Indicators of Public and Publicly Guaranteed External Debt, 2013-2033 (continued)
(In percent)

GHANA
INTERNATIONAL MONETARY FUND 13
2013 2014 2015 2016 2017 2018 2023 2033
Baseline 48 49 50 50 53 53 56 52
A. Alternative scenarios
A1. Real GDP growth and primary balance are at historical averages 48 47 48 49 52 54 65 80A2. Primary balance is unchanged from 2010-2012 average* 48 51 56 61 68 73 105 159A3. Permanently lower GDP growth 1/ 48 50 51 52 56 57 68 91
B. Bound tests
B1. Real GDP growth is at historical average minus one standard deviations in 2014-2015 48 50 52 54 57 58 65 67B2. Primary balance is at historical average minus one standard deviations in 2014-2015 48 50 55 55 58 58 61 56B3. Combination of B1-B2 using one half standard deviation shocks 48 49 52 53 56 56 59 55B4. One-time 30 percent real depreciation in 2014 48 58 58 59 62 63 70 81B5. 10 percent of GDP increase in other debt-creating flows in 2014 48 60 60 61 64 63 65 61
Baseline 233 234 232 235 245 240 258 243
A. Alternative scenarios
A1. Real GDP growth and primary balance are at historical averages 233 223 224 229 240 243 300 374A2. Primary balance is unchanged from 2010-2012 average* 233 242 261 285 316 327 483 737A3. Permanently lower GDP growth 1/ 233 236 237 244 259 257 314 423
B. Bound tests
B1. Real GDP growth is at historical average minus one standard deviations in 2014-2015 233 240 245 251 265 262 298 311B2. Primary balance is at historical average minus one standard deviations in 2014-2015 233 239 256 259 269 261 279 262B3. Combination of B1-B2 using one half standard deviation shocks 233 233 243 246 257 250 270 255B4. One-time 30 percent real depreciation in 2014 233 275 271 273 286 281 324 374B5. 10 percent of GDP increase in other debt-creating flows in 2014 233 287 283 285 294 285 302 281
Baseline 30 28 30 29 34 29 38 40
A. Alternative scenarios
A1. Real GDP growth and primary balance are at historical averages 30 28 28 26 33 29 41 59A2. Primary balance is unchanged from 2010-2012 average* 30 28 30 32 41 38 67 118A3. Permanently lower GDP growth 1/ 30 29 30 30 35 31 45 67
B. Bound tests
B1. Real GDP growth is at historical average minus one standard deviations in 2014-2015 30 29 31 31 36 31 43 51B2. Primary balance is at historical average minus one standard deviations in 2014-2015 30 28 30 32 39 32 41 44B3. Combination of B1-B2 using one half standard deviation shocks 30 29 30 30 37 30 39 42B4. One-time 30 percent real depreciation in 2014 30 30 33 33 41 35 53 73B5. 10 percent of GDP increase in other debt-creating flows in 2014 30 28 34 41 40 34 46 47
Sources: Country authorities; and staff estimates and projections.1/ Assumes that real GDP growth is at baseline minus one standard deviation divided by the square root of the length of the projection period.2/ Revenues are defined inclusive of grants.
Table 4A. Ghana: Sensitivity Analysis for Key Indicators of Public Debt 2013–2033
PV of Debt-to-GDP Ratio
Projections
PV of Debt-to-Revenue Ratio 2/
Debt Service-to-Revenue Ratio 2/

GHANA STAFF REPORT FOR THE 2013 ARTICLE IV CONSULTATION—ENHANCING FINANCIAL SECTOR SURVEILLANCE
Prepared by
The Monetary and Capital Markets Department and the World Bank. The authors are Susan M. George (MCM), Ian Tower, and Bryn Vollan (MCM experts); and Cedric Mousset and Rachel Sberro (WB). The Enhancing Financial Sector Surveillance mission to Ghana was March 14–27, 2013. The work was facilitated by Samir Jahjah, the IMF resident representative in Ghana, and Carmencita Santos, the IMF’s long-term resident advisor in the Bank of Ghana.
CONTENTS
GLOSSARY ___________________________________________________________________________ 3
INTRODUCTION _____________________________________________________________________ 4
MACROECONOMIC ENVIRONMENT IN 2012 ______________________________________ 5
OVERVIEW OF THE FINANCIAL SYSTEM ___________________________________________ 6
THE BANKING SECTOR _____________________________________________________________ 7
A. Access to Credit and Banks’ Performance __________________________________________ 7
B. Banking Soundness ________________________________________________________________ 9
C. Regulatory and Supervisory Developments _______________________________________ 12
NONBANK FINANCIAL SECTOR ___________________________________________________ 15
A. Overview of Financial Services ____________________________________________________ 15
B. Rural and Community Banks ______________________________________________________ 16
C. Microfinance Services _____________________________________________________________ 17
D. Mobile Banking ___________________________________________________________________ 18
E. Insurance _________________________________________________________________________ 18
May 29, 2013

GHANA
2 INTERNATIONAL MONETARY FUND
ROLE OF THE STATE IN THE FINANCIAL SYSTEM ________________________________ 19
A. Public Banks ______________________________________________________________________ 19
B. Social Security and National Insurance Trust ______________________________________ 21
C. Independence of the Supervisor __________________________________________________ 22
D. Policy Recommendations _________________________________________________________ 22
MONETARY POLICY FRAMEWORK AND IMPLEMENTATION ____________________ 23
A. Inflation Targeting: Challenges and Opportunities ________________________________ 23
B. Liquidity Management Framework ________________________________________________ 23
C. Money and Foreign Exchange Markets ___________________________________________ 25
D. Policy Recommendations _________________________________________________________ 27
FIGURES 1. Evolution of Returns on Average Asset (ROAA) and Equity (ROEE) ________________ 9 2. Evolution of NPLs, Provisions, CARs and Leverage Ratios, 2005–2012 ____________ 10 3. Evolution of Liquidity Ratios, 2005-2012 _________________________________________ 10 4. Selected Interest Rates, Credit to GDP and NPL Rate _____________________________ 11 5. Policy Rate and Money Market Interest Rates (Jan 2007–Dec 2012) _______________ 24 6. Interbank Market Activities (Jan 2008–Mar 2013 __________________________________ 26 7. Foreign Exchange Interbank Market (daily; 2012) _________________________________ 26 TABLES 1. Structure of the Financial System __________________________________________________ 6 2. Types of Financial Institutions Outside Commercial Banks _______________________ 16 3. Overview of the Shareholding of the Four Public Banks (2012) ___________________ 19 4. Key Financial and Prudential Indicators of Public Banks (2012) ____________________ 20 APPENDIX I. Evolution of Financial Indicators (2002–2011) _____________________________________ 28

GHANA
INTERNATIONAL MONETARY FUND 3
GLOSSARY
ADB BCPs ECF ELA
Agricultural Development Bank Basel Core Principles Extended Credit Facility Emergency Liquidity Assistance
BOG Bank of Ghana CAR CGAP DIS FIT GCB GCSCA GIFMIS GHAMFIN GIB
Capital Adequacy Ratio The Consultative Group to Assist the Poor Deposit Insurance Scheme Financial Investment Trust Ghana Commercial Bank Ghana Cooperative Susu Collectors Association Ghana Integrated Financial Management Information System Ghana Micro Finance Institutions Network Ghana International Bank
MNO Mobile Network Operators MoF Ministry of Finance MOU MPC NBFIs
Memorandum of Understanding Monetary Policy Committee Nonbank Financial Institutions
NPRA RCB
National Pension Regulatory Authority Rural and Community Banks
SEC SMEs SSNIT
Ghana Securities and Exchange Commission Small-and Medium-Sized Enterprises Social Security and National Insurance Trust
WAMZ West African Monetary Zone
GHANA
4 INTERNATIONAL MONETARY FUND
INTRODUCTION 1. Ghana was selected to be one of the pilot cases for enhancing surveillance of financial systems called for by Executive Board in May 2012 (FO/DIS/12/66).1
2. This study comes on the heels of the Ghana Financial Sector Assessment Program (FSAP) update conducted in February 2011. Section II presents the macroeconomic context shaped by expansionary fiscal policy in the run-up to the elections in 2012. Section III presents an overview of the financial system, focusing on the dominant banking sector. Section IV, identifies emerging vulnerabilities, including supervisory challenges associated with risks identified in the FSAP update and new risks from the evolving financial landscape, with a growing presence of regional banks. Section V reviews financial access provided by nonbank financial institutions, and associated risks. Given the active role the government has played in the financial system, section VI examines the extent of this role, and suggests how it could be modified to create a more robust sector that can provide greater access and competition for banking services. Finally, the Board paper highlights the interaction of the financial sector with the effectiveness of monetary policy implementation. Section VII reviews the monetary policy framework in Ghana, and recommends how monetary policy implementation could be improved. This section also makes recommendations of how to develop the still small interbank and foreign exchange markets.
The Board discussion found that a shallow and undiversified financial sector creates macro-financial vulnerabilities that impact the macroeconomy, and its ability to sustain growth and reduce poverty. While important to understand how to generate financial deepening that will provide greater access to credit and financial services, the process of deepening itself carries with it its own risks if there is inadequate supervision and regulation. The paper also shows that undeveloped financial systems constrain monetary policy implementation and the efficacy of its transmission mechanism as these systems are often characterized by excess liquidity and thin government debt markets rendering interest rates less correlated with policy rates.
3. The main findings are as follows:
• While the banking system has grown rapidly and is competitive by standard metrics (barriers to entry and concentration of assets), private credit has remained relatively low as a share of GDP and access to affordable credit is a major constraint on growth.2
1 To date, Benin, Senegal, the West African Economic, and Monetary Union and Haiti have been included as pilot cases.
2 See Appendix II of the accompanying staff report for a discussion of inclusive growth successes and challenges in Ghana

GHANA
INTERNATIONAL MONETARY FUND 5
• High real interest rates—a result of structural factors, such as high operating cost, but also excessive government borrowing—are constraining private sector access and create risks of a renewed increase in nonperforming loans (NPLs).
• An upgrading of financial sector legislation and supervisory practices is ongoing and is needed to deal with the growing complexities of an evolving financial landscape with increased foreign participation and a growing role of microfinance institutions.
• Rural and Community Banks have become a main channel for financial inclusion, though only about 30 percent of adults have an account at a formal institution. A sizeable part of the population relies instead on the services of about 600 microfinance companies, as well as 3,000-5,000 individual susu collectors that serve over half a million customers.
• The ownership role of the state, especially of the BoG, in the financial sector raises concerns about a level playing field and reputational risks to the BoG’s credibility as an independent regulator and supervisor. Risks also arise from the slow decision-making and resolution process for the two remaining weak banks.
• The BoG has the tools to conduct effective inflation targeting, but there is room to improve its forecasting and liquidity management framework to restore the signaling role of its policy rate.
• A return to fiscal discipline and effective policy coordination are needed for successful further disinflation and increased financial deepening.
MACROECONOMIC ENVIRONMENT IN 2012 4. While real GDP growth in Ghana has been steady and robust in recent years, the fiscal surge in 2012 in the run-up to elections creates risks for economic and financial stability. GDP growth in 2012 was 8 percent, with a rising public sector wage bill and costly energy subsides pushing both the fiscal and current account deficits to about 12 percent of GDP. The government financed almost 80 percent of its deficit domestically, and additionally accumulated new arrears. The repeated occurrence of government arrears introduces uncertainty into financial transactions, as banks are concerned that NPLs may increase. They particularly reduce access of smaller firms that depend on government contracts, because banks tend to scrutinize them more, anticipating the risk of nonpayment.
5. In response to rapid exchange rate depreciation, monetary policy was tightened in the second half of 2012. The currency has since stabilized, but at the cost of double-digit real interest rates. The year ended with inflation remaining in single digits at 8.8 percent, helped by low food and repressed domestic fuel prices.

GHANA
6 INTERNATIONAL MONETARY FUND
6. Following the fiscal deficit surge and the tight monetary stance, the price of borrowing shot up. Starting at below 10 percent at end-2011, interest rates on 91-day Treasury bills went from close to 14 percent in the first half of 2012 to 21½ percent in the second half, and have inched up to about 23 percent in April. While the policy rate also increased, though only to 15 percent, the interbank rate has hovered at around 19 percent.
7. The large volume of domestically financed government borrowing at high interest rates threatens to crowd out private sector credit. Discussions with banks suggested that they are not eager to extend loans to much riskier small and medium-sized enterprises, when they can so profitably lend to the government at low risk of default.
OVERVIEW OF THE FINANCIAL SYSTEM 8. Ghana’s financial sector is bank dominated. Commercial banks account for more than 75 percent of total financial sector assets, followed distantly by Rural and Community Banks (5 percent), while pension funds, the insurance sector and other sectors such as leasing are still at a nascent stage (Table 1).
9. The banking sector has grown by almost 60 percent since 2010, with total commercial banks assets reaching GH¢27 billion in 2012. Foreign banks account for 55 percent of commercial bank assets, with various banks from Europe, Nigeria and South Africa having established offices in Ghana. (Appendix 1 shows selected financial indicators in Ghana over time, benchmarked against what would be predicted using similar characteristics including GDP per capita.)
Table 1. Structure of the Financial System
Number Total Assets (GH¢) Percent of total assets Number Total Assets (GH¢) Percent of total
assets Number Total Assets (GH¢) Percent of total assets
Total Financial System 1/ 23,334,825,074 100 29,574,084,492 100 36,526,615,467 100.0
Commercial Banks 26 17,397,657,156 74.6 27 22,059,059,114 74.6 26 27,237,112,536 74.6
Nonbank Financial Institutions 2,007,335,933 8.6 2,952,457,425 10.0 4,374,090,081 5.1Rural and Community Banks 133 875,820,000 3.8 132 1,156,660,000 3.9 133 1,524,030,000 5.1Other Banking and Quasi Banking Institutions 1,131,515,933 4.8 1,795,797,425 6.1 2,850,060,081 2/ 7.8
Insurance companies 948,831,985 4.1 1,142,567,953 3.9 1,191,267,381 3.3
Pension funds 2,981,000,000 12.8 3,420,000,000 11.6 3,923,649,782 2/ 11.6
Memorandum ItemsGDP (millions of GH¢) 46,236 59,816 73,109 Total financial sector assets/GDP 50.5 49.4 45.4
1/ Capital market data was not included in this table.2/ Since 2012 data for "other banking and quasi banking institutions" and "pension funds" is not available, the same growth as 2011 is assumed.
2010 2011 2012
Table 1: Ghana: Structure of the Financial System
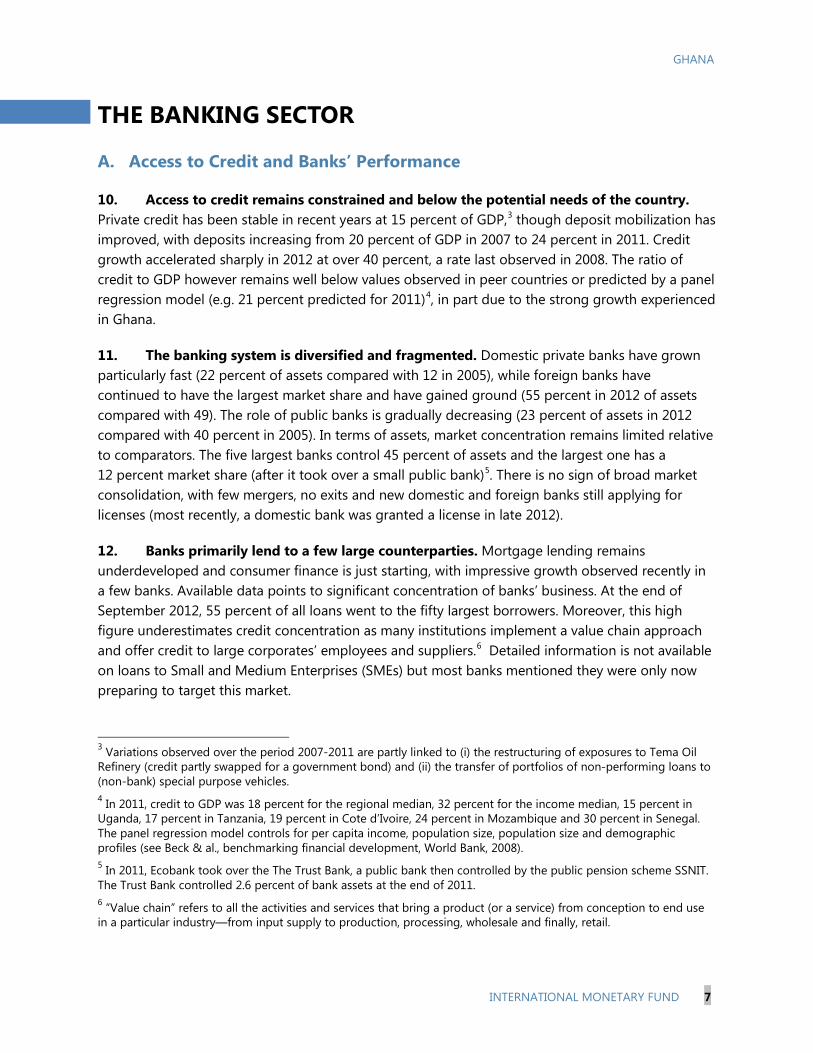
GHANA
INTERNATIONAL MONETARY FUND 7
THE BANKING SECTOR
A. Access to Credit and Banks’ Performance
10. Access to credit remains constrained and below the potential needs of the country. Private credit has been stable in recent years at 15 percent of GDP,3 though deposit mobilization has improved, with deposits increasing from 20 percent of GDP in 2007 to 24 percent in 2011. Credit growth accelerated sharply in 2012 at over 40 percent, a rate last observed in 2008. The ratio of credit to GDP however remains well below values observed in peer countries or predicted by a panel regression model (e.g. 21 percent predicted for 2011)4
11. The banking system is diversified and fragmented. Domestic private banks have grown particularly fast (22 percent of assets compared with 12 in 2005), while foreign banks have continued to have the largest market share and have gained ground (55 percent in 2012 of assets compared with 49). The role of public banks is gradually decreasing (23 percent of assets in 2012 compared with 40 percent in 2005). In terms of assets, market concentration remains limited relative to comparators. The five largest banks control 45 percent of assets and the largest one has a 12 percent market share (after it took over a small public bank)
, in part due to the strong growth experienced in Ghana.
5
12. Banks primarily lend to a few large counterparties. Mortgage lending remains underdeveloped and consumer finance is just starting, with impressive growth observed recently in a few banks. Available data points to significant concentration of banks’ business. At the end of September 2012, 55 percent of all loans went to the fifty largest borrowers. Moreover, this high figure underestimates credit concentration as many institutions implement a value chain approach and offer credit to large corporates’ employees and suppliers.
. There is no sign of broad market consolidation, with few mergers, no exits and new domestic and foreign banks still applying for licenses (most recently, a domestic bank was granted a license in late 2012).
6
3 Variations observed over the period 2007-2011 are partly linked to (i) the restructuring of exposures to Tema Oil Refinery (credit partly swapped for a government bond) and (ii) the transfer of portfolios of non-performing loans to (non-bank) special purpose vehicles.
Detailed information is not available on loans to Small and Medium Enterprises (SMEs) but most banks mentioned they were only now preparing to target this market.
4 In 2011, credit to GDP was 18 percent for the regional median, 32 percent for the income median, 15 percent in Uganda, 17 percent in Tanzania, 19 percent in Cote d’Ivoire, 24 percent in Mozambique and 30 percent in Senegal. The panel regression model controls for per capita income, population size, population size and demographic profiles (see Beck & al., benchmarking financial development, World Bank, 2008). 5 In 2011, Ecobank took over the The Trust Bank, a public bank then controlled by the public pension scheme SSNIT. The Trust Bank controlled 2.6 percent of bank assets at the end of 2011. 6 “Value chain” refers to all the activities and services that bring a product (or a service) from conception to end use in a particular industry—from input supply to production, processing, wholesale and finally, retail.
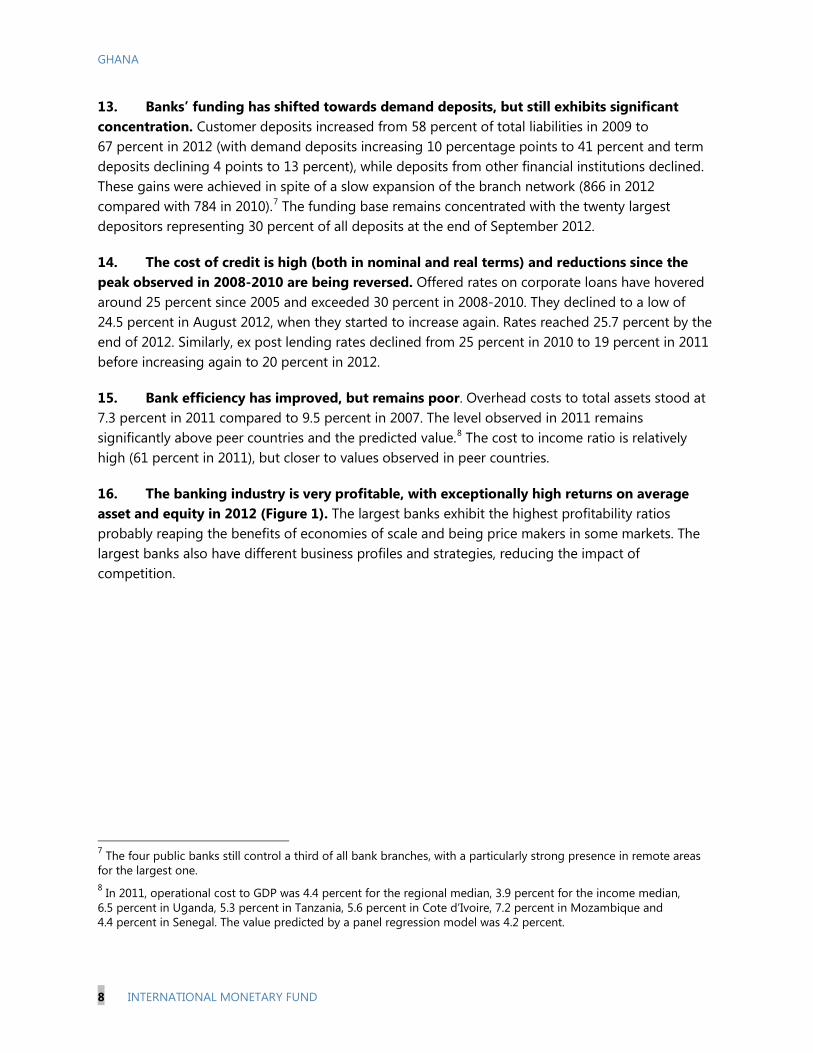
GHANA
8 INTERNATIONAL MONETARY FUND
13. Banks’ funding has shifted towards demand deposits, but still exhibits significant concentration. Customer deposits increased from 58 percent of total liabilities in 2009 to 67 percent in 2012 (with demand deposits increasing 10 percentage points to 41 percent and term deposits declining 4 points to 13 percent), while deposits from other financial institutions declined. These gains were achieved in spite of a slow expansion of the branch network (866 in 2012 compared with 784 in 2010).7
14. The cost of credit is high (both in nominal and real terms) and reductions since the peak observed in 2008-2010 are being reversed. Offered rates on corporate loans have hovered around 25 percent since 2005 and exceeded 30 percent in 2008-2010. They declined to a low of 24.5 percent in August 2012, when they started to increase again. Rates reached 25.7 percent by the end of 2012. Similarly, ex post lending rates declined from 25 percent in 2010 to 19 percent in 2011 before increasing again to 20 percent in 2012.
The funding base remains concentrated with the twenty largest depositors representing 30 percent of all deposits at the end of September 2012.
15. Bank efficiency has improved, but remains poor. Overhead costs to total assets stood at 7.3 percent in 2011 compared to 9.5 percent in 2007. The level observed in 2011 remains significantly above peer countries and the predicted value.8
16. The banking industry is very profitable, with exceptionally high returns on average asset and equity in 2012 (Figure 1). The largest banks exhibit the highest profitability ratios probably reaping the benefits of economies of scale and being price makers in some markets. The largest banks also have different business profiles and strategies, reducing the impact of competition.
The cost to income ratio is relatively high (61 percent in 2011), but closer to values observed in peer countries.
7 The four public banks still control a third of all bank branches, with a particularly strong presence in remote areas for the largest one. 8 In 2011, operational cost to GDP was 4.4 percent for the regional median, 3.9 percent for the income median, 6.5 percent in Uganda, 5.3 percent in Tanzania, 5.6 percent in Cote d’Ivoire, 7.2 percent in Mozambique and 4.4 percent in Senegal. The value predicted by a panel regression model was 4.2 percent.
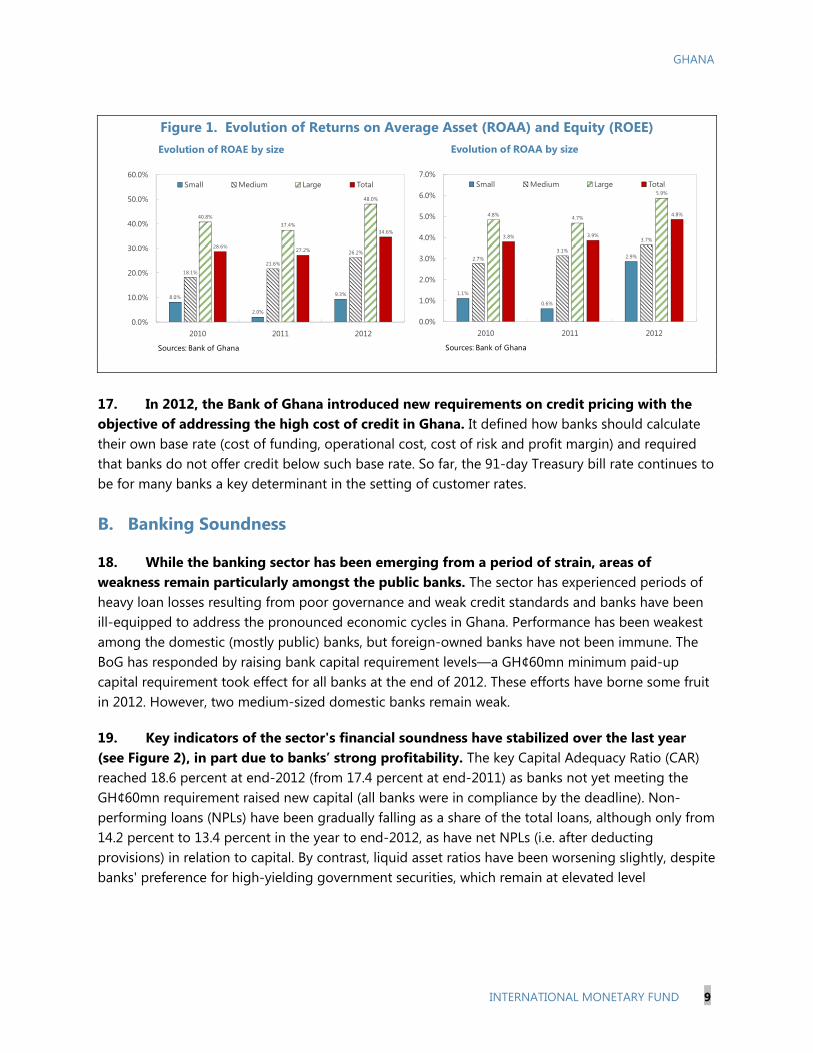
GHANA
INTERNATIONAL MONETARY FUND 9
Figure 1. Evolution of Returns on Average Asset (ROAA) and Equity (ROEE)
17. In 2012, the Bank of Ghana introduced new requirements on credit pricing with the objective of addressing the high cost of credit in Ghana. It defined how banks should calculate their own base rate (cost of funding, operational cost, cost of risk and profit margin) and required that banks do not offer credit below such base rate. So far, the 91-day Treasury bill rate continues to be for many banks a key determinant in the setting of customer rates.
B. Banking Soundness
18. While the banking sector has been emerging from a period of strain, areas of weakness remain particularly amongst the public banks. The sector has experienced periods of heavy loan losses resulting from poor governance and weak credit standards and banks have been ill-equipped to address the pronounced economic cycles in Ghana. Performance has been weakest among the domestic (mostly public) banks, but foreign-owned banks have not been immune. The BoG has responded by raising bank capital requirement levels—a GH¢60mn minimum paid-up capital requirement took effect for all banks at the end of 2012. These efforts have borne some fruit in 2012. However, two medium-sized domestic banks remain weak.
19. Key indicators of the sector's financial soundness have stabilized over the last year (see Figure 2), in part due to banks’ strong profitability. The key Capital Adequacy Ratio (CAR) reached 18.6 percent at end-2012 (from 17.4 percent at end-2011) as banks not yet meeting the GH¢60mn requirement raised new capital (all banks were in compliance by the deadline). Non-performing loans (NPLs) have been gradually falling as a share of the total loans, although only from 14.2 percent to 13.4 percent in the year to end-2012, as have net NPLs (i.e. after deducting provisions) in relation to capital. By contrast, liquid asset ratios have been worsening slightly, despite banks' preference for high-yielding government securities, which remain at elevated level
8.0%
2.0%
9.3%
18.1%
21.6%
26.2%
40.8%37.4%
48.0%
28.6%27.2%
34.6%
0.0%
10.0%
20.0%
30.0%
40.0%
50.0%
60.0%
2010 2011 2012
Small Medium Large Total
Evolution of ROAE by size
Sources: Bank of Ghana
1.1%
0.6%
2.9%2.7%3.1%
3.7%
4.8% 4.7%
5.9%
3.8% 3.9%
4.8%
0.0%
1.0%
2.0%
3.0%
4.0%
5.0%
6.0%
7.0%
2010 2011 2012
Small Medium Large Total
Evolution of ROAA by size
Sources: Bank of Ghana
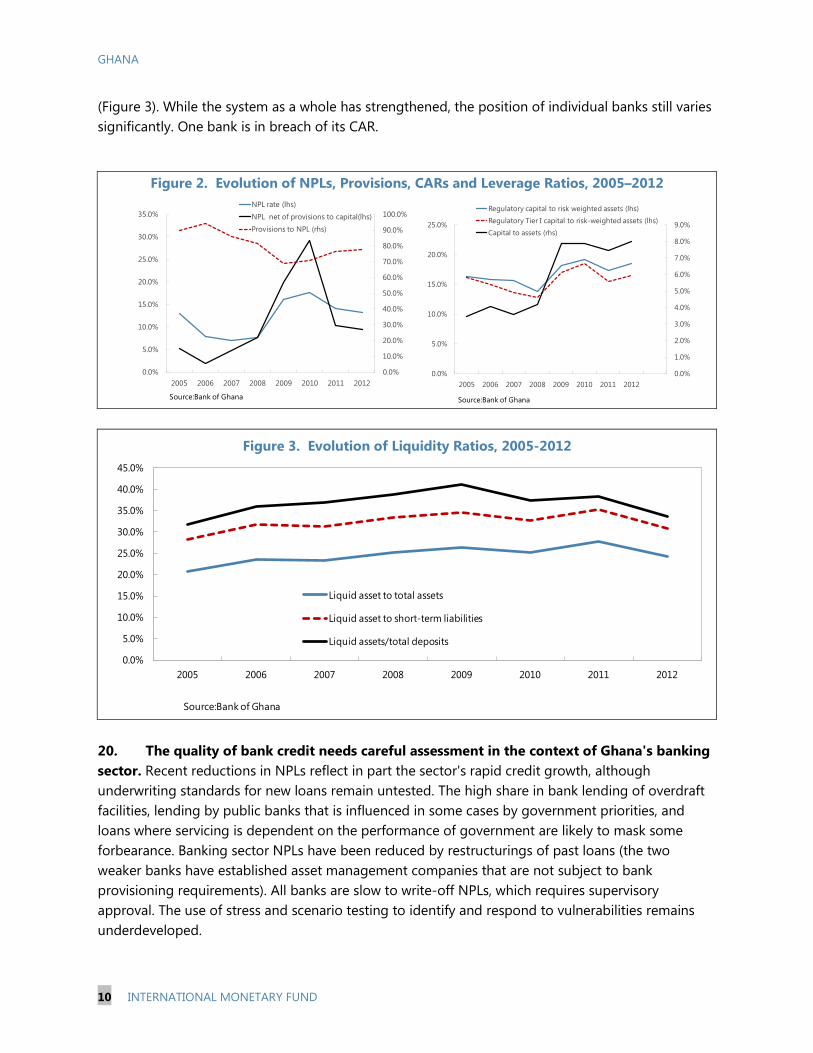
GHANA
10 INTERNATIONAL MONETARY FUND
(Figure 3). While the system as a whole has strengthened, the position of individual banks still varies significantly. One bank is in breach of its CAR.
Figure 2. Evolution of NPLs, Provisions, CARs and Leverage Ratios, 2005–2012
Figure 3. Evolution of Liquidity Ratios, 2005-2012
0.0%
5.0%
10.0%
15.0%
20.0%
25.0%
30.0%
35.0%
40.0%
45.0%
2005 2006 2007 2008 2009 2010 2011 2012
Liquid asset to total assets
Liquid asset to short-term liabilities
Liquid assets/total deposits
Source:Bank of Ghana
20. The quality of bank credit needs careful assessment in the context of Ghana's banking sector. Recent reductions in NPLs reflect in part the sector's rapid credit growth, although underwriting standards for new loans remain untested. The high share in bank lending of overdraft facilities, lending by public banks that is influenced in some cases by government priorities, and loans where servicing is dependent on the performance of government are likely to mask some forbearance. Banking sector NPLs have been reduced by restructurings of past loans (the two weaker banks have established asset management companies that are not subject to bank provisioning requirements). All banks are slow to write-off NPLs, which requires supervisory approval. The use of stress and scenario testing to identify and respond to vulnerabilities remains underdeveloped.
0.0%
10.0%
20.0%
30.0%
40.0%
50.0%
60.0%
70.0%
80.0%
90.0%
100.0%
0.0%
5.0%
10.0%
15.0%
20.0%
25.0%
30.0%
35.0%
2005 2006 2007 2008 2009 2010 2011 2012
NPL rate (lhs)NPL net of provisions to capital(lhs)Provisions to NPL (rhs)
Source:Bank of Ghana
0.0%
10.0%
20.0%
30.0%
40.0%
50.0%
60.0%
70.0%
80.0%
90.0%
100.0%
0.0%
5.0%
10.0%
15.0%
20.0%
25.0%
30.0%
35.0%
2005 2006 2007 2008 2009 2010 2011 2012
NPL rate (lhs)NPL net of provisions to capital(lhs)Provisions to NPL (rhs)
Source:Bank of Ghana
0.0%
1.0%
2.0%
3.0%
4.0%
5.0%
6.0%
7.0%
8.0%
9.0%
0.0%
5.0%
10.0%
15.0%
20.0%
25.0%
2005 2006 2007 2008 2009 2010 2011 2012
Regulatory capital to risk weighted assets (lhs)Regulatory Tier I capital to risk-weighted assets (lhs)Capital to assets (rhs)
Source:Bank of Ghana
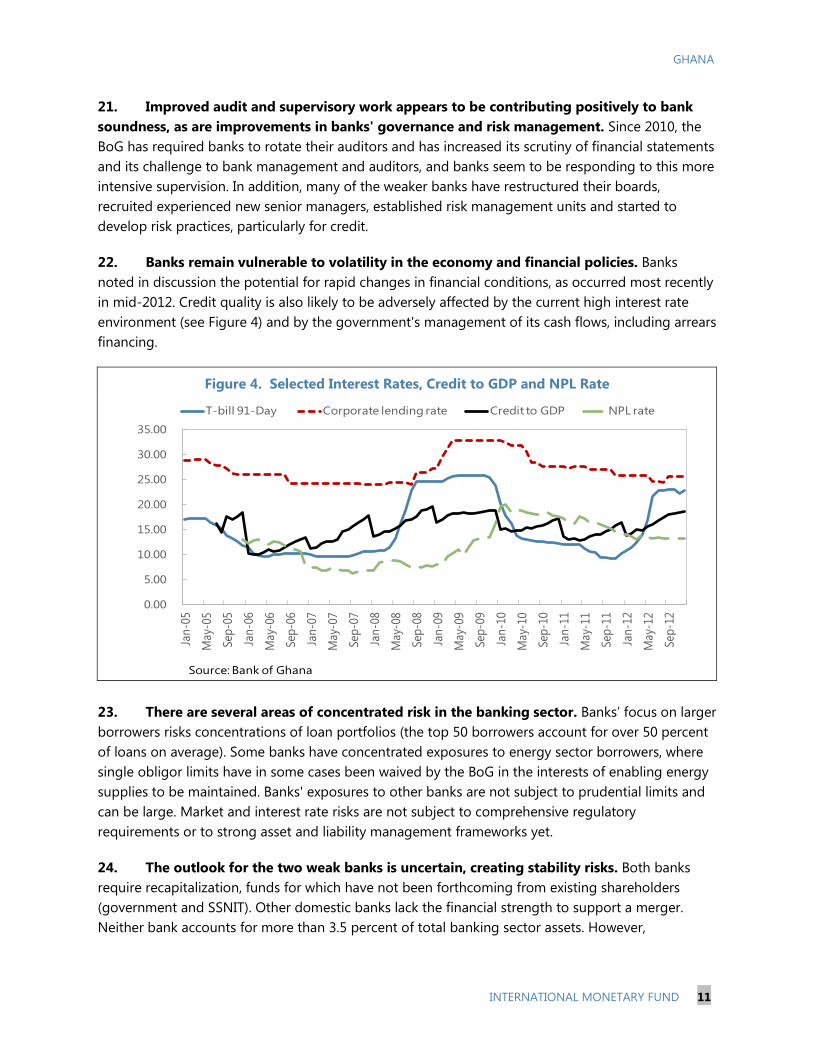
GHANA
INTERNATIONAL MONETARY FUND 11
21. Improved audit and supervisory work appears to be contributing positively to bank soundness, as are improvements in banks' governance and risk management. Since 2010, the BoG has required banks to rotate their auditors and has increased its scrutiny of financial statements and its challenge to bank management and auditors, and banks seem to be responding to this more intensive supervision. In addition, many of the weaker banks have restructured their boards, recruited experienced new senior managers, established risk management units and started to develop risk practices, particularly for credit.
22. Banks remain vulnerable to volatility in the economy and financial policies. Banks noted in discussion the potential for rapid changes in financial conditions, as occurred most recently in mid-2012. Credit quality is also likely to be adversely affected by the current high interest rate environment (see Figure 4) and by the government's management of its cash flows, including arrears financing.
Figure 4. Selected Interest Rates, Credit to GDP and NPL Rate
0.00
5.00
10.00
15.00
20.00
25.00
30.00
35.00
Jan-
05
May
-05
Sep-
05
Jan-
06
May
-06
Sep-
06
Jan-
07
May
-07
Sep-
07
Jan -
08
May
-08
Sep -
08
Jan-
09
May
-09
Sep-
09
Jan-
10
May
-10
Sep-
10
Jan-
11
May
-11
Sep-
11
Jan-
12
May
-12
Sep-
12
T-bill 91-Day Corporate lending rate Credit to GDP NPL rate
Source: Bank of Ghana 23. There are several areas of concentrated risk in the banking sector. Banks’ focus on larger borrowers risks concentrations of loan portfolios (the top 50 borrowers account for over 50 percent of loans on average). Some banks have concentrated exposures to energy sector borrowers, where single obligor limits have in some cases been waived by the BoG in the interests of enabling energy supplies to be maintained. Banks' exposures to other banks are not subject to prudential limits and can be large. Market and interest rate risks are not subject to comprehensive regulatory requirements or to strong asset and liability management frameworks yet.
24. The outlook for the two weak banks is uncertain, creating stability risks. Both banks require recapitalization, funds for which have not been forthcoming from existing shareholders (government and SSNIT). Other domestic banks lack the financial strength to support a merger. Neither bank accounts for more than 3.5 percent of total banking sector assets. However,

GHANA
12 INTERNATIONAL MONETARY FUND
uncertainty over the outlook creates risks to confidence. Orderly resolution and closure are currently not being considered.
Policy recommendations
For further financial deepening and for the sector to provide greater access to credit, it is important for the banking sector to be sound and well-functioning. Below are some recommendations to build such a sector. • Address risks posed by the two remaining weak banks as a priority. Where decisions are pending
on potential private sector solutions, other options (including orderly resolution) should be considered and contingency plans developed; weak banks should not be permitted to expand their business beyond current levels (see also section V.)
• Develop further the analysis of NPLs. This could include cross-bank reviews of practices (for example in relation to claims on government and overdraft lending).
• Strengthen capacity to identify and respond to emerging risks, including further development of scenarios and stress testing and closer integration of stability analysis with actions to be taken by bank supervisors to address risks. The BoG should consider requiring banks to hold additional capital buffers against a future downturn.
• Review threats to stability from risk concentrations in the banking sector, including risks related to claims by banks on other banks (which are not subject to single obligor limits) and exposures of foreign-owned banks to the groups of which they are a part.
C. Regulatory and Supervisory Developments
25. The 2011 FSAP made extensive recommendations on strengthening the regulatory and supervisory framework, but implementation has been patchy.9
26. Significant improvements in the BoG's supervisory work provide a basis for the introduction of risk-based supervision. The BoG has strengthened its offsite supervision with an
The assessment of compliance with the Basel Core Principles (BCPs) pointed to many areas where the BoG's powers were inadequate, for example on consolidated supervision and bank resolution; where regulatory standards were weak; where the BoG had not set expectations of banks in relation to issues such as corporate governance; and where effective supervision was being compromised by forbearance. The FSAP also noted the need to develop crisis management arrangements and to strengthen the safety net (by introducing deposit insurance). The BoG has been improving supervision processes but has made limited progress as yet on the FSAP recommendations on regulation and financial stability.
9 A summary of progress on implementing the FSAP key policy recommendations is included in the Staff Report.
GHANA
INTERNATIONAL MONETARY FUND 13
enhanced risk assessment process that addresses key areas of supervisory focus (solvency, liquidity, earnings, management and sensitivity to foreign exchange risk) and assigns to banks an overall rating. The BoG is using its new risk assessments to inform its onsite work program. The first trilateral meetings with bank managements and auditors covered all banks for two years of financial statements, and these meetings are being used to support the development of a more intensive style of supervision.
27. However, this improvement in supervision is not being matched by developments in regulation. Too much of the burden of effective prudential regulation is being placed on supervision which requires significant resources, especially given the number of banks in the sector. The BoG has identified necessary legislative changes including:
• powers to perform consolidated supervision;
• further powers to carry out orderly bank resolution;
• establishment of single obligor limits in relation to banks' exposures to other banks; and
• introduction of administrative sanctions for defined breaches of requirements without the need for summary conviction by a court.
28. The BoG's ability to enforce prudential regulation is currently jeopardized by gaps and inconsistencies in the law and regulations. Preparation by the BoG of draft legislation and its submission to the MoF, the first step in the legislative process, has not been completed. The Bank engaged consultants to undertake the initial drafting, but the work was not undertaken as contracted, causing significant delay and leading to the BoG requesting technical assistance from the IMF. The BoG has made progress with the preparation of implementing regulations and guidelines covering issues such as expectations of external auditors, corporate governance and outsourcing, but these have not been issued.10
29. In addition, there are areas where regulations made under existing powers need to be strengthened:
• Aspects of the CAR calculation framework are weak (including the 50 percent risk weighting of export finance highlighted in the FSAP); and the BoG now needs to move away from emphasizing minimum nominal capital, which is being eroded by inflation,11
• The BoG is relying for its bank liquidity regulation on the primary reserve requirements that form an important part of monetary policy operations; but these are not fit for prudential liquidity
to perfecting its risk-based framework.
10 Staff did not review draft documents in detail. 11 The new requirement was applied earlier (from 2010) to foreign-owned banks than to others (December 2012), reflecting the difficulties which the domestic banks had in meeting the requirement.

GHANA
14 INTERNATIONAL MONETARY FUND
purposes should be supplemented by new liquidity standards drawing as appropriate on the Basel III framework.12
30. Supervisory effectiveness continues to be impaired by forbearance and distraction from prudential objectives. While the BoG plans to restrict new waivers from the single obligor limits to exposures to state-owned enterprises in relation to oil and gas business, banks continue to have expectations that waivers will be granted at short notice where energy supplies are at stake. In other areas, effective supervision may be compromised by the elevation over prudential considerations of wider objectives such as supporting growth in bank lending (the basis for the 50 percent risk weighting for export finance); promotion of bank mergers (the basis for a paid-up capital target); and policy on state-owned banks.
31. Ghana continues to lack a comprehensive crisis management plan and full bank resolution powers. While there has been no bank failure in Ghana since 1999, the authorities have had to manage stress at banks - relying on extensive informal intervention powers, liquidity support by the BoG, and various forms of forbearance. The options provided for resolution in the legal framework remain less than comprehensive. There remains no deposit insurance scheme and no formal crisis coordinating arrangements. Mechanisms for crisis management have proven effective in the short term in preventing instability but are informal and rely on government readiness to provide support that undermines the credibility of alternative approaches, especially the use of resolution powers. The objectives should be to establish practical arrangements for managing a crisis, including the definition of roles and responsibilities; and to build credibility that resolution tools will be used in practice.
Cross border supervision
32. Ghana has extensive responsibilities as a host supervisor (of foreign-owned banks) and needs to deepen further its cross-border supervision. Its position creates supervisory challenges, including where the Ghanaian entity is not seen by the home supervisor to be significant within the group—likely to be the case for most of the foreign-owned banks in Ghana. This may lead to restricted information flows. The BoG needs to take particular care proactively to maintain communication channels with home supervisors. Many of the formal requirements for effective cross-border supervision are in place—including MoUs with many home supervisors and a supervisory college for WAMZ supervisors. Onsite supervisory work is being undertaken jointly with one home supervisor. However, the BoG is not yet engaged in crisis management preparations with home supervisors or in planning for the implications for its supervision of home supervisors’ recovery and resolution planning.
33. The BoG is not assessing the risks to banks arising from foreign ownership. Because it regulates only foreign-owned subsidiaries and not branches, the BoG can impose the same
12 BoG supervisors should also monitor the basis (rates and other conditions such as collateral) on which banks are accepting term deposits and respond to any outliers.

GHANA
INTERNATIONAL MONETARY FUND 15
standards as apply to domestic banks and can restrict intra-group exposures in case of weaknesses in the rest of the group. However, the BoG does not regularly review whether it needs to use its regulatory or supervisory powers to address risks arising from the parent groups or jurisdictions in which they operate; and it allows foreign-owned banks regularly to place large balances with parents and other group members.
Policy recommendations
• Finalize and issue the draft regulations and other materials which the supervisors have drafted.
• As the BoG plans, prepare high quality draft legislation to effect the changes to the legislation needed to strengthen its powers, including enabling it to issue regulations and to impose administrative penalties.
• Enhance prudential standards and supervision, especially for the largest banks, seeking in particular to strengthen capital adequacy and develop full prudential liquidity standards; establish requirements on corporate governance, risk management and controls; apply prudential standards to groups as well as individual banks; and limit scope for forbearance.
• Review supervisory strategies for foreign-owned banks including by assessing the risks in relation to reliance on home supervisors and how to address these, for example by limits on bank exposures to their parents and closer cooperation with home supervisors on crisis management and recovery and resolution planning.
NONBANK FINANCIAL SECTOR
A. Overview of Financial Services
34. Ghana has other types of financial institutions, besides commercial banks. (See Table 5 for a description of these institutions). The legal status of these institutions varies from formal (Rural and Community Banks, Savings and Loans); to semi-formal (microfinance companies or “corporate susus”); and finally, informal and unregulated (individual susu and individual money lenders).
35. Access to financial services is low, with only 29.4 percent of adults having an account at a formal institution in Ghana. Comparatively though, the ratio of banked-to-unbanked adults is slightly higher than the average for sub-Saharan Africa (24.1 percent).
36. Although, collectively, these financial institutions have less than 10 percent of the financial system assets.13
13 Data in this section was taken from the WB publication “The Little Data Book of Financial Inclusion 2012”, CGAP documentation, and interviews with Ghamfin and BSD.
They serve over 4 million poor—often rural—people. In 2012, 5.8 percent
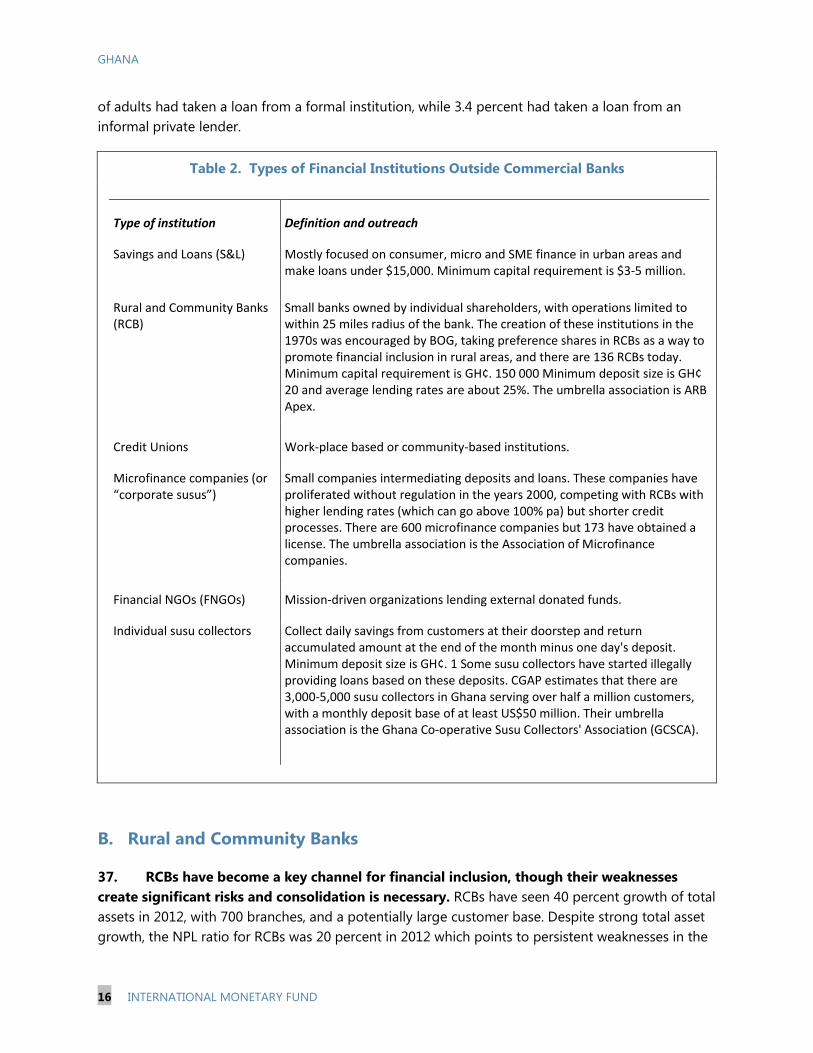
GHANA
16 INTERNATIONAL MONETARY FUND
of adults had taken a loan from a formal institution, while 3.4 percent had taken a loan from an informal private lender.
Table 2. Types of Financial Institutions Outside Commercial Banks
Type of institution Definition and outreach
Savings and Loans (S&L) Mostly focused on consumer, micro and SME finance in urban areas and make loans under $15,000. Minimum capital requirement is $3-5 million.
Rural and Community Banks (RCB)
Small banks owned by individual shareholders, with operations limited to within 25 miles radius of the bank. The creation of these institutions in the 1970s was encouraged by BOG, taking preference shares in RCBs as a way to promote financial inclusion in rural areas, and there are 136 RCBs today. Minimum capital requirement is GH¢. 150 000 Minimum deposit size is GH¢ 20 and average lending rates are about 25%. The umbrella association is ARB Apex.
Credit Unions Work-place based or community-based institutions.
Microfinance companies (or “corporate susus”)
Small companies intermediating deposits and loans. These companies have proliferated without regulation in the years 2000, competing with RCBs with higher lending rates (which can go above 100% pa) but shorter credit processes. There are 600 microfinance companies but 173 have obtained a license. The umbrella association is the Association of Microfinance companies.
Financial NGOs (FNGOs) Mission-driven organizations lending external donated funds.
Individual susu collectors Collect daily savings from customers at their doorstep and return accumulated amount at the end of the month minus one day's deposit. Minimum deposit size is GH¢. 1 Some susu collectors have started illegally providing loans based on these deposits. CGAP estimates that there are 3,000-5,000 susu collectors in Ghana serving over half a million customers, with a monthly deposit base of at least US$50 million. Their umbrella association is the Ghana Co-operative Susu Collectors' Association (GCSCA).
B. Rural and Community Banks
37. RCBs have become a key channel for financial inclusion, though their weaknesses create significant risks and consolidation is necessary. RCBs have seen 40 percent growth of total assets in 2012, with 700 branches, and a potentially large customer base. Despite strong total asset growth, the NPL ratio for RCBs was 20 percent in 2012 which points to persistent weaknesses in the
GHANA
INTERNATIONAL MONETARY FUND 17
credit process. Of 136 RCBs, five have not met the required minimum capital and sixteen have a CAR below the required minimum (10 percent). Consolidation is difficult, however, as registries of shareholders for many RCBs need to be updated and/or reconstructed.
38. The BoG supervises RCBs with the assistance of ARB Apex Bank, and realizes that supervision of RCBs still needs improvement. In addition to providing various services to RCBs (liquidity management, mobilization of funds, and training), ARB Apex collects data from all RCBs on a quarterly basis and provides recommendations to the BoG, which could be used when the BOG staff undertakes an annual onsite supervision at each RCB. The enforcement process, however, is slow. For instance, two RCBs that ARB Apex had recommended for closure to BOG two years ago are still not resolved. In the absence of a deposit insurance fund, BOG is reluctant to revoke the license of the weakest RCBs for fear of affecting negatively the confidence in these institutions, as it happened in 2003 when the BOG closed three RCBs.
C. Microfinance Services
39. Guidelines for microfinance institutions issued by BOG in July 2011 have brought clarity to the microfinance sector, though licensing has been slow. 14
40. Moreover, the minimum capital requirement is too small to generate economies of scale and reduce operational costs, pushing many of them to finance their fixed assets with deposits. BOG is currently drafting new guidelines to require microfinance companies to comply gradually with higher capital requirements which could go up to GH¢ 1 million for microfinance companies with a national branch network.
The guidelines clarified the different categories of players and their scope of authorized activities, and addressed some of the risks by putting in place capital requirements, operational requirements (corporate governance, information systems) and exposure limits for deposits and loans (see Table 6). These guidelines urged all microfinance companies to obtain a license within six months; however, out of 600 MFIs only 173 have complied and obtained a license.
41. With effective interest rates that can go above 100 percent per annum, microlending activities raise concerns of over-indebtedness. In urban areas particularly, customers can borrow from multiple sources. A credit bureau including RCBs and microfinance companies needs to be created. Positive steps have been taken in this direction as BOG has engaged with ARB Apex to integrate RCBs to the credit bureau used by commercial banks. The Ghana Micro Finance Institutions Network (GHAMFIN) has created a “Reference center”, but the costs of access to information are perceived too high by microfinance companies.
42. Many commercial banks are linked to microfinance activities. For instance, HFC Bank has entered a joint venture with CHF International to establish Boafo Microfinance services; Fidelity Bank
14 See http://www.bu.edu/bucflp/laws/operating-rules-and-guidelines-for-microfinance-institutions/.

GHANA
18 INTERNATIONAL MONETARY FUND
provides lending directly to microfinance companies; while Barclays Bank provides lending to the Ghana Cooperative Susu Collectors Association (GCSCA) which then onlends to susu collectors. The BOG does not monitor these activities and their associated risks.
D. Mobile Banking
43. Although mobile phone penetration is over 100 percent, mobile banking has not taken off in Ghana. Only 1 percent of the population uses a mobile phone to send money compared to an average of 11 percent in Sub-Saharan Africa. Obstacles to mobile banking development range from lack of incentives in the regulation which prohibits exclusive partnerships between banks and mobile network operators (MNO), to the lack of reliability of networks to ineffective advertising from banks.
E. Insurance
44. The Ghanaian insurance sector remains small, with low levels of penetration. The numbers of companies, life and non-life, have not significantly changed since the 2011 FSAP update. Premium income is growing rapidly, especially in life insurance, but from a low base (total for the sector was less than GH¢ 650 million in 2011.) Economic growth and the development of oil and gas are supporting higher demand for insurance. However, penetration (the ratio of insurance premiums to GDP) remains less than 2 percent. The non-life sector continues to contend with high levels of premium payment arrears (over 20 percent of assets at end-2011), reflecting intensive competition (originally related to a surge in new entrants some years ago) as well as poor market practices such as high levels of credit to customers.
45. As in banking, there is significant government engagement with insurance. Government involvement includes state ownership and some government intervention to direct insurance cover to particular customers, which has been useful. For example, CGAP reports on their website that one of their evaluation studies shows that in Ghana, insured farmers bought more fertilizers, planted more acreage, hired more labor, and had higher yields and income, which led to fewer missed meals and fewer missed school days for the children.
46. The insurance regulator is seeking to raise standards and address poor practices. Solvency standards are based on existing EU requirements. The National Insurance Commission is progressing plans for an overhaul of insurance legislation, including a much increased minimum capital requirement designed in part to force industry consolidation. The NIC is also setting limits on credit, introducing corporate governance standards and moving to risk based supervision by 2014. Prospects for much increased penetration seem poor, given persistent high costs.
Policy recommendations
• Encourage consolidation among RCBs and resolution of weakest RCBs
• Accelerate licensing process for microfinance companies
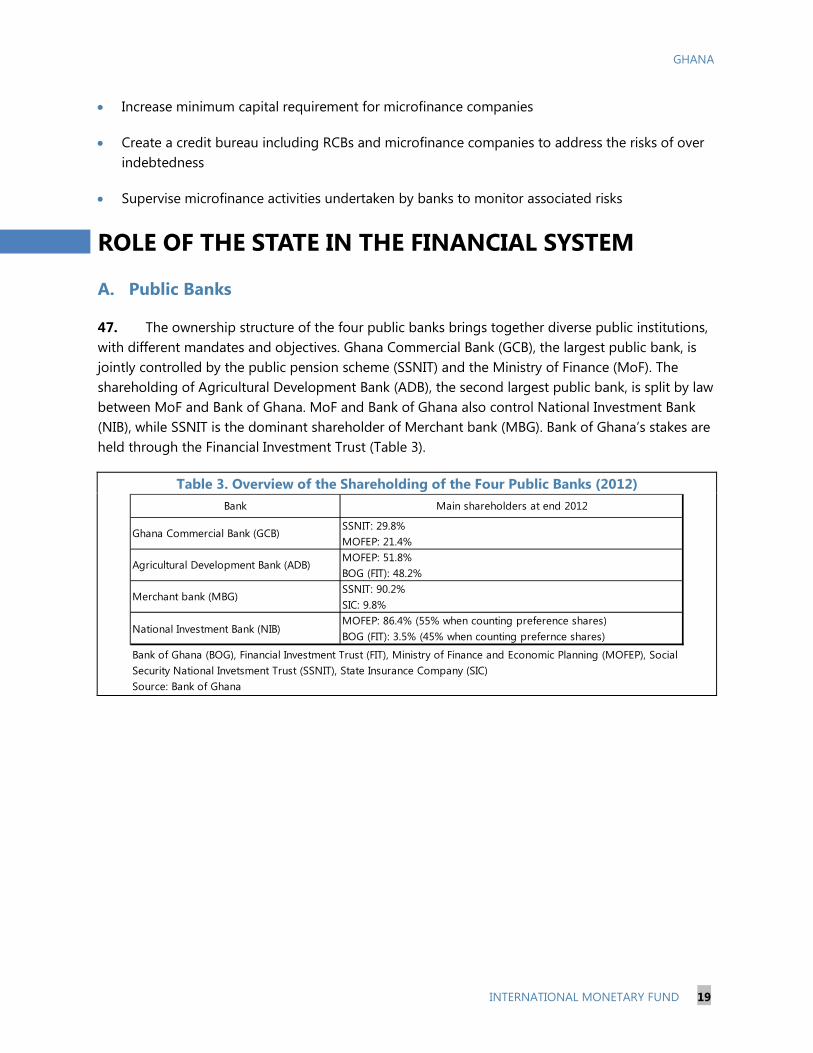
GHANA
INTERNATIONAL MONETARY FUND 19
• Increase minimum capital requirement for microfinance companies
• Create a credit bureau including RCBs and microfinance companies to address the risks of over indebtedness
• Supervise microfinance activities undertaken by banks to monitor associated risks
ROLE OF THE STATE IN THE FINANCIAL SYSTEM
A. Public Banks
47. The ownership structure of the four public banks brings together diverse public institutions, with different mandates and objectives. Ghana Commercial Bank (GCB), the largest public bank, is jointly controlled by the public pension scheme (SSNIT) and the Ministry of Finance (MoF). The shareholding of Agricultural Development Bank (ADB), the second largest public bank, is split by law between MoF and Bank of Ghana. MoF and Bank of Ghana also control National Investment Bank (NIB), while SSNIT is the dominant shareholder of Merchant bank (MBG). Bank of Ghana’s stakes are held through the Financial Investment Trust (Table 3).
Table 3. Overview of the Shareholding of the Four Public Banks (2012) Bank Main shareholders at end 2012
Ghana Commercial Bank (GCB)SSNIT: 29.8%MOFEP: 21.4%
Agricultural Development Bank (ADB)MOFEP: 51.8%BOG (FIT): 48.2%
Merchant bank (MBG)SSNIT: 90.2%SIC: 9.8%
National Investment Bank (NIB)MOFEP: 86.4% (55% when counting preference shares)BOG (FIT): 3.5% (45% when counting prefernce shares)
Source: Bank of Ghana
Bank of Ghana (BOG), Financial Investment Trust (FIT), Ministry of Finance and Economic Planning (MOFEP), Social Security National Invetsment Trust (SSNIT), State Insurance Company (SIC)

GHANA
20 INTERNATIONAL MONETARY FUND
48. Public banks lost market share, but the two largest remain among the top five banks. Public banks control over a fifth of assets and credit and a quarter of deposits. Their share of bank assets in 2012 is slightly more than half what it was in 2005. The staffing and branch networks of the two largest explain that public banks have a third of all branches and 30 percent of all employees. They operate with thinner capital buffers than their peers (accounting for 16 percent of banks’ shareholders’ funds (Table 4).
Table 4. Key Financial and Prudential Indicators of Public Banks (2012) Dec 2012
(unless otherwise indicated)Ghana Commercial
BankAgricultural
Development BankNational
Investment BankMerchant Bank Industry average
Market share - Assets 10.9% 5.5% 3.2% 3.1% --- - Credit 7.1% 6.7% 3.4% 3.0% --- - Deposits 12.3% 5.2% 3.4% 3.3% --- - Shareholders' funds 7.1% 5.4% 2.5% 1.4% --- - Number of branches 18.5% 9.2% 3.3% 2.4% --- - Number of employees 14.0% 8.5% 4.2% 3.1% ---Capital adequacyCapital adequacy ratio 17.1% 11.0% 19.5% 7.7% 18.6%Credit riskCredit growth (2012) 92.8% 19.8% 23.5% 41.8% 40.0%Non performing loans /total loans (Sept. 2012) 28.4% 9.7% 23.3% 3.3% 12.4%Provisions /NPLs (Sept. 2012) 50.0% 60.4% 29.6% 35.0% 49.5%(NPLs - Provisions) /own funds (Sept. 2012) 65.9% 23.0% 99.1% 1.5% 23.9%LiquidityLoan to deposit ratio 35.7% 80.8% 55.7% 50.5% 59.7%Liquid assets /total deposits (Sept 2012) 47.9% 25.6% 27.6% 27.3% 49.7%ProfitabilityNet interest margin (Sept. 2012) - Earning assets 16.0% 14.1% 6.3% 4.7% 12.3% - Credit 13.4% 20.1% 11.7% 18.0% 16.4%Return on assets (Sept. 2012) 7.3% 2.6% -1.8% -2.1% 5.1%Return on equity (Sept. 2012) 64.1% 17.3% -18.2% -25.3% 27.3%Source: Bank of Ghana
49. Efforts have been successful to improve the governance of these two public banks and initiate their financial and operational restructuring. Senior staff with experience in private banks has been appointed. Initial progress is evident in the risk management and internal control functions (including policies and procedures) and new systems and tools are being introduced to better control risk, improve the speed of decision-taking and facilitate the introduction of new products. Staffing in key control functions often remains insufficient, and additional hiring is contemplated. The Government restructured most of GCB’s exposure to Tema Oil Refinery (TOR), significantly improving the bank’s financial structure.
50. The restructuring of public banks was financed by internally generated funds, as public shareholders provided only limited financial support. This explains the slow progress observed in other cases when necessary resources could not be generated considering their weak financial situation.
51. Two public banks remain weak, and there are significant downside risks of this situation continuing. The impact of these two bank (and their groups) continuing without

GHANA
INTERNATIONAL MONETARY FUND 21
resolution is that it prevents stronger banks to gain market share and drive improvements in the market such as additional credit at lower cost, and part of bank deposits are not allocated in a productive way (i.e., they finance the carrying cost of past NPLs rather than activities which would support growth going forward). There are reputational risks to BoG’s credibility from forbearance due to perceived favoritism, especially when it is a shareholder. There could be further negative repercussions if there is a loss of confidence in these weak banks that may mean additional fiscal (or BoG’s) exposures.
52. Options going forward short of resolution portend distortions and risks. Muddling through would prevent further gains in financial intermediation; a forced merger with another public bank is being considered though international experience tends to show that such approaches lead to much weaker institutions. At the very least any merger should be explored at arm’s length and involve all potential interested parties; and listing weak institutions on the stock market with still limited screening capacity and with significant retail investors would pose significant risks going forward for market development and orderly resolution. Listing should be for sound, transparent and restructured institutions.
B. Social Security and National Insurance Trust
53. SSNIT’s size relative to the Ghanaian economy is gradually decreasing. Its contributions declined following the 2008 reform, which introduced a three-tier pension system and only gave SSNIT responsibility for the first one (compulsory defined benefit regime). That said, the value of pensions it pays out has significantly increased in 2012, while some contributions were not paid in due time. These trends have negatively impacted the size of its investable resources.
54. SSNIT remains the main local institutional investor, especially for long-term investments. Its investment portfolio was worth 5.9 percent of GDP in September 2012, though lower than it was in 2009 at 7.3 percent of GDP. A third of its assets is invested in equity (with banks representing two thirds of this portfolio), over half in fixed income products (including term lending) and a tenth in alternative investments (e.g. real estate). Investments and lending are managed in-house, following an investment policy last updated by the Board in 2010.
55. SSNIT’s term deposits in the banking system significantly decreased in 2012. It continues to offer term deposits to banks only at spreads over government bill rates and generally requires full collateralization with government bills. When placing deposits in banks, SSNIT does not differentiate among banks, taking the view that if banks they deposit in face problems, SSNIT should not be affected. Its share of total deposits has significantly declined from 2.1 percent in June 2011 to 0.9 percent in December 2012, partly reflecting the increasing share of demand deposits across the banking system.
56. SSNIT retains large equity stakes in banks, but is divesting its controlling shares gradually. At the end of 2012, SSNIT was the largest shareholder in four banks and had additional

GHANA
22 INTERNATIONAL MONETARY FUND
stakes in five banks.15
C. Independence of the Supervisor
The combined market share of all the banks in which SSNIT had invested in was 52.8 percent in 2008. SSNIT divested its majority stake in The Trust Bank in 2011 (and took a minority stake in the bank which absorbed it) and is in talks to do the same in another bank.
57. Bank of Ghana (BoG) holds stakes in supervised entities through a trust, which is a major governance concern. BoG holds stakes in four supervised entities, including two banks. These investments are held through the Financial Investment Trust (FIT), a trust set up in the early 2000s with BoG as sole beneficiary. FIT is administered by a four-person Board appointed by BoG and including two of its officials. FIT’s mandates include disposing of BoG stakes in these supervised entities, but no progress was made in this regard in recent years.16
D. Policy Recommendations
58. The Ghanaian authorities should contemplate taking the following measures:
• Set a cap on the two troubled banks’ balance sheets so as to limit losses and prepare a structured plan to deal with potential stress in these institutions.
• Explore options to divest BOG’s shares in all entities that it supervises.
• Assess as part of BOG’s supervisory process whether high rates paid on term deposits by some banks reflect liquidity tensions and take action accordingly
• Define in BOG policies how it would deal with a problem bank where SSNIT has an equity stake, to ensure it would be treated similarly as others and prevent moral hazard;
• Assess SSNIT’s investment processes and policies as part the on and off-site supervisory process of the National Pension Regulatory Authority (NPRA)
15 At the end of 2012, SSNIT was the largest shareholders of MBG (90.2 percent), CAL bank (33.2 percent), GCB (29.8 percent) and HFC (26.2 percent). It also had stakes in Fidelity (14.9 percent), Prudential (4.7 percent), Standard Chartered (14.3 percent), SG-SSB (21.6 percent) and Ecobank (13.9 percent). 16 Staff was informed that a stake in HFC bank was disposed off soon after the trust was established.
GHANA
INTERNATIONAL MONETARY FUND 23
MONETARY POLICY FRAMEWORK AND IMPLEMENTATION
A. Inflation Targeting: Challenges and Opportunities
59. Inflation targeting was formally introduced in Ghana in 2007 to support financial sector development by anchoring inflation expectations and building confidence. An inflation targeting framework requires a clear understanding of the monetary policy transmission mechanism to achieve a target rate of inflation with the use of monetary policy instruments, notably interest rates. In addition, the traditional channels of monetary transmission through interest rates, bank lending and asset prices require workable institutional frameworks, functioning money and securities markets, and a reasonably competitive banking sector where interest rates respond to changing market conditions and funds are channeled from savers to borrowers as credit to the private sector at affordable costs.
60. While many of the elements of a functioning inflation targeting regime are in place in Ghana, the current policy mix poses challenges. The crowding out of private sector credit as a result of high interest rates due to large public sector borrowing, amplifies the structural problem that the level of private sector credit is relatively low, reducing the impact that monetary policy can have on aggregate demand. In effect, if government demand for borrowed funds raises market rates above the levels at which it is feasible for the private sector to borrow, private expenditure becomes insensitive to bank lending rates. In moving forward, there is also room to generally strengthen the interest rate transmission channel by ensuring that there is an effective policy rate that provides a meaningful signal for expectations as well as a strong pass-through to market interest rates.
B. Liquidity Management Framework
61. Although important progress has been made in developing the monetary policy implementation framework, important challenges remain in the conduct of monetary operations. The change-over to an inflation targeting framework has not resulted in a more fundamental change in liquidity management, which continues to be based on reserve money targeting. Most banks participate in the interbank market, which is predominantly overnight and securitized. The BoG has at its disposal a broad range of instruments as well as a liquidity forecasting framework. Payment and settlement arrangements are advanced and an auction market for treasury securities is functioning well. There are, however, some continuing difficulties with forecasting government expenditures and no systematic analysis is undertaken of forecasting errors. Concerns about the cost of sterilization appear to have at times impacted on BoG’s operations to mop up excess liquidity, and these concerns threaten to undermine the pursuit of BoG’s price stability mandate. More importantly, interbank rates have deviated from the policy rate by more
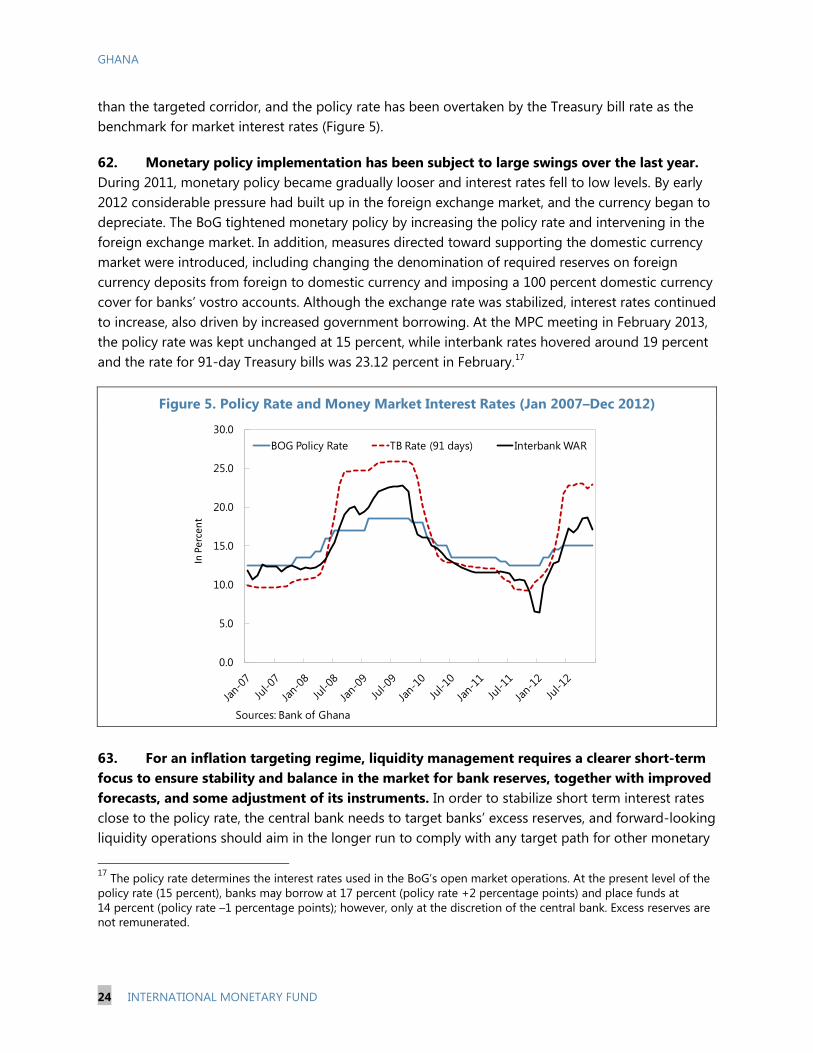
GHANA
24 INTERNATIONAL MONETARY FUND
than the targeted corridor, and the policy rate has been overtaken by the Treasury bill rate as the benchmark for market interest rates (Figure 5).
62. Monetary policy implementation has been subject to large swings over the last year. During 2011, monetary policy became gradually looser and interest rates fell to low levels. By early 2012 considerable pressure had built up in the foreign exchange market, and the currency began to depreciate. The BoG tightened monetary policy by increasing the policy rate and intervening in the foreign exchange market. In addition, measures directed toward supporting the domestic currency market were introduced, including changing the denomination of required reserves on foreign currency deposits from foreign to domestic currency and imposing a 100 percent domestic currency cover for banks’ vostro accounts. Although the exchange rate was stabilized, interest rates continued to increase, also driven by increased government borrowing. At the MPC meeting in February 2013, the policy rate was kept unchanged at 15 percent, while interbank rates hovered around 19 percent and the rate for 91-day Treasury bills was 23.12 percent in February.17
Figure 5. Policy Rate and Money Market Interest Rates (Jan 2007–Dec 2012)
0.0
5.0
10.0
15.0
20.0
25.0
30.0
In P
erce
nt
BOG Policy Rate TB Rate (91 days) Interbank WAR
Sources: Bank of Ghana 63. For an inflation targeting regime, liquidity management requires a clearer short-term focus to ensure stability and balance in the market for bank reserves, together with improved forecasts, and some adjustment of its instruments. In order to stabilize short term interest rates close to the policy rate, the central bank needs to target banks’ excess reserves, and forward-looking liquidity operations should aim in the longer run to comply with any target path for other monetary
17 The policy rate determines the interest rates used in the BoG’s open market operations. At the present level of the policy rate (15 percent), banks may borrow at 17 percent (policy rate +2 percentage points) and place funds at 14 percent (policy rate –1 percentage points); however, only at the discretion of the central bank. Excess reserves are not remunerated.

GHANA
INTERNATIONAL MONETARY FUND 25
variables, such as reserve money. Improved forward-looking liquidity forecasts would include daily forecasts of excess reserves and composition of reserve money, and forecast error. Moreover, while the BoG has available traditional instruments of monetary policy, some redesign and adjusted use of these instruments could be useful for liquidity management including the establishment of standing overnight lending and deposit at interest rates linked to the policy rate; use of repos and reverse repos transactions only on the initiative of the central bank and restricted to bank participation; and an extension of the maintenance period for reserve requirement from one week to at least two weeks while continuing to allow banks to meet the requirement on average over the longer maintenance period.
64. Improved coordination of fiscal and monetary policy will improve liquidity management and hence, the implementation of monetary policy. The three main areas for better coordination include having accurate forecasts of government’s cash flows, and in that regard, improving the new financial systems Ghana Integrated Financial Management Information System (GIFMIS) , and establishing a Single Treasury Account (TSA) would be essential; having a clear understanding of cost sharing for the implementation of monetary policy so that cost considerations do not hamper monetary policy objectives; and given shallow debt markets, it would be preferable to conduct monetary operations using Treasury bills since the existence of two similar risk-free instruments—central bank bills and Treasury bills—may hamper market development.
C. Money and Foreign Exchange Markets
Domestic interbank and money market
65. The interbank money market is becoming fairly active with most banks participating (Figure 6). The trading is mostly on an overnight and securitized basis, although the larger banks have established unsecured credit lines with some of their counterparties. Average daily trading turnover fell sharply between 2006 and 2009 (from GH¢ 322 to GH¢ 77 million), but has gradually increased over the last years, reaching GH¢ 203 million in 2012. Daily activity is uneven and to a large extend driven by uncertainty about BoG’s participation.
66. The primary market for government securities is active. There are regular weekly auctions, with an issuance calendar published in advance. Prior to April 2011, all 27 banks, as well as four non-bank financial institutions, were Primary Dealers (PDs). Currently, there are 15 PDs, who are expected to underwrite the auctions and act as market-makers in the secondary market. In practice, however, this arrangement is not enforced.
67. Well functioning money and securities markets would improve the transmission of interest rates. Starting with the interbank market, the suggested reforms of the central bank’s liquidity management would give incentives to banks for a more active planning and management of their own liquidity. Market functioning would also improve if the underlying securities for repos could be traded, in line with international practice.
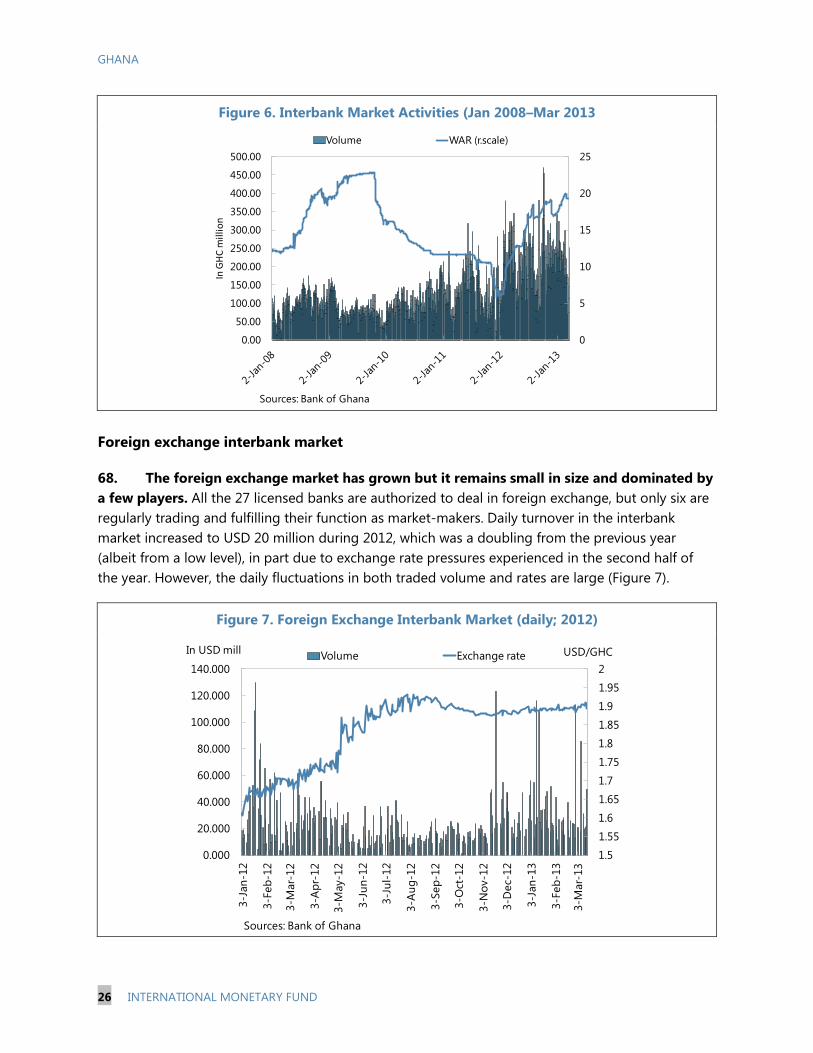
GHANA
26 INTERNATIONAL MONETARY FUND
Figure 6. Interbank Market Activities (Jan 2008–Mar 2013
0
5
10
15
20
25
0.00
50.00
100.00
150.00
200.00
250.00
300.00
350.00
400.00
450.00
500.00
In G
HC
mill
ion
Volume WAR (r.scale)
Sources: Bank of Ghana Foreign exchange interbank market
68. The foreign exchange market has grown but it remains small in size and dominated by a few players. All the 27 licensed banks are authorized to deal in foreign exchange, but only six are regularly trading and fulfilling their function as market-makers. Daily turnover in the interbank market increased to USD 20 million during 2012, which was a doubling from the previous year (albeit from a low level), in part due to exchange rate pressures experienced in the second half of the year. However, the daily fluctuations in both traded volume and rates are large (Figure 7).
Figure 7. Foreign Exchange Interbank Market (daily; 2012)
1.5
1.55
1.6
1.65
1.7
1.75
1.8
1.85
1.9
1.95
2
0.000
20.000
40.000
60.000
80.000
100.000
120.000
140.000
3-Ja
n-12
3-Fe
b-12
3-M
ar-1
2
3-A
pr-1
2
3-M
ay-1
2
3-Ju
n-12
3-Ju
l-12
3-A
ug-1
2
3-Se
p-12
3-O
ct-1
2
3-N
ov-1
2
3-D
ec-1
2
3-Ja
n-13
3-Fe
b-13
3-M
ar-1
3
Volume Exchange rateIn USD mill USD/GHC
Sources: Bank of Ghana

GHANA
INTERNATIONAL MONETARY FUND 27
69. A well-functioning foreign exchange market is important for monetary policy implementation and financial sector development. Empirical studies have shown that the pass-through to domestic prices from exchange rate changes is strong and rapid in Ghana, which underscores the link between a stable exchange rate and price stability.18
70. Interventions in the foreign exchange market should support the achievement of the BoG’s monetary policy objectives. Given the close link between exchange rate and price movements in Ghana, a weakening currency could result in a build-up of inflationary pressure and hence justify BoG’s action. Furthermore, direct interventions in the foreign exchange market can complement the interest rate transmission channel. However, targeting a particular level of the exchange rate would be inconsistent with an inflation targeting regime. The BoG may still find it necessary to intervene in the foreign exchange market to ensure an orderly market, as bulky transactions in a shallow market could disrupt the market and lead to large swings in the exchange rate unrelated to economic fundamentals. In these situations, it is important to communicate clearly the BoG’s objectives and to emphasize that in the context of a floating exchange rate regime the BoG is not targeting any particular exchange rate level, but intervening to reduce volatility.
In an inflation targeting system, however, it is important that this stability is primarily achieved through appropriate macro-economic policies and not by directly managing the exchange rate. The effective functioning of the foreign exchange market with transparent price discovery in the wholesale interbank market and supportive interventions by the central bank will facilitate risk-taking and confidence by economic agents.
D. Policy Recommendations
• Strengthen the current liquidity management framework by improved forward-looking liquidity forecasts with focus on banks’ excess reserves and re-design monetary instruments and adjust their use.
• Improve coordination between MoF and BoG in the areas of cash flow projections as input to liquidity forecasts, sharing of costs of monetary policy by agreeing on a binding MOU and the continued use of Treasury bills as a monetary policy instrument.
• Establish the operational and legal basis for the use of repos as part of interbank trading and for use in a broader money market.
• Communicate clearly to the market when BoG is intervening in the foreign exchange market, emphasizing that the central bank is not targeting a particular exchange rate level.
• Continue ongoing measures (such as introducing a screen-based information and trading system, intervention at quoted market rates, and a Code of Conduct) to strengthen the operations of the interbank foreign exchange market.
18 “Does Money Matter for Inflation in Ghana”; IMF WP/11/274.

GHANA
28 INTERNATIONAL MONETARY FUND
Appendix I. Evolution of Financial Indicators (2002–2011)1
0.0
5.0
10.0
15.0
20.0
25.0
30.0
35.0
2002 2003 2004 2005 2006 2007 2008 2009 2010 2011
Domestic Bank Deposits / GDP (%)
Value Observed Expected median
0.0
5.0
10.0
15.0
20.0
25.0
2002 2003 2004 2005 2006 2007 2008 2009 2010 2011
Private Credit / GDP (%)
Value Observed Expected median
0.0
20.0
40.0
60.0
80.0
100.0
120.0
2002 2003 2004 2005 2006 2007 2008 2009 2010 2011
3 Bank Asset Concentration (%)
Value Observed Expected median
0.0
10.0
20.0
30.0
40.0
50.0
60.0
70.0
2002 2003 2004 2005 2006 2007 2008 2009 2010 2011
Cost to Income Ratio (%)
Value Observed Expected median
0.0
5.0
10.0
15.0
20.0
2002 2003 2004 2005 2006 2007 2008 2009 2010 2011
Net Interest Margin (%)
Value Observed Expected median
0.0
10.0
20.0
30.0
40.0
50.0
2002 2003 2004 2005 2006 2007 2008 2009 2010 2011
Non-Interest Income / Total income (%)
Value Observed Expected median
0.0
2.0
4.0
6.0
8.0
10.0
2002 2003 2004 2005 2006 2007 2008 2009 2010 2011
Overhead Costs / Total Assets (%)
Value Observed Expected median
0.01.02.03.04.05.06.07.08.0
2002 2003 2004 2005 2006 2007 2008 2009 2010 2011
Return on Assets (%)
Value Observed Expected median
Source: Finstats, World Bank. 1The expected median is based on a few indicators, including GDP per capita, population size and population density (rural/urban).

GHANA
INTERNATIONAL MONETARY FUND 29
Appendix I. Evolution of Financial Indicators (2002–2011) (concluded)
0.010.020.030.040.050.060.070.080.0
2002 2003 2004 2005 2006 2007 2008 2009 2010 2011
Return on Equity (%)
Value Observed Expected median
0.02.04.06.08.0
10.012.014.016.0
2002 2003 2004 2005 2006 2007 2008 2009 2010 2011
Credit to Government and SOEs / GDP (%)
Value Observed Expected median
0.010.020.030.040.050.060.070.080.0
2002 2003 2004 2005 2006 2007 2008 2009 2010 2011
Private Credit to Deposits (%)
Value Observed Expected median
0.0
5.0
10.0
15.0
20.0
25.0
30.0
2002 2003 2004 2005 2006 2007 2008 2009 2010 2011
Consolidated Foreign Claims of BIS-Reporting Banks / GDP (%)
Value Observed Expected median
0.0
10.0
20.0
30.0
40.0
50.0
60.0
2002 2003 2004 2005 2006 2007 2008 2009 2010 2011
Liquid Assets / Deposits & Short Term Funding (%)
Value Observed Expected median
0.0
20.0
40.0
60.0
80.0
100.0
2002 2003 2004 2005 2006 2007 2008 2009 2010 2011
Provisions to NPLs (%)
Value Observed Expected median
0.0
5.0
10.0
15.0
20.0
25.0
2002 2003 2004 2005 2006 2007 2008 2009 2010 2011
NPLs to Total Gross Loans (%)
Value Observed Expected median
0.0
5.0
10.0
15.0
20.0
25.0
2002 2003 2004 2005 2006 2007 2008 2009 2010 2011
Regulatory Capital to Risk-Weighted Assets (%)
Value Observed Expected median
0.0
10.0
20.0
30.0
40.0
50.0
60.0
2002 2003 2004 2005 2006 2007 2008 2009 2010 2011
Liquid Assets / Deposits & Short Term Funding (%)
Value Observed Expected median
Source: Finstats, World Bank.

GHANA STAFF REPORT FOR THE 2013 ARTICLE IV CONSULTATION—INFORMATIONAL ANNEX Prepared By
African Department
RELATIONS WITH THE FUND ____________________________________________________________ 2
JOINT WORLD BANK-IMF WORK PROGRAM, 2012–13 ________________________________ 7
STATISTICAL ISSUES ______________________________________________________________________ 9
CONTENTS
May 29, 2013

GHANA
2 INTERNATIONAL MONETARY FUND
RELATIONS WITH THE FUND (As of April 30, 2013)
Membership Status: Joined: September 20, 1957; Article VIII
General Resources Account: SDR Million %Quota
Quota 369.00 100.00
Fund holdings of currency (Exchange Rate) 369.00 100.00
Reserve Tranche Position 0.00 0.00
SDR Department: SDR Million %Allocation
Net cumulative allocation 353.87 100.00
Holdings 254.00 71.78
Outstanding Purchases and Loans: SDR Million %Quota
ECF Arrangements 456.00 123.58
Latest Financial Arrangements: Type Date of Arrangement Expiration Date Amount Approved Amount Drawn
(SDR Million) (SDR Million) ECF 1/ Jul 15, 2009 Jul 23, 2012 387.45 387.45 ECF 1/ May 09, 2003 Oct 31, 2006 184.50 184.50 ECF 1/ May 03, 1999 Nov 30, 2002 228.80 176.22
1/ Formerly PRGF.
Projected Payments to Fund 2/ (SDR Million; based on existing use of resources and present holdings of SDRs):
Forthcoming 2013 2014 2015 2016 2017
Principal 15.82 21.09 42.77 46.34 53.66 Charges/Interest 0.06 0.07 1.07 0.97 0.85 Total 15.87 21.16 43.84 47.30 54.51
2/ When a member has overdue financial obligations outstanding for more than three months, the amount of such arrears will be shown in this section.
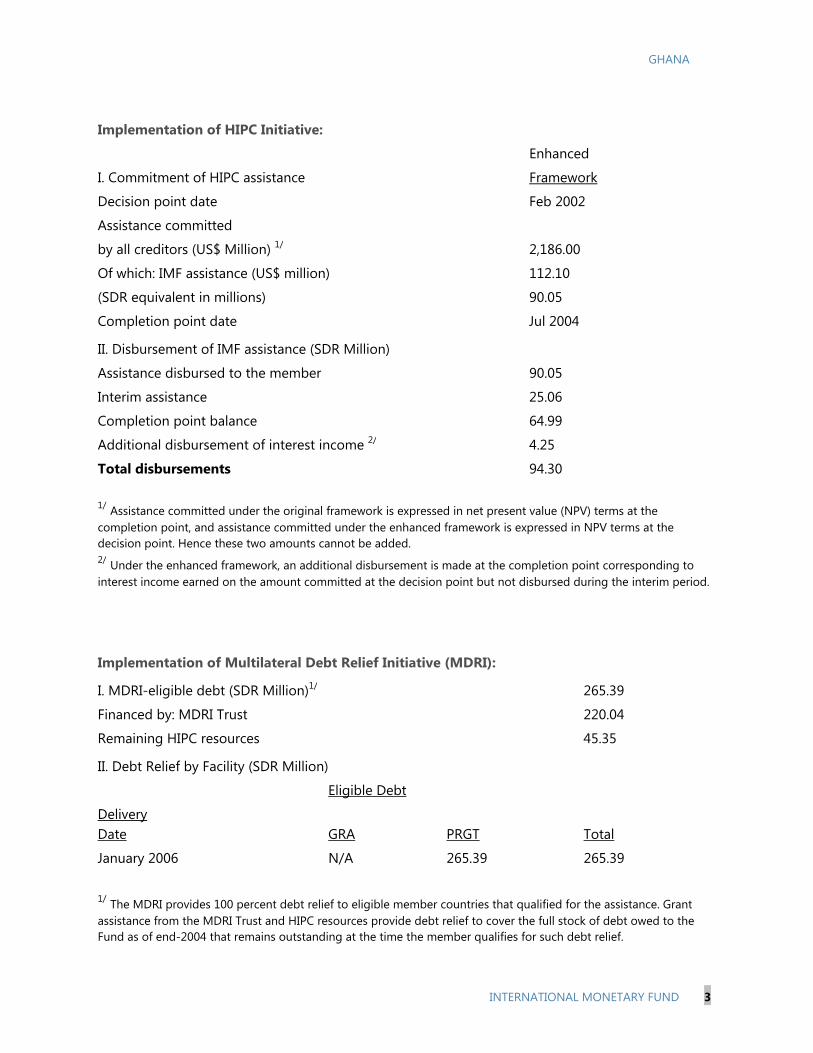
GHANA
INTERNATIONAL MONETARY FUND 3
Implementation of HIPC Initiative:
Enhanced
I. Commitment of HIPC assistance Framework
Decision point date Feb 2002
Assistance committed
by all creditors (US$ Million) 1/ 2,186.00
Of which: IMF assistance (US$ million) 112.10
(SDR equivalent in millions) 90.05
Completion point date Jul 2004
II. Disbursement of IMF assistance (SDR Million)
Assistance disbursed to the member 90.05
Interim assistance 25.06
Completion point balance 64.99
Additional disbursement of interest income 2/ 4.25
Total disbursements 94.30
1/ Assistance committed under the original framework is expressed in net present value (NPV) terms at the completion point, and assistance committed under the enhanced framework is expressed in NPV terms at the decision point. Hence these two amounts cannot be added.2/ Under the enhanced framework, an additional disbursement is made at the completion point corresponding to interest income earned on the amount committed at the decision point but not disbursed during the interim period.
Implementation of Multilateral Debt Relief Initiative (MDRI):
I. MDRI-eligible debt (SDR Million)1/ 265.39
Financed by: MDRI Trust 220.04
Remaining HIPC resources 45.35
II. Debt Relief by Facility (SDR Million)
Eligible Debt
Delivery Date
GRA
PRGT
Total
January 2006 N/A 265.39 265.39
1/ The MDRI provides 100 percent debt relief to eligible member countries that qualified for the assistance. Grant assistance from the MDRI Trust and HIPC resources provide debt relief to cover the full stock of debt owed to the Fund as of end-2004 that remains outstanding at the time the member qualifies for such debt relief.

GHANA
4 INTERNATIONAL MONETARY FUND
Implementation of Post-Catastrophe Debt Relief (PCDR): Not Applicable
Decision point—point at which the IMF and the World Bank determine whether a country qualifies for assistance under the HIPC Initiative and decide on the amount of assistance to be committed.
Interim assistance—amount disbursed to a country during the period between decision and completion points, up to 20 percent annually and 60 percent in total of the assistance committed at the decision point (or 25 percent and 75 percent, respectively, in exceptional circumstances).
Completion point—point at which a country receives the remaining balance of its assistance committed at the decision point, together with an additional disbursement of interest income as defined in footnote 2 above. The timing of the completion point is linked to the implementation of pre-agreed key structural reforms (i.e., floating completion point).
Safeguards Assessment The Bank of Ghana (BoG) was subject to an update safeguards assessment with respect to the PRGF arrangement approved on July 15, 2009; the assessment, completed on December 2, 2009, followed an initial safeguards assessment from October 2003. The update assessment found that while the safeguards framework of the BoG had been strengthened in several areas, new risks in governance oversight emerged with the removal of the former Board in January 2009. In March 2010, a new Board was appointed and the BoG is committed to implementing measures proposed by staff. Exchange Rate Arrangement On February 2, 1994, Ghana accepted obligations under Article VIII, Sections 2(a), 3, and 4, of the Fund’s Articles of Agreement. The exchange rate regime is classified as a managed float. Ghana currently maintains a multiple currency practice (MCP) subject to Fund approval, whereby the BOG calculates a reference rate and uses it for certain official transactions without having a mechanism in place to ensure that this exchange rate does not differ from the rate prevailing in the market by more than 2 percent. The exchange system is free of restrictions on payments and transfers for current international transactions. At the end of April 2013, the average exchange rate for transactions in the interbank market was GH¢1.98 per U.S. dollar. Article IV Consultation The 2011 Article IV consultation discussions were held in Accra during Feb 16–Mar 1, 2011. The staff report (Country Report No. 11/128) was discussed by the Executive Board on May 25, 2011 and is posted on the IMF website.

GHANA
INTERNATIONAL MONETARY FUND 5
FSAP Participation Ghana participated in the FSAP in 2000–01, and a Financial System Stability Assessment (FSSA) was issued to the Executive Board in 2001. An FSAP update was presented to the Board in December 2003 and May 2011. Technical Assistance
Subject
Department Date
Advise on establishing large taxpayers unit FAD 2002/03 Review of public expenditure management reforms FAD 2002/03 Tax policy FAD May 2003 Fiscal ROSC FAD Feb. 2004 Regional advisor on public expenditure management FAD 2004/06 Assessment of petroleum pricing mechanism FAD Jan. 2005 Public financial management (PFM) FAD Mar.-Jun. 2006 Public financial management (PFM) FAD Feb. 2010 Enhancing fiscal discipline FAD May 2008 Revenue administration FAD Jan. 2009 Tax policy FAD Apr. 2009 Revenue administration FAD Apr. 2009
Mar. 2010 Fiscal regime for natural resources FAD Jun. 2009 Tax administration FAD Mar. 2010 Expenditure Control and Arrears FAD Jan. Feb. 2011 Small taxpayer regime FAD Feb. 2011 Accounting and internal audit reform MFD Jul.–Nov. 2002
Mar. 2003 Foreign exchange market, government securities market, and banking system issues
MFD Apr. 2003
Joint FSAP follow-up with World Bank MFD Jun. 2003 Multitopic technical assistance initiation MFD Nov. 2004 Improving monetary operations, banking supervision and payment systems
MFD Nov. 2004
Medium-term debt management strategy MCM Mar. 2008 Banking supervision MCM Dec. 2009 Review options for resolution of the weak state-owned banks
MCM Apr.-May 2011
Problem Bank Resolution MCM Mar.-Apr. 2011 Bank supervision and regulations MCM […] Joint FSAP follow-up with World Bank MCM Mar. 2011 Monetary and Exchange Rate Operations MCM Jan.-Feb. 2012 Problem Bank Resolution MCM Sep. 2012/

GHANA
6 INTERNATIONAL MONETARY FUND
Jan. 2013 Macrofinancial Stress Testing and Early Warning System MCM Feb. 2013 Joint Financial Stability Review with World Bank MCM Apr. 2013 Monetary data reported in SRF STA Jun. 2011 Money and banking statistics STA Jul. 2002
Jan.-Feb. 2004 Apr. 2007 Mar. 2008 Apr.-May 2009
National accounts statistics STA Sept./Oct. 2001 Aug.-Dec. 2002 Sep. 2003 Feb. 2009 Sep. 2010 Apr. 2011 Nov.-Dec. 2011 Nov.-Dec. 2013
National accounts and prices STA Mar. 2004 Oct. 2004 Apr.-May 2005 Apr.-May 2006 Sep. 2006 Apr. 2011
Government finance statistics STA Mar. 2005 May-Jun. 2006 May-Jun. 2009
Balance of payment statistics STA Feb. 2009 Apr.-May 2010 Apr. 2011 Jun.-Sep. 2012
Pilot study of access to private capital markets ICM May 2003 Nov. 2004
The remittance market LEG Apr.-May 2006 Fiscal law: review of tax laws LEG Jan. 2011 AML/CFT structures and tools
LEG Feb-Mar. 2011 Feb. 2012 Jan. 2013
Resident Representative The Fund has had a Resident Representative office in Accra since June 1985. The current resident representative is Mr. Samir Jahjah who assumed the post in October 2012.
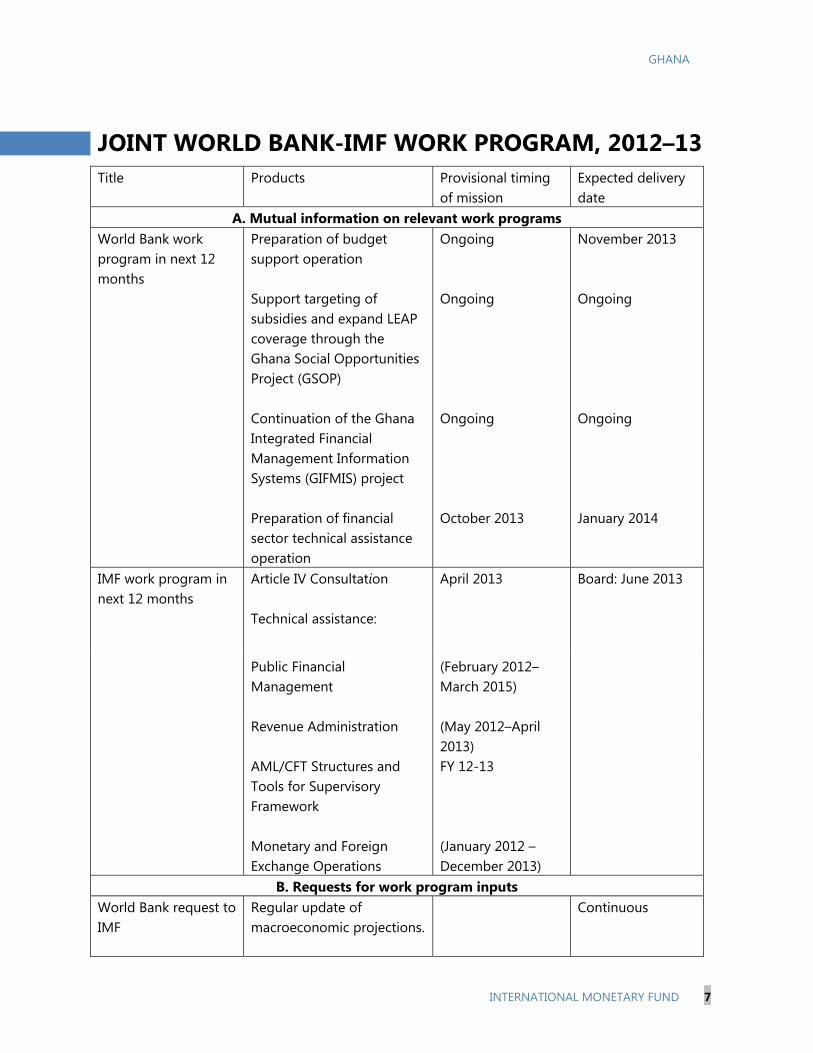
GHANA
INTERNATIONAL MONETARY FUND 7
JOINT WORLD BANK-IMF WORK PROGRAM, 2012–13 Title Products Provisional timing
of mission Expected delivery date
A. Mutual information on relevant work programs World Bank work program in next 12 months
Preparation of budget support operation Support targeting of subsidies and expand LEAP coverage through the Ghana Social Opportunities Project (GSOP) Continuation of the Ghana Integrated Financial Management Information Systems (GIFMIS) project Preparation of financial sector technical assistance operation
Ongoing Ongoing Ongoing October 2013
November 2013 Ongoing Ongoing January 2014
IMF work program in next 12 months
Article IV Consultation Technical assistance:
April 2013
Board: June 2013
Public Financial Management
(February 2012–March 2015)
Revenue Administration (May 2012–April 2013)
AML/CFT Structures and Tools for Supervisory Framework
FY 12-13
Monetary and Foreign Exchange Operations
(January 2012 –December 2013)
B. Requests for work program inputs World Bank request to IMF
Regular update of macroeconomic projections.
Continuous

GHANA
8 INTERNATIONAL MONETARY FUND
IMF request to World Bank
Regular update on Bank activities
Continuous
C. Agreement on joint products and missions Joint products in next 12 months
Joint Bank-Fund Debt Sustainability Analysis (Update)
April 2003 May 2013

GHANA
INTERNATIONAL MONETARY FUND 9
STATISTICAL ISSUES I. Assessment of Data Adequacy for Surveillance
General: Data provision has some shortcomings, but is broadly adequate for surveillance. The quality and timeliness of certain data need to be improved. There are notable deficiencies in the dissemination of statistical information to the public, although the situation has improved with the recurrent publication on the Bank of Ghana’s (BOG) website of the Monetary Policy Committee Statement, Statistical Releases, and economic and financial reports since 2003. National Accounts: Ghana compiles annual and quarterly estimates of GDP by economic activities at current and constant (2006) prices following the System of National Accounts 1993 regularly. Incorporation of latest/updated data sources, changes in conceptual treatment/methodologies and rebasing of national accounts to 2006 led to a significant upward revision of the estimates of GDP published in November 2010. In addition, Ghana Statistical Service recently published annual GDP by expenditure estimates at current and constant (2006) prices for the years 2006-12. Private consumption expenditure which was estimated as a residual in the old series, has been calculated directly in the rebased series. Ghana is one of the countries participating in the Quarterly National Accounts Module of the Enhanced Data Dissemination Initiative (EDDI) supported by the United Kingdom Department for International Development (DFID). Four missions have been conducted (September 2010, April 2011, November/December 2011, and February 2013) under this project. The February 2013 mission worked towards further improving the methodology of the current and constant price QGDP estimates by economic activity. In addition, the methodology for each component of the published annual expenditure estimates was scrutinized and a preliminary methodology for expanding these to quarterly was developed. The constant price methodology has been improved by introducing forestry stock changes and extending the range of indicators for measuring cocoa production, hotels, and air transportation. It is expected that estimates of QGDP by expenditure will be compiled by mid-2014. Labor statistics: The scarcity of labor statistics is a cause for concern. Labor statistics are almost nonexistent, although some wage indicators are available from the Social Security National Insurance Trust (SSNIT). The Ministry of Employment has been receiving technical assistance from the United Nations Development Program and the International Labor Organization in the design and compilation of labor statistics. Government finance statistics: Steps have been taken to improve fiscal data. The Controller Accountant General Department (CAGD) currently compiles monthly budget implementation reports, and the data are available within six weeks, although some factors undermine their reliability. There is a need for comprehensive and timely reconciliation of monthly treasury data with bank accounts. To address these shortcomings, the government has formed a committee to define the nature of “broad” and “narrow” government; moved to a system of immediate booking for “direct debits” and more frequent reporting of government account balances; and is implementing a new automated Budget and Public Expenditure Management System (BPEMS). The BPEMS covers ministries, departments, and agencies. Several GFS missions worked with the authorities to improve the economic classification of data in accordance with the requirements of GFSM 2001. In 2009, an STA mission also provided guidance on the compilation of a partial financial balance sheet for

GHANA
10 INTERNATIONAL MONETARY FUND
budgetary central government, and proposed that information on debt stocks that is available on a monthly basis be reported for the inclusion in the International Financial Statistics (IFS). The coverage of transactions is uneven. There are also difficulties in accounting for expenses paid by extrabudgetary funds. The operations of special funds, such as the SSNIT (currently regarded as a public financial corporation by the authorities), the Ghana Education Trust Fund (GETF) and the District Assemblies Common Fund (DACF), are not yet covered in the fiscal accounts. Although the majority of local government expenses are directly met from budgetary accounts, the revenue of local governments and related spending, and transactions financed from the DACF are not yet covered. Extending the coverage of fiscal data to general government is strongly encouraged. Comprehensive solutions to some of the data problems may have to await full implementation of the BPEMS system and incorporation of Fund technical advice. Various missions from FAD have suggested short-term temporary solutions to alleviate current data quality problems. Monetary and financial statistics: While BOG has made significant progress on implementing the previous missions’ recommendations on monetary and financial statistics, continued efforts are needed to expand the institutional coverage and improve the timeliness of the data reporting. The June 2011 monetary and financial statistics mission assisted in improving the data mapping for compiling the standardized report forms (SRFs) for central bank (SRF 1SR) and other depository corporations (ODCs) (SRF 2SR). BOG has used the updated mapping to compile and report SFR 1SR, SRF 2SR, and SRF 5SR for monetary aggregates for publication in the IMF’s International Financial Statistics (IFS). As a result, the data quality has improved. However, data have not been reported regularly and the timeliness has worsened. Data through October 2012 were published in the April 2013 issue of IFS—a lag of more than six months. The mission also assisted in mapping the statistical returns for other financial institutions to SRFs with a view to expanding the data coverage. However, no further progress has been made on including these other financial institutions in the coverage of monetary statistics. Debt statistics: The responsibility for external debt recording and payment is divided among three agencies. The Ministry of Finance and Economic Planning (MOFEP), through its Aid and Debt Management Unit (ADMU), maintains the external debt database. It is responsible for recording debt payment obligations, issuing payment requests, and tracking HIPC debt relief. The CAGD confirms the legality of the payment and authorizes the release of public funds. It is responsible for accounting for debt payments and rendering reports to parliament. The BOG as the payment agent for the government verifies payments made to ADMU and CAGD. To enable systematic comparison of the budget, the balance of payments and the BOG cash-flow data, the authorities should clearly identify the government subsectors for which data are reported and prepare a clear classification of financing, outstanding debt, and guarantees issued. External sector Statistics: The Balance of Payments Office (BPO) of the Research Department of the BOG is responsible for the compilation and dissemination of balance of payments and International Investment Position (IIP) data for Ghana. Ghana participates in the external sector module of EDDI and has benefited extensively from technical assistance in developing and undertaking enterprise surveys of cross-border financial flows and stocks (Foreign Assets and Liabilities Survey (FALS)), with a view to improve the quality of balance of payments statistics and IIP statistics. A major achievement was the submission of an IIP to the Fund’s Statistics Department (STA) during 2011 for the period 2006 through 2009 and the data were subsequently published in the March 2011
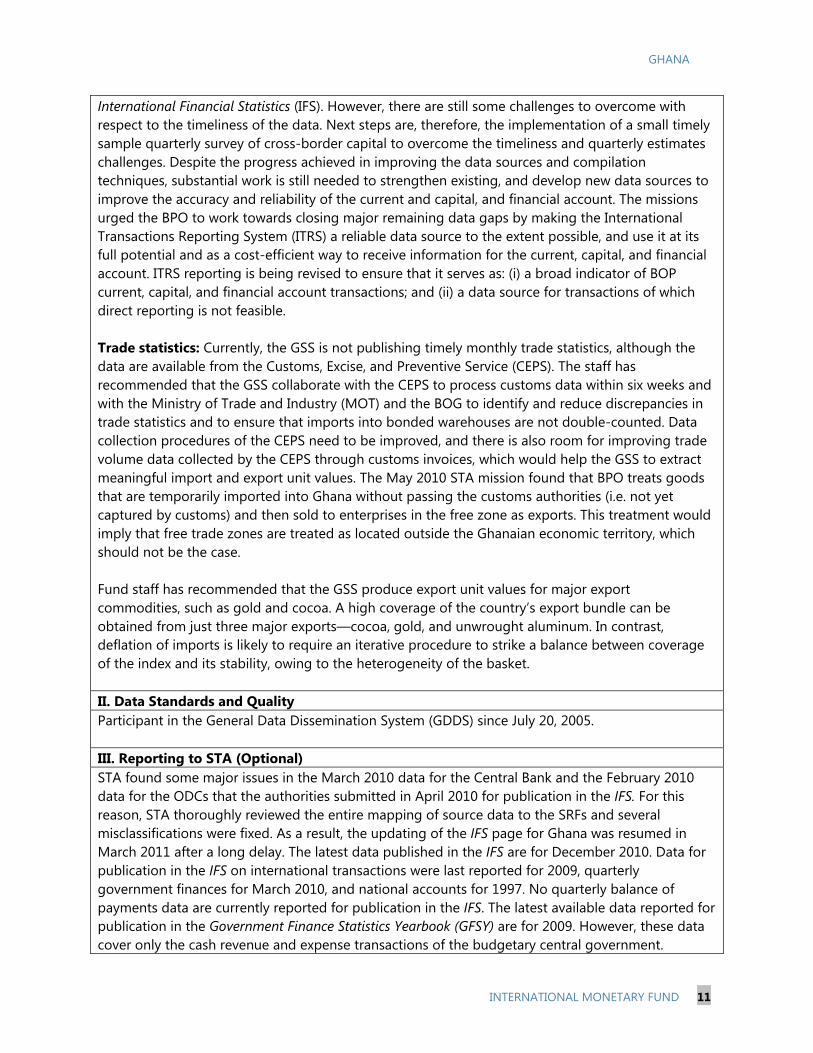
GHANA
INTERNATIONAL MONETARY FUND 11
International Financial Statistics (IFS). However, there are still some challenges to overcome with respect to the timeliness of the data. Next steps are, therefore, the implementation of a small timely sample quarterly survey of cross-border capital to overcome the timeliness and quarterly estimates challenges. Despite the progress achieved in improving the data sources and compilation techniques, substantial work is still needed to strengthen existing, and develop new data sources to improve the accuracy and reliability of the current and capital, and financial account. The missions urged the BPO to work towards closing major remaining data gaps by making the International Transactions Reporting System (ITRS) a reliable data source to the extent possible, and use it at its full potential and as a cost-efficient way to receive information for the current, capital, and financial account. ITRS reporting is being revised to ensure that it serves as: (i) a broad indicator of BOP current, capital, and financial account transactions; and (ii) a data source for transactions of which direct reporting is not feasible. Trade statistics: Currently, the GSS is not publishing timely monthly trade statistics, although the data are available from the Customs, Excise, and Preventive Service (CEPS). The staff has recommended that the GSS collaborate with the CEPS to process customs data within six weeks and with the Ministry of Trade and Industry (MOT) and the BOG to identify and reduce discrepancies in trade statistics and to ensure that imports into bonded warehouses are not double-counted. Data collection procedures of the CEPS need to be improved, and there is also room for improving trade volume data collected by the CEPS through customs invoices, which would help the GSS to extract meaningful import and export unit values. The May 2010 STA mission found that BPO treats goods that are temporarily imported into Ghana without passing the customs authorities (i.e. not yet captured by customs) and then sold to enterprises in the free zone as exports. This treatment would imply that free trade zones are treated as located outside the Ghanaian economic territory, which should not be the case. Fund staff has recommended that the GSS produce export unit values for major export commodities, such as gold and cocoa. A high coverage of the country’s export bundle can be obtained from just three major exports—cocoa, gold, and unwrought aluminum. In contrast, deflation of imports is likely to require an iterative procedure to strike a balance between coverage of the index and its stability, owing to the heterogeneity of the basket. II. Data Standards and Quality Participant in the General Data Dissemination System (GDDS) since July 20, 2005. III. Reporting to STA (Optional) STA found some major issues in the March 2010 data for the Central Bank and the February 2010 data for the ODCs that the authorities submitted in April 2010 for publication in the IFS. For this reason, STA thoroughly reviewed the entire mapping of source data to the SRFs and several misclassifications were fixed. As a result, the updating of the IFS page for Ghana was resumed in March 2011 after a long delay. The latest data published in the IFS are for December 2010. Data for publication in the IFS on international transactions were last reported for 2009, quarterly government finances for March 2010, and national accounts for 1997. No quarterly balance of payments data are currently reported for publication in the IFS. The latest available data reported for publication in the Government Finance Statistics Yearbook (GFSY) are for 2009. However, these data cover only the cash revenue and expense transactions of the budgetary central government.
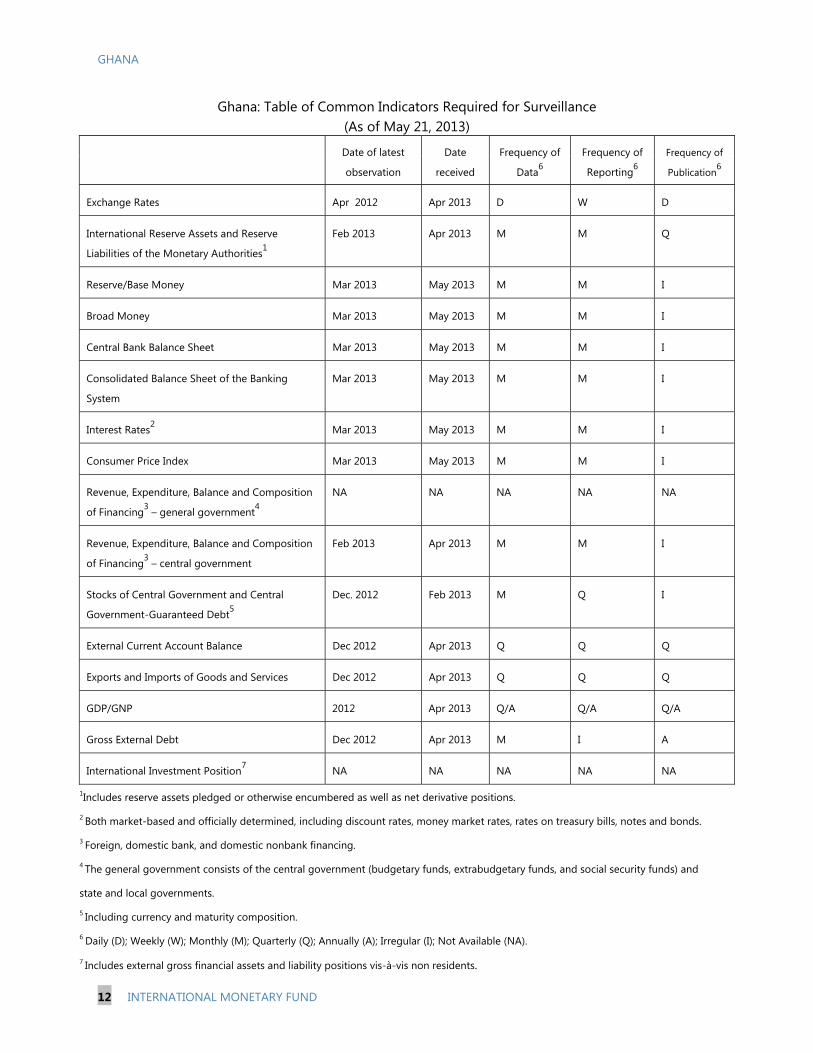
GHANA
12 INTERNATIONAL MONETARY FUND
Ghana: Table of Common Indicators Required for Surveillance (As of May 21, 2013)
Date of latest
observation
Date
received
Frequency of
Data6
Frequency of
Reporting6
Frequency of
Publication6
Exchange Rates Apr 2012 Apr 2013 D W D
International Reserve Assets and Reserve
Liabilities of the Monetary Authorities1
Feb 2013 Apr 2013 M M Q
Reserve/Base Money Mar 2013 May 2013 M M I
Broad Money Mar 2013 May 2013 M M I
Central Bank Balance Sheet Mar 2013 May 2013 M M I
Consolidated Balance Sheet of the Banking
System
Mar 2013 May 2013 M M I
Interest Rates2 Mar 2013 May 2013 M M I
Consumer Price Index Mar 2013 May 2013 M M I
Revenue, Expenditure, Balance and Composition
of Financing3 – general government4
NA NA NA NA NA
Revenue, Expenditure, Balance and Composition
of Financing3 – central government
Feb 2013 Apr 2013 M M I
Stocks of Central Government and Central
Government-Guaranteed Debt5
Dec. 2012 Feb 2013 M Q I
External Current Account Balance Dec 2012 Apr 2013 Q Q Q
Exports and Imports of Goods and Services Dec 2012 Apr 2013 Q Q Q
GDP/GNP 2012 Apr 2013 Q/A Q/A Q/A
Gross External Debt Dec 2012 Apr 2013 M I A
International Investment Position7 NA NA NA NA NA
1Includes reserve assets pledged or otherwise encumbered as well as net derivative positions.
2 Both market-based and officially determined, including discount rates, money market rates, rates on treasury bills, notes and bonds.
3 Foreign, domestic bank, and domestic nonbank financing.
4 The general government consists of the central government (budgetary funds, extrabudgetary funds, and social security funds) and
state and local governments.
5 Including currency and maturity composition.
6 Daily (D); Weekly (W); Monthly (M); Quarterly (Q); Annually (A); Irregular (I); Not Available (NA). 7 Includes external gross financial assets and liability positions vis-à-vis non residents.
Public Information Notice (PIN) No. 13/67 FOR IMMEDIATE RELEASE June 17, 2013 IMF Executive Board Concludes 2013 Article IV Consultation with Ghana
On June 12, 2013, the Executive Board of the International Monetary Fund (IMF) concluded the Article IV consultation with Ghana.1
Background Economic growth continued at a robust pace of 8 percent in 2012 amid rising fiscal and external imbalances. Fiscal pressures came to the fore in a mounting public sector wage bill and costly energy subsidies that pushed the deficit close to 12 percent of GDP. The fiscal expansion led to a significant deterioration in the public debt ratio and contributed to a widening deficit in the external current account, with the latter also reflecting sizeable foreign direct investment (FDI). The policy mix deteriorated in the course of 2012. While fiscal policy became increasingly expansionary, the Bank of Ghana tightened monetary policy in the second quarter of the year to arrest a rapid depreciation of the cedi. The currency subsequently stabilized, with recent depreciations in line with inflation differentials, but at the cost of high real interest rates. Consumer price inflation stayed in the single digits in 2012, helped in part by low food and repressed domestic fuel prices. With rising core inflation (excluding food and energy) and recent increases in fuel prices, inflation has moved back above 10 percent. The growth momentum continues into 2013, with increased oil production projected to keep overall GDP growth close to 8 percent. Non-oil growth is likely to decelerate, however, as a result of energy disruptions and high real interest rates. Survey-based inflation expectations
1 Under Article IV of the IMF's Articles of Agreement, the IMF holds bilateral discussions with members, usually every year. A staff team visits the country, collects economic and financial information, and discusses with officials the country's economic developments and policies. On return to headquarters, the staff prepares a report, which forms the basis for discussion by the Executive Board. At the conclusion of the discussion, the Managing Director, as Chairman of the Board, summarizes the views of Executive Directors, and this summary is transmitted to the country's authorities. An explanation of any qualifiers used in summings up can be found here: http://www.imf.org/external/np/sec/misc/qualifiers.htm.
International Monetary Fund 700 19th Street, NW Washington, D. C. 20431 USA

2 remain elevated at above 10 percent. The current account deficit is projected to stay high at 12 percent of GDP, despite a moderation in import growth, reflecting a weaker outlook for cocoa and gold exports. Staff projects a small reduction in the fiscal deficit to 10 percent of GDP this year, about 1 percent of GDP higher than the authorities’ budget projections, mainly reflecting higher cost of energy subsidies. While Ghana benefits from strong democratic institutions and favorable prospects for oil and gas, a reduction in macroeconomic imbalances over the medium-term is contingent on strengthened policies. Non-oil growth is projected to stabilize at a still robust level of 5–6 percent, and inflation should gradually decline as policies are rebalanced. A planned reduction in the fiscal deficit to about 6 percent of GDP is feasible by 2015, if measures are implemented as envisaged. This, together with increased oil and gas production from new fields, would reduce the current account deficit to about 7½ percent of GDP by 2018, financed in large part by strong FDI. Executive Board Assessment Executive Directors commended the great strides Ghana has made in reducing poverty and reaching lower middle income status. With favorable prospects for oil and gas production and a supportive business environment, Directors saw strong potential for sustained and inclusive growth, provided current macroeconomic vulnerabilities are addressed decisively. Directors were concerned about the reemergence of a large fiscal deficit in 2012, widening external imbalances, and rising domestic debt, which expose the economy to risks from weaker terms of trade or reduced capital inflows. In addition, high domestic interest rates, due to excessive government borrowing, could curtail Ghana’s growth momentum. Directors underscored the need for decisive action to rebuild fiscal and external buffers and reduce public debt, and in particular, stressed the importance of regaining control over the public wage bill. They welcomed the decision to remove fuel subsidies and called for similar action to adjust electricity prices, as a crucial step to tackle Ghana’s energy supply problems. Improving revenue mobilization, including implementation of envisaged tax policy measures, is also a priority. The mid-term policy review would be an opportunity to identify additional measures to secure the fiscal targets. Directors saw a need for more ambitious fiscal consolidation over the medium term to ensure sustainable debt dynamics, allow the buildup of official reserves, and lower the current account deficit. Realigning public spending from subsidies and wages to investment would also support future growth. Given the growing reliance on nonconcessional financing, Directors welcomed the authorities’ efforts to strengthen debt management and investment planning. Directors supported the maintenance of a tight monetary stance until inflationary pressures subside and fiscal consolidation is firmly established. They recommended containing monetary financing of the fiscal deficit, and saw scope for further improvements in the inflation targeting framework to enhance the effectiveness of monetary policy. This could involve improved

3 forecasting, enhanced communication to the public, and rolling one to two year inflation targets, to better anchor expectations. Directors noted that the banking system has grown rapidly and is competitive. They recommended higher minimum capital buffers to contain vulnerabilities, including the risk of increasing nonperforming loans. Directors encouraged the authorities to follow through on the 2011 FSAP recommendations by further upgrading financial sector legislation and supervision, and deepening cooperation with regional counterparts. They also stressed the need to address the issues pertaining to the remaining weak banks, and advised the Bank of Ghana to divest its financial stake in the banking sector.
Public Information Notices (PINs) form part of the IMF's efforts to promote transparency of the IMF's views and analysis of economic developments and policies. With the consent of the country (or countries) concerned, PINs are issued after Executive Board discussions of Article IV consultations with member countries, of its surveillance of developments at the regional level, of post-program monitoring, and of ex post assessments of member countries with longer-term program engagements. PINs are also issued after Executive Board discussions of general policy matters, unless otherwise decided by the Executive Board in a particular case.

Ghana: Selected Economic and Financial Indicators, 2010-131
2010 2011 2012 2013
Act. Act. Est. Proj.
(Annual percent change ; unless otherwise specified) National account and prices
GDP at constant prices 1 8.0 15.0 7.9 7.9 Real GDP (nonoil) 6.5 9.4 7.8 5.9 Real GDP per capita 5.3 12.1 5.2 5.2 GDP deflator 16.5 13.0 13.3 13.7 Consumer prices Consumer price index (annual average) 107 8.7 9.2 10.3 Consumer price index (end of period) 8.6 8.6 8.8 10.8
Money and credit Net domestic assets2 27.1 28.7 51.9 44.8 Credit to the private sector2 25.7 29.0 32.9 38.4 Broad money (M3, including foreign currency
34.6 32.2 24.3 27.8
Velocity (GDP/M2, end of period) 3.3 3.1 3.0 2.9 Base money 45.0 31.1 36.0 24.0 Banks' lending rate (weighted average; percent) … 25.9 25.7 … Policy rate (in percent, end of period) 13.5 12.5 15.0 …
(Percent of GDP)
External sector Current account balance
(including official grants) -8.6 -9.1 -12.2 -11.9 (excluding official grants) -9.2 -9.7 -12.8 -12.4
Foreign direct investment (net) 7.9 8.3 8.1 7.3 External public debt (including IMF) 20.0 21.0 21.9 22.5 NPV of external debt outstanding 8.4 11.5 10.8 9.4
percent of exports of goods and services 28.6 30.6 26.0 26.9 Gross international reserves (mn. of US$) 4,680 5,383 5,349 4,927
Months of prospective Imp. of goods services 2.9 2.9 2.8 2.5 Total donor support (millions of US$) 1,595 1,597 1,272 1,869
percent of GDP 3.5 2.7 3.1 4.1 Central government budget `
Total revenue 14.5 17.3 17.7 19.1 Grants 2.4 2.0 1.6 1.4 Total expenditure 22.8 20.7 27.7 28.0 Arrears clearance and VAT refunds 1.1 2.1 0.1 0.9 Overall balance (financing basis) -7.2 -4.0 -11.8 -10.0 Net domestic financing 4.7 3.3 9.3 7.1 Central government debt (gross) 46.4 43.7 50.2 51.4
Domestic debt 26.3 22.8 28.3 29.0 External debt 20.1 21.0 21.9 22.5
Central government debt (net) 43.2 39.9 48.0 49.5 Memorandum items:
Nominal GDP (millions of GHc) 46,043 59,816 73,109 89,689 GDP per capita (millions of U.S. dollars) 1,358 1,594 1,622 1,786
Sources: Ghanaian authorities; and IMF staff estimates and projections. 1 Based on new national accounts rebased to 2006. 2 Percent of broad money (including foreign currency deposits) at the beginning of the period.

Statement by Jafar Mojarrad, Executive Director for Ghana and Philip Abradu-Otoo, Advisor to Executive Director
June 12, 2013
On behalf of our Ghanaian authorities, we would like to express our gratitude to staff and management for their continued support to Ghana through policy advice, technical assistance, and use of the Fund resources. Our authorities appreciate the high quality discussions with Ms. Daseking and her team during the Article IV Consultations. The authorities broadly agree with staff analysis and recommendations, which they consider pertinent, and stress the importance of fully taking into account the challenges of the economic transformation that is currently underway in Ghana.
Overview The Ghanaian economy has continued along a high growth path in recent years, supported by the favorable prospects for its oil and gas resources, which have attracted large foreign direct investment inflows, as well as by the strong performance of the non-oil sector. Ghana’s stellar achievements in raising per capita income, reducing poverty, and making decisive progress toward a more inclusive growth are well rendered in the interesting Appendix II. While the country has moved to low-middle income status, its economy is also undergoing a major transformation, reflecting not only the large investments in oil extraction and future prospects in this area, but also the growth momentum of the non-oil private sector, which needs to be supported through public investment in infrastructure, prudent macroeconomic policies, and further improvement of the business environment. As seen in similar cases, this kind of transition can generate temporary large imbalances that must be managed in a manner that facilitates the economic transformation. From this perspective, the newly elected government believes that macroeconomic policies and structural reforms must also focus on helping meet the transformation challenges.
Recent economic developments and outlook
In 2012, real GDP grew by 8 percent and was mainly driven by the non-oil sectors, namely agriculture, industry, and services. Inflation stabilized at 8.8 percent following measures put in place by the monetary authorities to contain the rapid depreciation of the currency in the first half of 2012. However, fiscal policy implementation suffered some setbacks as the deficit widened to 12 percent on account of a variety of exceptional factors, as explained below. The current account deficit deteriorated further to 12 percent of GDP and gross international reserves remained low at 2.8 months of import cover. It is important to note, however, that the large current account deficit is closely associated with sizable foreign direct investment, mainly in the extractive industry, with imports of capital equipments, machinery, and intermediate goods representing about 70 percent of total imports.
Looking ahead, the outlook for 2013 and for the medium term is favorable. The growth momentum is expected to be sustained, albeit with some deceleration in the outer years, until production in new oil fields comes on stream with the non-oil sectors expected to continue to grow strongly. Inflation is likely to stay around 10 percent in 2013 on account of adjustment of petroleum prices and expected utility tariff increases, but would stabilize at single digit levels thereafter. The
2
risks posed to the economy from continued imbalances in the fiscal and current accounts are well understood, and the authorities are committed to addressing them in the current fiscal year and beyond, as outlined below.
Fiscal Policy
Fiscal policy implementation in 2012 was expansionary and fell short of expectations in an election year. While the authorities own up to this slippage, they are carefully reviewing all the factors that led to this outcome. These include: (i) implementation problems associated with the single-spine wage policy initiated in 2009 to correct distortions in the public sector wage structure, notably the clearance of 2010-2011 arrears in 2012; (ii) shift from cash to accrual basis (iii) significant shortfall in grants from donors; (iv) over-estimation of revenues from the oil companies; (v) larger-than expected petroleum and utility subsidies, and (vi) higher interest cost burden arising from the steep rise in short term domestic interest rates. Under the circumstances, the authorities agree that the current stance is unsustainable, and require corrective measures to ensure fiscal sustainability. A number of short and medium term policies have been initiated to ensure that the deficit target of 9 percent for 2013 will be reached.
On the revenue side, the main measures being proposed include the re-introduction of the National Fiscal Stabilization Levy; imposition of a levy on imports; increase in some excise taxes; and review of fees and charges. Implementation of these measures would generate additional revenue equivalent to 0.5 percent of GDP. The cabinet has cleared these measures to be submitted for parliamentary approval.
On the expenditure side, the focus will be to regain control over the wage bill. The cause of the significant rise in the wage bill in 2012 is still being assessed to provide a better understanding of the inherent dynamics with the objective of preventing its reoccurrence. Preliminary findings point to the automatic admission of a large number of health and educational workers onto the pay structure. As part of the Government’s policy to improve social indicators and achieve the Millennium Development Goals, a policy of automatic absorption of eligible health and educational trainees was implemented. Hence, the arrears paid in 2012 relate to both single spine and non-single spine wage policies. The wage-setting process will be reviewed with a possible shift towards multi-year agreements that would be negotiated before the budget is finalized. In addition, plans to streamline, discontinue, or commercialize the activities of subvented agencies are being developed and implemented, while the biometric registration of their staff and migration to the mechanized payroll system are being expedited.
Eliminating the fuel subsidy has been a major policy achievement. Ghana’s track record in the area of energy price reform is well documented in the recent Fund paper on energy price subsidy reform (SM/13/29, Supplement 1). The authorities have taken further actions since the beginning of the year to eliminate the subsidy in order to free resources for social and public investment. On February 17, 2013, prices of petroleum products were adjusted by between 15 and 50 percent, and on June 1, 2013, further adjustments of between 3 and 5 percent were announced, resulting in a total elimination of subsidies on petroleum products. With the full phasing out of these subsidies—while

3
retaining the targeted cross-subsidy—the stage is set for implementation of an automatic price adjustment mechanism beginning July 2013.
The authorities are committed to address the constraints in the energy supply situation and bring prices to cost recovery levels. While our authorities agree that substantial adjustments are required, they believe that careful prioritization and timely sequencing of the subsidy elimination program will be essential. The Public Utilities Regulatory Commission (PURC) has consistently made the granting of tariff increases conditional on improved services to consumers. With some improvements in the electricity supply situation, the PURC has begun discussions with the utility companies with the view to adjust utility prices. Here too, the objective is to institute an automatic pricing formula once cost recovery is fully achieved.
Further steps are contemplated in the area of public finance management and institutional fiscal reforms. These include strengthening project selection and prioritization, reviewing rigid budget allocation rules of statutory funds, monitoring commitments of Ministries, Departments and Agencies as they arise, and ensuring that existing pipelines of signed contracts are cleared before new contracts are awarded. As highlighted in the report, the authorities are open to renew the dialogue over the adoption of a comprehensive fiscal rule, once progress is made in fiscal consolidation.
The updated debt sustainability analysis shows moderate risk of debt distress. The authorities are determined to take necessary steps to safeguard long-term debt sustainability. To this end, new non-concessional borrowing will be only for critical projects that comply with clearly established appraisal guidelines. The Ghanaian authorities plan to implement a self-financing scheme for commercial loans for projects. Strengthening the Public Private Partnership (PPP) framework for development will also limit borrowing and reduce debt service costs. In addition, the authorities will seek to improve the public debt maturity and cost profile by replacing costly short-term borrowing in the illiquid domestic market by medium-term external borrowing. A planned Eurobond with the size of up to $1 billion aims at achieving this objective while strengthening the external reserve buffer.
Monetary and Financial Sector Policies
Monetary policy was tightened in the first half of 2012 in connection with rapid exchange rate depreciation. The Central Bank raised the policy rate three times in 2012 by 250 basis points; together with additional quantitative measures to mop up excess liquidity and stabilize the cedi, as highlighted in the report. These measures helped restore stability in the foreign exchange market.
Data for April 2013 show a rise in headline inflation to 10.6 percent, driven in part by the pass-through of petroleum price increases in February 2013 and aggregate demand pressures. With the second round of increase in petroleum prices in June 2013, and planned increase in electricity tariffs, scheduled for the second half of the year, the Central Bank has indicated its readiness to ensure that inflationary pressures remain contained. At its recent Monetary Policy Committee (MPC) meeting held on May 22, 2013, the Central Bank further increased its policy rate by 100 basis points after having assessed that the risks to inflation remained high. In addition, the policy interest rate corridor was widened at the upper bound by 200 basis points to make it expensive for banks to

4
borrow from the Central Bank and a standing facility was introduced to manage interbank liquidity more effectively and improve upon the transmission mechanism. The authorities believe that their experience with inflation targeting has been positive as outlined in Box 3, and will seek to further strengthen the IT framework in the area of liquidity management and forecasting capabilities. The authorities have requested Fund Technical Assistance and a joint collaborative effort between the Fund and the Central Bank is already underway.
On financial sector stability, capital adequacy levels, non-performing loan ratios, and liquidity buffers have improved, and credit is growing strongly. Despite the sound position of the banks, challenges remain that would have to be addressed. First, our authorities and staff are in agreement regarding the risks of crowding out profitable private investment through high lending rates, with possible adverse effect on NPLs. Further enhancing competition in the banking system and reducing upward pressure on interest rates through government borrowing will help address this issue. Second, efforts are underway to update financial laws and regulations and the Central Bank is working to address existing gaps in this area with Fund assistance. Regarding guidelines for microfinance institutions issued by the Central Bank in July 2011, the slow pace of granting licenses was intended to ensure that supervision capacity can meet the increased demand. The Central Bank is currently expanding and restructuring its supervision department with assistance of a Fund resident advisor. The expectations are that by the end of the third quarter, the new supervision department would be created and become fully operational to effectively handle supervision demands of the microfinance institutions.
Structural Reforms
The authorities remain steadfast in addressing the constraints in the energy sector to keep up with demand and ensure reliability of energy supply. A hydroelectric dam project initiated in April 2008 to augment the supply of electricity is on track for completion. The project, estimated at US$800 million, and designed to have 4 generating power units, is expected, upon completion, to generate 404 megawatts of electricity, one of which has been completed and commissioned in May 2013. The other three units are scheduled to come on stream by November 2013. The completion of the hydroelectric dam projects in November 2013 and restoration of natural gas to power a key thermal plant would elevate the total power supply by 560 megawatts and improve overall reliability of energy supply.
Commendable progress has been made in improving Ghana’s business environment, as evidenced by the World Bank “Doing Business” and governance indicators. Further efforts will seek to streamline procedures, improve access to credit, and remove infrastructure and energy related impediments to investment and growth.
On social issues, our authorities welcome the report’s findings, which attest to Ghana’s progress on improving per capita income and living standards, reducing poverty and income inequality, and building strong foundations for higher and more inclusive growth. The authorities are determined to work further to improve job prospects, strengthen social safety nets, and improve the quality of social spending, particularly in health and education.

5
Conclusion
The Ghanaian economy is undergoing a critical phase of its transition to full-middle income status, with important future changes in its economic structure and drivers of growth. The authorities are aware of the challenges involved in this kind of transition and intend to manage them in a way that would sustain the investment and growth momentum while achieving macroeconomic stability. The authorities are appreciative of their engagement with the Fund and continue to attach high value to its policy advice and technical assistance.