imagining the future of agriculture robert tse usda rural development yribarren ranch bishop, ca...
TRANSCRIPT

Imagining the Future of Agriculture
Robert TseUSDA Rural DevelopmentYribarren RanchBishop, CA July 24, 2014

Global Demographic DriversGlobal Ag Challenges
Global Ag Opportunities

Global Demand Drivers to 2050• Global Population Increase• Rapid Urbanization• Growing Middle Class• Climate Change Impact
•Rising Food Prices•Rising Global Trade of Food•Rising Demand for Protein, Fruits and Vegetables•Agriculture Adapts to Climate Change•Rising Global Travel
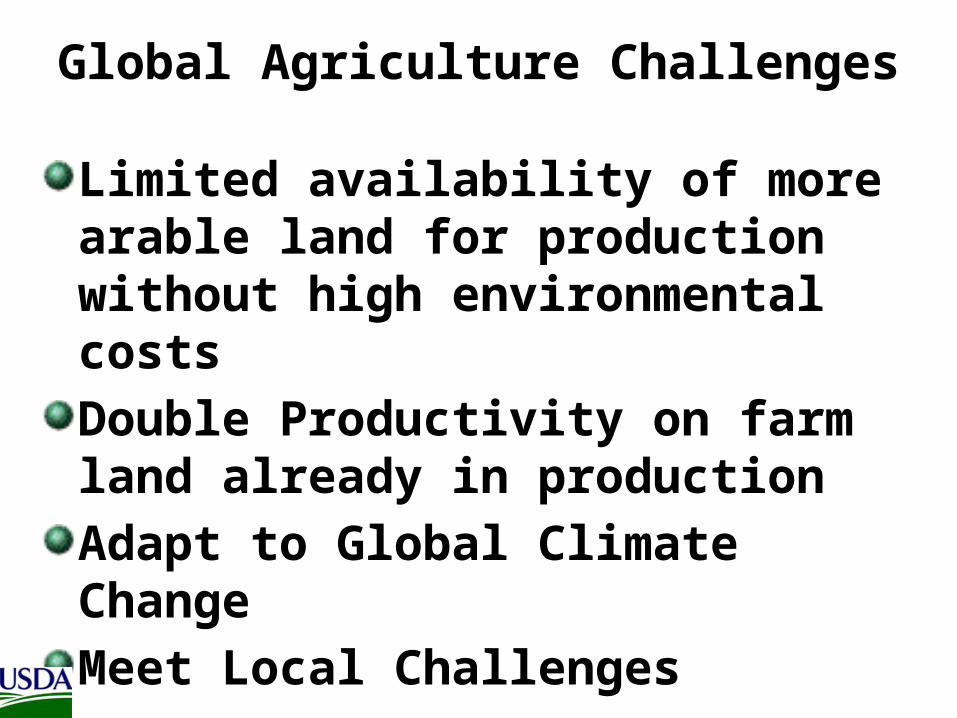
Global Agriculture Challenges
Limited availability of more arable land for production without high environmental costs
Double Productivity on farm land already in productionAdapt to Global Climate ChangeMeet Local Challenges
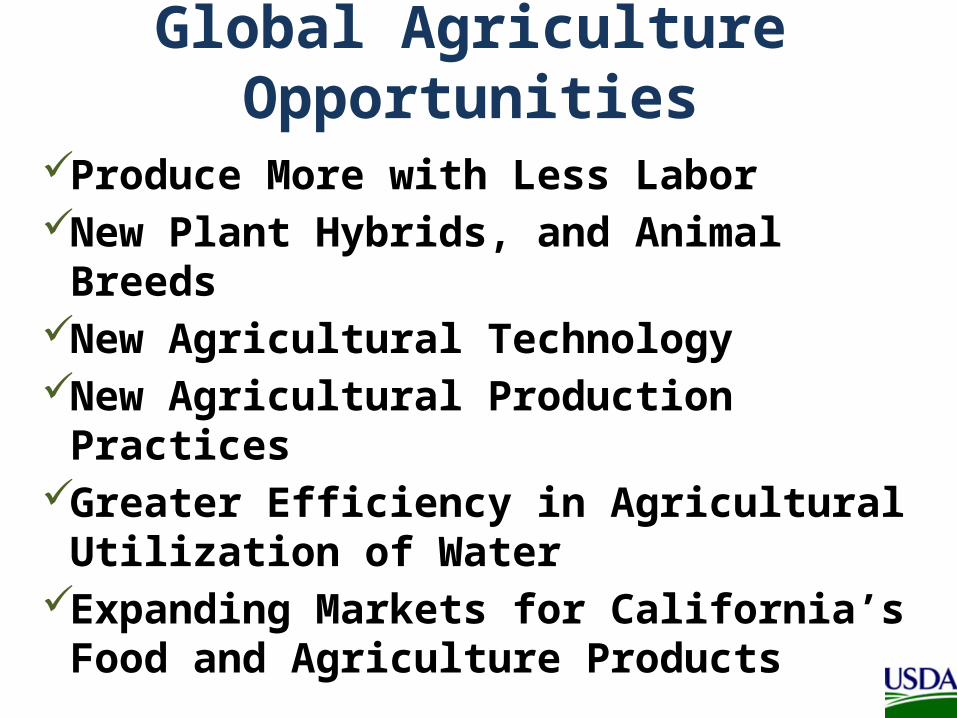
Global Agriculture Opportunities
Produce More with Less LaborNew Plant Hybrids, and Animal BreedsNew Agricultural TechnologyNew Agricultural Production PracticesGreater Efficiency in Agricultural
Utilization of WaterExpanding Markets for California’s
Food and Agriculture Products

Central Valley Produces More Than Any Other State - Except California
$33.8 B
$27 B
$47.5 B$34.7 B
Gross Farm Gate USDA NASS

San Joaquin Valley Dominates California Ag Production
$Billion All Crops
California $51.5San Joaquin Valley $30.2Fresno $6.9 14%Tulare $5.6 11%Kern $5.4 11%Merced $3.3 6%Stanislaus $3.1 6%San Joaquin $2.2 4%Kings $2.2 4%Madera $1.6 3%
Gross Value
59%
2011 USDA NASS CA
2011

Surface View

Inyo & Mono County Farm Gate $77.3 MillionAnimal Agriculture Dominates
Pasture and Hay; 30.08; 39%
All Cattle; $35.5; 46%
Sheep & Lambs; 3.862; 5%
GARLIC; 0.994; 1%POTATOES; 0.935; 1%NURSERY, TURF;
1.011; 1%Apiary Prdts; 2.869;
4%Rest of Products;
1.986; 3%
$ Million
USDA NASS 2012
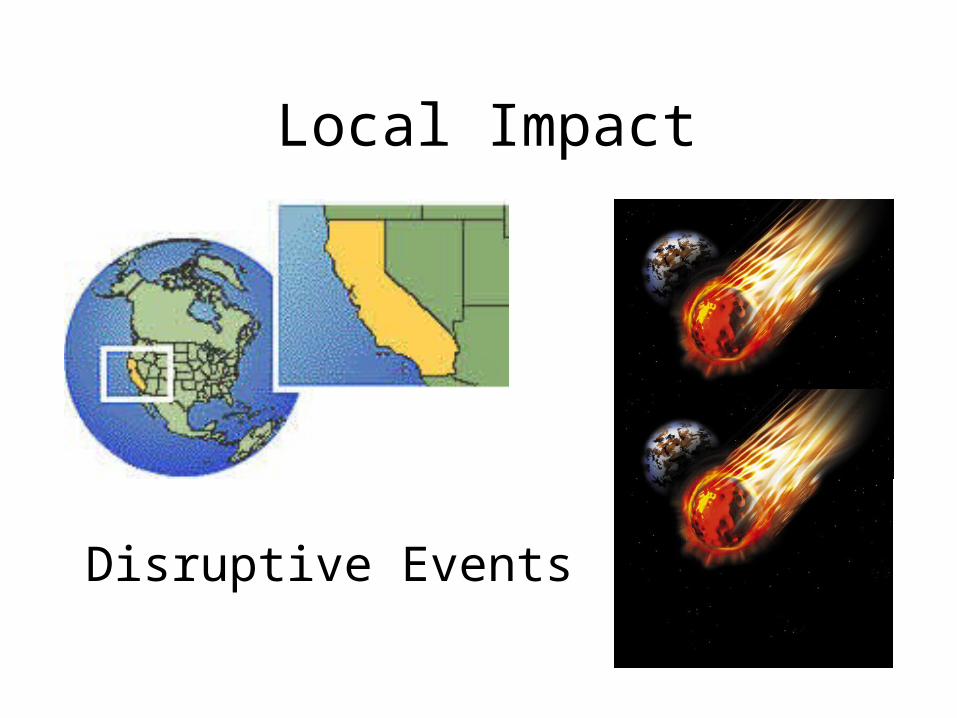
Local Impact
Disruptive Events

Disruptive Event: Drought

2014 Drought Impact
• Greatest absolute reduction in water available … for California agriculture ever seen …
• State wide Impact:– Crop Revenue Loss: $810 Million– Additional Pumping Cost $454 Million– Livestock / Dairy Revenue Loss $203 Million– TOTAL DIRECT LOSSES $1.5 BILLION
• TOTAL ECONOMIC COST: $2.2 BILLION• TOTAL JOB LOSSES: 17,000
Economic Analysis of the 2014 Drought for California AgricultureUC Davis Center for Watershed Sciences July 15, 2014
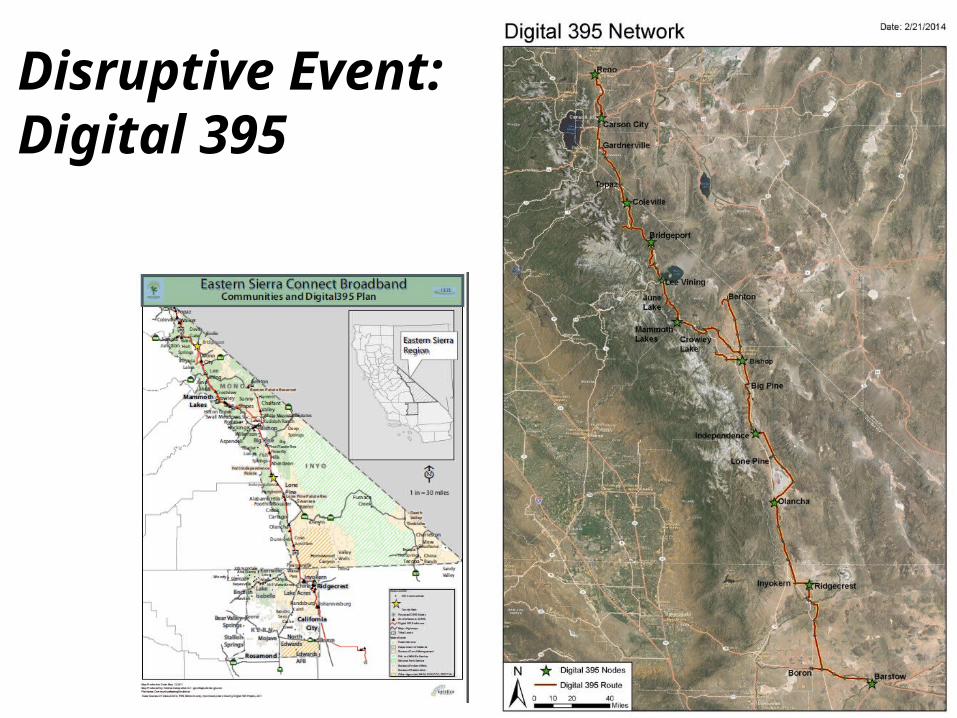
Disruptive Event: Digital 395

Robert Tse USDA RD CA
Agriculture Technology
Combines two California core strengths: Agriculture and Technology
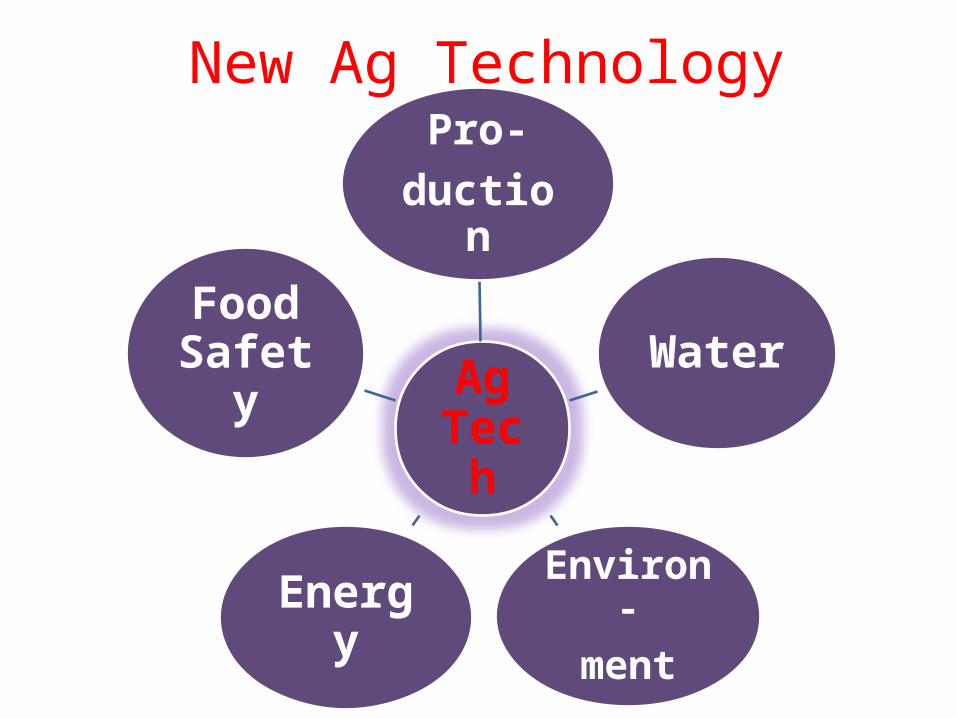
New Ag Technology
Ag Tech
Pro-duction
Water
Environ-ment
Energy
Food Safety

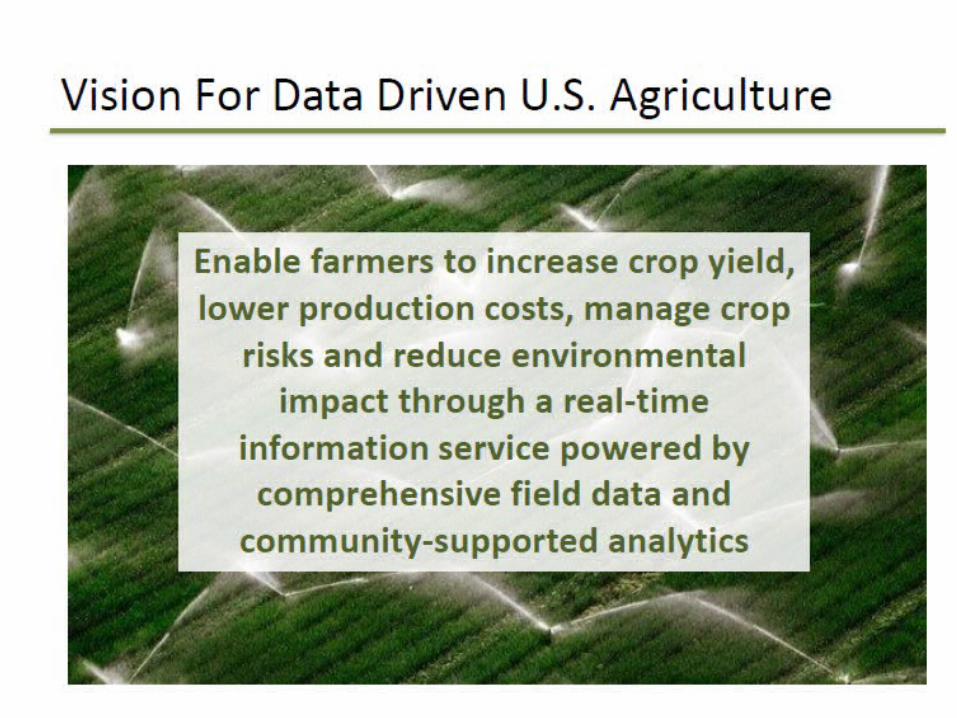
New Data Driven Technology Production Side of Agriculture

InfrastructureBROADBAND
RURAL WIRELESS BROADBANDNEW AGRICULTURE TECHNOLOGY
PRODUCTION WATER ENERGY
ENVIRONMENT FOOD SAFETY
RURAL TELE-HEALTH / TELE-MEDICINE
Distance Learning Public Libraries
TRANSPORTATION & LOGISTICS
PUBLIC SAFETY
DIRECT MARKET ACCESS TO GLOBAL MARKETS
Rural Agro Tourism & Recreation
FOUNDATION FOR ECONOMIC GROWTH AND OPPORTUNITY

Technology is Here!http://www.youtube.com/watch?v=q8dBOGAfUIk

Thank you

Travel – Tourism is Critical to Rural CountiesRank County Percent
Employment From Tourism
Percent Earnings From Tourism
1 Mariposa 52% 33%
2 Mono 49% 32%3 Alpine 34% 16%
4 Inyo 24% 12%5 Sierra 23% 13%
California Tourism Commission

Regional Economy Driven by Tourism
Travel Hotel Food & Bev Farm Gate$0
$100
$200
$300
$400
$500
$600
$700
$800
Mono Inyo$704
$ Million
2012 2012 2011 2012
Source: California Tourism Commission, USDA - NASS
$195$136
$77

San Joaquin Valley Dominates California Ag Production
$1,000 All Crops
State Total 51,488,191San Joaquin Valley 30,243,586Fresno 6,884,582Tulare 5,629,264Kern 5,364,363Merced 3,259,866Stanislaus 3,069,823San Joaquin 2,246,920Kings 2,219,529Madera 1,569,239
Fresno13%
Tulare11%
Kern10%
Merced6%
Stanislaus6%
San
Joaq
uin
4%King
s4%M
ader
a3%
Rest of State41%
San
Joaq
uin
Valle
y
Gross Value
59%
2011 USDA NASS CA
2011