image reconstruction of effective mie scattering ...dehghanh/research/downloads/wang_jbo_2006… ·...
TRANSCRIPT

Journal of Biomedical Optics 11�4�, 041106 �July/August 2006�
Image reconstruction of effective Mie scatteringparameters of breast tissue in vivo with near-infraredtomography
Xin WangDartmouth CollegeDepartment of Physics and AstronomyHanover, New Hampshire 03755
Brian W. PogueShudong JiangHamid DehghaniXiaomei SongSubhadra SrinivasanBen A. BrooksbyKeith D. PaulsenDartmouth CollegeThayer School of EngineeringHanover, New Hampshire 03755
Christine KogelSteven P. PoplackDartmouth Medical SchoolDepartment of Diagnostic RadiologyHanover, New Hampshire 03755
Wendy A. WellsDartmouth Medical SchoolDepartment of PathologyHanover, New Hampshire 03755
Abstract. A method for image reconstruction of the effective size andnumber density of scattering particles is discussed within the contextof interpreting near-infrared �NIR� tomography images of breast tissue.An approach to use Mie theory to estimate the effective scatteringparameters is examined and applied, given some assumptions aboutthe index of refraction change expected in lipid membrane-boundscatterers. When using a limited number of NIR wavelengths in thereduced scattering spectra, the parameter extraction technique is lim-ited to representing a continuous distribution of scatterer sizes, whichis modeled as a simple exponentially decreasing distribution function.In this paper, image formation of effective scatterer size and numberdensity is presented based on the estimation method. The method wasevaluated with Intralipid phantom studies to demonstrate particle sizeestimation to within 9% of the expected value. Then the method wasused in NIR patient images, and it indicates that for a cancer tumor,the effective scatterer size is smaller than the background breast val-ues and the effective number density is higher. In contrast, for benigntumor patients, there is not a significant difference in effective scat-terer size or number density between tumor and normal tissues. Themethod was used to interpret magnetic resonance imaging–coupledNIR images of adipose and fibroglandular tissues, and it indicated thatthe fibroglandular tissue has smaller effective scatterer size and largereffective number density than the adipose tissue does. © 2006 Society ofPhoto-Optical Instrumentation Engineers. �DOI: 10.1117/1.2342747�
Keywords: near-infrared; tomography; scattering parameters; mie theory; breasttissue; in vivo.Paper 05290SSRR received Oct. 10, 2005; revised manuscript received Apr. 9,2006; accepted for publication Apr. 11, 2006; published online Sep. 1, 2006.
1 IntroductionThe relationship between the optical and biological propertiesof tissue is necessary for the optical techniques in tissue di-agnostics. Studies have shown that there is excellent contrastin breast lesions relative to normal tissue, and that the scatter-ing contrast between malignant and benign processes appearsto be significant.1 In the past decade, near-infrared �NIR� to-mography, which is a method to generate images of internaldistributions of optical absorption and scattering at multiplewavelengths by measuring light propagation through tissue,has been developed with considerable interest as a breast im-aging modality to characterize abnormalities noninvasively.2–8
Further, interest exists in exploiting the scattering spectrum oftissue to characterize its microscopic properties, which mayprovide fundamental insight into the morphological featuresthat are observed in the macroscopic diffuse light signal.9–16
There have been important advances in particle sizing throughMie scattering theory,9–13,16–20 which is the model of light
Address all correspondence to Brian Pogue, Thayer School of Engineering, Dart-mouth College, 8000 Cummings Hall, Hanover, NH 03755; Tel: 603 646-3861;
Fax: 603 646-3856; E-mail: [email protected]Journal of Biomedical Optics 041106-
scattering for a spherical scatterer with size near the samedimension as the radiation wavelength. In our previouspaper,21 an estimation method was presented to analyze bulktissue reduced scattering spectra in terms of their effectiveMie theory scatterer parameters, effective scatterer size, andnumber density. In this paper, the image reconstructionmethod for these effective Mie theory scatterer parameters ispresented based on the estimation method in the previouspaper.21
In estimating effective scatterer size and number density, itis important to focus on what is known and unknown abouthow light scatters in tissues constituting normal and malignantcells. The morphologic changes from normal to diseasedbreast tissue are seen by light microscopy in the cellular epi-thelial component and the surrounding support stroma. Gen-erally, the hallmark of an epithelial malignancy is an increasein the overall epithelial cell density with increased nuclearand nucleolar size. In order to facilitate invasion into the sur-rounding stroma, subcellular compositional changes in thatmatrix structure also occur. Microscopic subcellular alter-
1083-3668/2006/11�4�/041106/13/$22.00 © 2006 SPIE
July/August 2006 � Vol. 11�4�1

Wang et al.: Image reconstruction of effective Mie scattering parameters¼
ations exist that may not be apparent in standard pathologicalanalysis. Macroscopic scattering of light from tissue isthought to originate from the multiple microscopic fluctua-tions in refraction index between intracellular organelles andextracellular structures, typically bounded by bilipidmembranes.22–24 Origin of the transport scattering coefficient,which can be measured tomographically is likely to resultfrom these differences in the index of refraction between theextracellular or cytoplasmic fractions of tissue and the lipidcomposition of the membranes bounding each cell and cellu-lar organelle. Hence, variations in the scattering spectral fea-tures, which can be measured tomographically, may encodemorphologic and pathophysiologic changes in tissue at themicroscopic level. While it is possible to postulate causes ofscattering in tissue, it is considerably more difficult to designobjective experiments that prove a given hypothesis. Severalstudies have demonstrated that light transport in tissue isdominated by elastic scattering. The applicability of Mietheory is only approximate because it strictly applies only forspheres in a homogeneous background,25,26 yet such approxi-mations have been used successfully in the interpretation ofnatural scattering phenomenon and are explained here as areasonable first order approximate.27
Most of the previous studies of scatterer size determinationfrom scattering spectra have been focused on mucosal dis-eases or dilute cell suspensions where the scattering by cellnuclei has been a primary emphasis,9–16 and in general, anincreased nuclear scatterer size has been found in the diseasedtissue. In these studies, subtle oscillations in the scatteringspectrum were used to estimate nuclear size through fits toMie calculations. In other investigations, more focus has beenpaid to the scattering of small particles in tissue. However, theextent to which small and large particle size scatterers can besimultaneously fit with sparse data is not yet clear, althoughwith full angular or spectral reflectance, it is evident that rea-sonable estimation of both can be achieved.28–31 Mie scatter-ing interpretation serves as a reasonable starting point to ana-lyze elastic transport scattering spectra, and with sparsewavelength data, it appears likely that only information aboutsmaller scattering particles can be effectively estimated.
In prior attempts to estimate effective scatterer size, as-sumptions about the histogram of scatterer sizes in tissue weremade to reduce the estimation problem to be a two-parameter�average scatterer size and number density, which are calledas the effective scatterer size and number density� estimationproblem. For larger particles, like cell nuclei, the histogramshape has been assumed to be Gaussian.11,29,32–34 However,smaller particles, like mitochondria, Golgi bodies, lysosomes,and such, have often been assumed to be arranged in a log-normal distribution.10 There is also a strong rationale for usinga simple exponential function for the distribution of smallerparticles in tissue, as the density of smaller organelle struc-tures clearly continues to decrease well below our ability toimage these structures with optical microscopy. In tissuephantom studies, Intralipid provides a distribution of sizeswhere the histogram has been determined by electron micros-copy to be exponentially distributed25 with an average size of97 nm. In this paper, an exponential distribution of scatteringparticle sizes is used to interpret the scattering spectra of both
Intralipid phantom and human breast tissue.Journal of Biomedical Optics 041106-
One of the goals of NIR tomography research has been toprovide clinicians with new information about the underlyingproperties of benign and malignant breast disease.8,35–38 How-ever, there is emerging data indicating that NIR scatteringspectra are correlated to the normal composition of breasttissue and that changes in breast physiology can be detectedby variations in scattering spectra.39,40
In a previous paper,21 the method for extracting effectivescatterer size and number density from the reduced scatteringcoefficient spectrum was proposed. The scattering spectrumwas sampled at 6 wavelengths �661, 761, 785, 808, 826, and849 nm� measured for transmission through normal breast tis-sue using a clinical breast tomography system. In this paper,the image reconstruction method for the effective Mie theoryscattering parameters is proposed based on the estimationmethod in the previous paper. The assumptions and limita-tions of this image reconstruction process are discussed to putthe study in perspective with prior work, and the method uti-lized is analyzed through simulated and tissue-phantom datato establish its accuracy. The value of image reconstructionfor effective scatterer size and number density from tomogra-phy data could be quite significant; hence, methods to furthertest and implement the approach are discussed. Acceptance ofthe relevance of particle size and number density could beeasier than the more abstract quantities of scattering ampli-tude and power, thus this work could have important benefitsin the field of medical use of diffuse tomography.
2 Methods2.1 Mie Scattering Theory Interpretation
Mie theory26 provides an exact solution for elastic scatter, inthe case of a perfect dielectric sphere of arbitrary size in auniform background medium. Using Mie theory, the reducedscattering coefficient spectra of bulk homogeneous samplescan also be expressed quantitatively, with the homogeneousmedium equation as
�s���� = N��a2�Qscat�m,a,���1 − g�m,a,��� , �1�
where � is the wavelength, N is the number density of thescatterer, a is the scatterer size �the diameter of the scatteringparticle�, m is the relative refractive index �m=n2 /n1, wheren1 and n2 are the refractive index outside and inside the par-ticles, respectively� and Qscat�m ,a ,�� is a dimensionless scat-tering efficiency factor that is calculated from an analytic se-ries expansion that is the solution to the scattered waveintensity from the sphere. Mie theory can be extended to ap-proximate a multisized scattering particle medium by simplysumming the scattering contributions over all scattering par-ticle sizes and adding an approximate normalized size distri-bution factor, f�a�, which describes the histogram of scatter-ing particle number density per unit particle size, in whichcase Eq. �1� becomes
�s���� = N�i=1
p
f�ai���ai2�Qscat�m,a,���1 − g�m,a,��� . �2�
The average scatterer size could be expressed as
July/August 2006 � Vol. 11�4�2

Wang et al.: Image reconstruction of effective Mie scattering parameters¼
�a� = �i
aif�ai� . �3�
Equation �2� has implicit assumptions that the scattering par-ticle index changes are all the same, which is a limitation thatshould be recalled when it is applied in various problems.However, the simulation study resuls in an earlier paper21 in-dicated that the index changes typically result only in changesof amplitude in �s�, rather than changes in the spectral fea-tures in the NIR regime. Thus, while the assumption of con-stant m is unfortunate, it still does allow an estimation of thescattering particle size, given some a priori information aboutthe f�ai� function.
A more empirical approach to Mie theory was first pro-posed by van Staveren et al.25 in fitting the scattering spec-trum of Intralipid. A number of groups have adopted the ap-proach to characterize the spectrum of the reduced scatteringcoefficient observed in tissues.37,40–42 In these studies, thescattering spectra are considered to satisfy a power law rela-tionship, similar to Rayleigh scattering where the scatter co-efficient decreases as �−4, but using a power value smallerthan 4. Empirically, when there is a broad range of scatteringparticle sizes, this spectrum is described by a power law curveof the type
�s���� = A�−b, �4�
where A and b are model parameters for scattering amplitudeand scattering power, respectively. Equation �4� describes asmooth function with no oscillations in the spectrum and con-veniently restricts the fitting process to only two parameters.The curve is quasi-linear in the NIR region and appears to fitdata from a large number of wavelengths reasonably well.43
2.2 Scattering from Tissue SpectraIn Eq. �2�, the number density only influences the amplitudeof the scattering spectra in the NIR range, and there are onlytwo parameters to determine the shape of the scattering spec-tra including �i� the distribution function and �ii� the relativerefractive index. The distribution function could be separatedinto two parts: the type of the distribution function and theaverage size. So there are three parameters to determine theshape of the scattering spectra including �i� the type of thedistribution function, �ii� the average scatterer size, �a�, and�iii� the relative refractive index. If the type of the distributionfunction and relative refractive index can be set by someknown information, then there are only two parameters left toestimate in Eq. �2�: average scatterer size and numberdensity,21 which are called the effective scatterer size andnumber density. Considering that the effective scatterer sizeinfluences the shape of the scattering spectra in these twoparameters, the effective scatterer size can be estimated bycomparing the shape of the scattering spectra obtained withMie theory. Then, using this effective scatterer size estimate,the effective number density can be calculated by comparingthe magnitude of the scattering spectra with Mie theory.
2.3 Image Reconstruction of Absorption andScattering Coefficients
Reduced scattering coefficients were obtained with the clini-
cal imaging system in use at Dartmouth �see Ref. 44 for de-Journal of Biomedical Optics 041106-
tails�. Briefly, the system measures diffusely transmitted am-plitude and phase shift at 100 MHz through up to 12 cm oftissue and is designed for breast imaging for characterizationof tumors noninvasively. The measurements are taken at sixwavelengths �661, 761, 785, 808, 826, and 849 nm�, the datais calibrated by a homogeneous phantom, and then fit to afinite element diffusion theory prediction of the data. The fi-nite element model is iteratively fit to the measurementsthrough a Newton minimization method, and images of ab-sorption and reduced scattering coefficient are recovered at allwavelengths. In recent years, a direct reconstruction approachhas been implemented that uses the known spectrum of theabsorbing species in the tissue �hemoglobin, oxyhemoglobin,water� and the assumed model of scattering shown in Eq. �4�.This inversion algorithm is described in detail in previouspapers and is believed to provide more accurate prediction ofthe scattering parameters A and b from Eq. �4�.45,46 However,related to the fitting for particle size and density, it must beclearly understood that a sparse number of wavelengths can-not be used to accurately fit a highly detailed scattering spec-trum, and in fact, oscillations in the spectrum have not beenobserved to date in bulk tissues. Thus the limited number ofwavelengths is not sufficient for identifying oscillations in thescattering spectra that might be observed from larger Miescattering particles, and these have not been observed withany certainty in diffuse spectra. However, oscillation in thediffuse spectra can be omitted if the dominant scattering par-ticle sizes are thought to be smaller than 1000 nm.21
2.4 Effective Scatterer Size and Number DensityEstimation Method
To estimate effective scatterer size and number density, withthe limited number of wavelengths available, any oscillationin the spectra must be omitted because the dominant scatterersizes expected are small. The six experimental reduced scat-tering coefficients are fit to predictions of the power law ex-pression in Eq. �4�, first to get the scattering amplitude andscattering power, and then to generate a function of reducedscattering coefficient as a function of wavelength from 650 to1000 nm. To extract the average particle size, this reducedscattering coefficient function is normalized at one wave-length �800 nm�. This normalization eliminates the influenceof number density, so that only average particle size needs tobe fit in the first stage. Using a least-squares minimization, theaverage particle size can be effectively estimated. Then thenumber density can then be estimated by comparing the origi-nal unnormalized data with Mie theory �Eq. �2�� using a sec-ond least-squares minimization method. In this fitting, the fol-lowing error function is used:
� =� 1
n�i=1
n
���s�i exp − �s�
io�/�si�o�21/2
, �5�
where � is the error norm, n is the total number of wave-lengths used in the fitting process, �s
i� exp is the experimentalreduced scattering coefficient at the ith wavelength, �s
i� o isthe reduced scattering coefficient at the ith wavelength calcu-lated from Mie theory. Further details of this estimation
21
method are provided in an earlier paper.July/August 2006 � Vol. 11�4�3

Wang et al.: Image reconstruction of effective Mie scattering parameters¼
2.5 Effective Scatterer Size and Number DensityImage Reconstruction Method
From the estimation method briefly presented above, the ef-fective scatterer size, �a�, and number density, N, images areestimated from experimental measurements of the scatteringpower b and amplitude A. Data in Ref. 21 showed that out of�a� and N, it is only �a� that influences the shape of thescattering spectra in the NIR region. Effective scatterer size�a� can therefore be directly estimated from the experimentalvalue of b. When the scattering amplitude is normalized toA=1 at 800 nm, the effective number density N=N0 is also,such that N0 is also determined only by the scattering powerb. Then for arbitrary A, the effective number density can thenbe estimated by N=AN0. So given A and b, both �a� and Ncan be estimated with this sequential process.
By simulating a series of b values to get the results for �a�and N0, an empirical polynomial power function was foundfor �a� as a function of b, and for N0 as a function of b. Theequations for �a� and N0 are represented as polynomial ex-pressions, listed in Table 1. The fit to the data for �a� wasfound to be optimal with a seventh order polynomial, whereasthe fit to the data for N0 required only a third order polyno-mial.
2.6 Phantom StudyData from the tomography system was used to validate thisestimation approach by initially using tissue-simulating phan-toms with well-characterized particle size and density. Hetero-geneous gelatin phantoms were used, containing Intralipid in-clusions at five different concentrations, ranging from 0.75 to1.75% in steps of 0.25%. This range of inclusion concentra-tions provided a reduced scattering coefficient spectrum withthe same particle size but linearly increasing number density.The data at each concentration was analyzed with the method
Table 1 Power function estimates for effectivegiven the index of refraction values specified fopower series was taken out to seven orders, whe
Bilipid membrane
Powerorder
n1=1.36, n2=1.4 n
�a� �nm� N0 �m−3� �a�
0 2.93�103 14.7 3.1
1 −9.57�103 3.76 −1.0
2 1.35�104 −2.71 1.67
3 −1.03�104 0.403 −1.3
4 4.52�103 6.58
5 −1.15�103 −1.8
6 1.58�102 2.68
7 −8.96 −
described above with image reconstruction for the effective
Journal of Biomedical Optics 041106-
scatterer size and number density. By varying the concentra-tion, each spectrum is expected to result in the same �a�, witha theoretical value near 97�±3� nm, as measured by van Sta-veren et al.25 This experiment provided an effective way toexamine imaging inclusions within an otherwise homoge-neous domain.
2.7 Image Reconstruction of �a� and N for HumanBreast Tissue
In the second step, the image reconstruction method was ap-plied to cancer breast tissue images. The study was approvedby the institutional committee for the protection of humansubjects. NIR imaging studies were performed on symptom-atic women recruited into the study following an abnormalmammogram and at the time of referral to biopsy. Informedconsent was provided prior to the NIR imaging exam. Datafrom 12 patients were used in the analysis presented here,including 3 cancer patients and 9 benign tumor patients. Forthe diseased breast, both the cancer tissue and the backgroundnormal tissue were studied; the region of the tumor was de-lineated manually based upon a radiologist’s prediction of thelocation of the lesion from the x-ray mammograms. The re-gional average value was calculated for both the tumor andthe normal tissue values. The contralateral breast was alsoanalyzed separately as a whole value. Reconstruction of im-ages for all patients was done with a direct estimate of thescattering parameters based upon an algorithm that incorpo-rates all six wavelength data sets simultaneously and con-strains the fitted images to recover hemoglobin, oxygen satu-ration, water fraction, and scattering spectra, fitted to A and bparameters.
2.8 Study of Subject Images from the MRI-NIRSystem
In a final stage in the testing of the parameter estimation ap-
er size �a� and normalized number density N0,e �n1� and inside �n2� the spheres. For �a�, the
r N0 only three orders were required.
se tissue Intralipid phantom
6, n2=1.49 n1=1.33, n2=1.47
N0 �m−3� �a� �nm� N0 �m−3�
14.0 6.67�103 13.5
4 2.87 −2.67�104 3.41
−2.18 4.43�104 −2.42
4 0.316 3.89�104 0.35
1.94�104
3 −5.55�103
8.45�102
−53.1
scatterr outsidreas fo
Adipo
1=1.3
�nm�
�103
9�10
�104
8�10
�103
1�10
�102
16.4
proach, the data processing method was applied to images
July/August 2006 � Vol. 11�4�4

Wang et al.: Image reconstruction of effective Mie scattering parameters¼
from a magnetic resonance imaging �MRI�-coupled NIR sys-tem for breast tissue imaging. A clinical prototype hybrid im-aging system, which combines NIR spectral tomography andMRI, was used to determine tissue structure with improvedspatial resolution.47–50 Combining these two methodologiesinto a platform for simultaneous data acquisition allowed forexcellent coregistration and data synergy. NIR reconstructionsthat use appropriate spatial constraints from a priori structuralinformation about the boundary between adipose and fibro-glandular tissue, lead to images with millimeter resolution andbetter represent the physiological differences between thesetwo types of tissue. Thus, these images were used with thealgorithm to predict effective scatterer size and number den-sity to examine the typical values for adipose and fibroglan-dular tissue.
The imaging system used, described in detail by Brooksbyet al.,48 records measurements of NIR light transmissionthrough a pendant breast in a planar, tomographic geometry. Aportable cart houses the light generation and detection hard-ware subsystems. Six laser diodes �660 to 850 nm� are am-plitude modulated at 100 MHz. The bank of laser tubes ismounted on a linear translation stage, which sequentiallycouples the activated source into 16 bifurcated optical fiberbundles. The central seven fibers deliver the source lightwhile the remaining fibers collect transmitted light and arecoupled to photomultiplier tube �PMT� detectors located inthe base of the cart. For each source, measurements of theamplitude and phase shift of the 100 MHz signal are acquiredfrom 15 locations around the breast. The optical fiber bundlesextend 13 m into a 1.5 T whole body MRI �GE Medical Sys-tems�, and the two data types �i.e., NIR and MRI� are ac-quired simultaneously. The patient lies on an open architec-ture breast array coil �MRI Devices� that also houses theMRI-compatible fiber positioning system. The plane of fibersspanning the circumference of a pendant breast can be posi-tioned manually from nipple to chest wall if multiple planesof NIR data are desired.
Experience has shown that significant improvement in thestability and accuracy of the reconstruction process can beobtained by incorporating prior anatomical information as aninput in the NIR parameter estimation problem.48,50–59 MRIpriors are implemented through the incorporation of a regu-larization matrix, which has a Laplacian filter shape within thesame tissue type, and effectively relaxes these smoothnessconstraints at the interface between different tissues, in direc-tions normal to their common boundary.50 This approach pro-vides an inherent smoothing of a given tissue type, such asadipose or glandular tissues, but allows the two tissue types tobe significantly different from one another. Based upon a se-ries of phantom studies, this approach, combined with directspectral reconstruction, has been shown to be the best esti-mate of the chromophore concentrations and scattering pa-rameters of these normal breast tissues. The values of A and bin these images were then used to generate images of effectivescatterer size and number density.
3 Results3.1 Empirical Equations for Estimation of �a� and NIn the imaging problem, the use of the empirical power func-
tions listed in Table 1 were ideal to map the reconstructedJournal of Biomedical Optics 041106-
images of scattering parameters onto the effective scatterersize and number density images. In all these studies, the sizedistribution function was assumed to be an exponentially de-creasing function, and their corresponding relative refractiveindexes were used. For the phantom study, n1=1.33, n2=1.47 were used,25 and for the cancer patient study, n1=1.36, n2=1.4 were used.22 For the MRI-NIR patient studies,where the tissues could be uniquely segmented between adi-pose and fibroglandular tissues, n1=1.36 and n2=1.4 wereused for the fibroglandular tissue, with the latter value beingtaken for bilipid membranes,22 while for the adipose tissues,n1=1.36 and n2=1.49 were used with the latter value beingthe measured value for the lipid.50 The corresponding empiri-cal equations for these three sets of refractive indexes wereestimated and the coefficients are shown in Table 1. The fit-ting figures for the n1=1.36, n2=1.4 set are shown in Fig. 1.
3.2 Phantom Study ResultsFigure 2�a� shows the diagram of the phantom, and 2�b�
Fig. 1 The relationship between scatter power, b, and effective scat-terer size, �a�, is shown in �a� for simulated data �points� and the bestfit polynomial curve �coefficients in Table 1�. The relationship be-tween effective normalized number density �the effective numberdensity when A=1� and scatter power is shown in �b� for the sameparameters, with the fitted polynomial curve shown �coefficients inTable 1�.
shows the reconstructed images for b �Scatt. Power� and A
July/August 2006 � Vol. 11�4�5

Wang et al.: Image reconstruction of effective Mie scattering parameters¼
�Scatt. Ampl.�, from the phantom with an inclusion of In-tralipid at concentration of 1.0%. From these two images andusing the empirical equations, the reconstructed images ofeffective scatterer size �Effec. Size� and number density�Num. Density� were obtained as shown in 2�b�.
The physical region of interest �ROI� was taken as the sizeof the hole, and the average value over the ROI was esti-mated. For example, for the phantom with an Intralipid con-centration of 1.0% in the inclusion, the effective scatterer sizeand number density average values in the ROI were 111 nmand 2.64�1014 m−3.
The summary values for each of the five phantom concen-
Fig. 2 In �a�, a diagram of the phantom geometry is shown, and inconcentration is shown. The background medium was a solid resin p
trations of Intralipid is shown in Fig. 3, with 3�a� showing the
Journal of Biomedical Optics 041106-
effective scatterer size. The circles indicate the results for thephantom data. The estimation results for the phantoms withdifferent intralipid concentrations were almost all the same,with an average value of 106 nm, which is shown by the solidline in Fig. 3�a�, and standard deviation was 4 nm. This resultagrees to within 9% of the expected value of 97±3 nm fromvan Staveren et al., as determined by electron microscopystudies in their paper.25
Figure 3�b� shows the result for the ratio of effective num-ber density to concentration, for varying concentrations of theIntralipid inclusion. The circles indicate the results, with the
a set of reconstructed images of the phantom with 1.0% Intralipidused in many previous studies �Refs. 46 and 62�.
�b�,hantom
ratio of N over concentration being nearly constant for these
July/August 2006 � Vol. 11�4�6

Wang et al.: Image reconstruction of effective Mie scattering parameters¼
phantoms, having average and standard deviation values of2.4�1016 m−3±0.7�1016 m−3, which are shown by thesolid line in Fig. 3�b�. Because these phantom results wereconsistent with what was expected, the approach was utilizedon human data, which is discussed in Sec. 3.3.
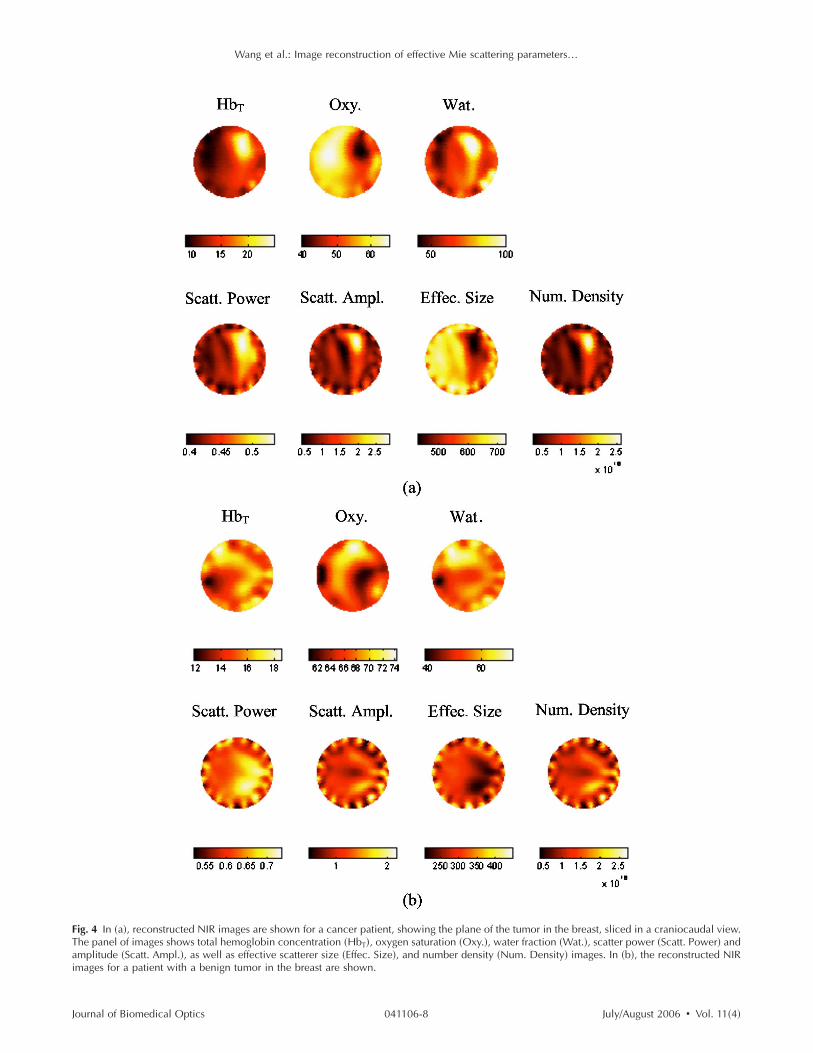
3.3 Patient Imaging Study ResultsFigure 4�a� is a representative image example from a patientwith an invasive ductal carcinoma tumor in the breast, show-ing an en face or craniocaudal slice of the breast as viewedtoward the patient. From our reconstruction, the hemoglobin�HbT�, oxygen saturation �Oxy.�, water fraction �Wat.�, scat-tering power �Scatt. Power�, and scattering amplitude �Scatt.Ampl.� images were recovered, and these are all shown inFig. 4�a� in the plane of the tumor. Using the two empiricalequations for n1=1.36, n2=1.4, the effective scatterer sizeand number density values were recovered at each pixel in theimage, using the images of the scattering power and scatteringamplitude. The resulting images are also shown in Fig. 4�a�.These images indicate that the cancer tissue has smaller effec-
Fig. 3 The results are shown for different intralipid concentrations of�a� average effective scatterer size, �a�, and �b� average effective num-ber density, N, using bulk values from within the inclusion region, asshown in Fig. 2.
tive scatterer size and larger effective number density than the
Journal of Biomedical Optics 041106-
background in this case. Figure 4�b� is a representative imageexample from a patient with a benign tumor in the breast.
The ROI value is the average over the tumor area. Theaverage value over the remaining breast tissue excluded thetumor ROI. The average value for the contralateral breast ROIwas estimated at the same mirror location as in the symptom-atic breast. Studies have shown that breast tissue is highlysymmetric between breasts, such that comparisons betweenROI values taken from mirror locations in the symptomaticand normal breasts are a good way to see differences from thenormal condition.
Figure 5 is the summary data for the patients, including thecancer patients and the benign tumor patients. Figures 5�a�and 5�b� show the average effective scatterer size and numberdensity values for the ROI, the background and contralateralbreast over all the cancer patients included in this study, aswell as the benign tumor patients. For the average effectivescatterer size in the ROI, the t-test value between of the can-cer patients and the benign patients is 0.025. The data in Figs.5�a� and 5�b� indicate that for the cancer patients, the ROI hassmaller effective scatterer size and larger effective numberdensity compared with both the background and the contralat-eral breast; while for the benign tumors, effective scatterersize and number density are all relatively close to that of thebackground and the contralateral breast values. But it needs tobe mentioned that there are too few cancer patients to obtain ageneric conclusion about tumors in this study. More patientswill be studied in the future to reach such a conclusion. Fig-ures 6�a� and 6�b� show the average difference over each kindof patient for effective scatterer size �a� and number densityN between the ROI and background and between the ROI andthe contralateral breast.
3.4 MRI-NIR Subject Study ResultsIn the final stage of examining the predictions for effectivescatterer size and number density values, the images recon-structed with combined MRI-NIR were used.62 The results fortwo MRI-NIR patients are shown in Figs. 7�a� and 7�b�. Fig-ure 7�a� �Region� is the MRI image for the first patient. Theinner part of the breast �darker in the image� is the fibroglan-dular tissue, and the outer part �gray in color� is the adipose orfatty tissue. The hemoglobin �HbT�, oxygen saturation �Oxy.�,water fraction �Wat.�, and scattering power �Scatt. Power� andamplitude �Scatt. Ampl.� images are shown in Fig. 7�a�. In theestimation of �a� and N images, separate values for n2 wereused for each of the two tissue types, as discussed in Sec. 2,and images of the breast interior were recovered. The esti-mated images for �a� �Effec. Size� and N �Num. Density� arealso shown in Fig. 7�a�. These images indicate that the fibro-glandular tissue has smaller effective scatterer size and largereffective number density than the fatty tissue. For the secondpatient, the same conclusion is obtained from these results.
In total, 10 sets of images from the MRI-NIR subjectswere used in this evaluation and the summary result for theseis shown in Fig. 8. The summary results show that the fibro-glandular tissue has smaller effective scatterer size and largereffective number density than the adipose tissue. For the av-erage effective scatterer size, the t test between of the fibro-glandular and adipose tissue showed a significant difference
with a p value of 0.048. For the number density, the t testJuly/August 2006 � Vol. 11�4�7
Wang et al.: Image reconstruction of effective Mie scattering parameters¼
Fig. 4 In �a�, reconstructed NIR images are shown for a cancer patient, showing the plane of the tumor in the breast, sliced in a craniocaudal view.The panel of images shows total hemoglobin concentration �HbT�, oxygen saturation �Oxy.�, water fraction �Wat.�, scatter power �Scatt. Power� andamplitude �Scatt. Ampl.�, as well as effective scatterer size �Effec. Size�, and number density �Num. Density� images. In �b�, the reconstructed NIR
images for a patient with a benign tumor in the breast are shown.Journal of Biomedical Optics July/August 2006 � Vol. 11�4�041106-8

Wang et al.: Image reconstruction of effective Mie scattering parameters¼
showed a significant difference between the fibroglandularand adipose tissue with a smaller p value of 0.004. Thus NIRtomography appears to be able to delineate fibroglandular tis-sue from fatty tissue more by the number density than by theaverage size.
4 DiscussionOverall, results in this paper indicate that by defining the scat-tering particle size and density distribution functions and as-suming values of refractive indexes, Mie theory could be usedto estimate images of bulk effective scatterer size and numberdensity. The estimates have been derived from bulk transportscattering measurements at six discrete wavelengths, 661,761, 785, 808, 826, and 849 nm, assuming the reduced scat-tering spectrum is smooth in shape across the wavelengthrange. The inherent assumptions in this approach are that thescattering particle size histogram of values is exponentiallyweighted to smaller size particles and that the index of refrac-tion can be expressed as a single pair of values inside andoutside of the particles. As shown in a previous paper,21
smaller particle sizes lead to similar reduced transport scatter-ing spectra with little oscillation, whereas particles above1 �m in size generate visible oscillations in the reduced scat-tering spectra as a function of wavelength. Thus, any smooth-ness assumption in scattering spectrum inherently limits theresults to estimating smaller scatterer sizes. The scattering
Fig. 5 The values for groups of subjects in terms of cancer and benignlesions are shown, for �a� average effective scatterer sizes and �b�average effective number density.
spectra currently reported for bulk breast tissue do not show a
Journal of Biomedical Optics 041106-
significant presence of oscillations as a function ofwavelength.6,41,43,60,61 While this observation could be an arti-fact of the data processing, it is also reasonable to assume thatthe dominant scattering particle sizes are less than 1 �m.When imaging cells with phase contrast microscopy, the totalbackscatter due to the cytoplasm is typically much more sig-nificant than the nucleus, indicating that intracellular struc-tures other than the nucleus are important determinants of thescattering spectra, leading to larger fractional oscillations inthe spectrum recovered.
In this work, it was assumed that the distribution of scat-tering particle sizes is exponentially weighted to smaller val-ues. The rationale for this comes from the observation that thelargest number of membrane-bound structures in tissue areconsiderably smaller than the nucleus. So although largerstructures, such as cell nuclei, typically 5 to 15 �m in diam-eter, are known to scatter light, the primary small scatteringcenters in tissue are thought to be the collagen fiber networkof the extracellular matrix, the mitochondria, and other intra-cellular entities with dimensions smaller than the opticalwavelengths.25 Nonetheless, this assumption is an unsatisfac-tory compromise, but one that is routinely employed in elasticscattering spectroscopy, and should be further studied. Yetgiven the difficulties in extracting subwavelength informationfrom samples, it is likely a problem without an easy solutionat this time in point.
Given these assumptions and limitations, a fitting proce-
Fig. 6 The relative differences in average region values are shown forcancer and benign lesions for �a� average effective scatterer sizes and�b� average effective number density.
dure is possible where the normalized scattering spectra are
July/August 2006 � Vol. 11�4�9

Wang et al.: Image reconstruction of effective Mie scattering parameters¼
Fig. 7 Reconstructed images for two of the MRI-NIR subjects �a,b� are shown, with the MRI image in �Region�, and hemoglobin �HbT�, oxygensaturation �Oxy.�, water fraction �Wat.�, scatter power �Scatt. Power�, and scatter amplitude �Scatt. Ampl.�. Estimates of �a� and N are shown in�Effec. Size� and �Num. Dens.�, as calculated from �Scatt. Power� and �Scatt. Ampl.�. Image �b� is predominantly fatty tissue �gray in MRI image�,
whereas �a� is predominantly fibroglandular tissue �darker in MRI image�.Journal of Biomedical Optics July/August 2006 � Vol. 11�4�041106-10

Wang et al.: Image reconstruction of effective Mie scattering parameters¼
used to estimate effective scatterer size first, and then effec-tive number density can be readily determined. In makingassumptions about the exponential shape of the histogram ofscattering particle sizes, and in restricting the data to a sparsenumber of wavelengths, there is inherent neglect of any oscil-latory spectral components that may be present. In addition, afurther assumption was made that n1=1.36 and n2=1.4, forthe refractive indexes with material 1 being cellular cytoplasmand fluid and material 2 being the bilipid membrane.
The Intralipid phantom study provided a reasonable wayfor image reconstruction of the effective scatterer size andnumber density, with a mean size value of 106 nm and stan-dard deviation of 4 nm �as seen in Fig. 3�. This result agreesto within 9% of the expected value of 97±3 nm, suggestingthat this method is accurate in this case.
In the patient study, for a cancer patient, the estimatedeffective scatterer sizes for tumor tissue and the backgroundnormal tissue were 535 nm and 603 nm. The estimated num-ber density for tumor tissue and the background normal tissuewere 12.4�1015 m−3 and 7.1�1015 m−3, respectively. It in-dicated that for the cancer tissues examined here, they hadsmaller effective scatterer size and larger effective numberdensity than the background normal tissue, on average. Forthe benign tumor patients, the estimated effective scatterersize for tumor and background normal tissue were 212 nmand 229 nm, respectively; the estimated effective numberdensity for tumor and background normal tissue were 11.0
15 −3 15 −3
Fig. 8 The average tissue values are shown pooled for all MRI-NIRsubject images, for effective scatterer size �a�, and number density �b�,for adipose and fibroglandular tissues.
�10 m and 10.9�10 m , respectively. For benign tu-
Journal of Biomedical Optics 041106-1
mors, there was not a significant difference between the tumortissue and the background normal tissue.
For the MRI-NIR subject study, the estimated effectivescatterer sizes for adipose and fibroglandular tissues were254 nm and 123 nm, respectively. The estimated effectivenumber density for adipose tissue and fibroglandular tissueswere 1.5�1015 m−3 and 10.7�1015 m−3, separately. This re-sult indicated that the fibroglandular tissue had smaller effec-tive scatterer size and larger effective number density than theadipose tissue, which agrees with the physiologically under-stood structure of adipose being larger lipid particles and fib-roglandular being a compound of smaller intracellular andextracellular structures.
One of the larger differences in this study, which is differ-ent from earlier Mie scattering estimation studies, is the esti-mate that the distribution of the scattering particle sizes inbreast tissue are exponentially weighted. This is not a com-mon assumption in other papers, yet our preliminary work inelectron microscopy verifies that this is indeed the case.63 Thisis also in agreement with the Intralipid results by van Staverenet al.25 Several other papers use a likelihood function10 ratherthan a pure exponential one, which has the problem of requir-ing more free parameters for the shape of the function, mak-ing the calculations even more problematic. Yet, the sizes ofparticles nearest zero have the least impact upon the scatteringspectrum, so the difference between a likelihood function anda pure exponential may be insignificant. Clearly, furtheranalysis of this assumption should be undertaken, and elec-tron microscopy studies to verify this have been completedand will be reported soon.
There are several ways potentially to improve the accuracyand precision of the effective scatterer size estimates reportedhere. The accuracy is likely to be increased by using a re-duced scattering coefficient spectrum over a wider range inthe spectrum and with more wavelengths. Simulation resultsindicate that the fitting algorithm improves with increasednumber of wavelengths; however, our current tomographysystem is limited to only six, although more will be added inthe near future. Another approach to improve the estimate isto measure the scattering particle size histogram specificallyby electronic microscopy, as was done explicitly for Intralipidin the paper by van Staveren et al.25 and given particle sizehistograms could be applied to different tissues individually ifthe system is used in MRI-guided mode. Other approachessuch as studying the angular scattering dependence of thinsamples may lead to similar information about the effectivescatterer size.9,16 A more accurate measurement of the rangeof changes observed in the refractive index could be used toimprove the estimation, as the refractive index change isclearly not just a single value, but is likely an entire range ofvalues that may or may not be correlated with the range ofparticle sizes.
5 ConclusionsIn summary, the patient results indicated that for a cancertissue, there was a difference in average effective scatterersize and number density between the cancer and normal tissueand that cancer tissue has smaller effective scatterer size andlarger effective number density. In benign tumor tissue, there
is no significant difference from the background tissue. TheJuly/August 2006 � Vol. 11�4�1

Wang et al.: Image reconstruction of effective Mie scattering parameters¼
MRI-NIR subject study indicated that the fibroglandular tis-sue has smaller effective scatterer size and larger effectivenumber density than the adipose tissue.
The method outlined in this paper provides a reasonableestimation of effective particle size and density for diffusetomography applications where there are limited numbers ofwavelengths. When there is an exponential distribution to thescattering particles in the smaller size ranges, Mie theory canbe used as a first order approximation of these parameters.Medical acceptance of images of particle size and numberdensity may be easier to gain acceptance than scattering am-plitude and power, due to the inherently clearer physicalmeaning of the words.
AcknowledgmentsThis research was supported by Grants No. PO1CA80139 andU54CA105480. The authors are very grateful to Adam Wax,Ph.D. �Duke University� for useful discussions about how toapproach the problem of fitting particle size and density se-quentially from a scattering coefficient data set.
References1. B. W. Pogue, S. Jiang, X. Song, S. Srinivasan, H. Dehghani, K. D.
Paulsen, T. D. Tosteson, C. Kogel, S. Soho, and S. Poplack, “Near-infrared scattering spectrum differences between benign and malig-nant breast tumors measured in vivo with diffuse tomography,” OSABiomedical Optics Topical Meetings, Technical Digest, p. ThB1.�2004�.
2. B. J. Tromberg, N. Shah, R. Lanning, A. Cerussi, J. Espinoza, T.Pham, L. Svaasand, and J. Butler, “Non-invasive in vivo character-ization of breast tumors using photon migration spectroscopy,” Neo-plasia 2�1-2�, 26–40 �2000�.
3. A. E. Cerussi, D. Jakubowski, N. Shah, F. Bevilacqua, R. Lanning, A.J. Berger, D. Hsiang, J. Butler, R. F. Holcombe, and B. J. Tromberg,“Spectroscopy enhances the information content of optical mammog-raphy,” J. Biomed. Opt. 7�1�, 60–71 �2002�.
4. B. W. Pogue, T. O. McBride, C. Nwaigwe, U. L. Osterberg, J. F.Dunn, and K. D. Paulsen, “Near-infrared diffuse tomography with apriori MRI structural information: testing a hybrid image reconstruc-tion methodology with functional imaging of the rat cranium,” Proc.SPIE 3597, 484–492 �1999�.
5. R. Srinivasan and M. Singh, “Laser backscattering and transillumi-nation imaging of human tissues and their equivalent phantoms,”IEEE Trans. Biomed. Eng. 50�6�, 724–730 �2003�.
6. R. Cubeddu, C. D’Andrea, A. Pifferi, P. Taroni, A. Torricelli, and G.Valentini, “Effects of the menstrual cycle on the red and near-infraredoptical properties of the human breast,” Photochem. Photobiol. 72�3�,383–391 �2000�.
7. S. Fantini, M. A. Francecshini, G. Gaida, E. Gratton, H. Jess, W. W.Mantulin, K. T. Moesta, P. M. Schlag, and M. Kaschke, “Frequency-domain optical mammography: edge effect corrections,” Med. Phys.23, 149–157 �1996�.
8. V. Ntziachristos, A. G. Yodh, M. D. Schnall, and B. Chance, “MRI-guided diffuse optical spectroscopy of malignant and benign breastlesions,” Neoplasia 4�4�, 347–354 �2002�.
9. J. R. Mourant, T. M. Johnson, and J. P. Freyer, “Characterizing mam-malian cells and cell phantoms by polarized backscattering fiberopticmeasurements,” Appl. Opt. 40�28�, 5114–5123 �2001�.
10. V. Backman, V. Gopal, M. Kalashnikov, K. Badizadegan, R. Gurjar,A. Wax, I. Georgakoudi, M. Mueller, C. W. Boone, R. R. Dasari, andM. S. Feld, “Measuring cellular structure at submicrometer scale withlight scattering spectroscopy,” IEEE J. Sel. Top. Quantum Electron.7�6�, 887–893 �2001�.
11. L. T. Perelman, V. Backman, M. Wallace, G. Zonios, R. Manoharan,A. Nusrat, S. Shields, M. Seiler, C. Lima, T. Hamano, I. Itzkan, J.Van Dam, J. M. Crawford, and M. S. Feld, “Observation of periodicfine structure in reflectance from biological tissue: a new techniquefor measuring nuclear size distribution,” Phys. Rev. Lett. 80�3�, 627
�1998�.Journal of Biomedical Optics 041106-1
12. A. Wax, C. Yang, V. Backman, K. Badizadegan, C. W. Boone, R. R.Dasari, and M. S. Feld, “Cellular organization and substructure mea-sured using angle-resolved low-coherence interferometry,” Biophys.J. 82, 2256–2264 �2002�.
13. R. Graaff, J. G. Aarnoudse, J. R. Zijp, P. M. A. Sloot, F. F. M. de Mul,J. Greve, and M. H. Koelink, “Reduced light-scattering properties formixtures of spherical particles: a simple approximation derived fromMie calculations,” Appl. Opt. 31�10�, 1370–1376 �1992�.
14. H. K. Roy, Y. Liu, R. K. Wali, Y. L. Kim, A. K. Kromine, M. J.Goldberg, and V. Backman, “Four-dimensional elastic light-scatteringfingerprints as preneoplastic markers in the rat model of colon car-cinogenesis,” Gastroenterology 126�4�, 1071–1081 �2004�.
15. I. J. Bigio, S. G. Bown, G. Briggs, C. Kelley, S. Lakhani, D. Pickard,P. M. Ripley, I. G. Rose, and C. Saunders, “Diagnosis of breast can-cer using elastic-scattering spectroscopy: preliminary clinical re-sults,” J. Biomed. Opt. 5�2�, 221–228 �2000�.
16. A. Wax, C. Yang, V. Backman, M. Kalashnikov, R. R. Dasari, and M.S. Feld, “Determination of particle size by using the angular distri-bution of backscattered light as measured with low-coherence inter-ferometry,” J. Opt. Soc. Am. A 19�4�, 737–744 �2002�.
17. A. M. K. Nilsson, C. Sturesson, D. L. Liu, and S. Andersson-Engels,“Changes in spectral shape of tissue optical properties in conjunctionwith laser-induced thermotherapy,” Appl. Opt. 37�7�, 1256–1272�1998�.
18. B. Gelebart, E. Tinet, J. M. Tualle, and S. Avrillier, “Phase functionsimulation in tissue phantoms: a fractal approach,” Pure Appl. Opt.5�4�, 377–388 �1996�.
19. J. M. Schmitt and G. Kumar, “Optical scattering properties of softtissue: a discrete particle model,” Appl. Opt. 37�13�, 2788–2797�1998�.
20. R. K. Wang, “Modelling optical properties of soft tissue by fractaldistribution of scatterers,” J. Mod. Opt. 47�1�, 103–120 �2000�.
21. X. Wang, B. W. Pogue, S. Jiang, X. Song, K. D. Paulsen, C. Kogel, S.P. Poplack, and W. A. Wells, “Approximation of Mie scattering pa-rameters in near-infrared tomography of normal breast tissue invivo,” J. Biomed. Opt. 10�5�, 051704 �2005�.
22. R. Drezek, A. Dunn, and R. Richards-Kortum, “Light scattering fromcells: finite-difference time-domain simulations and goniometricmeasurements,” Appl. Opt. 38�16�, 3651 �1999�.
23. H. Liu, B. Beauvoit, M. Kimura, and B. Chance, “Dependence oftissue optical properties on solute-induced changes in refractive indexand osmolarity,” J. Biomed. Opt. 1, 200–211 �1996�.
24. B. Chance, Q. Luo, S. Nioka, D. C. Alsop, and J. A. Detre, “Opticalinvestigations of physiology: a study of intrinsic and extrinsic bio-medical contrast,” Philos. Trans. R. Soc. London, Ser. B 352, 707–716 �1997�.
25. H. J. van Staveren, C. J. M. Moes, J. van Marle, S. A. Prahl, and M.J. C. van Gemert, “Light scattering in intralipid-10% in the wave-length range of 400–1100 nm,” Appl. Opt. 30�31�, 4507–4514�1991�.
26. C. F. Borhen and D. R. Huffman, Absorption and Scattering of Lightby Small Particles, John Wiley & Sons, Inc. �1998�.
27. H. C. van de Hulst, Light Scattering by Small Particles, New York:Dover Publications, Inc. �1981�.
28. V. Backman, R. Gurjar, L. T. Perelman, V. Gopal, M. Kalashnikov,K. Badizadegan, A. Wax, I. Georgakoudi, M. Mueller, C. W. Boone,I. Itzkan, R. R. Dasari, and M. S. Feld, “Imaging and measurement ofcell structure and organization with submicron accuracy using lightscattering spectroscopy,” Proc. SPIE 4613, 101–110 �2002�.
29. J. R. Mourant, J. P. Freyer, A. H. Hielscher, A. A. Eick, D. Shen, andT. M. Johnson, “Mechanisms of light scattering from biological cellsrelevant to noninvasive optical-tissue diagnostics,” Appl. Opt. 37�16�,3586–3593 �1998�.
30. H. B. Jiang, “Subcellular sizing with polarized light spectroscopy,”Opt. Commun. 226�1-6�, 279–283 �2003�.
31. A. H. Hielscher, J. R. Mourant, and I. J. Bigio, “Influence of particlesize and concentration on the diffuse backscattering of polarized lightfrom tissue phantoms and biological cell suspensions,” Appl. Opt.36�1�, 125–135 �1997�.
32. A. Wax, C. Yang, M. G. Muller, R. Nines, C. W. Boone, V. E. Steele,G. D. Stoner, R. R. Dasari, and M. S. Feld, “In situ detection ofneoplastic transformation and chemopreventive effects in rat esopha-gus epithelium using angle-resolved low-coherence interferometry,”
Cancer Res. 63, 3556–3559 �2003�.July/August 2006 � Vol. 11�4�2

Wang et al.: Image reconstruction of effective Mie scattering parameters¼
33. H. B. Jiang, “Frequency-domain fluorescent diffusion tomography: afinite-element-based algorithm and simulations,” Appl. Opt. 37�22�,5337–5343 �1998�.
34. H. B. Jiang, G. Marquez, and L. V. Wang, “Determination of particlesize distribution in concentrated suspensions: Photon migration ap-proach,” OSA Trends Opt. Photonics Ser. 21, 92 �1998�.
35. B. J. Tromberg, O. Coquoz, J. B. Fishkin, T. Pham, E. R. Anderson,J. Butler, M. Cahn, J. D. Gross, V. Venugopalan, and D. Pham, “Non-invasive measurements of breast tissue optical properties usingfrequency-domain photon migration,” Philos. Trans. R. Soc. London,Ser. B 352, 661–668 �1997�.
36. T. Durduran, R. Choe, J. P. Culver, L. Zubkov, M. J. Holboke, J.Giammarco, B. Chance, and A. G. Yodh, “Bulk optical properties ofhealthy female breast tissue,” Phys. Med. Biol. 47�16�, 2847–2861�2002�.
37. B. W. Pogue, S. P. Poplack, T. O. McBride, W. A. Wells, K. S.Osterman, U. L. Osterberg, and K. D. Paulsen, “Quantitative hemo-globin tomography with diffuse near-infrared spectroscopy: Pilot re-sults in the breast,” Radiology 218�1�, 261–266 �2001�.
38. S. P. Poplack, K. D. Paulsen, A. Hartov, P. M. Meaney, B. W. Pogue,A. N. Tosteson, M. R. Grove, S. K. Soho, and W. A. Wells, “Elec-tromagnetic breast imaging: Average tissue property values in womenwith negative clinical findings,” Can. J. Neurol. Sci. 231, 571–580�2004�.
39. K. Blyschak, M. Simick, R. Jong, and L. Lilge, “Classification ofbreast tissue density by optical transillumination spectroscopy: opti-cal and physiological effects governing predictive value,” Proc. SPIE5260, 568–579 �2003�.
40. S. Srinivasan, B. W. Pogue, S. Jiang, H. Dehghani, C. Kogel, S.Soho, J. G. Chambers, T. D. Tosteson, S. P. Poplack, and K. D.Paulsen, “Interpreting hemoglobin and water concentration, oxygensaturation, and scattering measured by near-infrared tomography ofnormal breast in vivo,” Proc. Natl. Acad. Sci. U.S.A., 100�21�,12349–12354 �2003�.
41. A. E. Cerussi, A. J. Berger, F. Bevilacqua, N. Shah, D. Jakubowski, J.Butler, R. F. Holcombe, and B. J. Tromberg, “Sources of absorptionand scattering contrast for near-infrared optical mammography �com-ment�,” Acad. Radiol. 8�3�, 211–218 �2001�.
42. J. R. Mourant, T. Fuselier, J. Boyer, T. M. Johnson, and I. J. Bigio,“Predictions and measurements of scattering and absorption overbroad wavelength ranges in tissue phantoms,” Appl. Opt. 36�4�, 949–957 �1997�.
43. F. Bevilacqua, A. J. Berger, A. E. Cerussi, D. Jakubowski, and B. J.Tromberg, “Broadband absorption spectroscopy in turbid media bycombined frequency-domain and steady-state methods,” Appl. Opt.39�34�, 6498–6510 �2000�.
44. S. Jiang, B. W. Pogue, T. O. McBride, M. M. Doyley, S. P. Poplack,and K. D. Paulsen, “Near-infrared breast tomography calibration withoptoelastic tissue simulating phantoms,” J. Electron. Imaging 12�4�,613–620 �2003�.
45. S. Srinivasan, B. W. Pogue, S. Jiang, H. Dehghani, and K. D.Paulsen, “Spectrally constrained chromophore and scattering NIR to-mography improves quantification and robustness of reconstruction,”Appl. Opt. 44�10�, 1858–1869 �2004�.
46. S. Srinivasan, B. W. Pogue, B. Brooksby, S. Jiang, H. Dehghani, C.Kogel, W. A. Wells, S. P. Poplack, and K. D. Paulsen, “Near-infraredcharacterization of breast tumors in-vivo using spectrally-constrainedreconstruction,” Technol. Cancer Res. Treat. 4, 513-526 �2005�.
47. B. Brooksby, S. Srinivasan, S. Jiang, H. Dehghani, B. W. Pogue, K.D. Paulsen, J. Weaver, C. Kogel, and S. P. Poplack, “Spectral-prior
Journal of Biomedical Optics 041106-1
information improves near-infrared diffuse tomography more thanspatial-prior,” Opt. Lett. 30�15�, 1968–1970 �2005�.
48. B. Brooksby, S. Jiang, H. Dehghani, C. Kogel, M. Doyley, J. B.Weaver, S. P. Poplack, B. W. Pogue, and K. D. Paulsen, “Magneticresonance-guided near-infrared tomography of the breast,” Rev. Sci.Instrum. 75�12�, 5262-5270 �2004�.
49. B. Brooksby, “Combined near-infrared tomography and MRI to im-prove breast tissue chromophore and scattering assessment,” PhDthesis, Dartmouth College, Hanover, N.H. �2005�.
50. B. Brooksby, S. Jiang, H. Dehghani, B. W. Pogue, K. D. Paulsen, J.B. Weaver, C. Kogel, and S. P. Poplack, “Combining near infraredtomography and magnetic resonance imaging to study in vivo breasttissue: implementation of a Laplacian-type regularization to incorpo-rate MR structure,” J. Biomed. Opt. 10�5�, 050504 �2005�.
51. R. L. Barbour, H. L. Graber, J. Chang, S. S. Barbour, P. C. Koo, andR. Aronson, “MRI-guided optical tomography: prospects and compu-tation for a new imaging method,” IEEE Comput. Sci. Eng. 2, 63–77�1995�.
52. A. Borsic, W. R. B. Lionheart, and C. N. McLeod, “Generation ofanisotropic-smoothness regularization filters for EIT,” IEEE Trans.Med. Imaging 21, 579–588 �2002�.
53. X. Intes, C. Maloux, M. Guven, T. Yazici, and B. Chance, “Diffuseoptical tomography with physiological and spatial a priori con-straints,” Phys. Med. Biol. 49, 155–163 �2004�.
54. J. P. Kaipio, V. Kolehmainen, M. Vauhkonen, and E. Somersalo,“Construction of nonstandard smoothness priors,” Inverse Probl. 15,713–729 �1999�.
55. B. Kanmani and R. M. Vasu, “Diffuse optical tomography using in-tensity measurements and the a priori acquired regions of interest:theory and simulations,” Phys. Med. Biol. 50, 247–264 �2005�.
56. A. Li, E. L. Miller, M. E. Kilmer, T. J. Brukilaccio, T. Chaves, J.Stott, Q. Zhang, T. Wu, M. Choriton, R. H. Moore, D. B. Kopans, andD. A. Boas, “Tomographic optical breast imaging guided by three-dimensional mammography,” Appl. Opt. 42, 5181–5190 �2003�.
57. B. W. Pogue and K. D. Paulsen, “High resolution near infrared to-mographic imaging simulations of rat cranium using a priori MRIstructural information,” Opt. Lett. 23, 1716 �1998�.
58. M. Schweiger and S. R. Arridge, “Optical tomographic reconstruc-tion in a complex head model using a priori boundary information,”Phys. Med. Biol. 44, 2703–2721 �1999�.
59. M. Vauhkonen, D. Vadasz, J. P. Kaipio, E. Somersalo, and P. A.Karjalainen, “Tikhonov regularization and prior information in elec-trical impedance tomography,” IEEE Trans. Med. Imaging 17, 285–293 �1998�.
60. A. Amelink, M. P. L. Bard, S. A. Burgers, and H. J. C. M. Steren-borg, “Single-scattering spectroscopy for the endoscopic analysis ofparticle size in superficial layers of turbid media,” Appl. Opt. 42�19�,4095–4101 �2003�.
61. B. Beauvoit, H. Liu, K. Kang, P. D. Kaplan, M. Miwa, and B.Chance, “Characterization of absorption and scattering properties forvarious yeast strains by time-resolved spectroscopy,” Cell Biophys.23�1-3�, 91–109 �1993�.
62. B. Brooksby, S. Srinivasan, S. Jiang, H. Dehghani, B. W. Pogue, andK. D. Paulsen, “Spectral priors improve near-infrared diffuse tomog-raphy more than spatial priors,” Opt. Lett. 30�15�, 1968–1970 �2005�.
63. M. Bartek, X. Wang, W. A. Wells, K. D. Paulsen, and B. W. Pogue,“Estimation of subcellular particle size histograms with electron mi-croscopy for prediction of optical scattering in breast tissue,” J.Biomed. Opt. 11, �2006� �in press�.
July/August 2006 � Vol. 11�4�3