image motivation and the willingness to pay for...
TRANSCRIPT

Image Motivation and the Willingness to Pay forPreventative Health Care Products: The Impact of
Conformity and Status SeekingFor newest version please click here
Salma Khalid*
January 9, 2017
Abstract
Using data from a randomized field experiment in the setting of community groups in ruralPakistan, I investigate whether increasing the visibility of an individual’s choices to their peergroup affects their willingness to pay for water treatment products. I find evidence in favorof greater conformity with group behavior in public, with randomization into public biddingincreasing the odds of individuals bidding closer to their expectations regarding the averagegroup bid. The intersection of preferences for conformity with low expectations regardingthe average willingness to pay for the product results in lower bids in public than private.However, bidders who express no expectations regarding group behavior have higher bidswhen randomized into public bidding, in line with status seeking in the absence of motivesto conform. The strength of social motivations is driven by the level of contamination inthe environment, with strong conformity and status seeking patterns in villages with abovemedian contamination levels. Priming bidders with the salience of health externalities andthe negative spillovers from poor individual investment in preventative health care resultsin higher bids in public. This is congruous with greater status seeking when the pro-socialsignaling value of individual behavior is increased, highlighting the importance of framingin eliciting socially desirable behavior. When self-selection into bidding environments ispermitted, I find an overall preference for keeping bids private, and greater status seekingbehavior among bidders who select into public bidding.
Keywords: social influence, conformity, norms, prosocial behavior, waterquality, revealed preference, field experiments
JEL: D7, C9, I1, O12
*Department of Economics, University of Michigan: [email protected] am grateful to the World Bank South Asian Food and Nutrition Security Initiative (SAFANSI) for funding andthe National Rural Support Program (NRSP) Pakistan, for implementation and administrative support
1

1 Introduction
The current empirical literature on peer effects demonstrates that social networks can influence a
diverse set of individual choices, ranging from saving (Duflo and Saez, 2002) to investment (Hong,
Kubik and Stein, 2004) and technology adoption (Bandiera and Rasul, 2006; Conley and Udry,
2001). In particular, we have compelling evidence for peer networks facilitating the take up of
a variety of health technologies such as deworming pills (Miguel and Kremer, 2004), insecticide
treated bed nets (Dupas, 2014) and menstrual cups (Oster and Thronton, 2011). However, the role
attributed to peer networks in this literature is limited to one of information diffusion and learning
facilitation. Evidence from the lab and field on altruistic behavior and public good contributions
demonstrates that social networks can also be powerful catalysts for socially desirable behavior
by triggering image motivation, or the desire to seek approval from others. Yet, the presence or
strength of these motivations in influencing decision making over health remains unexplored, in
spite of the enduring problem of low spending on preventative health care and steep demand curves
at positive prices.
In this paper I utilize a large field experiment in rural Pakistan to test for the presence of image
motivation in the willingness to purchase a preventative health care product - chlorine tablets for
Point of Use (POU) drinking water treatment. Image motivation is the tendency of individual
behavior to be affected by the perception of others, the impact of which is inherently tied to
how visible individual behavior is to their social reference group (Ariely et al., 2009). I outline a
basic model that incorporates image motivation in an individual’s utility function as arising from
a desire for status seeking and conformity. Status seeking is achieved by differentiating yourself
from the average group behavior and conformity is achieved by aligning yourself more closely with
the group. The model demonstrates that for a person whose individual optimum lies below their
expectation of the group average, conformity and status seeking coincide to drive their demand
up towards the group average. However, for a person whose individual optimum lies above the
group average, conformity pressures will lower their willingness to pay while status seeking will
operate to increase it. The model therefore yields testable hypotheses on how visibility can affect
willingness to pay for a product, which I proceed to apply in an empirical setting.
2

I engineer the sale of our POU chlorine tablets in the setting of pre-existing community groups
in the sample villages and randomize whether an individual’s maximum willingness to pay for
the product is private or is revealed to their group, in order to assess whether economic behavior
changes when image motivation is an added consideration in the decision process.
The setting for my experiment has the essential components of a population that is organized
into community groups(COs) where the impacts of image motivation can be tested; the need for
investment in drinking water treatment methods owing to widespread contamination of drinking
water; and a drinking water treatment product that is unavailable in the local marketplace and
can therefore be sold exclusively through the meetings of the community groups. The social groups
utilized are endogenously formed and have a history of repeated interaction, which yields greater
weight to social signaling than if these groups were randomly generated and had no history of
association. The mechanism used for demand elicitation - the Becker DeGroot Marschack (BDM)
auction- has been tested in a similar population of low numeracy and shown consistent results
(Berry et al., 2015).
Randomization at the level of the individual ensures that the treatment effect is driven only
by changes in bidding environment from private to public and not other unobserved, correlated
variables at the group level. The comparison of public and private bidders provides estimates of
the impact of visibility of actions on behavior. Decisions are made simultaneously and without
consultation to eliminate learning or sequential herding effects. In addition, all individuals are
given a uniform information treatment prior to the randomization, in order to reduce variance in
the level of knowledge among group members.
I collect individual beliefs regarding the average bid at the group level prior to randomization
assignment. As such, my measure of conformity is with respect to the descriptive norm − what
other individuals are doing − as opposed to the injunctive norm − what people ought to be doing.
Therefore, my experiment speaks to the literature on the impact of beliefs regarding the descriptive
norm and not the literature on injunctive norms. Moreover, my experiment is a one-shot game.
Therefore, there is no updating of individual beliefs before the bidding is completed. Hence, unlike
other experiments that provide information regarding the descriptive norm, I collect individual
3
beliefs regarding the norm and assess how randomization affects individual behavior relative to
these exogenously held beliefs.
I find that the overall treatment effect of making bids visible is zero and insignificant. Looking
at result by beliefs regarding group behavior, I find that bidders who are bidding in public have
significantly smaller disparity between their bid and their expectations regarding the average bid
in the group, suggesting greater conformity in public. In addition, public bidding results in a
significantly higher probability of bidders placing bids which are equal to their expectation of the
average group bid. This effect is driven by the portion of the bidding distribution where bidders
are bidding in excess of their expectations regarding the average group bid, and therefore manifests
itself as a reduction in bids in public towards the expectation of group behavior. This effect is also
heterogeneous across the distribution, deriving primarily from bidders who are already bidding
closer to their expectation regarding the group bid. On the other hand, bidders who have no
beliefs regarding group behavior bid higher in public than private, which is consistent with pure
status seeking behavior in the absence of conformity influences.
Social motivation effects are stronger when contamination rates are higher. Hence, both conformity
and status seeking appear to be stronger motivators in high contamination environments relative
to low contamination environments where the effects are muted and insignificant, suggesting that
the role of social motivations is mediated by the severity of the problem being addressed and
therefore the value of the social signal generated from remedial action.
I also test for whether information regarding health spillovers interacts with the impact of social
motivation. I randomize some groups into receiving an additional information message which
highlights the negative externalities attendant on the community from individual failure to adopt
better health behaviors owing to the parasitic and infectious nature of gastrointestinal diseases.
I find that the dampening effect of conformity on bidding behavior is reversed in public when
bidders are randomized into the externalities treatment. Consequently, priming bidders on the
externalities of their health behaviors results in bidders bidding higher in public than in private.
This can be attributable to stronger status seeking behavior when the pro-social value of the signal
4

is higher, which operates to counteract conformity influences which dominate when such priming
of pro-social value is not done.
Given evidence in the psychology literature indicating differences between genders in their willing-
ness and propensity to conform, I test whether men and women behave differently with respect
to the treatment. I find that in mixed groups men are less likely to demonstrate conformity pat-
terns than women, in line with expectations from existing work investigating gender differences in
conformism. However, the evidence from all-male and all-female groups is less conclusive.
A third and simultaneous treatment arm tests the impact of allowing self-selection of bidding
environment. This arm allows me to intuit the impact of sorting and self-selection on treatment
effects, which is conceivably more representative of long run outcomes where experimental control
is weakened. Here I find that over 60% of bidders would prefer to bid in private. Moreover, once
self-selection is allowed, conformity trends disappear in public and standard image motivation
results emerge of higher bids in public. Hence, the choice of mechanism appears to impact the
type of social motivations that will evolve in equilibrium. However, the current design does not
allow me to make any claims as to whether the mechanism itself alters preferences over conformity
and status seeking, or whether the results are driven by the sorting of conformists into private
bidding and status seekers into public bidding.
This paper contributes to the growing literature on using behavioral incentives that appeal to social
considerations and social norms to direct individual behavior in directions that conform with goals
of public policy. Hence, social norms have been leveraged to increase individual voting (Gerber and
Rogers, 2009), environmental conservation (Goldstein, Cialdini and Griskevicius, 2008), electricity
conservation (Allcott, 2011).
This papers is unique insofar as it is the first field experiment to investigate social norms and
pro-social motivations in health settings and health care purchase decisions, in a literature derived
primarily from applications to public goods and altruistic behavior. Insofar as health care ex-
penditures in developing country settings have large spillovers, I test whether the same pro-social
motivations that increase altruism and public good contributions in public can also be leveraged to
5
increase the willingness to pay for preventative health care. As such, my research question bears
closest resemblance to the application of social norms to conservation behavior and the emerging
literature on conspicuous conservation (Griskevicius et al., 2010) where individuals bear higher
costs or compromise on the quality of consumption choices in order to derive greater status from
appearing more ’green’. I apply this concept to test whether people will be willing to pay more
for health from a desire to seek status from their actions.
The existing literature on social influences affecting health-seeking behavior, while small, also
shows weak treatment effects overall. Bronchetti et al. (2015) test whether peer endorsement
of flu vaccination in college campuses results in an increase in vaccine take-up and find no effect
on take up margin for a very large sample of over 9000 observations. They do, however, find
evidence that peer endorsement increases the likelihood of students opening emails that contain
health information. However, their setting is one that may activate a sense of obligation to social
norms but does not alter the visibility of follow through and therefore does not activate the social
pressure channels I seek to investigate.
My work also shares similarities with the Guiteras et al. (2016), where messaging regarding shame
and disgust at being seen consuming dirty water is exploited in an attempt to increase usage of
POU chlorine and test willingness to pay for a community level chlorine dispenser. While they
find little to no treatment effects, they attribute this to low levels of social cohesion in the sample
communities, where people placed little regard on the behavior of others even though behaviors
were visible. In addition, because their chlorine product was communal, the elicitation of clean
demand estimates is further complicated by problems of group coordination and free-riding that
may arise with shared commodities. My setting, on the other hand, uses endogenously formed
peer groups which have a long history of repeated interaction where reputation concerns are more
salient. My focus is also on the salience of visibility of actions to generating demand for an under
subscribed behavior, owing to reputational concerns, and not on the role of messaging.
In addition, this paper relates to the literature on the use of groups motivators to improve incen-
tives for individually beneficial behavior. Hence, studies on incentivizing under subscribed health
behaviors such as exercising (Babcock et al., 2015) and cognitive exercises among the elderly to
6
improve mental health (Schofield et al. 2015) find that group based incentives out perform indi-
vidual incentives and people appear to value rewards to team members greater than rewards to
themselves. This work provides additional evidence on another feature of social groups, image
motivation derived from visibility of individual behavior, which can also be leveraged to influence
individual behavior towards socially desirable outcomes. In doing so, it helps build a case for the
use of groups as treatment units in public health settings where externalities abound and there
is consequently greater motivation to exercise other-regarding behavior when you also possess
pro-social preferences and an opportunity to signal these preferences in public.
2 Current Literature
2.1 Image Motivation
The claim that people alter their behavior when under public scrutiny relies on the theory of
preference signaling whereby if underlying preferences are unobservable, actions are used as signals
for an individual’s true preferences over socially desirable characteristics. As a result, visible actions
confer status or prestige if they reflect society’s definition of good behavior.
Literature indicates that people’s behavior in public can reflect a desire to both stand out and to
fit in. Bernheim (1994) models individual utility as deriving from intrinsic preferences as well as
a desire for status, which is decreasing in deviation from the social norm. Such norm compliance
or conformity has been attributed to information influence and normative influence. In the former
case, people seek to resolve ambiguity and uncertainty most efficiently by using the decisional
shortcut of registering what others are doing − the descriptive norm − and imitating the actions
of the group (Cialdini, Reno and Kallgren, 1990). In the latter case, conformity is triggered by
a desire to gain greater affiliation with the group, generate social approval and avoid sanction
(Griskevicius et al., 2006).
The power of social norms to influence behavior has been investigated in a range of domains from
littering to recycling, conservation and tax evasion. Chen et al. (2010) find that in an online
7

community of movie reviewers when members are exposed to the descriptive contribution norm,
below mean contributors increase their contributions but above mean contributors decrease their
level of contributions. Schultz et al. (2007) find a similar boomerang effect in electricity conser-
vation where the revelation of average consumption statistics results in an increase in electricity
consumption among below mean consumers. Social norm interventions targeting binge drinking
among college students similarly find that interventions that reveal the prevalence of binge drinking
tend to increase drinking among non-regular binge drinkers while reducing drinking among binge
drinkers (Werch et al., 2000).
However, the costly signaling theory of pro-social behavior leans on the premise that when in-
dividuals have preferences over the beliefs of others regarding themselves, signaling yourself as a
better type yields greater reward in social interactions - from being more desirable as a friend or
partner, to eliciting greater trust and increasing the likelihood of being assigned to positions of
power and authority (Griskevicius, 2010). As such, the greater the investment in costly signaling,
the stronger the signal of not only pro-social preferences but also the resources to incur the cost
of public welfare. In such a framework, the desire to stand out would dominate the desire to fit
in, with economic choices being driven by status seeking over conformity.
This has been borne out in the domain of charitable contributions and contribution to public
goods, where we find evidence of a more uniformly positive impact of image motivation. Ariely,
Bracha and Meier (2009) show that people expend more effort for a pro-social cause when their
actions are visible, in a lab setting. Andreoni and Petrie (2004) demonstrate that contributions to
public goods are also increasing in the visibility of contributor decisions, and Hoffman et al. (1996)
show that giving is smallest in dictator games which are double blind, so that dictator behavior is
not known to anyone including the experimenter. Similarly, in a large field experiment on door-
to-door fundraising, DellaVigna List and Malmendier (2012) find that social pressure is a stronger
motivator for charitable giving than altruism, owing to significant numbers of givers opting out of
the interaction with solicitors if provided with a low-cost method for doing so. Moreover, social
pressure has been shown to be effective in voter mobilization, with social pressure messaging which
reveals the voting records of voters to everyone in their neighborhood increases voter turnout by
8
3-8% points, relative to the 0.5% increase effected by typical direct mail messaging that doesn’t
involve the use of social pressure. (Panagopoulos, 2010).
This motive of status signaling is evidently tapped into by charities when they publicly announce
contributions (Ariely et al., 2009), blood donation agencies when they offer public awards (Karlan
and McConnell, 2014), and firefighter organization when they offer vanity plates to volunteer
(Carpenter and Myers, 2010). However, while there is sufficient evidence for the ability of status
motives to draw individual behavior towards socially desirable outcomes, there are few attempts
being made towards activating these motives as a policy instrument for improving individually
sub-optimal behavior.
Also lacking is an analysis of how conformity to social norms can mediate signaling behavior in
public, which creates non-linearities in individual response to costly signaling. Hence, conformity
can drive behavior in an opposing direction to that predicted by simple status signaling. Zafar
(2011) provides some evidence of this interaction when he finds that in a sequential decision mak-
ing setting, while visibility of choices increases overall contributions in a charitable contributions
game, receiving information on a lower contribution norm leads to a reduction in contributions,
particularly in settings where participants are more likely to know one another. Consequently, I
model individual choice in public arising from both a desire to conform and a desire to seek status.
2.2 Low spending on Preventative Health Care
Preventative health care is a domain of economic decision making that suffers from gross underin-
vestment by individuals, even when marginal benefits to increasing expenditures is very high from
an individual and social perspective. This problem is particularly acute in the developing countries
where the disease burden is incident at a significantly younger age and the infectious and parasitic
nature of diseases produces large health externalities.
Drinking contaminated water is the leading cause of diarrheal and gastrointestinal diseases which
claim the lives of 1.6 million children each year (Ahuja et al., 2010). In addition to their mortality
impact, repeated episodes of diarrhea at a young age lead to stunting and wasting and lack of
9
cognitive development which has severe implications for human capital accumulation and labor
market returns. Moreover, repeated exposure to fecal pathogens can irreversibly affect the absorp-
tive capacity of the intestinal tract of adults and children, even when there are no overt symptoms
of morbidity. (Guiteras et al., 2016)
Diarrhea transmission occurs through the fecal-oral route, with the majority of infections spread-
ing through feces-contaminated water. Given the unimproved nature of sanitation and drainage
in developing countries, unsafe disposal of human waste exacerbates the potential for negative
externalities from individual cases of infection. Consequently, the social benefits from providing
greater protection against diarrheal diseases outstrips individual benefits.
Randomized controlled trials of Point of Use (POU) drinking water treatment indicate that with
take-up rates on the order of 70 percent, POU treatment products can reduce childhood diarrhea by
20-40% (Kremer et al., 2011). However, even amongst populations with high knowledge regarding
water borne disease transmission, the willingness to pay for POU water treatment products is low
and demand curves for the products are precipitously steep at positive prices. Hence, Kremer et
al. (2011) find that despite 30% of their sample professing to prior experience with the POU water
treatment product and 95% professing favorable views of the product, demand/utilization of the
product falls from 80% to 10% when going from a full subsidy to a 50% subsidy, with no significant
change in demand between a 50% subsidy and full price. The demand is also not higher amongst
households with young children, who stand to benefit the most from water treatment.
Given the low cost of chlorine, POU water treatment using chlorine products is a highly cost-
effective solution to diarrheal disease reduction. However, free provision of chlorine is not a sus-
tainable solution in many settings. Therefore, we would like to assess the channels by which we can
improve the willingness to pay for POU chlorine water treatment products. An appeal to image
motivations is an aspect of demand for health care that remains, to date, unexplored. I extend
the application of image motivation to the realm of decision making over health expenditures and
test the impact of increasing the visibility of purchase decision making on willingness to pay for
water treatment products in a peer group setting.
10

3 Behavioral Hypotheses
Consider a simple model where an individual’s utility is additively separable in: (a) consumption
of a status good, x; (b) consumption of all other goods/wealth, y; and (c) social approval, S.
U = u(x) + u(y) + αs ∗ S
where αs is the weight put on social utility. We model image motivation along the lines of Ak-
erlof (1997) where social utility can be generated from a status seeking or a conformity. As per
the status seeking model, an individual’s utility is diminishing in the distance they fall behind
their reference group’s consumption of the status good. The conformist model dictates that the
individual minimize the social distance between themselves and others in their reference group.
Hence I define social approval, S, as:
S = S0 + v[−βc(x− x̄)2 − βs(x̄− x)]
where βc is the weight placed on conformity and βs is the weight placed on status seeking; x̄ is the
average group behavior; v is a visibility parameter indicating how visible an individual’s actions
are to their reference group.
Assuming an interior optimum, I can solve for the optimal x∗:
u′(x∗) + αsv[−2βc(x∗ − x̄) + βs] = 0
which gives us the comparative statics:
δx/δv = αs
u′′(x∗)[2βc(x
∗ − x̄) − βs]
Hence, the impact of increasing visibility of actions is inextricably related to the direction and
distance of an individual from the group average.
Status seeking motivations decrease utility when you fall below the group average and increase
utility as positive distance from the group increases, i.e. you out perform the group. Utility from
conformity, however, is derived from decreasing the distance between yourself and the average group
11

member. Hence, for people whose individual optima lie below the group average, the direction of
status seeking and conformity motivations both operate to increase bids in an equilibrium with
greater visibility. However, for people whose individual optimum lies above the group average, the
motivations derived from status seeking and conformity are at odds with one another. The desire
to conform will drive such people to lower their optimum in public, whereas the desire for status
seeking will increase their desire to raise their optimal consumption of the status good.
In our setting, therefore, for people who are bidding below their expectations regarding average
group behavior, we will be unable to disentangle the effects of status seeking from conformity.
However, for bidders bidding above their expectation regarding the average group bid, an increase
in bids in public can only be reconciled with stronger status seeking than conformity and a decrease
in bids in public implies stronger conformity influences and weaker status seeking motivations.
These effects are moderated by the strength of conformity motivations, βc, and the strength of
status seeking motivations, βc. Moreover, the overall impact of social motivations depends on
the weight placed on social utility, αs. Given that the theoretical and empirical foundation for
status seeking is derived from the literature on pro-social behavior, we can hypothesize that an
exogenous increase in how pro-social a behavior is deemed will result in a stronger impetus to
derive status from engaging in the behavior (tantamount to an increase in βs). Hence, for ex-
ample, highlighting the salience of health spillovers will theoretically result in an increase in the
perception of individual choice having pro-social implications, resulting in a higher propensity for
individual’s to incorporate status seeking motivations in their behavior. Similarly, we can expect
the strength of social motivations (αs) to also be mediated by the degree of contamination in the
environment. Hence, in low contamination environments, the value of signaling by way of invest-
ment in water treatment technology may be smaller than in environments characterized by high
levels of contamination where health seeking behaviors are viewed as more important.
We turn to empirical data to shed light on how these different motivations operate in our particular
setting.
12

4 Empirical Framework
4.1 Local Context
The experiment is conducted in 69 villages drawn from 3 districts in rural Pakistan. I collaborate
with a local NGO, the National Rural Support Program, which has coordinated community mo-
bilization activities in these villages for the past several years. The study districts are subdivided
into 4 Social Mobilization Teams (SMTs) - aggregations of spatially proximate villages employed
by the NRSP to organize community mobilization activities.
Our study villages are ideal for studying the impact of image motivation in group settings since
they were organized by the NRSP into endogenously formed community groups which have been
conducting group meetings over the course of the past 6 years. Hence, they have a history of
interaction in a group setting. In addition, the mobilization effort was undertaken as part of a
prior field experiment that required for at least 60% of the village population to be organized
into community groups. Hence, group composition is more generalizable to the ordinary village
populace than if these groups had smaller coverage and therefore participation engendered stronger
selection effects. Moreover, since the prior mobilization work had no direct relation with health
care, any selection that may have taken place can be assumed as orthogonal to the health behaviors
being studied.
Water testing conducted in 2013 on a sample of households in these villages revealed the presence
of E coli at points of source (40% at the median across the full sample) and storage (80% at
the median across the full sample). Household surveys indicated, however, that a mere 3% of
respondents reported treating their water in any way to make it safer to drink. Boiling was the
method by which most households treated their drinking water, owing to a lack of alternate water
treatment technologies in the rural marketplace.
4.2 Product Choice
The water treatment product introduced to these communities is chlorine tablets for Point of Use
(POU) drinking water treatment. This choice was motivated by household survey data which
13

indicates that the vast majority of household drinking water sources are individual or shared, with
very few instances of community level water sources. Therefore, community level water treatment
products that have shown great promise in recent literature (Kremer et al. 2011) are unsuitable
for our field setting.
Chlorine products are also superior to filtration methods and boiling since they provide resid-
ual protection from recontamination which is important in rural environments with low levels of
sanitation and overall hygiene and therefore high likelihood of recontamination post-treatment.
Aquatabs, our product of choice, are imported and distributed by a local supplier but they are
currently unavailable in the rural marketplace. Therefore, our experimental setting also has the
unique feature that we are the sole suppliers of the product being auctioned and therefore the
only point of access to water treatment products for the vast majority of households who do not
have access to large urban centers where competing products may be procured. Therefore, their
purchasing decisions in the experimental setting are not influenced by access to close substitutes
outside of the experimental environment.
4.3 Demand Elicitation mechanism
I utilize a Becker DeGroot Marschak (BDM) mechanism to elicit individual level willingness to
pay for the product. This is a widely used mechanism for eliciting individual valuations over a
good or experience, that has been tested by Berry et al. (2015) in a comparable field setting with a
population having low numeracy, and shown results consistent with the standard Take it or Leave
it offer method for demand estimation. In this mechanism, participants are told regarding the
range of offer prices and asked what their maximum willingness to pay is, given the possible set of
prices. The price is then determined randomly. If the price drawn is larger than the reservation
price stated by the respondent, they are unable to purchase the product. Conversely, if the price
drawn is lesser than the reservation price, the respondent has to purchase the product at the price
that they drew. Therefore, the mechanism ensures that respondent’s dominant strategy is to reveal
their true maximum willingness to pay for the product. (Mazar et al. 2010)
14

The mechanism is incentive compatible for expected utility maximizers. However, it may depend
on the price distribution amongst people who do not maximize expected utility. However, Mazar et
al (2010) show that using a titration-based modified BDM procedure that elicits willingness to pay
for the entire sequence of available prices nearly eliminates sensitivity to the price distribution. We
therefore use a similar titration-based procedure where willingness to pay for each possible price
draw is elicited.
4.4 Implementation
My experimental sample comprises 322 independent community groups. However, in order to
ensure minimum meeting size, smaller groups were combined with spatially proximate groups
to yield 219 meetings, varying in size from a minimum of 5 participants to a maximum of 30
participants per meeting. The groups may be single gender (all-male or all-female) or of mixed
gender composition.
Upon arrival to the meeting, participants are divided into one of the three treatment arms, by being
assigned cards belonging to one of three colors which are visibly displayed on their person. However,
the nature of randomization is not yet revealed. All participants participate in an information
session that highlights the levels of water contamination found in their drinking water during tests
conducted in 2013, possible sources of contamination and common water borne illnesses and their
impacts. They are subsequently introduced to the auction product Aquatabs and provided with
instructions on how to correctly use the product, and exercise safe storage of drinking water once
it has been treated. Participants are then given a taste test of the product.
Next, the participants are trained in the BDM bidding mechanism. The enumerator describes
the BDM procedure, placing emphasis on the dominant strategy being the revelation of true
willingness to pay. It is also emphasized that increasing bids raises probability of being able to
purchase the product while lowering bids lowers this probability, but that the final price paid is
randomly determined. Respondents are told they can only bid once and cannot revise bids once
the price has been drawn. They are also told that they must purchase the product if the price
drawn is lower than their bid.
15

The enumerators use soap to conduct a practice round of the auction with a volunteer participant
from the meeting. The practice auction using soap is implemented in full view of all participants
to ensure their proper understanding.
The participants are then fielded a short survey which tests each individual for their understand-
ing of the bidding mechanism and collects some basic information regarding prevalent practices
regarding illness and water treatment. The respondents are asked a battery of questions to test
their comprehension of the bidding mechanism. The questions deal with the change in probability
of winning the product if an individual bid is raised or lowered, respectively, and the outcome of a
hypothetical bid and price draw. Each of these questions is asked twice, employing different num-
bers for bids/prices. If a respondent answers incorrectly the first time, the enumerator explains
the bidding mechanism again and asks them the question again with a different set of prices/bids.
If they still answer incorrectly, the correct answer is explained to them a second time and they
are allowed to proceed but their incorrect response is recorded. This allows us to record which
participants likely submitted bids with incomplete comprehension of the bidding mechanism.
Once the survey has been completed, participants are told regarding their treatment assignment.
Once treatment assignment is revealed, silence is ensured in the meeting while bids are collected
individually in a separate enclosure.
The range of possible prices for the product are set between Rs. 60 and Rs. 150, reflecting a 75%
to 37.5% discount on the market price of the product (Rs. 240). The participant is asked whether
they are willing to pay each possible price between Rs. 60 and Rs. 150 in Rs. 10 increments. If
they are unwilling to purchase the product at Rs. 60, they are asked what minimum price between
Rs. 0 and Rs. 60 they would be willing to pay. If they are willing to purchase the product at
Rs. 150, they are additionally asked for the maximum they would be willing to pay between Rs.
150 and Rs. 240. The maximum willingness to pay, hence elicited, comprises the final bid of the
participants.
16

4.5 Treatments
Public treatment: Participants assigned to the public arm are told that once all the bids have
been collected, their bid will be announced to other members of their meeting.
Private treatment: Participants assigned to the private arm are told that their bid will not be
revealed to other members of their meeting.
Self-Selection treatment: Participants assigned to the self-selection arm are told that they have
the choice of whether to keep their bids private or public. If they choose private their bids are not
revealed at the end of the meeting, and vice versa.
The instructions regarding assignment to public vs. private treatment are revealed publicly during
the meeting. The instructions to the self-selection arm are only revealed during direct interaction
with the enumerator and not revealed to the general meeting participants. However, their decision
regarding whether to bid privately or publicly can be backed out at the end of the meeting based
on whether their bid is revealed or not.
I also introduce an overlaid randomization that varies whether bidders are primed regarding the
negative health spillovers on friends and neighbors of a failure to invests in preventative health
care at the individual level. By priming individuals on health externalities, we seek to increase
how pro-social individual actions are perceived by highlighting that their benefits accrue not only
to the individual but to the larger community as well. This externalities treatment is randomized
at the village level to prevent information spillover between group within a village.
4.6 Randomization
I employ a between-subject design with randomization at the individual level, within meetings.
For each day of the week, enumerators are provided with a randomization list by which to make
the assignment, so that randomization is not systematic but still ensures balance of assignment as
much as possible within each meeting. (See Appendix A5 for sample randomization list). Hence,
the order by which participants arrive at the meeting determines the treatment arm to which they
17

are assigned but the order by which treatment arms are assigned is itself random by day of week.
In addition, the assignment of groups (meetings) to the experiment was itself randomized from
a larger sample space of 652 meetings. The randomization was stratified by SMT and gender
composition of meeting.
Selection arises in show up to the meeting on the date of the study, since not all members of each
community group participate on the day of the meeting. However, this does not affect the internal
validity of the randomization.
Table A1 shows the summary statistics between the three randomization arms. There is balance
across all the variables except for education, with bidders in the private arm having slightly lower
education on average than in the public and opt arms. Consequently, I employ a small set of
demographic controls in all our regression specifications to account for these differences between
groups, and to improve the precision of our estimates.
In addition, looking at the unconditional distribution of bids in the data in Figure 1, we can see
that there are strong shifts in the distribution by SMT. Therefore, I employ SMT fixed effects
in the majority of our specifications to reduce noise in our estimates (unless otherwise noted).
Finally, I cluster standard errors at the meeting level to account for correlated unobservable in our
error term.
4.7 Norm Elicitation
Prior to the revelation of the randomization arms and the randomization assignment, participants
are asked regarding their expectations of the average bid placed by other participants in the
meeting. We use this measure as a proxy for the respondents beliefs regarding the social norm
governing the product. As such, our measure of norms is a reflection of beliefs regarding the
descriptive norm - what people are doing - as opposed to the injunctive norm - what people ought
to be doing.
Since our norm elicitation precedes the revelation of randomization, it precludes any strategic
considerations that may vary by treatment randomization. As demonsstrated in Figure 4, the
18

distribution of expectations regarding the average bid in the group is invariant between the two
treatment arms. In addition, Figure 3 demonstrates that the expectations regarding the average
group bid are also fairly invariant across the bidding distribution, suggesting the presence of a
somewhat stable norm across the sample, regardless of the actual bid placed.
In addition, a subsample of our respondents profess to having no expectation regarding the average
bid in the group - our NoNorm subsample. As shown in Table A1, this subgroup is roughly 20%
of the total sample and is also uniformly distributed between treatment arms. Our randomization
therefore ensures that there are no systematic differences between individuals with NoNorm who
are assigned to different treatment arms, and we can assess treatment effects on this subsample as
well.
5 Results
5.1 Public vs. Private bidding (No self-selection):
Performing non-parametric rank-sum tests (MWW), we can compare bid distributions between
different treatment arms. Comparing the subsample of bids falling in the public and private
treatment arms only, we are unable to reject the null hypothesis of equality of distributions (z=
-0.285, p= 0.7758).
Table 1 utilizes a regression framework to explore our findings. We estimate the following:
MWTPim = α + β1Publicim +Xim + fe+ εim
where MWTPim is the maximum willingness to pay of individual i in meeting m, as reflected in
their BDM bid; Publicim is an indicator for whether the individual was randomized into the public
bidding arm; Xim is a vector of individual level controls including gender, age, household size,
number children in household, and poverty score; fe is fixed effects, which vary by specification;
and, εim is an error term which is clustered at the meeting level.
19

Looking at the overall effect of randomization into the public arm, relative to the private arm,
I find small and statistically insignificant coefficients across all fixed effect specifications. While
imprecisely estimated, the coefficients are very small relative to the mean value of the dependent
variable. We can conclude, therefore, that the average treatment effect of making bidding behavior
visible is negligible.
Since the simple linear regression specification only compares conditional means across the distri-
bution, I employ a quantile regression in Table 2 to investigate how the treatment effects differ
by their location on the distribution of bids. I discover that the tail end of the bid distribution is
affected by the public treatment, with a very large positive coefficient on the public treatment arm
for the tenth quantile which is statistically significant at the 10% level. The coefficient represents
nearly 50% of the mean bid in this quantile, suggesting very strong treatment effects but on a very
small portion of the bid distribution.
5.2 Treatment Effects by Beliefs Regarding Group Behavior: Confor-
mity and Status Seeking
In order to evaluate the effects of conformity and status seeking on bidding behavior we must also
incorporate the bidders’ beliefs regarding the bidding distribution into our empirical specification.
Figure 2 plots the distribution of the actual bids relative to the distribution of beliefs regarding
the average group bid. Visual inspection suggests that the distribution of beliefs deviates from the
distribution of actual bidding behavior. Using a Wilcoxon signed rank sum test, I confirm that
there is a statistically significant difference in theses distributions, with the beliefs distribution
having a lower rank overall. We can anticipate, therefore, that since expectations regarding bidding
behavior are more pessimistic than the behavior itself, if conformists tendencies exist they will tend
to bias bids downwards owing to poorer beliefs than actual behavior.
20

5.2.1 Conformity to Beliefs regarding Group Behavior
In order to investigate the effects of conformity by treatment assignment, I construct a variable
that measures the difference between an individual’s bid and their belief regarding the average
group bid (BidNorm). DevNorm therefore measures how far bidders are willing to deviate from
their perception of the descriptive norm.
DevNormim = MWTPim −BidNormim.
Figure 5 plots the distribution of DevNorm by treatment arms of public and private bidders. We
can see from this figure that while the distributions appear identical at the tails, the median of the
public bids distribution is shifted towards the left of the median for the private bids distribution,
and appears more centered around zero.
In Table 3 I test the difference in DevNorm by treatment assignment across the full sample.
DevNormim = α + β1Publicim +Xim + fe+ εim
I find a negative but weak and statistically insignificant reduction in DevNorm when bids are
public. However, this specification only captures the treatment effect at the conditional mean.
Consequently, in Table 4 I employ a simultaneous quantile regression to estimate the treatment
effect for different deciles of the distribution of DevNorm.
As Table 4 reveals, there is a strong and statistically significant tendency to revise bids towards
expectations regarding the average bid in the 30th, 40th and 50th quartiles when bids are made
publicly, with effects persisting into the 60th quartile but with larger standard errors. All these
quartiles coincide with positive deviations from the BidNorm and therefore indicate that for bid-
ders bidding above their perception of the average group bid, public revelation drives their bids
downwards in the direction of their belief regarding group behavior. As per the comparative statics
of our model, since these bidders are bidding above their beliefs regarding the group average, their
reduction in bids is consistent with a preference for conformity in public.
The treatment effect sizes in Table 4 range from 80% reduction in difference from the norm for
bidders who were already close to the average, to 16% for bidders in the 60th percentile who are
21
bidding farthest from their expectations regarding the average bid. Figure 5 provides a visual
representation of our results by plotting the treatment effect coefficients from our specification in
Table 4 by decile. We can observe a consistent trend in favor of conformity in the middle of the
distribution. Hence, the tendency towards conformity is diminishing as the difference from average
bid increases, with the largest effects being seen amongst people who are bidding more closely to
their expectations regarding group behavior at the outset. This would appear intuitive since these
bidders are already locating themselves in the vicinity of group behavior and visibility serves to
make this motivation stronger.
In Table 5, I divide the sample into 3 groups: bidders who bid above their expectations regarding
group behavior (Above Norm); bidders who bid at their expectation of group behavior (At Norm);
and bidders who bid below their expectation of group behavior (Below Norm). We present a simple
tabulation of bidders with prior beliefs against treatment assignment to public bidding to see if
treatment assignment shifts the distribution of bidders between the groups of ’Above Norm’, ’At
Norm’ or ’Below Norm’, which is a margin not clearly captured in our earlier specification. We find
that the vast majority of bidders are bidding above their beliefs regarding average group behavior.
However, assignment to public bidding results in a 5% reduction in bidders who are bidding above
their expectations regarding group behavior, with bidders redistributing themselves on the norm
or below it.
We examine this effect in a regression framework by employing a probit model to assess the impact
that public revelation of bids has on the odds of bidding above the norm, with the inclusion of our
controls and fixed effects. Table 6 shows our results. The negative coefficient on ’Public’ indicates
the randomization into public bidding results in a statistically significantly lower likelihood of
bidding higher than your belief regarding the descriptive norm, in concordance with our results
from Table 4. In addition, the likelihood of bidding at ’At Norm’ increases significantly in public,
with a smaller increase in the likelihood of bidding below the norm.
Together, these results provide strong evidence in favor of the presence of conformity in the ran-
domized sample. Moreover, given that the conformity results are driven by bidders who are bidding
above their expectations regarding the average bid, these results cannot be reconciled with a pure
22

status seeking model which would lead the bidders to bid higher in public and therefore increase
the difference between individual bids and the average bid.
However, it is also clear that the impact of conformity is not uniform across all bidders, and is
concentrated amongst bidders who are already bidding in the vicinity of their beliefs regarding
group behavior. Hence the utility from conformity cannot be rationalized into a simple squared
loss function specification and recognizing individual differences in preferences for conformity −
as captured by the βc parameter in our model − is important. It is also important to note that
existing literature on norm compliance finds that individuals exercise conformity to group norms
when such norms are revealed to them even when their own actions are unobservable. Hence,
our measure of conformity is a lower bound for the overall influence of conformity on individual
behavior. Therefore, among high valuation bidders who are bidding well in excess of their beliefs
regarding group behavior we cannot discount the possibility that even though conformity effects
are not visible, this is owing to opposing status seeking effects and not as a result of weak or no
conformity.
5.2.2 Status Seeking
Given that overall treatment effects were roughly zero, there must be some portion of the sample
that is not revising their bids downwards in public. We assess bidding patterns for our excluded
sub-sample: individuals who express no prior beliefs regarding group behavior in the bidding
process and can plausibly be used to estimate what would occur in the absence of conformity
effects. We estimate:
MWTPim = α + β1Publicim + β2NoNormim + β3Public ∗NoNormim +Xim + fe+ εim
where NoNorm is an indicator for whether the bidder expressed no prior belief over the bidding
behavior of his meeting group and therefore β3 indicates the effect of visibility of bids on bidders
who have no prior beliefs regarding average group behavior.
Table 7 shows the results of this specification. We find that bidders who express no beliefs regarding
group behavior have lower bids overall, but significantly higher bids in public than in private. This
23

result further supports our model’s claims that in the absence of conformity effects, the effect
of visibility on bidding should be unconditionally positive owing to a desire for status seeking.
However, given that bidders possessing no beliefs regarding group behavior have lower bids on
average, this would suggest that the average effect of conformity is to drive higher bidding behavior
overall, but to reduce positive deviations from the norm in public.
5.2.3 Norm Definition
While there is a large body of existing research in psychology that tests for the effects of norms on
individual behavior, some in this tradition would argue that self-reported norms are problematic
and that norm elicitation should be incentivized to remove all possibility of bias from misreporting.
Krupka and Weber (2013) suggest an incentive compatible mechanism for norm elicitation where
the individual respondent is incentivized to provide a norm that is closest to the actual prevailing
social norm. This method would theoretically provide greater external validity to the measurement
of the social norm. However, Vesely (2015) tests the difference between norms elicited with and
without incentivization and finds that the two methods are statistically equivalent and yield the
same results.
My design is robust to these concerns insofar as our norm elicitation occurs before the revelation
of the study randomization. In fact, the participants have no knowledge regarding the purpose
of the study besides the sale of chlorine products at the point at which norms are elicited. The
nature of randomization and the randomization assignment occur after the norm elicitation and
therefore cannot bias our results in a manner which is consistent with the treatment assignment and
would therefore compromise internal validity. This is moreover clear from Figure 4, which plots
the distribution of norms between the two treatment arms and shows that they are identically
distributed. Therefore, our results cannot be driven by any differences arising from the norm
elicitation process which is internally valid.
Moreover, the process of incentivizing norm elicitation has been proposed for the case of injunctive
norms which inquire into the nature of what ’ought to be done’ and not descriptive norms that
are utilized here. We address this concern in greater detail in the robustness section.
24
5.3 Channels: Water Contamination Rates
During the information session bidders are also provided with rates of prevalence of source and
storage water contamination at the village level. We can therefore analyze whether the degree of
contamination in the environment mediates the behavioral responses of individuals to our experi-
mental treatments. We should expect for this information to have an effect on individual behavior
insofar as the degree to which social utility can be derived from individual behavior is crucially
tied to whether society deems the action as favorable. Hence, in high contamination environments
it is likely that individual actions bear larger social utility rewards than in a low contamination
environment where individual preventative action is not deemed as crucial.
Given the very high level of correlation between contamination at source and storage (correlation
coefficient of 0.73), and the smaller variance in degree of contamination at the level of storage,
I utilize the level of contamination at source in my estimation strategy. I distinguish high con-
tamination villages as having higher than median levels of contamination at source and analyze
individual bidding behavior between the subsamples. In Table A6 we can see that high contamina-
tion villages do differ from low contamination villages, so defined, along other parameters namely
number of household members, education level of the bidders and poverty rates. However, merely
taking SMT level fixed effects renders these differences statistically insignificant and we therefore
employ SMT level fixed effects in our analysis, as in our other specifications, to control for the
effects of these stable underlying differences.
Table 8 (columns 1 & 2) revisits our base specification for the effect of high contamination envi-
ronments on the level of bids in public relative to private at the conditional mean, and shows small
and insignificant effects on overall bid levels.In columns 3 and 4, we analyze the treatment effect
on deviation from beliefs regarding group behavior and find a large and statistically significant
reduction of bids towards the group bid among bidders who belong to high contamination environ-
ments, with no such pattern in low contamination environment when estimated at the conditional
mean. This reduction in bids towards the expectation of group behavior is nearly 40 percent of
the mean difference between individual bids and beliefs regarding the group bid, suggesting strong
conformity influences in high contamination environments.
25

In Table 9 we assess how these conformity influences vary across the distribution of bidders in
high and low contamination environments. As the coefficients indicate, there are significant re-
ductions in public bids relative to private bids throughout the distribution in high contamination
villages, in line with conformity, whereas low contamination settings appear to no similar demon-
stration of conformity in public. This is verified by our probit specification with strong evidence
in favor of higher bidding at the norm in high contamination environments and no parallel in low
contamination environments.
Finally, we assess whether there are differences in status seeking in our subsample of bidders with-
out beliefs regarding group behavior. Table 11 reveals that while the individual coefficients are
imprecisely estimated, the impact of public bidding on bidders with no beliefs regarding group be-
havior is more positive in high contamination settings that in low contamination settings. However,
the standard errors on these estimates are too large to be conclusive.
It would appear, therefore, that communities with higher levels of contamination have a stronger
tendency to converge towards group equilibria and potentially a stronger tendency to demonstrate
status effects in the absence of conformity. Consequently, we can surmise that the strength of
social motivations is mediated by the underlying demand environment, and people are less likely
to exhibit social utility from conformity if the behavior is not deemed imperative. Conversely, the
negative utility from being non-conformist in an environment where individual costs and benefits
are more uniformly distributed is larger and therefore people are more likely to conform when
contamination rates are uniformly higher than when they are low and therefore incident asymmet-
rically across the population. However, the impact of the demand environment on status signaling
is not as clear cut, with imprecise coefficients owing to small sample sizes.
5.4 Channels: Salience of Externalities
An additional layer of randomization that I introduced at the village level involved the salience
of externalities to the decision process. While the recognition of health externalities is fairly
high across the sample (roughly 88% of the sample acknowledge that their actions affect health
outcomes of others or that other’s actions affect their health outcomes), in only half of the villages
26

the information campaign included a section highlighting the importance of health externalities
in the group meeting. Therefore, this arm allows us to investigate whether the priming bidders
regarding health externalities has an impact on bidding behavior in public relative to private.
In order to prevent information spillover between groups and contamination of the randomization
assignment, the randomization of externalities messaging was done at village level and not the
group level. Table A7 shows that randomization at this level does not achieve balance between the
treated and the untreated, with significant differences emerging in the two groups in the level of
contamination in the environment and the gender mix of the bidders. I therefore control for these
differences in my analysis to ensure that they are no driving my results, while acknowledging that
my identification at this level may not be completely robust to the effects of unknown covariates.
I add linear controls to my regressions for contamination at source and storage and for the gender
mix of the community group and take other steps to ensure robustness of my results as elaborated
below. In addition, given that the visibility randomization is conducted at an individual level,
comparing public and private bidders within villages exposed to the externalities treatment though
compromising external validity is still internally valid.
Columns 1 and 2 of Table 12 evaluate our base specification of the impact of externalities mes-
saging on the overall bid level. We can see that the coefficient on public bidding in villages with
externalities messaging is positive but statistically insignificant when controls are added. However,
a Wald test comparing the impact of public bidding on bidders with and without externalities mes-
saging reveals a weakly statistically significant differences at the 10% level (F stat of 2.84, p value:
0.09). In columns 3 and 4 we analyze the impact of externalities messaging on conformity. The
coefficients are imprecisely estimated but suggest departures between the two treatment types,
after controlling for differences in contamination and gender mix.
In Table 13 we find that looking at the differences in bidding behavior across the bidding distri-
bution, externalities do appear to be driving positive departures from the beliefs regarding group
behavior while environments with no externalities messaging are demonstrating conformity by re-
ducing the difference between public bids and beliefs regarding the average group bid. A Wald test
finds significant differences between public bidding with and without externalities priming in 40th,
27

50th and 60th percentiles of the distribution. The differences in public and private bidding within
villages with externalities priming show a similar pattern but are imprecisely measured and not
statistically significantly disparate. While this specification contains linear controls for contami-
nation at source and storage and gender mix of meeting group, I additionally control for whether
the bidder lies in a high contamination village and for the interaction of high contamination and
public bidding and for the interaction of mixed gender groups and public bidding which are the
two potential sources of confounding effects (table not shown). Figure 8 plots both the coefficients
from the regression with and without the interacted controls and shows that the patterns are not
being driven by contamination as the coefficients remain virtually stable in the villages with the
externalities treatment and are positive for the vast range of the bidding distribution but with
large standard errors.
Table 14 shows similarly that the tendency to bid above the norm is not weakened in villages with
externalities messaging, as occurs in villages without. There is a significantly higher probability of
bidding on the beliefs regarding the norm in externality villages but from our bidding distribution
we can see that this is being driven by bidders in the lower portion of the distribution raising their
bids in public as opposed to the conformity trend in the full sample of higher valuation bidders
lowering their bids.
Combined, these results point to a lack of conformity amongst individuals who are exposed to the
externalities priming message and vote in public. I argue that such priming effectively translates
into an increase in the pro-social value of individual behavior, owing to the added consideration of
health spillovers on the greater community. As a result, the relative contribution of status seeking
to the image motivation equation rises, and bids are not driven down in public from conformity.
The empirical evidence appears to bear out my theoretical stance and I find greater status seeking
behavior as individuals increase the disparity between their bids and their expectations of average
behavior in the group, leading to an overall increase in bids in public with externalities priming
relative to without where the mean effect was (insignificantly) negative.
28

5.5 Heterogeneous Effects: By Gender & Gender Composition of Ref-
erence Group
Studies in psychology indicate that while there isn’t complete consensus on gender differences
in conformity, in all studies where men and women’s responses to social influences diverge, it is
women who systematically exhibit greater conformity than men. Furthermore, women are likely
to conform more when they are aware that their opinions will be shared publicly (Eagly, Wood
and Fishbaugh(1981) and Eagly and Chrvala (1986)). Santee and Jackson (1982) demonstrate
that this arises from different evaluative processes between men and women, whereby women favor
conformity over dissent as it relates to their self-identity.
There is significant heterogeneity in the gender composition of our meeting groups, with some
groups being single gender and others having a mixed gender composition, which allows us to
investigate whether there are different gender responses to our social motivators of conformity and
status seeking. However, since group composition is endogenously determined, these results are
illustrative but should not be interpreted as causal.
We look at the impact of public bidding on the disparity between individual bids and perceptions
regarding the group average in Table 15. We find extremely large negative coefficients across most
percentiles for all women groups, but they are imprecisely estimated owing to small sample size for
this subgroup. On the other hand, the same coefficients among all male groups are considerably
smaller except in the largest quantiles. Figure 9 plots these coefficients. Finally, separating the
trends for men and women in mixed meetings, we find very small and insignificant coefficients
for men in mixed meetings, but large and statistically significant negative coefficients across the
majority of percentiles of the distribution for women (Figure 10). Consequently, we may conclude
that women are more likely to bid closer to their expectations of group behavior than men in public
when in a mixed gender environment. Single gender environments yield more ambiguous results
of both men and women demonstrating conformity over some range of the bidding distribution.
In addition, Table 16 indicates that women in all-female groups and women in mixed groups
display a lower likelihood of bidding above the norm in public - a tendency that is nearly absent in
29

all-male groups and weaker among males in mixed group settings. However, these coefficients are
not precisely estimated. Finally, in Table 17, we find that men in all-male meetings who have no
priors about group behavior are significantly likely to raise their bids in public, in line with status
seeking in the absence of countervailing conformity motivations. Women in all female meetings
do not show this effect, wheres as women and men in mixed meeting bid higher in public but the
treatment response is more muted than for men in all-male meetings.
These patterns indicate that our data does support the literature indicating women exercise greater
conformity than men and are more likely to bid closer to the descriptive norm when their actions
are observable, though this result is derived from mixed gender settings and not from single gender
settings where men also display conformity across some range of the bidding distribution. There
is also evidence for men exercising greater status seeking in all-male environments from the sub-
sample that has no prior beliefs over group behavior. However, these results are suggestive and
not causally identified owing to endogenous group formation.
5.6 Public vs. Private bidding (Self-selection arm):
Our third treatment arm allows us to assess how social motivations operate when people are allowed
to self-select their bidding environment. This is an important outcome insofar as it is the closest
approximation of a unregulated equilibrium which will conceivably emerge when product purchase
does not occur in a controlled environment. Hence, when there are alternate channels by which to
procure the product, as would be the case if this product was available in the local market place,
we would likely see a self-selection equilibrium emerge in group setting.
The ability to self-select into private or public bidding reveals that there is an overall utility gain
from bidding in private with 61% of the self-selection sample choosing to keep their bids private.
Table 18 parses out the impact of sorting on each arm opting into private versus opting into
public, in an extension of our base regression specification:
MWTPim = α + β1Publicim + β2Opt ∗ Privateim + β3Opt ∗ Publicim +Xim + fe+ εim
30

Here, we see clearly the impact of sorting on maximum willingness to pay as elicited by the BDM
bid. While random assignment to public bidding doesn’t result in a change in public bids relative
to private bids overall, self-selection into private bidding results in a reduction in the level of private
bids relative to randomly assigned private bids. Moreover, self-selection into public bidding results
in a substantial increase in the level of public bids, relative to random assignment to public/private
bids, such that the disparity of bids between public and private bidding with self-selection is large.
It is important to recognize that these results can emerge from a simple sorting of bidders with
higher valuations into public bidding and lower valuations into private bidding. Or it may be the
case that the choice mechanism itself affects bidders’ underlying valuations. Our data does not
allow up to make any predictions about which possibility is driving our results.
In Table 19, we apply our conformity specification to the self-selection sample and find that there
is no evidence for conformity among the subset of the sample that chooses to bid in public.
Hence, while bidders randomized into public bidding are lowering their bids in public towards
their conception of the social norm, those selecting into public bidding are raising their bids in
public and deviating from the social norm across the majority of the deciles. Therefore, we argue
that conformity influences diminish when self-selection is allowed. However, our design does not
allow us to distinguish whether this occurs as a result of conformists sorting out of public or
whether the same individuals tap into different motivations to order their behavior when the
mechanism is altered or high valuation types are inclined to bid in public. However, it does reveal
a potential mechanism for eliciting higher bids in public and therefore generating more positive
beliefs regarding average group behavior, since self-selection into public bidding results in a higher
average bid level in public.
5.7 Robustness
I test an arguably more exogenous definition of the descriptive norm in our data by using the
median expectation regarding the average group bid at the village level as a measure of the social
norm, as opposed to using the self-reported measure.
In Table A2 (Figure 12) I test our conformity specification using this alternate definition of the
31

norm. The coefficients are attenuated owing to measurement error but show the same patterns in
the 30-50th percentiles as the base specification with individual beliefs, lending credence to our
earlier results. This specification reinforces our belief that the conformity results are being driven
by a conception of the social norm and not some arbitrary or endogenously formed beliefs of the
treatment group.
A bigger concern may be that since people’s beliefs regarding group behavior were not exogenously
manipulated, there may be endogeneity in who professes to having no priors over group behavior
which will affect my ability to generalize the results from the subsample of bidders professing to
having no beliefs regarding group behavior. However, randomization yields balance between the
treatment arms on expectations regarding the average bid as well as the proportion of bidders
who professed to not knowing the norm. I would argue, therefore, that the characteristics of
this subsample, which is of significant size at roughly 20% of the full sample, are also randomly
distributed and do not vary systematically. I also regress the propensity to express no expectations
regarding group behavior on a battery of variables that were employed for ensuring randomization
balance (Table A4). I find no significant coefficients except for ’Age of group’ which suggests that
people who express no knowledge of group behavior are less likely to belong to groups who have
had a longer history of association. However, independently I have found this feature of groups
to bias against finding treatment effects from status motivation. Therefore, the shorter period of
association among the ’No Norm’ subsample would bias against finding treatment effects. (results
not shown).
My alternate norm definition also allows me to corroborate the results for the subsample with no
beliefs regarding the norm. In Table A3 (Figure 14) I assess how the bid of bidders in the NoNorm
subsample changes relative to the village level norm construct.
Since the mass of bidders with no expectations regarding the norm are bidding lower than the
village level norm, the coefficients in quantiles 10-30 reflect movement towards the norm and can
be consistent with both status seeking and conformity influences. However, the positive departure
from the norm as indicated in quartiles 40-60 can only be reconciled with status seeking, and taken
as a whole suggests a linear increase in bids for the vast majority of the sample in public which
32
is consistent with status seeking behavior. Hence, while our results are not conclusive, it would
appear that they are more supportive of status seeking than conformity, when people state an
absence of beliefs regarding group behavior.
5.8 Discussion
My results indicate that while social motivation does influence willingness to pay for health prod-
ucts in social settings, the strength of these motivations is inherently tied to expectations regarding
group behavior. Utility for status seekers is increasing in differentiating yourself from the average
group behavior, but the demands of conformism operate in the reverse direction when expecta-
tions regarding group behavior are low. Given that the largest proportion of my sample has low
expectations regarding the average bid, status seeking effects are dominated by a desire to conform
in public, particularly in the portion of the bidding distribution where bids are already proximate
to the beliefs regarding the group norm.
Status seeking only emerges neatly for the subsample that has no expectations regarding group
behavior and is therefore unconstrained by conformity influences. Moreover, our externalities
treatment suggests that status seeking is increasing in the pro-social value of actions, with mes-
saging regarding health externalities resulting in status seeking behavior where bids are higher in
public and bidders differentiate themselves from their expectations regarding group behavior in
a positive direction by placing higher bids in public. This suggests, therefore, that when health
seeking behavior is not explicitly perceived as a ’social’ behavior, individuals are more likely to
appeal to social norm considerations and align themselves with average group behavior in public.
However, when individual behavior is perceived as having social repercussion, people are more
likely to engage in more socially desirable behavior and demonstrate higher willingness to pay in
public since status seeking considerations are heightened.
I also find that when bidders can select their own bidding environment, the tendency towards con-
formity in public bidding disappear. Instead, public bidders throughout the bidding distribution
demonstrate status seeking behavior, placing significantly higher bids than their expectations re-
garding the average bid in the group. On the other hand, bidders self-selecting into private bidding
33
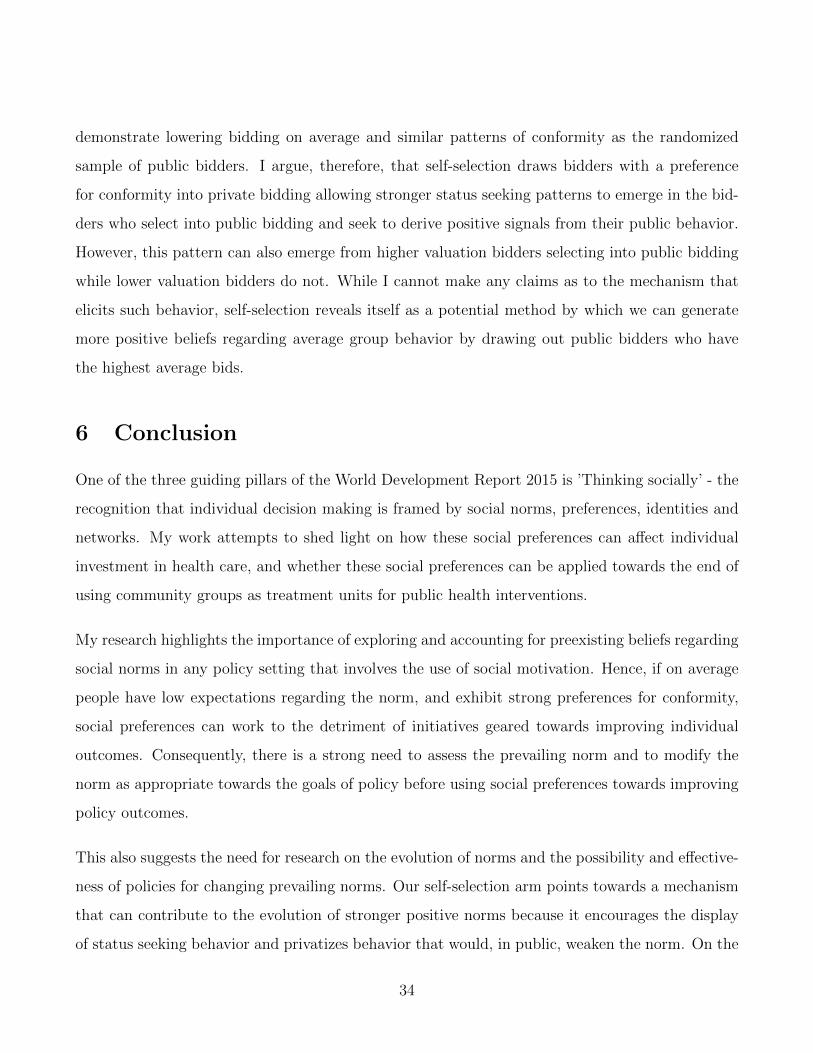
demonstrate lowering bidding on average and similar patterns of conformity as the randomized
sample of public bidders. I argue, therefore, that self-selection draws bidders with a preference
for conformity into private bidding allowing stronger status seeking patterns to emerge in the bid-
ders who select into public bidding and seek to derive positive signals from their public behavior.
However, this pattern can also emerge from higher valuation bidders selecting into public bidding
while lower valuation bidders do not. While I cannot make any claims as to the mechanism that
elicits such behavior, self-selection reveals itself as a potential method by which we can generate
more positive beliefs regarding average group behavior by drawing out public bidders who have
the highest average bids.
6 Conclusion
One of the three guiding pillars of the World Development Report 2015 is ’Thinking socially’ - the
recognition that individual decision making is framed by social norms, preferences, identities and
networks. My work attempts to shed light on how these social preferences can affect individual
investment in health care, and whether these social preferences can be applied towards the end of
using community groups as treatment units for public health interventions.
My research highlights the importance of exploring and accounting for preexisting beliefs regarding
social norms in any policy setting that involves the use of social motivation. Hence, if on average
people have low expectations regarding the norm, and exhibit strong preferences for conformity,
social preferences can work to the detriment of initiatives geared towards improving individual
outcomes. Consequently, there is a strong need to assess the prevailing norm and to modify the
norm as appropriate towards the goals of policy before using social preferences towards improving
policy outcomes.
This also suggests the need for research on the evolution of norms and the possibility and effective-
ness of policies for changing prevailing norms. Our self-selection arm points towards a mechanism
that can contribute to the evolution of stronger positive norms because it encourages the display
of status seeking behavior and privatizes behavior that would, in public, weaken the norm. On the
34

other hand, it leads to an overall diminishment in the willingness to pay since more people seek
private transactions than public and lower their willingness to pay when provided with the veil of
privacy. Hence, policy makers should pay heed to the choice of mechanisms for eliciting behavior
as much as the behavior itself.
Methodologically, we are able to exploit large sample size in a unique setting of pre-existing
community groups and therefore provide more realistic estimates for peer effects than synthetically
created peer groups with small sample sizes. We are able to randomize treatments within groups
to allow us to tackle the reflection problem in group treatments. In addition the problem of
correlated effects within groups would bias us against finding treatment effects. However, owing to
constraints of our study setting, we are unable to randomize people’s beliefs regarding the group
norm, which would have allowed us more compelling evidence regarding conformity effects.
References
Ahuja, A., Kremer, M., & Zwane, A. P. (2010). Providing safe water: Evidence from randomized
evaluations. Annu. Rev. Resour. Econ., 2(1), 237-256.
Akerlof, G. A. (1997). Social distance and social decisions. Econometrica: Journal of the Econo-
metric Society, 1005-1027.
Andreoni, J., & Petrie, R. (2004). Public goods experiments without confidentiality: a glimpse
into fund-raising. Journal of public Economics, 88(7), 1605-1623.
Ariely, D., Bracha, A., & Meier, S. (2009). Doing good or doing well? Image motivation and
monetary incentives in behaving prosocially. The American economic review, 99(1), 544-555.
Babcock, P., Bedard, K., Charness, G., Hartman, J., & Royer, H. (2015). Letting down the team?
Social effects of team incentives. Journal of the European Economic Association, 13(5), 841-870.
Bandiera, O., & Rasul, I. (2006). Social networks and technology adoption in northern Mozam-
bique. The Economic Journal, 116(514), 869-902.
35

Bernheim, B. D. (1994). A theory of conformity. Journal of political Economy, 841-877.
Berry, J., Fischer, G., & Guiteras, R. P. (2015). Eliciting and utilizing willingness to pay: evidence
from field trials in Northern Ghana.
Bronchetti, E. T., Huffman, D. B., & Magenheim, E. (2015). Attention, intentions, and follow-
through in preventive health behavior: Field experimental evidence on flu vaccination. Journal of
Economic Behavior & Organization, 116, 270-291.
Carpenter, J., & Myers, C. K. (2010). Why volunteer? Evidence on the role of altruism, image,
and incentives. Journal of Public Economics, 94(11), 911-920.
Conley, T., & Udry, C. (2001). Social learning through networks: The adoption of new agricultural
technologies in Ghana. American Journal of Agricultural Economics, 83(3), 668-673.
DellaVigna, S., & John, A. List, and Ulrike Malmendier. 2012.Testing for altruism and social
pressure in charitable giving.. Quarterly Journal of Economics, 127(1), 1-56.
Duflo, E., & Saez, E. (2002). Participation and investment decisions in a retirement plan: The
influence of colleagues choices. Journal of public Economics, 85(1), 121-148.
Dupas, P. (2011). Health behavior in developing countries. Annu. Rev. Econ., 3(1), 425-449.
Dupas, P. (2014). Shortrun subsidies and longrun adoption of new health products: Evidence from
a field experiment. Econometrica, 82(1), 197-228.
Dupas, P., & Robinsona, J. (2013). Why don’t the poor save more? Evidence from health savings
experiments. The American Economic Review, 103(4), 1138-1171.
Griskevicius, V., Tybur, J. M., & Van den Bergh, B. (2010). Going green to be seen: status,
reputation, and conspicuous conservation. Journal of personality and social psychology, 98(3),
392.
36

Guiteras, R. P., Levine, D. I., Luby, S. P., Polley, T. H., Khatun-e-Jannat, K., & Unicomb, L.
(2016). Disgust, Shame, and Soapy Water: Tests of Novel Interventions to Promote Safe Water and
Hygiene. Journal of the Association of Environmental and Resource Economists, 3(2), 321-359.
Hoffman, E., McCabe, K., & Smith, V. L. (1996). Social distance and other-regarding behavior in
dictator games. The American Economic Review, 86(3), 653-660.
Hong, H., Kubik, J. D., & Stein, J. C. (2004). Social interaction and stockmarket participation.
The journal of finance, 59(1), 137-163.
Karlan, D., & McConnell, M. A. (2014). Hey look at me: The effect of giving circles on giving.
Journal of Economic Behavior & Organization, 106, 402-412.
Kremer, M., Miguel, E., Mullainathan, S., Null, C., & Zwane, A. P. (2011). Social engineering:
Evidence from a suite of take-up experiments in Kenya. Work. Pap., Univ. Calif., Berkeley.
Mazar, N., Koszegi, B., & Ariely, D. (2010). Price-sensitive preferences. SSRN Working Paper
Series.
Miguel, E., & Kremer, M. (2004). Worms: identifying impacts on education and health in the
presence of treatment externalities. Econometrica, 72(1), 159-217.
Oster, E., & Thornton, R. (2011). Menstruation, sanitary products, and school attendance: Ev-
idence from a randomized evaluation. American Economic Journal: Applied Economics, 3(1),
91-100.
Panagopoulos, C. (2010). Affect, social pressure and prosocial motivation: Field experimental evi-
dence of the mobilizing effects of pride, shame and publicizing voting behavior. Political Behavior,
32(3), 369-386.
Schofield, H., Loewenstein, G., Kopsic, J., & Volpp, K. G. (2015). Comparing the effectiveness of
individualistic, altruistic, and competitive incentives in motivating completion of mental exercises.
Journal of health economics, 44, 286-299.
37

World Bank Group. (2015). World Development Report 2015 : Mind, Society, and Behavior.
Washington, DC: World Bank. World Bank.
https://openknowledge.worldbank.org/handle/10986/20597
38

Figure 1: Distribution of Bid data
Note: SMT is sub-district administrative unit. Field teams were organized by SMT and I employ
SMT level fixed effects in the regressions to improve estimate precision
Figure 2: Distribution of Bid data against Expectations regarding Average Bid
Note: This figure plots the distribution of actual bidding data against the distribution of beliefs
regarding the average bid in the group. Ranksum tests reveal that the belief distribution is
dominated in rank by the distribution of actual bids
39

Figure 3: Distribution of Bid data against Expectations regarding Average Bid
Note: This figure plots the belief regarding the average bid in the group for every decile of the
bidding distribution. It reveals a stability of beliefs across different ranges of actual bidding behavior
Figure 4: Distribution of Expectations regarding Average Bid by Treatment Group
Note: This figure plots the distribution of belief regarding the average bid in the group by treatment
arm, showing that beliefs are exogenous to treatment assignment
40

Figure 5: Distribution of DevNorm by Treatment Group
Note: This figure plots the distribution of DevNorm - the deviation of individual bid from belief re.
average bid in group- by treatment arm, showing the shift in the public distribution left
in the direction of decreasing deviation from the beliefs
41

Figure 6: Testing for Conformity: Full Sample
Note: This figure plots the coefficients by decile of the treatment effect in public on DevNorm - the deviation of individual
bid from belief re. average bid in group, showing the tendency to reduce deviation from beliefs regarding group behavior in
public
42

Figure 7: Testing for Conformity: Contamination
Note: This figure plots the coefficients by decile of the treatment effect in public on DevNorm - the deviation of individual
bid from belief re. average bid in group - for individuals in villages with above median contamination levels against individuals
from median or below contamination
43

Figure 8: Testing for Conformity: Externalities
Note: This figure plots the coefficients by decile of the treatment effect in public on DevNorm - the deviation of individual
bid from belief re. average bid in group - for individuals drawn from villages with externalities priming against individuals without
priming. The control specifications include controls for gender of meeting group and contamination interacted with treatment
44
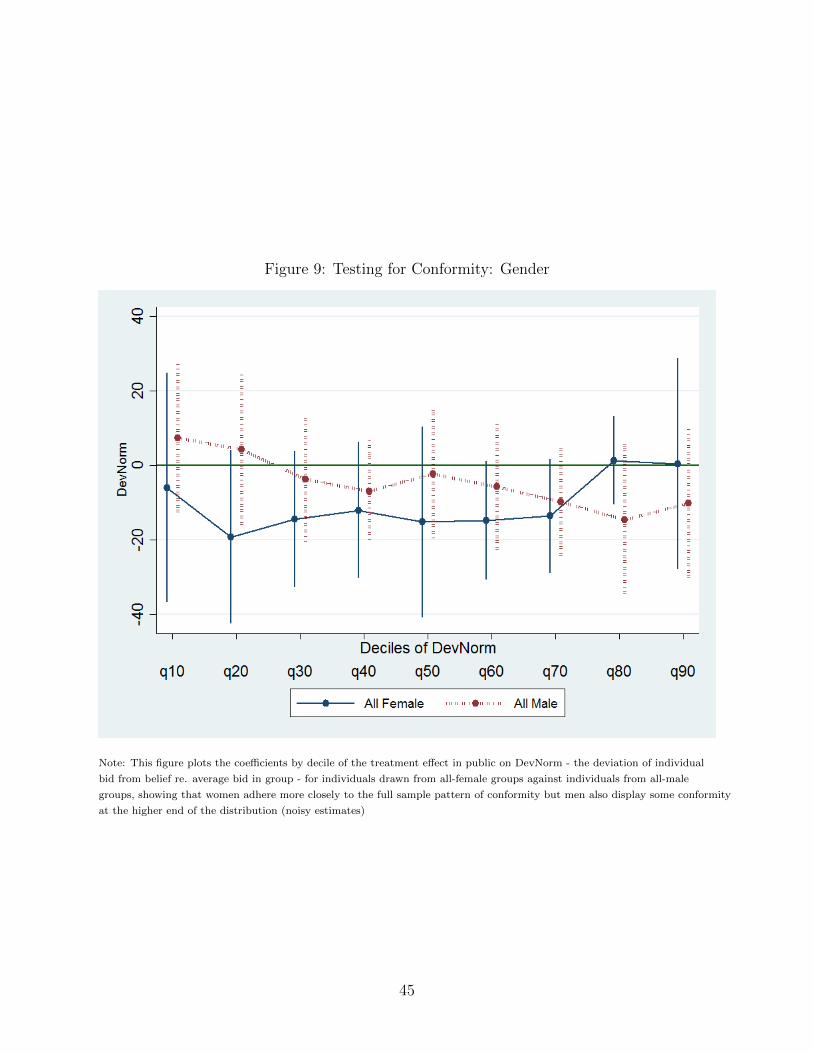
Figure 9: Testing for Conformity: Gender
Note: This figure plots the coefficients by decile of the treatment effect in public on DevNorm - the deviation of individual
bid from belief re. average bid in group - for individuals drawn from all-female groups against individuals from all-male
groups, showing that women adhere more closely to the full sample pattern of conformity but men also display some conformity
at the higher end of the distribution (noisy estimates)
45
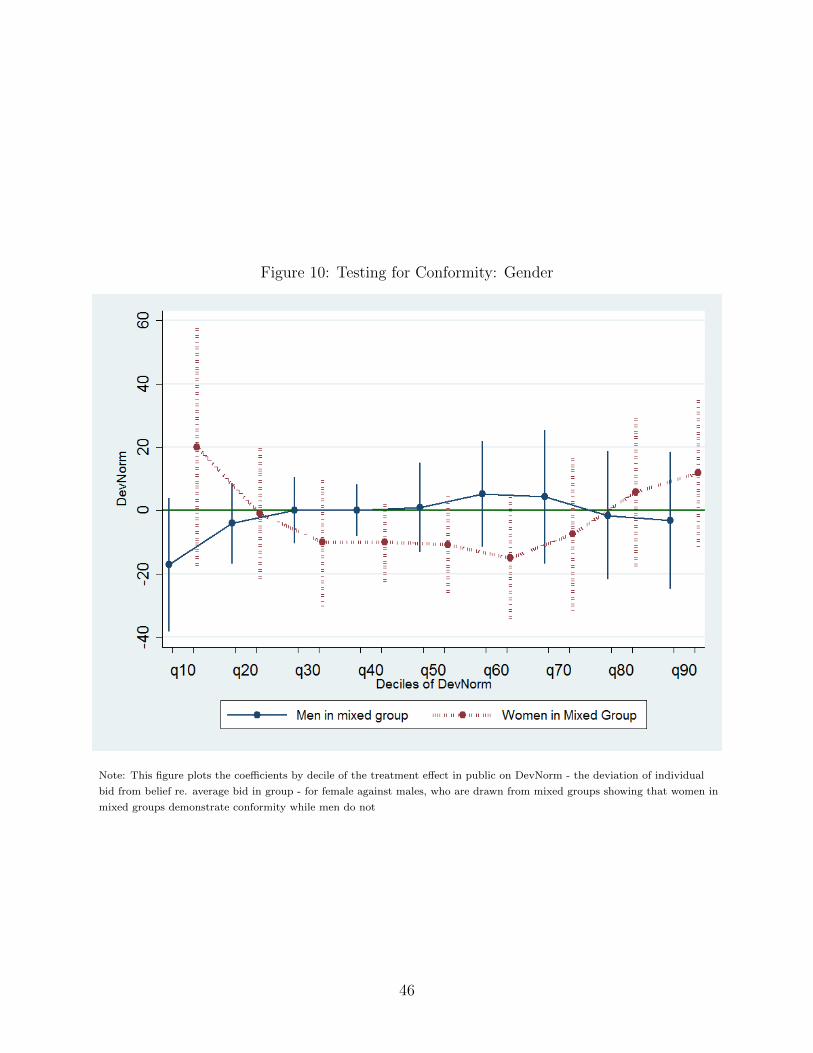
Figure 10: Testing for Conformity: Gender
Note: This figure plots the coefficients by decile of the treatment effect in public on DevNorm - the deviation of individual
bid from belief re. average bid in group - for female against males, who are drawn from mixed groups showing that women in
mixed groups demonstrate conformity while men do not
46

Figure 11: Testing for Conformity: Self Selection
Note: This figure plots the coefficients by decile of the treatment effect in public on DevNorm - the deviation of individual
bid from belief re. average bid in group - for randomized public bidders against self-select public bidders showing that self-
select public bidders do not exercise conformity, instead exhibiting status seeking behavior that increases their deviation from
group behavior
47

Figure 12: Testing for Conformity: Robustness
Note: This figure plots the coefficients by decile of the treatment effect in public on DevNorm against the coefficients using
the village level measure for DevNorm, showing that the patterns of conformity in bidding behavior are robust to our choice
of belief measures
48

Figure 13: Testing for Status Seeking: Robustness
Note: This figure plots the coefficients by decile of the treatment effect in public on the NoNorm subsample relative to the
the village level measure for DevNorm, showing that this subsample shows a unique pattern of bidding relative to the village
construct for beliefs which is more consistent with status seeking than conformity
49
Table 1: Public Bidding - ATE in Randomized Sample
(1) (2) (3)Maximum Willingness to Pay
Public Bid 0.585 0.193 -0.747(2.197) (2.218) (2.301)
cons 106.6*** 106.8*** 96.85***(3.330) (3.149) (7.899)
N 1892 1892 1806
Mean Dependent Var (Pvt Bid) 106.6 106.6 106.2Fixed effects None SMT SMTControls No No Yes
Note: The dependent variable is the individual’s Maximum Willingnessto Pay for the product, as elicited by their BDM bid.Controls: Age, educ, poverty, gender, HH size, no. of childrenStandard errors clustered at meeting level∗p < 0.10 ∗ ∗p < 0.05 ∗ ∗ ∗ p < 0.01
50

Table 2: Simultaneous Quantile Regression of Maximum Willingness to Pay
(1) (2) (3) (4) (5) (6) (7) (8) (9)Maximum Willingness to Pay
Quantile Q10 Q20 Q30 Q40 Q50 Q60 Q70 Q80 Q90Public bid 5.677** 1.709 -1.346 -2.477 -2.40e-14 2.37e-14 -3.643 -2.613 -2.471
(2.641) (3.497) (2.211) (3.634) (0.770) (0.805) (3.667) (4.959) (4.055)
cons 24.81** 56.91*** 92.02*** 109.1*** 150.0*** 150.0*** 152.8*** 167.9*** 196.2***(11.54) (13.68) (8.212) (9.420) (8.348) (4.099) (10.43) (11.03) (8.842)
N 1806 1806 1806 1806 1806 1806 1806 1806 1806
MDepVar 27.08 56.64 75.94 95.62 114.6 114.6 134.7 155.9 177.5FixedEffect SMTControls Age, education, poverty status, gender, household size and number of children
Notes: Dependent variable is the individual bid (MWTP im). Bootstrapped standard errors in parentheses.MDepVar reflects the mean bid in the private bidding arm∗p < 0.10 ∗ ∗p < 0.05 ∗ ∗ ∗ p < 0.01
51
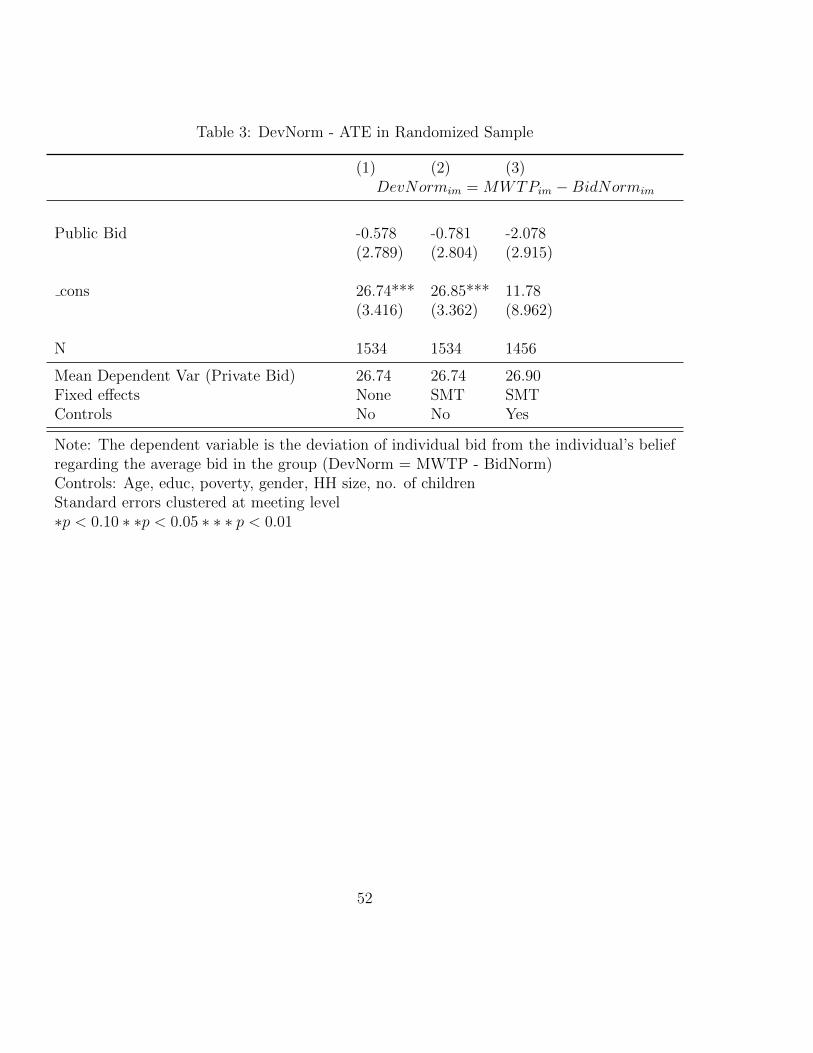
Table 3: DevNorm - ATE in Randomized Sample
(1) (2) (3)DevNormim = MWTPim −BidNormim
Public Bid -0.578 -0.781 -2.078(2.789) (2.804) (2.915)
cons 26.74*** 26.85*** 11.78(3.416) (3.362) (8.962)
N 1534 1534 1456
Mean Dependent Var (Private Bid) 26.74 26.74 26.90Fixed effects None SMT SMTControls No No Yes
Note: The dependent variable is the deviation of individual bid from the individual’s beliefregarding the average bid in the group (DevNorm = MWTP - BidNorm)Controls: Age, educ, poverty, gender, HH size, no. of childrenStandard errors clustered at meeting level∗p < 0.10 ∗ ∗p < 0.05 ∗ ∗ ∗ p < 0.01
52
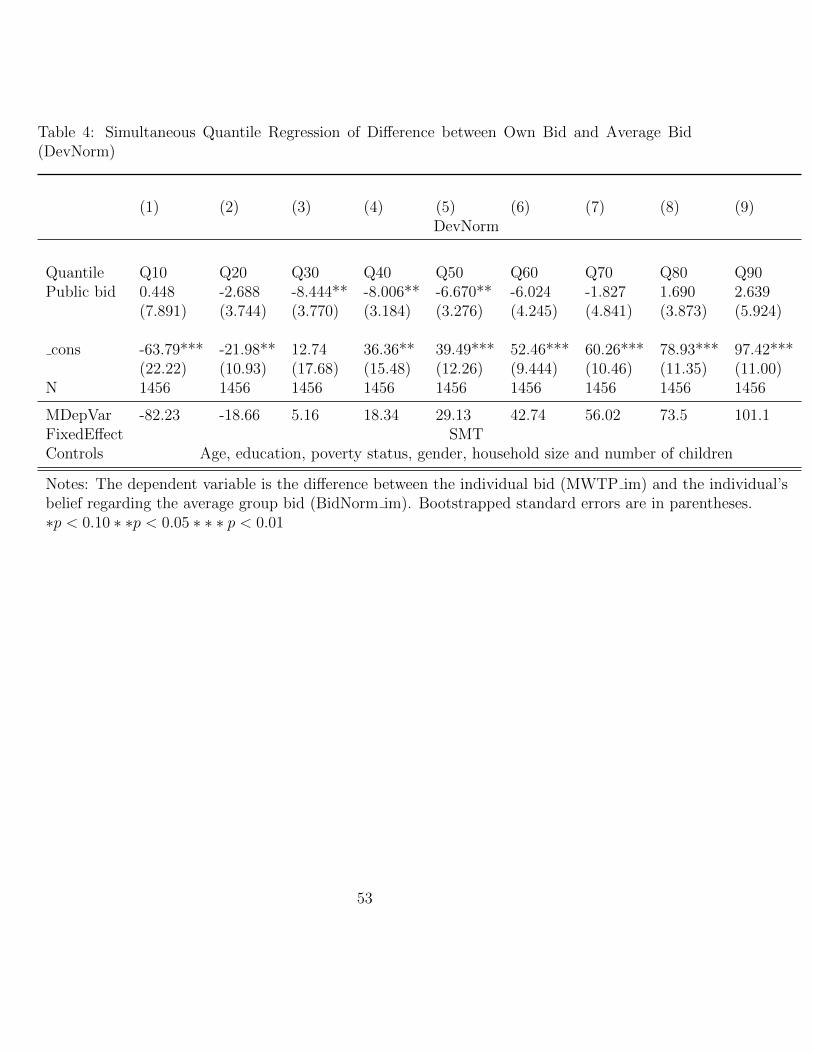
Table 4: Simultaneous Quantile Regression of Difference between Own Bid and Average Bid(DevNorm)
(1) (2) (3) (4) (5) (6) (7) (8) (9)DevNorm
Quantile Q10 Q20 Q30 Q40 Q50 Q60 Q70 Q80 Q90Public bid 0.448 -2.688 -8.444** -8.006** -6.670** -6.024 -1.827 1.690 2.639
(7.891) (3.744) (3.770) (3.184) (3.276) (4.245) (4.841) (3.873) (5.924)
cons -63.79*** -21.98** 12.74 36.36** 39.49*** 52.46*** 60.26*** 78.93*** 97.42***(22.22) (10.93) (17.68) (15.48) (12.26) (9.444) (10.46) (11.35) (11.00)
N 1456 1456 1456 1456 1456 1456 1456 1456 1456
MDepVar -82.23 -18.66 5.16 18.34 29.13 42.74 56.02 73.5 101.1FixedEffect SMTControls Age, education, poverty status, gender, household size and number of children
Notes: The dependent variable is the difference between the individual bid (MWTP im) and the individual’sbelief regarding the average group bid (BidNorm im). Bootstrapped standard errors are in parentheses.∗p < 0.10 ∗ ∗p < 0.05 ∗ ∗ ∗ p < 0.01
53

Table 5: Difference between Bid and Beliefs re. Average Bid
Private Public Total
% % %Below Norm 24.5 25.9 25.2At Norm 10.2 14 12.1Above Norm 65.3 60.2 62.6
Total 100 100 100
Note: This table reflects the proportion of the sample that bids above, on orbelow their expectations re. the average bid, and differences in theseproportions by treatment condition
Table 6: Probability of Bidding Higher than BidNorm
(1) (2) (3)Pr(MWTP > BidNorm) Pr(MWTP = BidNorm) Pr(MWTP < BidNorm)
Public Bid -0.155*** 0.162** 0.0824***(0.0436) (0.0677) (0.0209)
cons 0.162 -1.311*** -0.353***(0.114) (0.200) (0.0497)
N 1456 1456 1456Mean Dep Var (Pvt) 0.648 0.104 0.248Fixed Effects SMTControls Age, educ, poverty, gender, hh size and num child
Notes: The dependent variable is a binary variable indicating whether the bidder bid above their expectationregarding the average bid in the group, equal to the average or below itStandard errors are clustered at the meeting level∗p < 0.10 ∗ ∗p < 0.05 ∗ ∗ ∗ p < 0.01
54

Table 7: No Conformity SubSample
(1)Max WTP
Public Bid -3.426(2.528)
No Norm -11.92**(5.628)
Public*No Norm 14.00**(6.603)
cons 99.21***(8.036)
N 1806
Mean Dep Var (Pvt) 109.1Fixed Effects SMTControls Age, educ, poverty, gender, hh size and num child
Note: The dependent variable is the individual’s Maximum Willingness to Payfor the product, as elicited by their BDM bid.Standard errors are clustered at the meeting level∗p < 0.10 ∗ ∗p < 0.05 ∗ ∗ ∗ p < 0.01
55
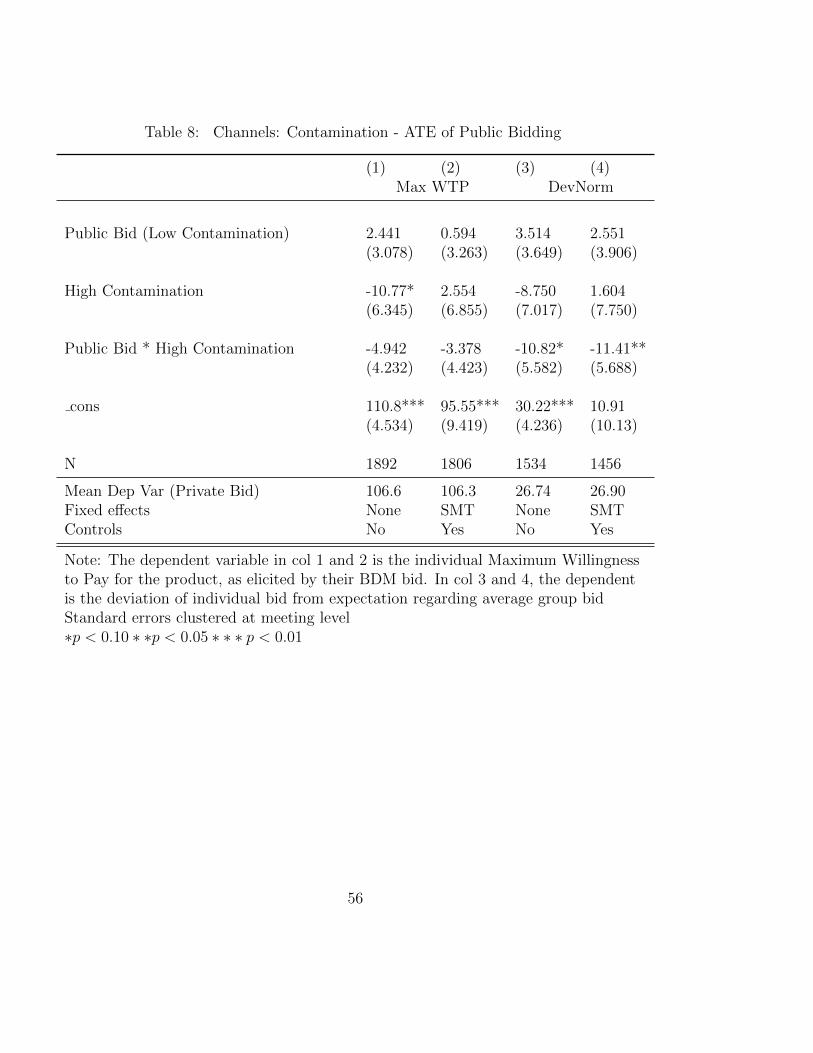
Table 8: Channels: Contamination - ATE of Public Bidding
(1) (2) (3) (4)Max WTP DevNorm
Public Bid (Low Contamination) 2.441 0.594 3.514 2.551(3.078) (3.263) (3.649) (3.906)
High Contamination -10.77* 2.554 -8.750 1.604(6.345) (6.855) (7.017) (7.750)
Public Bid * High Contamination -4.942 -3.378 -10.82* -11.41**(4.232) (4.423) (5.582) (5.688)
cons 110.8*** 95.55*** 30.22*** 10.91(4.534) (9.419) (4.236) (10.13)
N 1892 1806 1534 1456
Mean Dep Var (Private Bid) 106.6 106.3 26.74 26.90Fixed effects None SMT None SMTControls No Yes No Yes
Note: The dependent variable in col 1 and 2 is the individual Maximum Willingnessto Pay for the product, as elicited by their BDM bid. In col 3 and 4, the dependentis the deviation of individual bid from expectation regarding average group bidStandard errors clustered at meeting level∗p < 0.10 ∗ ∗p < 0.05 ∗ ∗ ∗ p < 0.01
56

Table 9: Channels- Contamination and Conformity
(1) (2) (3) (4) (5) (6) (7) (8) (9)DevNorm
Quantile Q10 Q20 Q30 Q40 Q50 Q60 Q70 Q80 Q90Public Bid -1.034 2.582 0.450 -1.056 5.220 3.076 2.198 6.130 5.511
(8.045) (4.122) (5.940) (4.130) (3.649) (5.277) (6.281) (4.885) (7.829)
High Cont. -9.037 8.549 10.59* 8.250** 7.971 6.318 1.627 -0.177 -0.0757(10.37) (8.199) (5.575) (3.506) (4.916) (5.559) (5.375) (9.301) (10.17)
Pub*HighCont. 3.570 -15.29 -12.70* -12.19** -23.18*** -17.81** -10.13 -12.37 -14.29(14.18) (10.08) (7.417) (4.784) (5.919) (7.681) (10.12) (10.60) (14.00)
cons -63.56*** -27.07*** 0.990 26.26*** 32.51*** 51.41*** 58.66*** 78.48*** 94.12***(20.19) (10.45) (12.26) (9.576) (7.007) (7.622) (8.823) (10.42) (13.16)
N 1456
MeanDepVar -48.84 -21.18 -1.822 14.61 23.64 37.13 53.47 71.43 99.75Fixed Effects SMTControls Age, education, poverty status, gender, household size and number of children
Notes: The dependent variable is the difference between the individual bid and the individual’s belief regardingthe average group bid (BidNorm im). High contamination villages have source contamination greater than themedian across the full sample. Bootstrapped standard errors in parenthesis.∗p < 0.10 ∗ ∗p < 0.05 ∗ ∗ ∗ p < 0.01
57

Table 10: Contamination and Probability of Bidding Higher than BidNorm
(1) (2) (3) (4)Pr (MWTP > BidNorm) Pr (MWTP = BidNorm)
High Cont Low Cont High Cont Low ContPublic Bid -0.419*** 0.0198 0.309*** 0.0401
(0.0345) (0.0197) (0.0921) (0.0460)
cons -0.245 0.286* -0.995*** -1.457***(0.218) (0.158) (0.199) (0.213)
N 591 865 591 865
Mean Dep Var (Private Bid) 0.647 0.649 0.107 0.100Fixed Effects SMTControls Age, educ, poverty, gender, hh size and num child
Notes: The dependent variable is a binary variable indicating whether the bidder bid abovetheir expectation regarding the average bid in the group or on their expectation. Standarderrors are clustered at the meeting level∗p < 0.10 ∗ ∗p < 0.05 ∗ ∗ ∗ p < 0.01
58
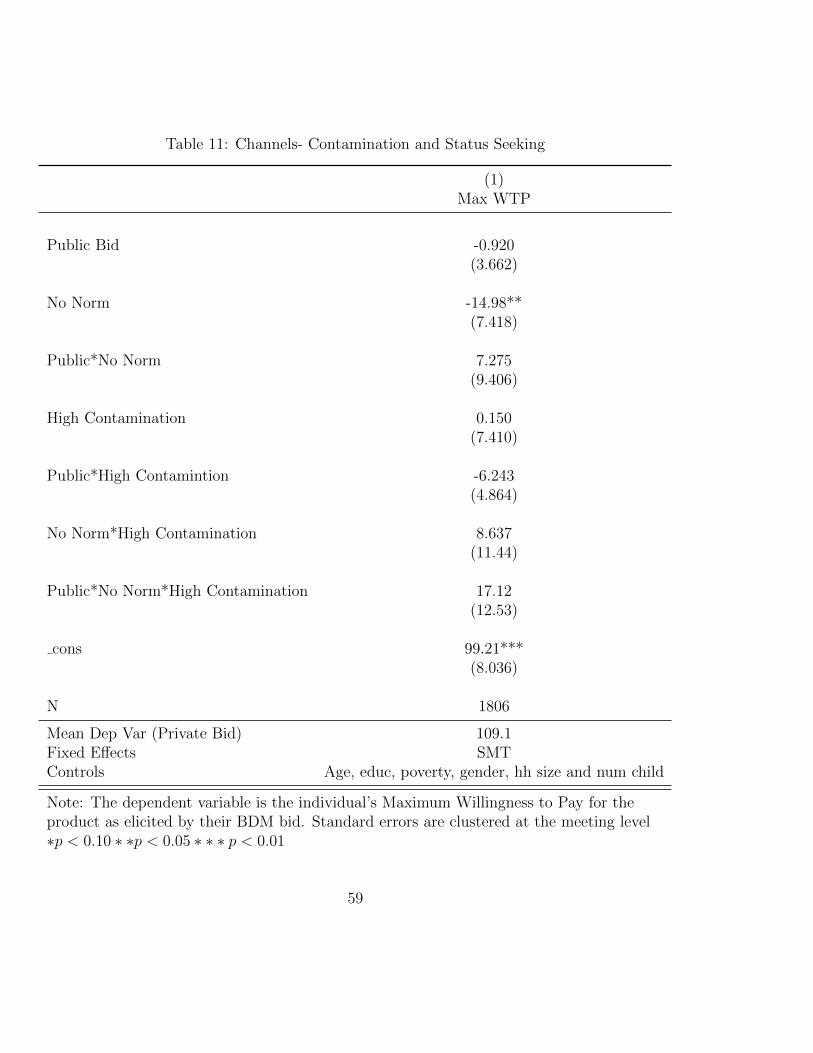
Table 11: Channels- Contamination and Status Seeking
(1)Max WTP
Public Bid -0.920(3.662)
No Norm -14.98**(7.418)
Public*No Norm 7.275(9.406)
High Contamination 0.150(7.410)
Public*High Contamintion -6.243(4.864)
No Norm*High Contamination 8.637(11.44)
Public*No Norm*High Contamination 17.12(12.53)
cons 99.21***(8.036)
N 1806
Mean Dep Var (Private Bid) 109.1Fixed Effects SMTControls Age, educ, poverty, gender, hh size and num child
Note: The dependent variable is the individual’s Maximum Willingness to Pay for theproduct as elicited by their BDM bid. Standard errors are clustered at the meeting level∗p < 0.10 ∗ ∗p < 0.05 ∗ ∗ ∗ p < 0.01
59

Table 12: ATE of Public Bidding by Externalities Priming
(1) (2) (3) (4)Max WTP DevNorm
Public Bid (No Externalities Priming) -2.994 -4.371 -3.552 -5.258(2.758) (2.961) (3.803) (4.070)
Externalities Priming -0.922 -5.074 2.627 -1.132(6.615) (6.285) (6.784) (6.617)
Public Bid * Externalities 7.304* 7.317 5.995 6.340(4.413) (4.660) (5.642) (5.923)
cons 107.0*** 88.94*** 25.52*** 5.127(4.487) (19.73) (4.761) (19.56)
N 1892 1806 1534 1456
Mean Dep Var (Private Bid) 106.6 106.3 26.74 26.90Fixed effects None SMT None SMTControls No Yes No Yes
Note: The dependent variable in col 1 and 2 is the individual Maximum Willingnessto Pay for the product, as elicited by their BDM bid. In col 3 and 4, the dependentis the deviation of individual bid from expectation regarding average group bidStandard errors clustered at meeting level∗p < 0.10 ∗ ∗p < 0.05 ∗ ∗ ∗ p < 0.01
60

Table 13: Externalities and Conformity
(1) (2) (3) (4) (5) (6) (7) (8) (9)DevNorm
Quantile Q10 Q20 Q30 Q40 Q50 Q60 Q70 Q80 Q90Public Bid -7.574 -7.413 -8.264 -9.962*** -10.69** -9.839* -4.855 -2.846 6.900
(7.198) (7.958) (5.189) (3.291) (4.590) (5.265) (5.537) (7.635) (8.786)
Externalities -9.585 -5.310 -1.451 -3.117 -8.686** -5.346 2.730 2.678 10.29(9.951) (6.768) (5.644) (4.017) (4.009) (4.988) (4.534) (4.973) (8.172)
Pub*Externality 17.30 10.35 5.283 5.912 10.69* 12.01 5.938 3.750 -11.57(10.75) (10.10) (7.581) (5.015) (5.940) (7.619) (8.264) (8.717) (10.25)
cons -44.78** -28.83** -2.747 15.02 42.30*** 43.54*** 45.71*** 66.76*** 86.49***(22.09) (12.14) (12.83) (16.13) (15.42) (15.31) (16.64) (13.58) (22.78)
N 1456
MnDepVar-Pvt -43.07 -15.7 3.86 18.81 30.82 44.39 57.92 76.16 99.03Fixed Effects SMTControls Age, educ, poverty, gender, hhold size, num child, source+storage contamination, group gender
Notes: The dependent variable is the difference between the individual bid and the individual’s belief regardingthe average group bid (BidNorm im). High contamination villages have source contamination greater than themedian across the full sample. Bootstrapped standard errors in parenthesis.∗p < 0.10 ∗ ∗p < 0.05 ∗ ∗ ∗ p < 0.01
61

Table 14: Externalities Priming and Probability of Bidding Higher than BidNorm
(1) (2) (3) (4)Pr (MWTP > BidNorm) Pr (MWTP = BidNorm)
Externalities No Externalities Externalities No ExternalitiesPublic Bid -0.0244 -0.281** 0.163** 0.177
(0.0930) (0.134) (0.0662) (0.121)
cons 0.0288 -0.103 -2.144*** -1.222***(0.870) (0.180) (0.135) (0.441)
N 691 765 691 767Mean Dep Var (Private Bid) 0.637 0.657 0.103 0.103Fixed Effects SMTControls Age, educ, poverty, gender, hh size, num child, contamination, group gender
Notes: The dependent variable is a binary variable on whether the bidder bid above their expectationregarding the average bid in the group or on their expectation. Standard errors are clustered at themeeting level. Externality villages are primed with a message on spillovers of individual health behavior.∗p < 0.10 ∗ ∗p < 0.05 ∗ ∗ ∗ p < 0.01
62

Table 15: Gender and Conformity
(1) (2) (3) (4) (5) (6) (7) (8) (9)DevNorm
A- All Female GroupQuantile Q10 Q20 Q30 Q40 Q50 Q60 Q70 Q80 Q90Public Bid -5.988 -19.23 -14.47 -12.11 -15.22 -14.81* -13.64* 1.339 0.448
(22.24) (11.81) (10.23) (9.731) (10.94) (8.067) (7.723) (6.046) (17.92)
N 168 168 168 168 168 168 168 168 168MeanDepVar(Pvt) -42.71 -3.8 8.79 18.78 35.28 48.13 61.89 69.57 90.05
B- All Male GroupQuantile Q10 Q20 Q30 Q40 Q50 Q60 Q70 Q80 Q90Public Bid 7.430 4.291 -3.697 -6.913 -2.297 -5.774 -9.756 -14.67 -10.20
(12.71) (10.35) (10.04) (8.293) (6.760) (8.788) (9.189) (10.46) (10.34)
N 320 320 320 320 320 320 320 320 320MeanDepVar (Pvt) -62.22 -32.67 -10.7 5.413 20.06 39.33 56.69 81.33 104.95
B- Mixed GroupQuantile Q10 Q20 Q30 Q40 Q50 Q60 Q70 Q80 Q90Public Bid -17.13 -4.038 -8.02e-14 -1.40e-13 0.936 5.160 4.298 -1.585 -3.157
(16.27) (6.504) (7.464) (5.332) (5.804) (5.879) (8.194) (10.30) (10.77)
Public* Female Bid 20.04 -1.025 -10.000 -10.000** -10.78* -15.06** -7.513 5.862 11.78(18.91) (10.49) (10.59) (4.994) (6.275) (7.596) (10.49) (12.03) (13.46)
N 968 968 968 968 968 968 968 968 968
MeanDepVar (Pvt) -34.65 -17.59 4.659 14.85 26.31 36.58 52.81 77.42 107
Fixed Effects SMTControls Age, education, poverty status, gender, household size and number of children
Notes: The dependent variable is the difference between the individual bid (MWTP im) and the individual’sbelief re. the average group bid (BidNorm im). Bootstrapped standard errors are in parentheses.∗p < 0.10 ∗ ∗p < 0.05 ∗ ∗ ∗ p < 0.01
63

Table 16: Probability of Bidding Higher than BidNorm- Gender
(1) (2)Pr (MWTP > BidNorm)
All Female Group All Male Group Mixed GroupPublic Bid -0.248 -0.00435 -0.131
(0.189) (0.141) (0.130)
Female Bid 0.0674(0.152)
Public * Female Bid -0.127(0.157)
cons 0.253 -0.0144 0.612**(0.634) (0.362) (0.243)
N 168 320 968Mean Dep Var (Private Bid) 0.650 0.572 0.674Fixed Effects SMTControls Age, educ, poverty, gender, hh size and num child
Notes: The dependent variable is a binary variable indicating whether thebidder bid above their expectation regarding the average bid in the groupStandard errors are clustered at the meeting level∗p < 0.10 ∗ ∗p < 0.05 ∗ ∗ ∗ p < 0.01
64

Table 17: No Conformity SubSample -Gender
(1) (2) (3)Max WTP
All Female Group All Male Group Mixed GroupPublic Bid -5.814 0.323 -7.869
(6.763) (5.898) (5.141)
No Norm 7.078 -7.747 -28.35**(13.17) (13.13) (11.99)
Public*No Norm 4.339 37.50** 10.96(14.00) (15.78) (15.00)
Female*Public*No Norm 0.158(18.45)
cons 106.4*** 101.6*** 102.3***(17.46) (16.68) (10.05)
N 226 384 1196
Mean Dep Var (Private Bid) 103.5 101.7 112.6Fixed Effects SMTControls Age, educ, poverty, gender, hh size and num child
Note: The dependent variable is the individual’s Maximum Willingness to Pay forthe product, as elicited by their BDM bid.Standard errors are clustered at the meeting levelSome interactions suppressed for space consideration∗p < 0.10 ∗ ∗p < 0.05 ∗ ∗ ∗ p < 0.01
65
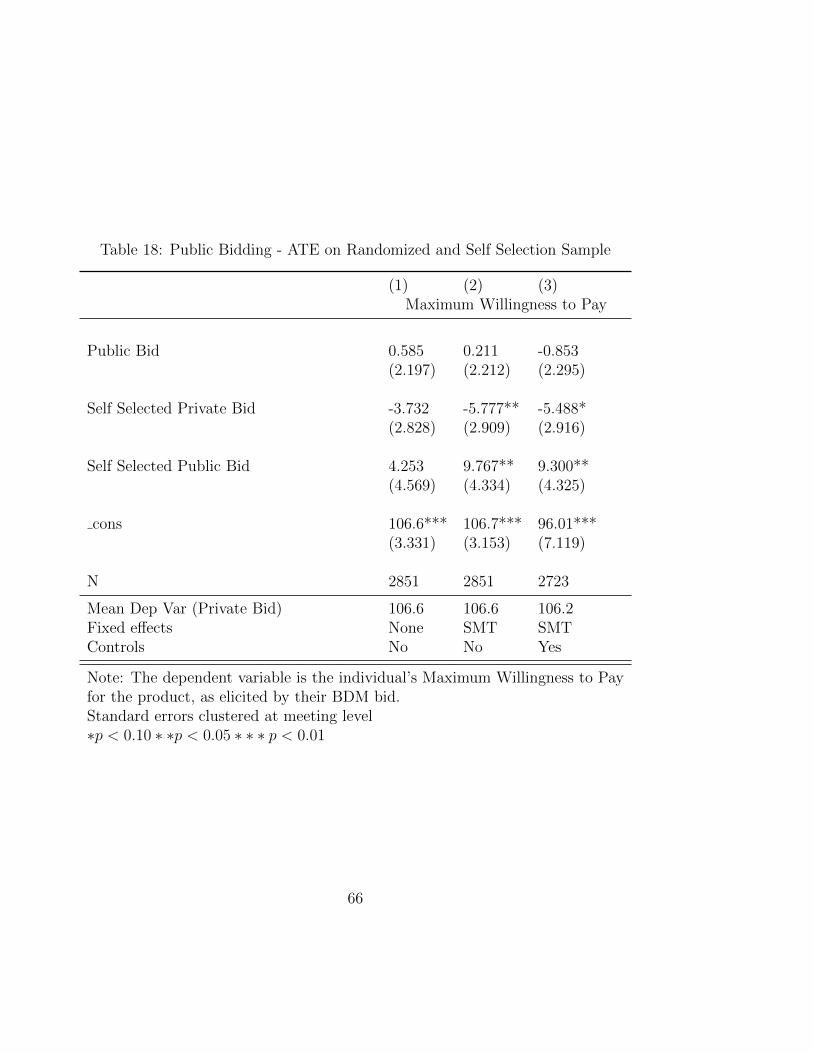
Table 18: Public Bidding - ATE on Randomized and Self Selection Sample
(1) (2) (3)Maximum Willingness to Pay
Public Bid 0.585 0.211 -0.853(2.197) (2.212) (2.295)
Self Selected Private Bid -3.732 -5.777** -5.488*(2.828) (2.909) (2.916)
Self Selected Public Bid 4.253 9.767** 9.300**(4.569) (4.334) (4.325)
cons 106.6*** 106.7*** 96.01***(3.331) (3.153) (7.119)
N 2851 2851 2723
Mean Dep Var (Private Bid) 106.6 106.6 106.2Fixed effects None SMT SMTControls No No Yes
Note: The dependent variable is the individual’s Maximum Willingness to Payfor the product, as elicited by their BDM bid.Standard errors clustered at meeting level∗p < 0.10 ∗ ∗p < 0.05 ∗ ∗ ∗ p < 0.01
66

Table 19: Self Selection and Conformity
(1) (2) (3) (4) (5) (6) (7) (8) (9)DevNorm
Quantile Q10 Q20 Q30 Q40 Q50 Q60 Q70 Q80 Q90Public Bid 0.609 -1.242 -6.995* -7.556** -6.474** -5.025 -3.130 0.998 1.295
(5.632) (4.233) (3.883) (3.229) (3.247) (4.267) (4.793) (4.818) (5.184)
SelfSelect*Pvt 0.0237 -6.123 -11.76*** -10.85*** -6.605*** -6.292** -8.961** -6.874 -2.049(7.696) (5.326) (3.766) (2.504) (2.550) (3.150) (3.614) (5.099) (5.198)
SelfSelect*Pub 11.64 14.91* 17.01** 15.54*** 14.63** 15.31** 18.32*** 11.23* 6.749(10.90) (8.337) (6.728) (4.838) (6.243) (7.507) (6.695) (6.532) (6.545)
cons -51.77*** -20.45** 7.914 24.96*** 34.57*** 52.70*** 62.82*** 82.12*** 91.76***(11.06) (9.974) (7.786) (8.366) (7.599) (6.159) (8.310) (10.12) (10.61)
N 2195 2195 2195 2195 2195 2195 2195 2195 2195
MDepVar(Pvt) -49.49 -19.12 2.58 15.91 28.58 42.72 55.58 73.26 102.5FixedEffect SMTControls Age, education, poverty status, gender, household size and number of children
Notes: The dependent variable is the difference between the individual bid (MWTP im) and the individual’sbelief regarding the average group bid (BidNorm im).∗p < 0.10 ∗ ∗p < 0.05 ∗ ∗ ∗ p < 0.01
67
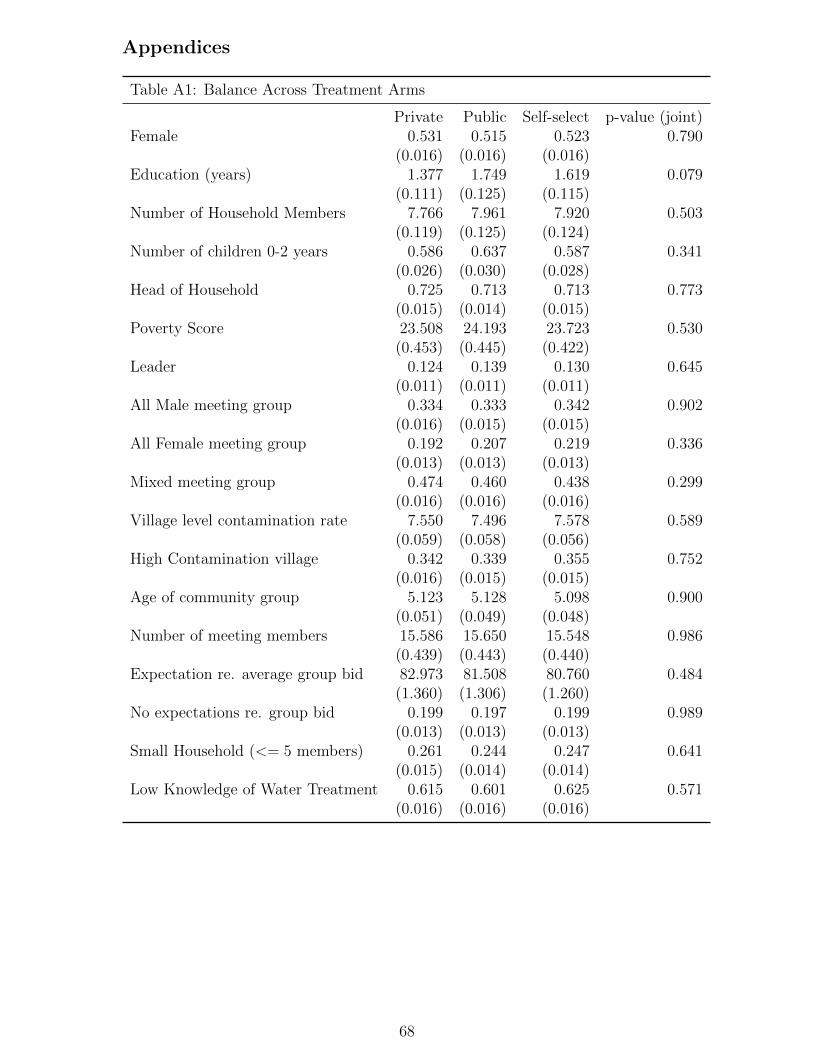
Appendices
Table A1: Balance Across Treatment Arms
Private Public Self-select p-value (joint)Female 0.531 0.515 0.523 0.790
(0.016) (0.016) (0.016)Education (years) 1.377 1.749 1.619 0.079
(0.111) (0.125) (0.115)Number of Household Members 7.766 7.961 7.920 0.503
(0.119) (0.125) (0.124)Number of children 0-2 years 0.586 0.637 0.587 0.341
(0.026) (0.030) (0.028)Head of Household 0.725 0.713 0.713 0.773
(0.015) (0.014) (0.015)Poverty Score 23.508 24.193 23.723 0.530
(0.453) (0.445) (0.422)Leader 0.124 0.139 0.130 0.645
(0.011) (0.011) (0.011)All Male meeting group 0.334 0.333 0.342 0.902
(0.016) (0.015) (0.015)All Female meeting group 0.192 0.207 0.219 0.336
(0.013) (0.013) (0.013)Mixed meeting group 0.474 0.460 0.438 0.299
(0.016) (0.016) (0.016)Village level contamination rate 7.550 7.496 7.578 0.589
(0.059) (0.058) (0.056)High Contamination village 0.342 0.339 0.355 0.752
(0.016) (0.015) (0.015)Age of community group 5.123 5.128 5.098 0.900
(0.051) (0.049) (0.048)Number of meeting members 15.586 15.650 15.548 0.986
(0.439) (0.443) (0.440)Expectation re. average group bid 82.973 81.508 80.760 0.484
(1.360) (1.306) (1.260)No expectations re. group bid 0.199 0.197 0.199 0.989
(0.013) (0.013) (0.013)Small Household (<= 5 members) 0.261 0.244 0.247 0.641
(0.015) (0.014) (0.014)Low Knowledge of Water Treatment 0.615 0.601 0.625 0.571
(0.016) (0.016) (0.016)
68
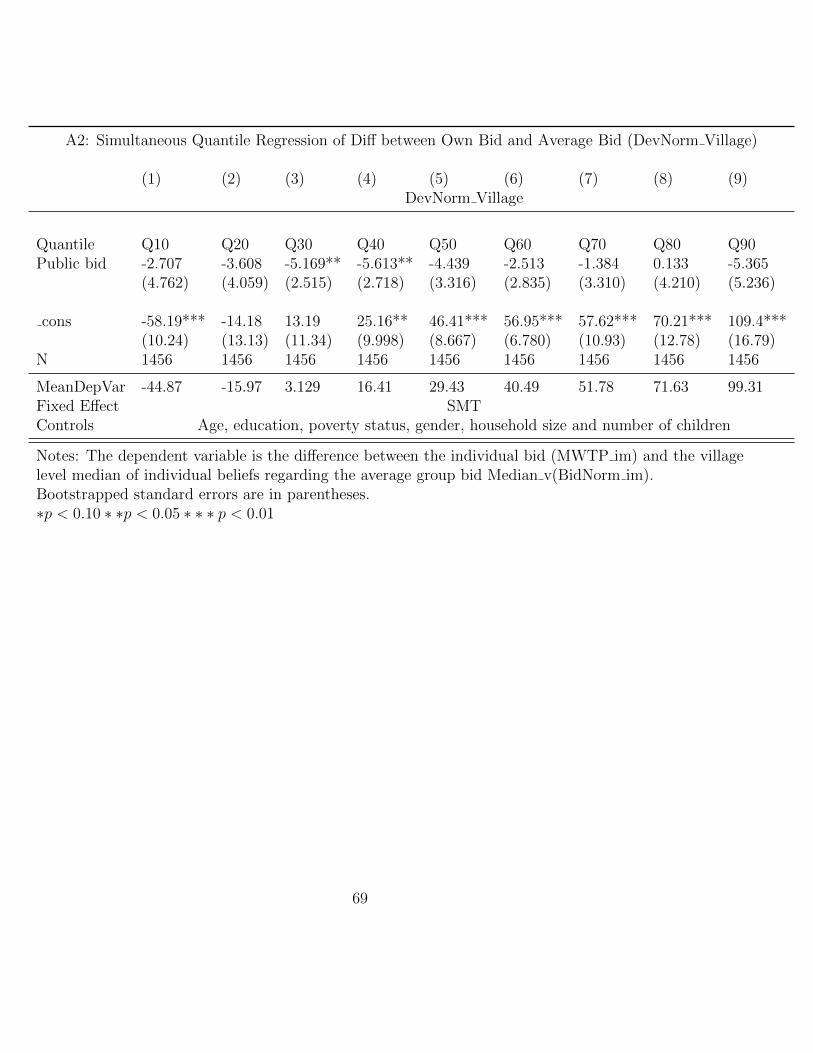
A2: Simultaneous Quantile Regression of Diff between Own Bid and Average Bid (DevNorm Village)
(1) (2) (3) (4) (5) (6) (7) (8) (9)DevNorm Village
Quantile Q10 Q20 Q30 Q40 Q50 Q60 Q70 Q80 Q90Public bid -2.707 -3.608 -5.169** -5.613** -4.439 -2.513 -1.384 0.133 -5.365
(4.762) (4.059) (2.515) (2.718) (3.316) (2.835) (3.310) (4.210) (5.236)
cons -58.19*** -14.18 13.19 25.16** 46.41*** 56.95*** 57.62*** 70.21*** 109.4***(10.24) (13.13) (11.34) (9.998) (8.667) (6.780) (10.93) (12.78) (16.79)
N 1456 1456 1456 1456 1456 1456 1456 1456 1456
MeanDepVar -44.87 -15.97 3.129 16.41 29.43 40.49 51.78 71.63 99.31Fixed Effect SMTControls Age, education, poverty status, gender, household size and number of children
Notes: The dependent variable is the difference between the individual bid (MWTP im) and the villagelevel median of individual beliefs regarding the average group bid Median v(BidNorm im).Bootstrapped standard errors are in parentheses.∗p < 0.10 ∗ ∗p < 0.05 ∗ ∗ ∗ p < 0.01
69

A3: Simultaneous Quantile Regression of Diff between Own Bid and Average Bid (DevNorm Village)
(1) (2) (3) (4) (5) (6) (7) (8) (9)DevNorm Village
Quantile Q10 Q20 Q30 Q40 Q50 Q60 Q70 Q80 Q90Public bid 26.22*** 8.572 11.21 12.05 21.00** 15.61 2.085 -0.650 -7.008
(9.978) (7.367) (9.467) (10.15) (8.270) (11.24) (10.73) (8.842) (7.089)
cons -46.17* -34.31 -21.96 4.404 -1.563 24.25 60.52* 106.0*** 113.6***(26.10) (30.92) (31.69) (31.22) (30.83) (33.60) (35.83) (32.24) (24.91)
N 350 350 350 350 350 350 350 350 350
MeanDepVar -74.51 -39.59 -24.04 -4.2 6.87 26.38 50.4 69.78 93.62Fixed Effects SMTControls Age, education, poverty status, gender, household size and number of children
Notes: The dependent variable is the difference between the individual bid (MWTP im) and the villagelevel median of individual beliefs regarding the average group bid Median v(BidNorm im).Bootstrapped standard errors are in parentheses.∗p < 0.10 ∗ ∗p < 0.05 ∗ ∗ ∗ p < 0.01
70
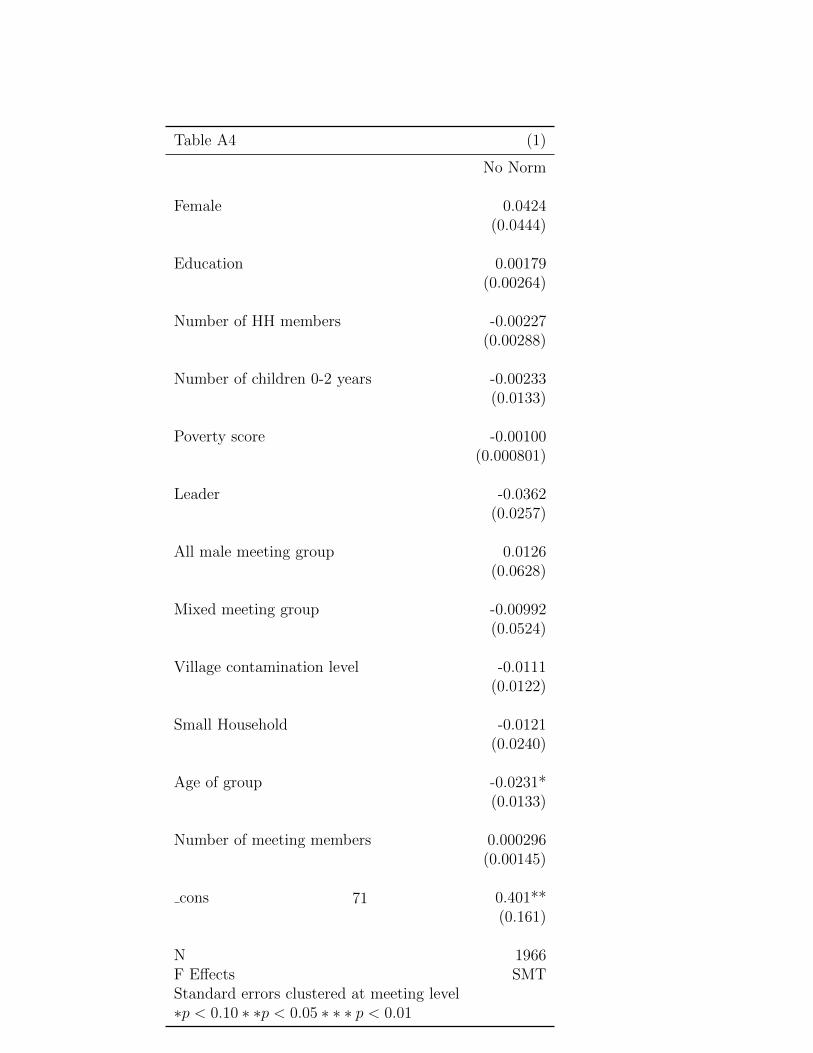
Table A4 (1)
No Norm
Female 0.0424(0.0444)
Education 0.00179(0.00264)
Number of HH members -0.00227(0.00288)
Number of children 0-2 years -0.00233(0.0133)
Poverty score -0.00100(0.000801)
Leader -0.0362(0.0257)
All male meeting group 0.0126(0.0628)
Mixed meeting group -0.00992(0.0524)
Village contamination level -0.0111(0.0122)
Small Household -0.0121(0.0240)
Age of group -0.0231*(0.0133)
Number of meeting members 0.000296(0.00145)
cons 0.401**(0.161)
N 1966F Effects SMTStandard errors clustered at meeting level∗p < 0.10 ∗ ∗p < 0.05 ∗ ∗ ∗ p < 0.01
71
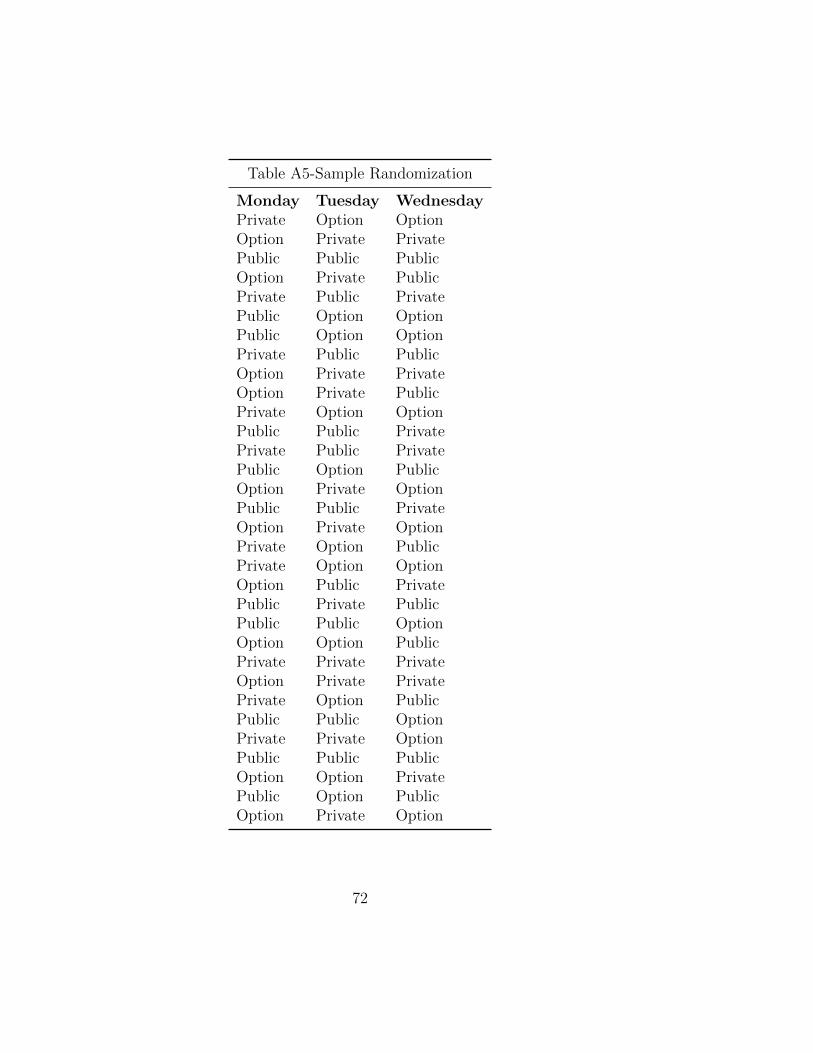
Table A5-Sample Randomization
Monday Tuesday WednesdayPrivate Option OptionOption Private PrivatePublic Public PublicOption Private PublicPrivate Public PrivatePublic Option OptionPublic Option OptionPrivate Public PublicOption Private PrivateOption Private PublicPrivate Option OptionPublic Public PrivatePrivate Public PrivatePublic Option PublicOption Private OptionPublic Public PrivateOption Private OptionPrivate Option PublicPrivate Option OptionOption Public PrivatePublic Private PublicPublic Public OptionOption Option PublicPrivate Private PrivateOption Private PrivatePrivate Option PublicPublic Public OptionPrivate Private OptionPublic Public PublicOption Option PrivatePublic Option PublicOption Private Option
72

Table A6: Balance Across High and Low Contamination Villages
Public High Cont Public Low Cont p-value p-val w. feFemale 0.491 0.556 0.118
(0.020) (0.026)Education (years) 2.210 1.024 0.000 0.418
(0.179) (0.152)Num of Household Members 7.651 8.455 0.004 0.456
(0.152) (0.211)Num of children 0-2 years 0.611 0.697 0.126
(0.040) (0.044)Head of Household 0.689 0.750 0.110
(0.019) (0.022)Poverty Score 25.876 21.524 0.000 0.807
(0.604) (0.612)Leader 0.148 0.125 0.383
(0.015) (0.017)All Male meeting group 0.215 0.237 0.648
(0.017) (0.022)All Female meeting group 0.135 0.109 0.495
(0.014) (0.016)Mixed meeting group 0.651 0.654 0.920
(0.019) (0.025)Village level contamination rate 2.602 6.795 0.000
(0.049) (0.065)High Contamination village 6.572 8.984 0.000
(0.067) (0.040)Age of community group 82.208 80.342 0.764
(1.532) (2.332)Number of meeting members 0.191 0.184 0.946
(0.016) (0.020)Expectation re. ave group bid 0.265 0.215 0.182
(0.018) (0.021)No expectations re. group bid 0.000 0.886 0.000 0.347
(0.000) (0.016)Small Hhold (<=5 members) 0.604 0.609 0.590
(0.020) (0.025)Low Know of Water Treatment 0.615 0.601 0.571
(0.016) (0.016)
73

Table A7: Balance Across Villages with and without Externalities Priming
Public No Ext Public Ext p-value p-val w. feFemale 0.573 0.456 0.001 0.646
(0.022) (0.023)Education (years) 1.687 1.794 0.232
(0.178) (0.176)Num of Household Members 7.926 7.996 0.722
(0.172) (0.180)Num of children 0-2 years 0.630 0.658 0.340
(0.039) (0.046)Head of Household 0.700 0.725 0.640
(0.021) (0.020)Poverty Score 23.378 24.954 0.127
(0.581) (0.671)Leader 0.137 0.142 0.641
(0.015) (0.016)All Male meeting group 0.167 0.281 0.000 0.257
(0.017) (0.021)All Female meeting group 0.087 0.165 0.001 0.003
(0.013) (0.017)Mixed meeting group 0.746 0.554 0.000 0.003
(0.020) (0.023)Village level contamination rate 4.449 3.975 0.006 0.126
(0.101) (0.114)High Contamination village 7.970 7.015 0.000 0.326
(0.075) (0.083)Age of community group 81.744 81.212 0.960
(1.869) (1.811)Number of meeting members 0.181 0.196 0.833
(0.017) (0.018)Expectation re. ave group bid 0.256 0.235 0.614
(0.020) (0.019)No expectations re. group bid 0.348 0.333 0.778
(0.021) (0.022)Small Hhold (¡=5 members) 0.644 0.567 0.027 0.241
(0.022) (0.023)Low Know of Water Treatment 0.615 0.601 0.571
(0.016) (0.016)
74