im digital2010
DESCRIPTION
TRANSCRIPT

I’M DIGITAL 2010 Report on consumer experience in Chile 1
Report on consumer experience in Chile
I’MDIGITAL2010

2 I’M DIGITAL 2010 Report on consumer experience in Chile
SHARE THIS STUDY
You can find the online version of this report at:
soydigital.ayerviernes.com
delicious

I’M DIGITAL 2010 Report on consumer experience in Chile 3
CONTENTS
Before you start
‘Til here
Who should read this report?
Digital Consuming
Digital Consuming: Users on motion
9 factors that define a good/appropiate consumer experience
Digital Consumer Experience Model
Experience Model
Accurate positioning and supply
Capturing and encouraging decision making
Logistics and uncertainty decrease
Methodology
Study Results
Results
Work Team
About AyerViernes
04
05
07
08
09
13
20
22
23
28
35
38
39
41
66
67

4 I’M DIGITAL 2010 Report on consumer experience in Chile
BEFORE YOU BEGINABOUT BRANDS STATUS IN DIGITAL MEDIA

I’M DIGITAL 2010 Report on consumer experience in Chile 5
‘Til Here
The end of on&offYes, it’s over. Consumers’ lives are different, there’s no such thing as “two lives”. Customers are not digital at night and analogue during the day. Customers live transversally and brands should learn from new behaviors to evolve with them.
Because there has never been so much irrefutable evidence about what your customers do, say, believe and comment about your products as nowadays.
Nothing will cause more change and affection for brands than the Experiences that they build to communicate their messages, and the only place where consumers will participate and shape these experiences is in digital space. From now on, your marketing plans cannot offer just the crumbs to “the digital” and keep loosing leadership positions in traditional media. Your duty is to turn messages into transversal experiences across media and therefore, create an underlying synergy.
From customer to competitorYour customers are reading, talking, discussing and recommending you. Now, they have the same tools your company has to positively or negatively influence among their peers. For this reason, you can not substract yourself, you must take the lead.
Today, the brand´s mission is to provide the digital spaces where customers can talk, collaborate, and share their insights, which are necessary for the constant reinvention of your services and products.
The customer is now your ally or your competitor, he/she is armed with blogs, social networks, micro-blogging and video streaming to say what you do not want to hear.

6 I’M DIGITAL 2010 Report on consumer experience in Chile
The end of advertisingNothing will remain as before. Those glorious broadcasting TV days were replaced by viral forms of communication. Esta frase no tiene sentido en castellano -Herbert Spencer 01/12/10 21:03 Did you ask for a touchpoint? Your local TV chain offers you thousands, YouTube and Facebook, millions. Telemarketing campaigns ended with the Twitter arrival and toys ceased to be important in the Happy Meal because we entertain ourselves with the Wii. The same as the film industry, and others like music, education, software, military, design, etc... advertising is at its last throes, like never before.
Advertising recently became aware that it never cared about the digital. And it was because it - the digital - was thought as something for garage geeks and annoying nerds who only cared about Usability and User Experience.
Today it’s too late, we are taking possession of the industry to challenge everything,
because everything is questionable and can be disputed. Advertising and its campaigns will give down if they stick to obsolote and sterile business models.
The audiences have changed, and therefore, if you want to sell shoes, chocolates or plane tickets, you must talk to micro-tribes, which are transversal to C3 and to ABC1, people who twitt while they walk, taking photos and uploading those “rare new hairstyles”, which collude through MSN and are consumed while chatting. They are the main characters of this story and they know it.
Advertising arrived late and had keep giving away spaces until the moment when there was no possible tactic left for traditional campaigns.
Greetings,
Jorge Barahona
CEO AyerViernes SA
‘TIL HERE
I’M DIGITAL 2010 Report on consumer experience in Chile 7
WHO SHOULD READ THIS REPORT?What’s the percentage of the annual advertising budget that I should reserve for the Web? Do my clients use social networks? Should I digitalize my brand or organization? How should I do it? These are some of many questions that professionals from all industries have every year meanwhile the clock ticks and your customers move away from you because they are digitalizing their lives and you are not noticing it.
This may be good or bad news, but customers co-exist in a digital environment, where the only ones who haven´t learned how to get into are trademarks.
Yes, your customers are no longer talking about “the Internet” or “being online”, they forgot to “click here” and won’t read the “about us” section, they expect you to be entertaining, relevant in content, in connectivity and possibilities, in a valuable conversations and all of this, at a human scale.
An invitation to all brandsAre you a communications team member? Then this report is aimed to you. The argument is simple: Today, as never before, there’s been such a significant convergency in areas such as today: advertising, marketing, business, innovation, design, public relations, strategic communications unite in order to create integrated communications for your consumers life´s.
Leave behind Philip Kotler’s niche models, by joining the multi-platform conversation of your customers. Don´t seek for further arguments, your clients are already digital. You have to change now: the future is happening today.

8 I’M DIGITAL 2010 Report on consumer experience in Chile
DIGITAL CONSUMPTIONUSERS ON MOTION

I’M DIGITAL 2010 Report on consumer experience in Chile 9
DIGITAL CONSUMPTIONUSERS ON MOTION
The use of digital media is rapidly becoming more diversified, what once obligated us to sit at our desks to deal with, today we can handle and carry it for consumption where and whenever we desire. People have taken a leading role in the creation of relevant messages, their mobility hits in real-time and goes a step ahead of the listless reaction to traditional media. They became content producers and their role became blurred because of consumption, therefore, people themselves act today as agents of persuasion by linking brands to their interpersonal networks.
It is no longer “a technology problem” that brands cannot relate with their users, because they are already talking to their peers about the experiences they are living minute by minute. A 47.9% of people recommended websites, videos or applications to their closer friends, 45% uploads photos and/or videos through different web services, and 34.7% manages or collaborates in blogs, website or forum; this speaks of avid users in the production and consumption of digital media.

10 I’M DIGITAL 2010 Report on consumer experience in Chile
DIGITAL CONSUMPTION: USERS ON MOTION
Figure 01: Relational Model between the brand and the userIN
SIGHTS
CON
VERS
ATIO
N
INFLUENTIAL
NEW
CON
SUMERS
EXPERIENCES
CONTENT
REIN
VENTIN
G CONTENT
RELATIONAL MODELBETWEEN THE
BRAND AND THE USER
It must be relevant Should work on Mulit-platforms
Raise new insights
World of Mouth technique
Stratify best niches
Relational Model Brand - ConsumerWe welcome bidirectional communication, which is centered from and to consumers (now also producers). Welcome to all experiences that transcend beyond thirty seconds. Our relational model proposes five steps and depicts how a brand must establish its communication so that it leverages experiences that help capture best practices (and more consumers) through digital interactions.
ContentThe content must be relevant and applied into strategic channels that avoid the disruption in the daily living of the consumer, providing and adding valuable conversations from beginning to end. The content is not always associated to the brand and related by corresponding terms based on client´s interests, preferences, tastes, and activities. Consequently, the balance is not to overwhelm the message as traditional advertising does.

I’M DIGITAL 2010 Report on consumer experience in Chile 11
ExperiencesBrands should look at technology convergence besides a computer or cell phone, the goal is to create multi-platform consumptive instances, which must be selected based on the content. Experience is the message.
ConversationsConsumers talk about brands even though they might not be literally present, this is because customers talk among themselves to learn more about a product or service. Word of Mouth is a natural effect of experience and digital media offers an opportunity to detect these conversations (good or bad) locating insights from the user to the brand.
InfluentialToday, unknown stakeholders of great reputation are evangelizing about certain brands, validating concepts through social instances where they share their comments and experiences. They are the ones that give bidirectionality to the message.
New ConsumersThey emerge from the influence of leaders, stratitified in niches, expanding the target and demanding the re-invention of the brand’s communicational efforts.
DIGITAL CONSUMPTION: USERS ON MOTION

12 I’M DIGITAL 2010 Report on consumer experience in Chile
Communication on the moveWorldwide, the first billion mobile phones was sold in 20 years, the second billion took only 4 years and the third only 2; whereas in African countries mobile penetration is reaching almost 100% in Kenya more than 7 million people make up for the lack of banking resources paying bills with their cellphones.
We are not talking about a future estimation, but the present, and about the assets available to people. It is only a matter of time in Chile, before the 64.2% of people who reported getting connected to the Internet via mobile phone, grows even more.
The most recurrent situations of people connecting through their mobile devices are related to particular contexts of use: 42.9% gets connected in emergencies, 41.7% when waiting for something or someone and more than a third of respondents, when they have something important to say or review,
whenever they have leisure time and when moving from one place to another.
According to respondents, the barriers that hold back the expansion of mobile Web, are mainly related to the prices of Internet access plans that most of the companies offer.
43.1% of those who don’t use mobile Internet perceive it is too expensive, also the first reason to access these services would be lower fares for 65.1% of people. (1) Chipchase, J. Mobile Phone & The Design of Mobile Money Services for Emerging Markets
Chipchase,J. Mobile Phone & The Design of Mobile Money Services for Emerging Markets
(1)
(1)
DIGITAL CONSUMPTION: USERS ON MOTION

13 I’M DIGITAL 2010 Report on consumer experience in Chile
9 FACTORSTHAT DEFINE A GOOD CONSUMING EXPERIENCE

14 I’M DIGITAL 2010 Report on consumer experience in Chile
The first rule you must follow when we want to know people’s behavior, is that we cannot conceive them separately from their consumption practices; even more if we reduce the definition of such practices only to the acquisition of certain assets.
To understand consumer experiences holistically, we must consider that this field encompasses far more issues than the mere purchase of the good and includes factors as the creation of the necessity, triggering purchasing desitions, levereging rich browsing experiences, product’s use and disposal.

I’M DIGITAL 2010 Report on consumer experience in Chile 15
THE 9 FACTORSDEFINING A GOOD CONSUMING EXPERIENCE
1. Intelligence2. Interface3. Variety4. Trust5. Speed6. Price7. Information8. Security9. Payment Methods
From free recommendations that the 782 respondets made about the best online stores that offer —of course— a better shopping experience, we identified 9 factors that reflect the key aspects that influence people leveraging a successful Online.
Consumer Experience. These are the 9 fundamentals that should support all digital structure that deals with some kind of interaction with consumers, being its appropiate implementation the starting point to establish the conditions for optimal consumer experience.

16 I’M DIGITAL 2010 Report on consumer experience in Chile
1 2
9 FACTORS THAT DEFINE A GOOD CONSUMING EXPERIENCE
Intelligencer: Do you know the customer? Can you anticipate his or her interests? If you do, you can provide an optimum experience and come in a closer relationship with your consumers by knowing their tastes and being able to present a fresh offer that they can be interesting for them.
Knowing to offer with assertiveness (what and when) and creating a navigation with contextual elements of value has a direct influence on the volume of products that users will purchase. Profiling customer’s interactions is about to taking into account their digital footprint as a model of their intent, desires and necessities and being able to react to them.
Interface: It was the aspect that people attributed greater importance since it is the visible face of all the processes and it can heavily affect user experience.
Cumbersome and aesthetically unappealing interfaces project lack of processes transparency and therefore mistrust.
Good interface design involves —in addition to reflecting a particular look & feel— offering all necessary elements with proper emphasis, and by doing this, constructing better interaction between customers and your service and outcomming all possible barriers that could alter the normal flow of online consumption.

I’M DIGITAL 2010 Report on consumer experience in Chile 17
3 4 Variety: One of the key advantages of digital spaces compared to companies with a physical presence, is their ability to have virtually unlimited stock which implies a far greater provision of products and services that may offer.
Market breadth is the advantage, reaching segmented audiences with more specific tastes and needs, plus the ability to cover a smaller but loyal niche. The digital economic model implies offering a rich variety to meet specific tastes, over exploitation of selling high volumes. Variety then allows a much more accurate segmentation; its no longer complete a store that is focused on certain target audience, but niche products are those that modulate the audience that consumes them and in turn the re-informs the future product inventory to offer.
Trust: Transparency and support of an online store are the two concepts that can leverege consumers’ trust of a brand. From here, you can generate responsible “bonds of trust” with the consumer during the online experience.
Many seek the support that offers a recognized brand or company, but this is not enough because the image is not based entirely offline. Its projection and its face-toface customer relation model may not be a reflected accordingly in the digital environment. Another relevant aspect related to trust, is the emphasis that should exist in the implied promise made by each company while interacting with their audience, seen in the after-sales service, logistics, consultation, support and guarantees delivered so as to reduce uncertainty with adequate feedback between purchase and final product delivery.
9 FACTORS THAT DEFINE A GOOD CONSUMING EXPERIENCE
18 I’M DIGITAL 2010 Report on consumer experience in Chile
5
6
7
Speed: The importance of speed lies in two aspects: one linked to the logistics company to operate the activation of a purchase and the second on the speed with which the site allows them to interact... how many steps must be followed? This is intrinsically related to interface design and the built environment to promote a logical experience, easy and natural.
Price: How much consumers pay online v/s shop offline? Here are relevant customer expectations about how prices should be treated.
Although it is more a factor of the business model than the experience itself, in general, the perception is that the lower prices are an important incentive for online consumption, you can find better deals online and comparison affordances exists to guide and support
smarter decision-making. The consumer seems to assume that online prices include some sort of discount, so it might be interesting to determine the ammount that must be discounted to encourage consumption according to a stratified user model.
Information: The level of detail on the products: pictures, videos, comments and ratings from other buyers, external reviews, links, among others, affect the reliability, as consumers seek approval relating to acquisitions. Another important aspect is the information on after-sales, ie estimates of delivery time and tracking of shipments, anything that involves transparently reveal the status of products and monitoring. Prices and costs should be explicit, clear and transparent. If there is enough information and is well presented, decreases and increases distrust the willingness to consume.
9 FACTORS THAT DEFINE A GOOD CONSUMING EXPERIENCE

I’M DIGITAL 2010 Report on consumer experience in Chile 19
8 9 Security: One aspect which is presented as a major barrier to entry for consumers is the security, expressed in the field of online payments, primarily credit cards.
The perceived safety when interacting with digital media companies and the projection of confidence associated, is one of the most relevant aspects for the consumer that could stimulate or inhibit consumption.
Payment Methods:People mention payment method as one of the significant factors that make shopping easier, which has to do with the site’s commercial policies. Many users that recommend certain retail stores, based their choice solely on the fact that they needed to have credit cards to buy, since they could use the corporate credit card that these big stores provide and offer as another payment alternative.
In essence, it is clear that more diversity in the ways to make the payment is relevant to the client, so it must be considered and to offer various options, particularly to provide an alternative to consumers who do not have traditional bank credit cards.
9 FACTORS THAT DEFINE A GOOD CONSUMING EXPERIENCE

20 I’M DIGITAL 2010 Report on consumer experience in Chile
THE EXPERIENCE MODELFOR THE DIGITAL CONSUMER

I’M DIGITAL 2010 Report on consumer experience in Chile 21
The Digital Consumer Experience Model is based on the need to define the standard flow for the customer/service interaction.
Understanding that individuals and their purchase experience is not limited only to a digital space, provides a wider vision identifying significant milestones that shape the flow of interaction that considers both online and offline aspects.

22 I’M DIGITAL 2010 Report on consumer experience in Chile
THE EXPERIENCE MODELFor the Digital Consumer
Figure 02:
Although the model represents
a sequential process, it doesn’t
necessarily reflect the precise
behavior for all users when
consuming online; this
overarching model depicts all
relevant factors with blury
boundaries and constant
flow, specilly blury between
Positioning and the Choice of
the Supplier.
FREE
OFF
ERIN
G
INTERNAL SUPPLY TRANSACTION
ONLINE
OFFLINE
ONLINE
OFFLINEPOSITIONING
80,2% have made online purchases
CHOISE OFTHE PROVIDER
ONLINE STORE
93,3% gets informed over the Internet before buying
Most buyedis technology, electronic equipment, airplane / bus / train tickets and shows tickets
WHAT HELPS?User reviews,
comparison with similarproducts, description of
Bloggers and othermedia and
product pictures
WHAT DO YOU NEED?This part of the process
is invisible to the user,so the feedback is essential
for his peace of mind
WHERE TO BUY?Amazon, Falabella, Ebay and París
HOW DO YOU PAY?Usually with a credit card,but department store cards, electronic transfer or with the delivery
WHAT ABOUT CHILE?LAN, Falabella, Ninguno and París
VISIBILITY LIN
E
ONLINE STORE
PURCHASEDECISION
ACTIVATIONREQUEST
DELIVERY
Missed deadlines
Common Problems
Excessive advertising, intrusive and out of context
SPAM
Recurring Problems
Lack safety
Common Problems
The product never arrives
Product features that do not correspond to the real product
Non-supported credit card
Extra charges and fraudulent use of credit card

I’M DIGITAL 2010 Report on consumer experience in Chile 23
Asking users “which store offers the best shopping experience?” Of all who responded (599), Amazon.com was ranked first for the second consecutive year within all considerations with 198 mentions. By far, though again in second place, Falabella got 82 mentions. Why is this store (Amazon.com) better regarded than its direct local competition?
The 8 stores recommended by users
ACCURATE POSITIONING AND SUPPLY
Although no major differences exists between the interfaces of the different competitors, there are many alternatives that could explain this phenomenon; including branding, but mainly we suggest two: firstly, trust in the brand that transcends the digital realm, and second, enormous technical and marketing efforts, both offline and online to spread the brand through various channels through which people relate with.
Recommendations by users compared to 2008
(2)
See previous year results: http://tinyurl.com/encuesta-digital2008(2)
Figure 01: Shows the Amazon undisputed leadership according to consumers
MERCADOLIBRE
LAN.COM
AMAZON.COM
FALABELLA
eBAY
PARIS
PCFACTORY
198
82
55
44
37
35
26
12Z-MART
599 RECOMENDACIONES
599 RECOMMENDATIONS
MERCADOLIBRE
LAN
AMAZON.COM
FALABELLA
EBAY
PARIS
PCFACTORY
Z-MART
198
82
55
44
37
35
26
12
Figure 02: Represents the recommendations between 2008 and 2009.
MERCADOLIBRE
LAN.COM
AMAZON.COM
FALABELLA
eBAY
PARIS
PCFACTORY
198
82
55
44
37
35
26
12Z-MART
599 RECOMENDACIONES
599 RECOMENDACIONES
MERCADOLIBRE
LAN.COM
AMAZON.COM
FALABELLA
EBAY
PARIS
PCFACTORY
Z-MART
198
82
55
44
37
35
26
12
YEAR 2009YEAR 2008
AMAZON.COM FALABELLA PARIS LAN
22.9%
33%
13.7% 13.6%8.4% 7.3% 2.2% 2.9%

24 I’M DIGITAL 2010 Report on consumer experience in Chile
Without doubt, offline advertising is an important factor in brand building and occupies a prominent place in the stage of “free offer”, it acts as a bridge between the positioning and choosing of a provider. It also helps to build presence and, hopefully, links people’s needs with the offering by placing advertising in places where users spend most of their time.
The 6 main actions performed by users on the Internet
What’s the status of digital advertising?Four of the first problems encountered when using Inter-net have to do with the stage of Supply Model and the first three are directly concerned with advertising, inclu-ding:
1) Invasive Ads
2) SPAM
3) Excessive Advertising
Figure 03: Showing 6 of the 21 most frequent activities people perform on the tInternet.
ACCURATE POSITIONING AND SUPPLY
CHECK MAILS 93,0%
91,1%
81,0%
79.2%
73,89%
72,9%
FINDING INFORMATION
READING NEWS
FILE DOWNLOADING
INSTANT MESSAGING / CHAT
SOCIALIZING (FACEBOOK, FOTOLOG, ETC)

I’M DIGITAL 2010 Report on consumer experience in Chile 25
The 5 major problems when navigating Similarly, statements that represent the views of users about digital advertising, are:
1) 40.8% “I think it is excessive”
2) 36.6% “I do not see”
3) 34.6% “usually not related to the context of what I’m doing on the Internet”
The feelings about online advertising
Figure 04: The 3 primary considerations of a total of 12, have to do with any kind of digital advertising. Figure 05: Describes the association of advertising mainly negative
attributes.
Slow browsing speed 49.7%
Excessive Advertisi
ng 55.3%
SPAM 58.4%
Unreliable Sources 33.4%
Invasive Ads 61.3%
ME MANTIENE OPORTUNAMENTE INFORMADO SOBRE PRODUCTOS O
SERVICIOS
GENERALMENTE NO SE RELACIONA CON EL CONTEXTO DE LO QUE ESTOY
HACIENDO EN INTERNET
NO LA VEO
CREO QUE ES NECESARIA
ME DA RESPUESTA A LO QUE ESTOY BUSCANDO
CREO QUE ES EXCESIVA 41.4%
36.1%
36.5%
23.6%
11.3%
2.7%
55,4%
50,8%
39,0%
35,0%
KEEPS ME INFORMED ON TIMELY PRODUCTOS OR SERVICES
GENERALLY NOT RELATED TO THE CONTEXT OF WHAT AM I DOING ON
THE WEB
Y DON’T SEE IT
I THINK IS NECESSARY
GIVES ME AN ANSWER TO WHAT I AM LOOKING FOR
I THINK ITS JUST TOO MUCH
2.7%
11.3%
23.6%
36.1%
36.5%
41.4%
ACCURATE POSITIONING AND SUPPLY
26 I’M DIGITAL 2010 Report on consumer experience in Chile
These statements plotted a precarious situation in which brands promote their products and services through various digital channels, specially when the site offers options appropriate for its modular offerings, monitor and direct a particular niche, involving a more assertive proposal to consumers (knowing what, how and when).
The current situation has to do with a medieval concept of digital advertising, wanting to dominate a larger area (wide segmentation), become disproportionately larger and try to draw attention instead to concentrate efforts in the niches that it is relevant and faithful.
Why is the Amazon.com case so important?In digital spaces, the number of competitors expands, and the consumers no longer navegate only the local market but international stores as well. They willing to persue the best offer no matter the country limits. All shops in the world fit into a browser and the restrictions that might inhibit the purchase have no longer to do with the cons-traints of local versus the foreign market, but with the factors that establish the conditions for a positive user experience, say: usability, accessibility and a design that contain all elements that stimulate the buying process.
From this perspective, the shopping experience genera-ted on Amazon.com is a reference for every user who has bought or simply browsed through this site.
Due to precision filters, recommendation, cross-selling, —stratification, among other features— make that huge inventory of goods as intelligent as it can be for each user.
ACCURATE POSITIONING AND SUPPLY

I’M DIGITAL 2010 Report on consumer experience in Chile 27
Opportunities for brands:
Propose assertively, finding competitive advantages, anticipate to specific niches with consistent offers.
Intelligent recommendation filters based on purchasing patterns and navigation behavior to achieve customer needs
Profiling, being aware of the particular nature every single digital consumers in some way self-defined by its consumption behaviors
Taking position through the generation of relevant conversation fields guided by the brand
Creating brand engagement based on good knowledge of customers

28 I’M DIGITAL 2010 Report on consumer experience in Chile
Linked by domestic supply and limits of the online store that consumers chose as suppliers, this space becomes crucial to pass two lines that deal with important decisions: first, trust in the supplier or product that you want to buy and second, the option of initiating a transaction at the respective store.
What do they consume?Among the products or services that most users have purchased over the Internet we have first technology, electronics and plain / bus / train tickets.
ENCHANTMENT AND ENCOURAGING THE DECISION
Figure 06: Technology, electronics and airplane / bus / train tickets are the items users buy most
Products and services purchased by users
TECHNOLOGY
ELECTRONIC EQUIPMENT
AIRPLANE / BUS / TRAIN TICKETS
SHOWS TICKETS
BOOKS / MAGAZINES
65,4%
55,4%
50,8%
39,0%
35,0%

I’M DIGITAL 2010 Report on consumer experience in Chile 29
A positive correlation is found between the purchase of tickets and the high value that has LAN.com 1 within Chilean online stores (see figure 16 on page number 56).
Certainly the concern of LAN.com for user experience is superior to other sites, while providing a solid platform for transactions that do not necessarily have to do with the purchase, but also harmless transactions.
In this sense, the interface and information design promotes an accurate and informed decision, showing clarity and projecting confidence in forthcoming stages - interal offer, transaction and logistics
Which elements build confidence in users?Looking a bit beyond the digital domain, we see that the relations between the users and the brands have changed. People ought to occupy a central role within the strategies
of companies, tending to fade the line between producers and consumers.
It’s all about empowering the capacity of people to act as influents and to develop relevant rols withing the productive processes Empoderizar It is the capacity of people to act as influencers and relevant actors within the productive processes of the marks. The aim is to create collaborative services, which need the direct and active participation of all stakeholders - including end users.
Friends, family and coworkers’ opinion are infuential information to people. It is of tremendous importance to consumers, specially because one of the biggest barriers is the confidence in online shopping mode. Wene someone of their peers or related circle purchase, it gives them incentives to break the barrier.
To create effective interfaces that encourage a purchase decision, there must be certain conditions, in addition to delivering tools that create an atmosphere of confidence and trust among the navigators.
ENCHANTMENT AND ENCOURAGING THE DECISION

30 I’M DIGITAL 2010 Report on consumer experience in Chile
The factors that influence a purchase decision
77,5%71,7%
59,9%
51,7%
43.4%
41.1%
24.9%
24.1%
IMAGES
USER RATINGS
MOST REQUESTED PRODUCTS
SITE’S DESCRIPTION
USER COMMENTS
VIDEOS
BLOGGER’S OR INDEPENDENT MEDIA DESCRIPTION
COMPARISON WITHSIMILAR PRODUCTS
Figure 07: 77.5% of people value the comments of other users as references for approval to make a purchase decision
Moreover, when 58.1% of people stated commenting on social networks and 47.9% recommended sites, videos or applications to their friends, which tells of a growing trend towards involvement and building relationships influence, extolling the active role they are taking people on consumption.
Your customers already antici-pated (and in real time)Users are more agile and proactive as what the brands belive they are; users have a relationship with the products within every second that last longer than the traditional 30-second ad. So probably most of the technology and electronics products available in traditional online stores have been already reviewed, described, rated and commented by any person or independent mean, which means that currently interfaces to support the buying decision are highly inefficient, while people have to go elsewhere to seek information in order to preform the purchase decision.
ENCHANTMENT AND ENCOURAGING THE DECISION

I’M DIGITAL 2010 Report on consumer experience in Chile 31
Thus, not being alert to real time behavior of the users, with attention and monitoring according to this dynamism means losing important opportunities for both business and optimizing customer relationships.
Although 80.2% of people have purchased over the Internet being that a significant percentage is even a greater proportion of people (93.3%) that have looked for information of product through Internet before making any purchase decision, which gives the digital content a benchmark tool of high value
TransactionThe link between the purchase decision and the activation order landmark, is the transaction; and is in this section of the process that probably mosts purchase discourage occurs.
The main reasons why electronic commerce purchase loses the realization at this stage, have to do with the incompatibility of browsers and operating systems that do not support the shop where they want to buy (26.1%, has had this problem).
In addition 24.7% of users expressed lack of feedback regarding the transaction, which promotes the uncertainty of the users and generates mistrust, two factors that discourage consumption and erode the relationship with the store.
ENCHANTMENT AND ENCOURAGING THE DECISION

32 I’M DIGITAL 2010 Report on consumer experience in Chile
The problems of online shopping
Figure 08: Main problems encountered by users when making purchases online
FRAUDULENT USE OF CREDIT CARD
LACK OF SAFETY CONDITIONS
NOT RECEIVING THE PRODUCT OR SERVICE
PRODUCT DAMAGED OR WRONG STATE
BREACH OF DELIVERY
DOUBLE BILLING
I HAD NO PROBLEMS
CREDIT CARD WAS INCOMPATIBLE WITH THE SITE
1.042 CONTESTADAS
295 SIN CONTESTAR
39.8%
29.1%
26.1%
24.7%
12.2%
12.2%
10.3%
8.2%
5.6%
4.8%
4.5%
1.2%
DELIVERY FAILURE OF YOUR BROWSER INCOMPATIBILITY WITH OPERATING
PRODUCT FEATURES DON’T REFLECTED REALITY
CARD CHARGES HIGHER THAN TO BE
SYSTEM IN USE OR LACK OF FEEDBACK ABOUT THE TRANSACTION
How users pay
PAYMENT PLATFORM (SERVIPAG, WEBPAY, PAYPAL, ETC)
CREDIT CARDS
GREAT SHOPPING CARDS
ELECTRONIC TRANSFER
ON DELIVERY
DEPOSITS
66.8%
56.5%
52.8%
29.1%
22.7%
18.4%
Figure 09: Means of payment used by users
ENCHANTMENT AND ENCOURAGING THE DECISION

I’M DIGITAL 2010 Report on consumer experience in Chile 33
What elements destroy the confidence of the consumers?If we consider the reasons why people have not shopped online, we see that 43.8% feel that the system does not give security and does not give confidence. This show an unfinished work of online stores to stimulate the digital consumer, which is about to propose basic safe and friendly interfaces. It must provide solid space generating a positive experience, which is the first step towards strengthening the percentage of people unfamiliar with the procurement of goods through the website.
Other problems that user survey and inhibiting digital consumer are:
Products that do not correspond to reality shown in the offer stage (see figure 08 on page 32)
Incompatibility of the site and the browsers or transactional problems (see page 31)
Credit card incompatible with the site
Lack of safe
Charges on the card different of what the site shows
Fraudulent use of credit card
Double billing
ENCHANTMENT AND ENCOURAGING THE DECISION

34 I’M DIGITAL 2010 Report on consumer experience in Chile
Opportunities for brands:
Deepen and broaden the relationship with audiences, people leave their practices reflected in consumer interaction with digital watermarks and thus becomes a task for the brand observing these insights and propose accurately and assertively satisfying customers needs.
Consider consumers as partners, co-construct with them the digital strategies of the brands included to encourage new and more powerful influencers. People are taking their time to interact with the companies, so that it is for brands to promote discussions of value and know how to listen.
Create interfaces that encourage consumption, which reduce mistrust and uncertainty.

I’M DIGITAL 2010 Report on consumer experience in Chile 35
The success of the stages of delivery and logistics, are more related to offline internal processes than with the interface and direct user action. In this scenario, brands should generate instant reports of the status and location of the order to convey confidence, display this information and give the users the possibility to claim their rights as consumers and enforce, for example, the delivery commitment of company.
Commitment of the brand, consumer confidenceSince the activation order a line of visibility is passed that establishes a new relationship with customers: people no longer have control over the purchase, emerging a bond of trust and bidirectional commitment with the business.
In the delivery stage we’re able to see more explicitly the integration of a complete model that includes digital and physical spheres. It is a relevant contact point because it is
LOGISTICS AND REDUCTION OF UNCERTAINTY
the material expression of what was previously acquired. The user has no choice but to surrender to the logistic system of the the company and hope that within the time specified, the product he bought will be delivered to his door.
60.2% of users reported having experienced one or more problems to make a purchase online, a figure that depicts the strategic digital immaturity of the brands and the poor consumer experience that is offered at most sites.
Moreover, knowing that within 9 factors that users identify as relevant to the digital consumer, two have to do with safety and confidence.
By specifying the main obstacles that consumers have found in their shopping experience, approximately one third of respondents (29.1%) stated that the failure fulfilling with the deadlines committed by the offeror was a serious problem.
A quarter of the respondents identified as a necessary impediment to the lack of feedback on service delivery

36 I’M DIGITAL 2010 Report on consumer experience in Chile
during the logistics process (24.7%). To a lesser extent (12%), but equally important, the receipt of a different product or with other features not shown by the original purchased piece, followed closely (8%) by nonreceipt of the product, create impediments to making the purchase in stores Online.
View Graph No. 08 on page 32.
LOGISTICS AND REDUCTION OF UNCERTAINTY

I’M DIGITAL 2010 Report on consumer experience in Chile 37
Opportunities for brands:r
Comply the implicit promise to deliver an order without problems, resulting in increased confidence in the processes offered by the brand and icreased loyalty of the customers.
Stimulate consumption and promote the digital medium as aneffective channel for online shopping, focused on reducing costsand customization.

38 I’M DIGITAL 2010 Report on consumer experience in Chile
METHODOLOGY
Media sites used as difusion:FayerWayer.comDaleAlbo.clZancada.cl192.clPolíticaStereo.tvIAB.cltuvidasana.cltecnoblog.cleducablog.clmaqueros.cl Twitterdatoblog.clMercadoCapital.clErresese.clVaquelita.cldokshor.comjbarahona.comYukei.netFacebook
The following report collects information about trends and changes in the Internet use in Chile. In essence it examinates the habits of Internet users and gives an overview point of where new trends are going.
If we wanted to sum up this study in one question, it would be: How does the chilean people use the Internet?
The exposure of the survey took place between August 10 and 13 October 2009, released in digital media or web, which enables a large number of users involved. Now we’ll show the detail of some figures obtained as a result of this report:
Polls validly answered: 1339
Confidence level: 97%
Error: 3%

I’M DIGITAL 2010 Report on consumer experience in Chile 39
SURVEY RESULTSFIGURES ANNEX AND COMPARATIVE ANALYSIS
40 I’M DIGITAL 2010 Report on consumer experience in Chile
The following pages gather the results of each questions asked on the survey, described qualitatively in order to support the analysis related to digital consumer experiences.
You can find a high quality version of each of these graphs in AyerViernes’ Flickr. The content of this work has been created under a Creative Commons “Attribution-Noncommercial-No Derivative license”.So, feel free to copy, distribute and transmit it according to the license conditions.
I’M DIGITAL 2010 Report on consumer experience in Chile 41
SURVEY RESULTS
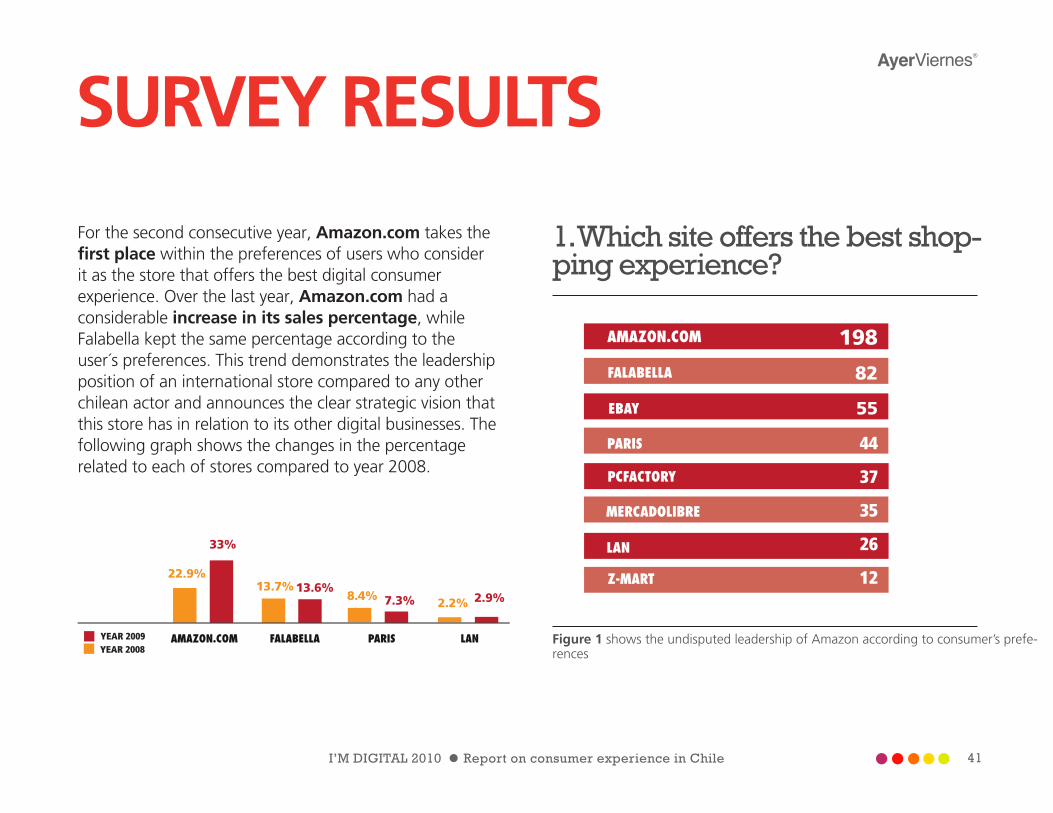
For the second consecutive year, Amazon.com takes the first place within the preferences of users who consider it as the store that offers the best digital consumer experience. Over the last year, Amazon.com had a considerable increase in its sales percentage, while Falabella kept the same percentage according to the user´s preferences. This trend demonstrates the leadership position of an international store compared to any other chilean actor and announces the clear strategic vision that this store has in relation to its other digital businesses. The following graph shows the changes in the percentage related to each of stores compared to year 2008.
1. Which site offers the best shop-ping experience?
Figure 1 shows the undisputed leadership of Amazon according to consumer’s prefe-rences
MERCADOLIBRE
LAN.COM
AMAZON.COM
FALABELLA
eBAY
PARIS
PCFACTORY
198
82
55
44
37
35
26
12Z-MART
599 RECOMENDACIONES
599 RECOMMENDATIONS
MERCADOLIBRE
LAN
AMAZON.COM
FALABELLA
EBAY
PARIS
PCFACTORY
Z-MART
198
82
55
44
37
35
26
12
MERCADOLIBRE
LAN.COM
AMAZON.COM
FALABELLA
eBAY
PARIS
PCFACTORY
198
82
55
44
37
35
26
12Z-MART
599 RECOMENDACIONES
599 RECOMENDACIONES
MERCADOLIBRE
LAN.COM
AMAZON.COM
FALABELLA
EBAY
PARIS
PCFACTORY
Z-MART
198
82
55
44
37
35
26
12
YEAR 2009YEAR 2008
AMAZON.COM FALABELLA PARIS LAN
22.9%
33%
13.7% 13.6%8.4% 7.3% 2.2% 2.9%

42 I’M DIGITAL 2010 Report on consumer experience in Chile
2. Since when do you use the Internet?
Preliminarily, the difference between the years 2008 and 2009 in the first 3 groups seems to be too small to establish a trend and confirms that the numbers of users have considerably grown, nevertheless, each year it is closer to the total of population.
However, there is a second interpretation based on the thinking of a parallel development between the Internet (medium), the different industries(organizations) and the users; a place in where all of them have been able to perceive the changes as much in platforms and digital tools as in the rise of new social networks, digitization of brands and organizations in recent years.
Figure 02: The majority of the people polled have been users of the internet for over 6 years.
Less than 1 year 1.1%
More than 6 years
61.3%
1 to 2 years 1.7%2 to 4 years 9.1%4 to 6 years 26.8%
1.333 CONTESTADAS
6 SIN CONTESTAR
SURVEY RESULTS
I’M DIGITAL 2010 Report on consumer experience in Chile 43
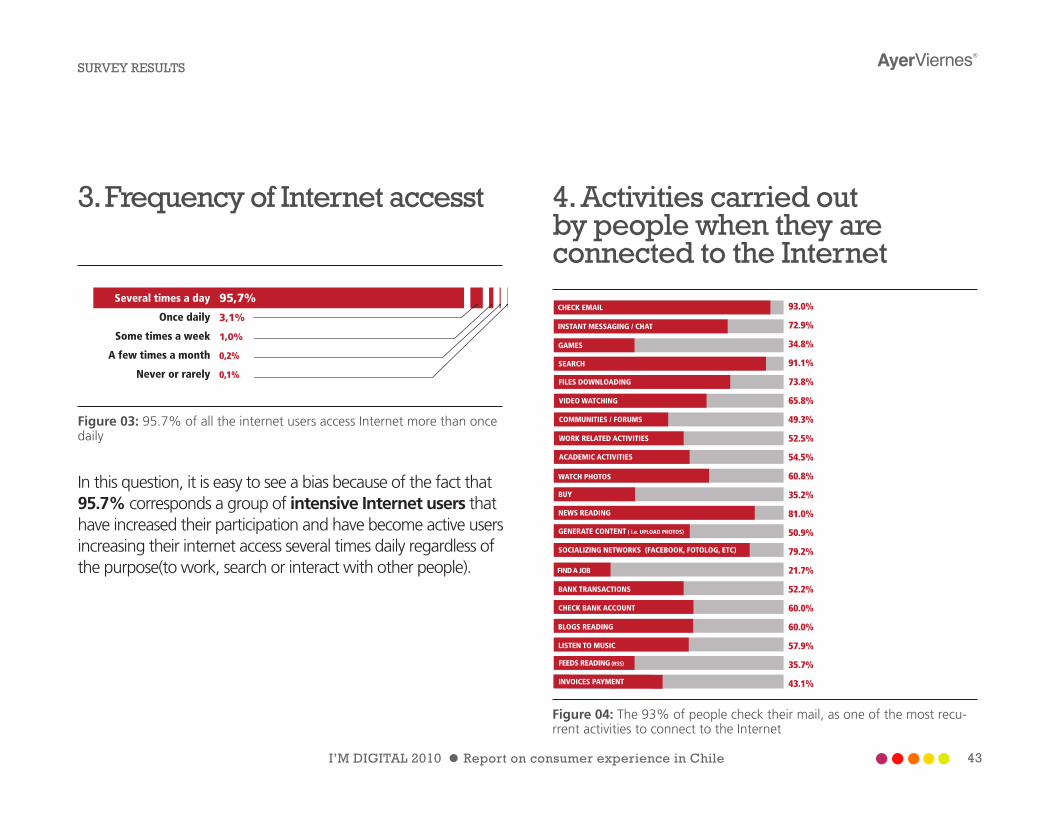
4. Activities carried out by people when they are connected to the Internet
3. Frequency of Internet accesst
In this question, it is easy to see a bias because of the fact that 95.7% corresponds a group of intensive Internet users that have increased their participation and have become active users increasing their internet access several times daily regardless of the purpose(to work, search or interact with other people).
Figure 03: 95.7% of all the internet users access Internet more than once daily
Figure 04: The 93% of people check their mail, as one of the most recu-rrent activities to connect to the Internet
Several times a day
Once daily
Some times a week
A few times a month
Never or rarely
95,7%
3,1%
1,0%
0,2%
0,1%
INVOICES PAYMENT
BLOGS READING
LISTEN TO MUSIC
FEEDS READING (RSS)
NEWS READING
GENERATE CONTENT ( i.e. UPLOAD PHOTOS)
SOCIALIZING NETWORKS (FACEBOOK, FOTOLOG, ETC)
FIND A JOB
BANK TRANSACTIONS
CHECK BANK ACCOUNT
VIDEO WATCHING
COMMUNITIES / FORUMS
WORK RELATED ACTIVITIES
ACADEMIC ACTIVITIES
WATCH PHOTOS
BUY
CHECK EMAIL
INSTANT MESSAGING / CHAT
GAMES
SEARCH
FILES DOWNLOADING
93.0%
72.9%
34.8%
91.1%
73.8%
65.8%
49.3%
52.5%
54.5%
60.8%
35.2%
81.0%
50.9%
79.2%
21.7%
52.2%
60.0%
60.0%
57.9%
35.7%
43.1%
PAGAR CUENTAS
LECTURA DE BLOGS
ESCUCHAR MÚSICA
LECTURA DE FEEDS (RSS)
LECTURA DE NOTICIAS
GENERAR CONTENIDOS (SUBIR FOTOS, ETC)
SOCIABILIZAR (FACEBOOK, FOTOLOG, ETC)
BUSCAR EMPLEO
TRANSACCIONES BANCARIAS
VER ESTADO DE CUENTA BANCARIO
VER VIDEOS
COMUNIDADES / FOROS
ACTIVIDADES LABORALES
ACTIVIDADES ACADÉMICAS
VER FOTOS
COMPRAR
REVISAR MAILS
MENSAJERÍA INSTANTÁNEA / CHAT
JUEGOS
BUSQUEDA DE INFORMACIÓN
DESCARGA DE ARCHIVOS
93.0%
72.9%
34.8%
91.1%
73.8%
65.8%
49.3%
52.5%
54.5%
60.8%
35.2%
81.0%
50.9%
79.2%
21.7%
52.2%
60.0%
60.0%
57.9%
35.7%
43.1%
SURVEY RESULTS

44 I’M DIGITAL 2010 Report on consumer experience in Chile
The table above shows very well the intensity of the various internet uses between the people polled. Though activities like checking e-mails, searching information and reading the news are in the top of the ranking, one of the most important aspects is the intensity of social networks use; take notice that 79.2% of people polled declare to use the
Internet to interact with other people. This percentage is important if it is considered that social networks have increased their presence in our country in these last 2 or 3 years focusing mainly on Facebook and Twitter. The level of penetration reached by these networks in a very short time is similar to the place taken by news sites and is not far from the use intensity level neither of emails nor of search engines. This trend was present in the same survey conducted in 2008 where the item “socializing” took the fifth place as one of the most requested activities carried out by users, and then, a year later would take the first place.
It gets interesting to know what is the level of presence and how brands,
organizations and media have positioned themselves thanks to social networks which have probably helped to the democratization and their use.
5. Problems presented while people surf internet
Figure 05: The first 3 points from a total of 12 are related to some kind of digital advertising. *Phishing
Low connection speed 49.7%
Lack of security
22.3%
Language barriers 1
0.6%
Lack of con�dentiality
Advertising excess 5
5.3%
Viruses 32.6%
SPAM 58.4%
Incomprehensible sites 18.5%
Sources are not reliable 33.4%
Intrusive 61.3%
Phishing* 13.9%
Browser
incompatibility 27.5%
21,9%
SURVEY RESULTS

I’M DIGITAL 2010 Report on consumer experience in Chile 45
Compared to year 2008, problems experienced by users are quite similar. Users continue detecting the presence of advertising quickly which impede to have a fluid navigation.
Advertisers are looking for new instances of communication through new digital formats (multi • platforms) but still use the classic advertising features that pretending to be something else. Maybe the biggest problem is not creativity, but rather the need to generate stratified communication with the different types ofexisting users.
This challenge was born in traditional media, but Internet has opened new doors thanks to its ability to create micro-segments, though advertisers and media still maintain the relationship of massive communication centrated on many similar users not considering digital efforts.
6. User perception of online advertising
Figure 06: User perception in relation to online advertising.Image Text
SURVEY RESULTSME MANTIENE OPORTUNAMENTE
INFORMADO SOBRE PRODUCTOS O SERVICIOS
GENERALMENTE NO SE RELACIONA CON EL CONTEXTO DE LO QUE ESTOY
HACIENDO EN INTERNET
NO LA VEO
CREO QUE ES NECESARIA
ME DA RESPUESTA A LO QUE ESTOY BUSCANDO
CREO QUE ES EXCESIVA 41.4%
36.1%
36.5%
23.6%
11.3%
2.7%
55,4%
50,8%
39,0%
35,0%
KEEPS ME INFORMED ON TIMELY PRODUCTOS OR SERVICES
GENERALLY NOT RELATED TO THE CONTEXT OF WHAT AM I DOING ON
THE WEB
Y DON’T SEE IT
I THINK IS NECESSARY
GIVES ME AN ANSWER TO WHAT I AM LOOKING FOR
I THINK ITS JUST TOO MUCH
2.7%
11.3%
23.6%
36.1%
36.5%
41.4%

46 I’M DIGITAL 2010 Report on consumer experience in Chile
For most users, online advertising is just excessive and it is not related to the activity that they are doing. On the other hand, the 36.6% of people polled declared not see online advertising. These 3 points above show that online advertising begins to be rejected by people polled, and finally not reaches completely its purpose of informing, and even less to reduce the communication gap existing between audiences and advertisers.
It is because of them that users declare to block pop-ups in order to avoid publicity which is in general boring and unremarkable, and for others the way it appears is simply “disrespectful”, comparing it to the “second 31 of a commercial” that just seeks to encourage, in a synthetic and inappropiate way, ads created for traditional media.
Others, however, recognize that online advertising is a “necessary pain” represented in this survey by 23% of people polled who selected this option. A “necessary pain” that is useless because makes people less receptive to online advertising who only want to continue shopping or informing themselves without being
interrupted with new offers on every click that they do.
Finally, a small group feels it is relevant and even positive. In general, they are agree with ads of the page where they are browsing while they inform about special promotions or discounts related to own products.
Here, we turn to the initial problem what is the level of segmentation chosen for some types of promotions and how important can be for the users have a stratification so wide.
SURVEY RESULTS

I’M DIGITAL 2010 Report on consumer experience in Chile 47
7. Activities carried out by people in social networks
Figure 07: Represents the level of collaboration and use of social networks
The main activities undertaken by users in social networks are related to media like watching videos, uploading and downloading images and reading blogs known as the main Social Media formats. We should think that the intensive use of these social platforms is favourable because they provide a good place to put advertising, allowing in many cases to have a better knowlegde of the users’ preferences.
This is the case of Facebook. Through its advertising system it allows to do segmentation using different variables as interests, activities and preferences, though it can not still be well used as it presents two main problems.
(1) Not all users complete their profile, which makes difficult to choose correctly targets.
(2) Many advertisers still prefer to gain wider audiences ensuring a big participation rather than being loyal to just one niche.
Another major advantage of social networks is that, as Figure 07 shows, many people use them to recommend
SURVEY RESULTS
Manage / contrib
ute with a blog, website, forum, etc 3
4.7%
Comment on blogs, forums, videos, p
hotos 58.1%
Read blog and independent resources 66.9%
Upload photos, videos to internet 45.0%
Broadcast at least o
nce a day what i’m
doing or thinking 38.6%
Keed favorite under m
y own clasi�cation (ca
tegorize, tagging) 39.4%
Watch videos, photos on internet 70.2%
Recommend sites, videos or aplica
tions to my fri
ends 47.9%
Join to groups or causes on social networks 31.9%
Rank products and videos19.3%
None of the above 6.7%

48 I’M DIGITAL 2010 Report on consumer experience in Chile
other sites to their friends, people with who they usually have common interests and where trust is important to validate the information before taking any decision.
This effect, typical of the known as “Word of Mouth”, become a digital space more linked to “The Word of Mouse”, where users recommend, relate, validate, tag via Internet, a place where conversations are open and honest, but also, where many organizations still do not are willing to hear the dialogue of markets, increasing the distance between them and their users / consumers ignoring the convergence of multi-conversational platforms existing today, returning to one-way type of communication.
8. Using the Internet to make a purchase decision
Figure 08: 93.3% of users have made their purchase decision based on the information obtained in the internet
Yes 93.3%
No6.7%
SURVEY RESULTS

I’M DIGITAL 2010 Report on consumer experience in Chile 49
Regarding the previous question, it virtually remains the same proportion than last year, increased slightly but not enough to claim that there is a substantial increase in the number of people who query, verify or get information online before buying.
Comments, voting, rankings are some of the features that enhance purchase decisions on the Internet. As they develop better eCommerce services (including variety of inventories and better recommendation filters) experience will be enhanced. These services will probably lower their function as mere information channels to become totally transactional services, filling the big gap between product search and delivery.
9. Have you purchased online?
sí 80.2% no19.8%
80.2%have bought something at least once
Figure 08: Shows the number of users who report having ever purchased on the Internet
SURVEY RESULTS

50 I’M DIGITAL 2010 Report on consumer experience in Chile
In connection with purchases online the proportion is virtually unchanged from a year earlier, being a 80.2% the number of users who have ever shopped online.
While this number should increase in coming years through the digitization of the buying process, the first impulse should come from the same stores to achieve a complete experience (based on the answers given by respondents).
10. Items that users value to make a purchase decision
IMAGES
USER VOTES
RANKING OF THE MORE DEMANDED PRODUCTS
IN-SITE DESCRIPTION
USER REVIEWS
VIDEOS
41.1%
77.5%
59.9%
71.7%
24.9%
51.7%
43.4%
24.1%
DESCRIPTION OF A BLOGGER OR INDEPENDENT MEAN
COMPARISON WITH OTHER SIMILAR PRODUCTS
Figure 10: 77.5% of people value the comments of other users as references to make a purchase decision
SURVEY RESULTS
I’M DIGITAL 2010 Report on consumer experience in Chile 51
As we´ve seen in the qualitative analysis, the information held by customers on products is one of the most important variables to consider in assessing the online consumer experience that gives them a particular store. Again becomes relevant the views of their peers as a source of validation, given the sincerity with which itoperates.
Most of the renouned international stores have promoted transparency by creating spaces for open conversation, voting systems, recommendations, ratings, among others initiatives with the goal of delivering tools, more real than a Focus Group, and even take more relevance to the stores —depending on the degree of commitment that exists in wanting to improve your shopping experience— but also helping to redirect business model of a store.
This can be illustrated when a user generates a comparison with similar products, which some sites can do, delivering a simplified comparison chart. One functionality, that to the eyes of a user is minimal, could improve the experience because the system could cross more data of the purchase behavior through special filters - functionality that allows
better replicate the physical shopping experience that usually the consumer contemplates several alternatives and weigh their properties according to its own scale of assessment.
SURVEY RESULTS
52 I’M DIGITAL 2010 Report on consumer experience in Chile
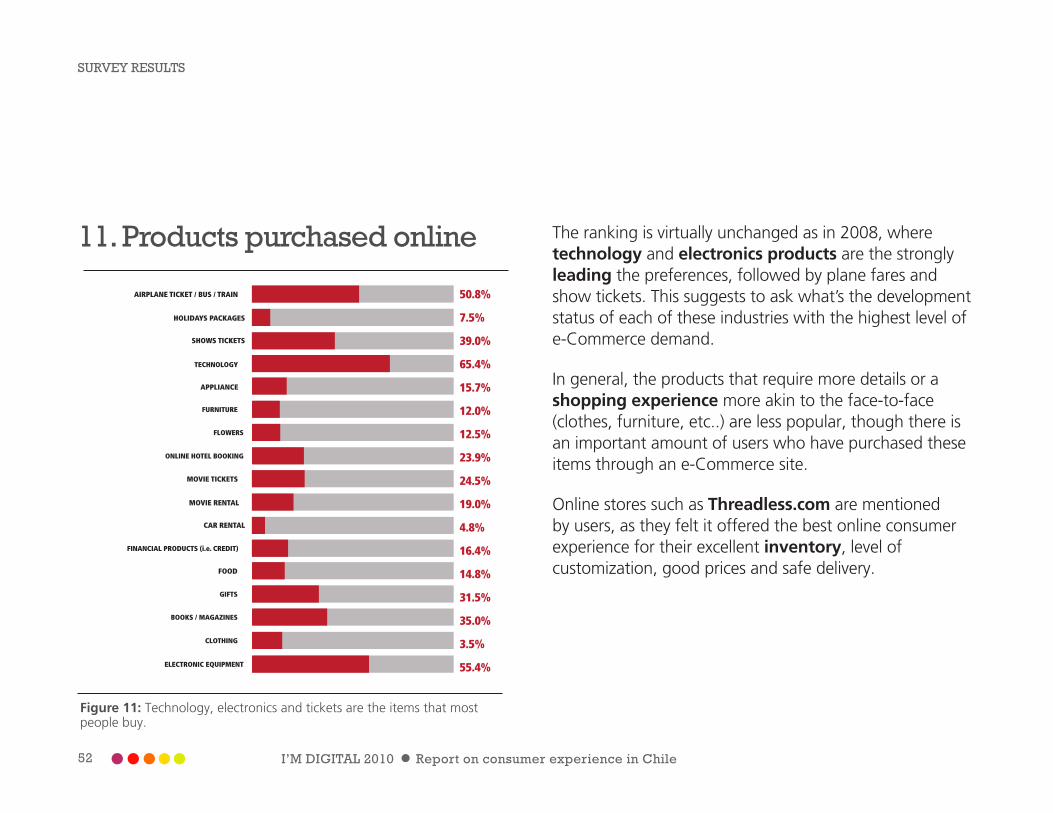
11. Products purchased online
FURNITURE
FLOWERS
ONLINE HOTEL BOOKING
AIRPLANE TICKET / BUS / TRAIN
HOLIDAYS PACKAGES
SHOWS TICKETS
TECHNOLOGY
APPLIANCE
50.8%
7.5%
39.0%
65.4%
15.7%
12.0%
12.5%
23.9%
24.5%
19.0%
4.8%
16.4%
14.8%
31.5%
35.0%
3.5%
55.4%
GIFTS
BOOKS / MAGAZINES
CLOTHING
ELECTRONIC EQUIPMENT
MOVIE TICKETS
MOVIE RENTAL
CAR RENTAL
FINANCIAL PRODUCTS (i.e. CREDIT)
FOOD
Figure 11: Technology, electronics and tickets are the items that most people buy.
The ranking is virtually unchanged as in 2008, where technology and electronics products are the strongly leading the preferences, followed by plane fares and show tickets. This suggests to ask what’s the development status of each of these industries with the highest level of e-Commerce demand.
In general, the products that require more details or a shopping experience more akin to the face-to-face (clothes, furniture, etc..) are less popular, though there is an important amount of users who have purchased these items through an e-Commerce site.
Online stores such as Threadless.com are mentioned by users, as they felt it offered the best online consumer experience for their excellent inventory, level of customization, good prices and safe delivery.
SURVEY RESULTS

I’M DIGITAL 2010 Report on consumer experience in Chile 53
12. Number of online purchases in the last 3 months
Figure 12: 33.5% of people have made a purchase online in the last 3 months
13. Which one (s) of these tran-sactions have you made byInternet?
Figure 13: The largest percentage of transactions has to do with banking issues
244
One 22.3%
2-3 33.5%4-5 14.0%
6 or more 14.5%
None 15.8%
Basic services payment (li
ght, water, gas) 5
7.1%
Cable / Telephone services payment 51.4%
Bank loan19.6%
Legal paperwork 39.0%
Bank transactio
ns 76.9%
Concessioned Highways p
ayment 29.4%
Haven’t made any tra
nsaction 10.8%
Tax declaration 64.9%
57.1%
SURVEY RESULTS
54 I’M DIGITAL 2010 Report on consumer experience in Chile
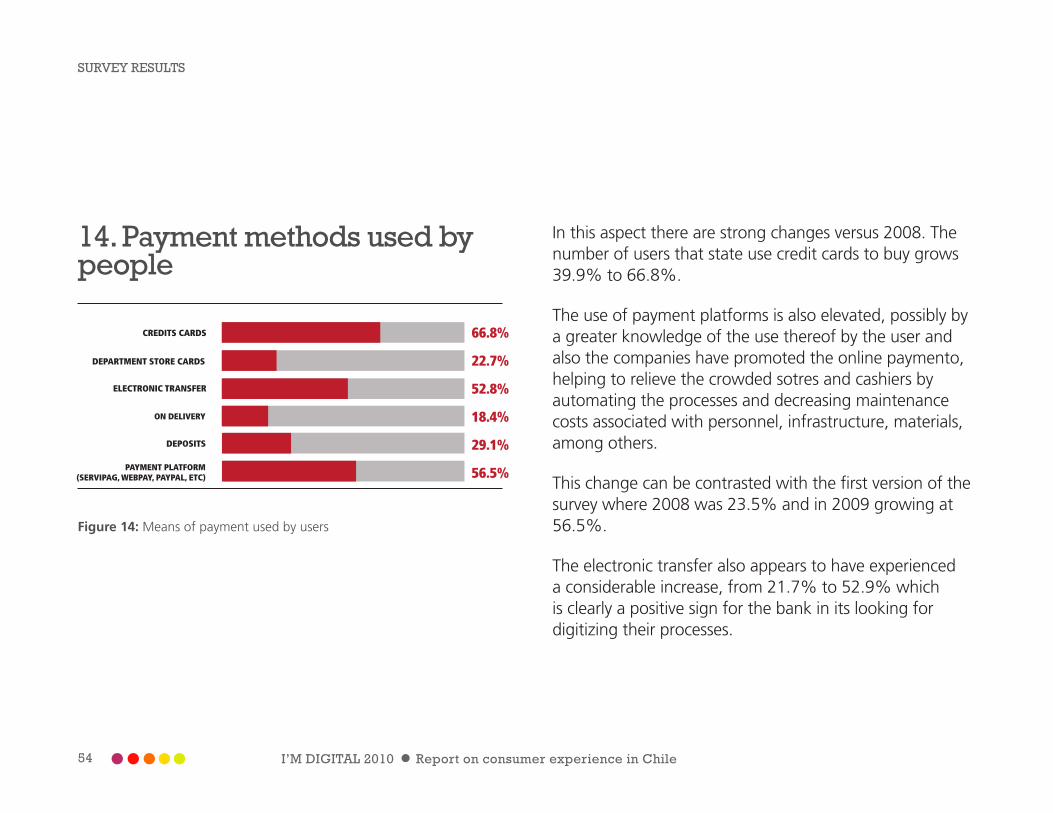
14. Payment methods used by people
CREDITS CARDS
DEPARTMENT STORE CARDS
ELECTRONIC TRANSFER
ON DELIVERY
DEPOSITS
66.8%
22.7%
52.8%
18.4%
29.1%
56.5%PAYMENT PLATFORM(SERVIPAG, WEBPAY, PAYPAL, ETC)
Figure 14: Means of payment used by users
In this aspect there are strong changes versus 2008. The number of users that state use credit cards to buy grows 39.9% to 66.8%.
The use of payment platforms is also elevated, possibly by a greater knowledge of the use thereof by the user and also the companies have promoted the online paymento, helping to relieve the crowded sotres and cashiers by automating the processes and decreasing maintenance costs associated with personnel, infrastructure, materials, among others.
This change can be contrasted with the first version of the survey where 2008 was 23.5% and in 2009 growing at 56.5%.
The electronic transfer also appears to have experienced a considerable increase, from 21.7% to 52.9% which is clearly a positive sign for the bank in its looking for digitizing their processes.
SURVEY RESULTS

I’M DIGITAL 2010 Report on consumer experience in Chile 55
15. Problems encountered when buying online.
FRAUDULENT USE OF CREADIT CARD
LACK OF SAFETY CONDITIONS
LACK OF FEEDBACK ACOUT THE TRANSACTION
NOT RECEIVING THE PRODUCT OR SERVICE
PRODUCT DAMAGED
DELIVERY TIME EXCEEDED
8.2%
12.2%
5.6%
29.1%
4.8%
1.2%
10.3%
24.7%
4.5%
26.1%
39.8%
12.2%
DOUBLE BILLING
HE HAD NO PROBLEMS
CREDIT CARD WAS INCOMPATIBLE WITH THE SITE
PRODUCT FEATURES DON’T MATCH REALITY
INCOMPATIBILITY WITH BROWSER OR OPERATING SYSTEM IN USE
CARD CHARGES HIGHER THAN THE ONE SHOWED BY THE SITE
Figure 15: Major problems encountered by users when shopping online
We can see that the main problems that users have are related to interface design, an item that totally depends on the services providers. This should be able to answer how a brand is projected through a good proposal interface allowing to create a positive shopping experience for users.
In parallel, non-compliance deadlines, lack of feedback on the transaction, incompatibility of systems and the lack of truthful information of products, are the most frequent problems. All these are related to controllable aspects of the consumer experience, as the companies can and must invest time and resources to improve if their goal is to expand the online customer base.
One of the most important fact-findings of this question is that security issues as the fraudulent use of credit cards, which a priori appears to be highly relevant, occur in only 1.4% of those who have made purchases online.
This suggests that although the perception is that there is lack of security in online transactions, only a small percentage excperienced the problem.
SURVEY RESULTS

56 I’M DIGITAL 2010 Report on consumer experience in Chile
Thus, the mission must be to break down this prejudice giving enough information to satisfy the user by telling him that the appropriate measures are taken to ensure the security of his transactions. Billing errors, though rare, do not represent a security issue or bank fraud, but internal problems of the information systems of each company.
16. Chilean site that offers the best Online Consumer Experience
Figure 16: 23% of users believe that “None of the sites listed offer a good shopping experience online
Easy 2.4%La Polar 0.8%
LAN 46.5%
Ripley 9.0%
Johnson’s 0.3%
Lider 1.1%
Paris 21.2%
Sodimac 4.4%
Falabella 37.8%
Jumbo 7.2%
None 23.0%
SURVEY RESULTS
I’M DIGITAL 2010 Report on consumer experience in Chile 57
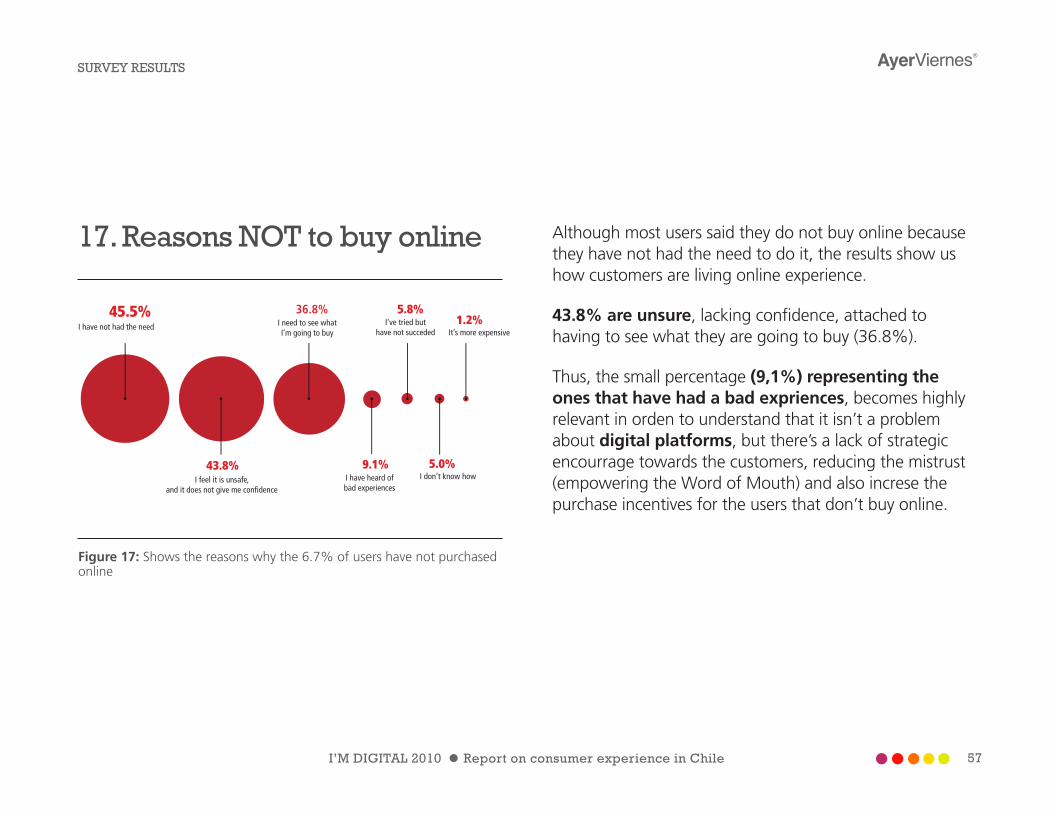
17. Reasons NOT to buy online
Figure 17: Shows the reasons why the 6.7% of users have not purchased online
Although most users said they do not buy online because they have not had the need to do it, the results show us how customers are living online experience.
43.8% are unsure, lacking confidence, attached to having to see what they are going to buy (36.8%).
Thus, the small percentage (9,1%) representing the ones that have had a bad expriences, becomes highly relevant in orden to understand that it isn’t a problem about digital platforms, but there’s a lack of strategic encourrage towards the customers, reducing the mistrust (empowering the Word of Mouth) and also increse the purchase incentives for the users that don’t buy online.
I have not had the need
I don’t know how
It’s more expensive I need to see what I’m going to buy
I have heard of bad experiences
I’ve tried but have not succeded
I feel it is unsafe, and it does not give me con�dence
45.5%
43.8%
36.8%
9.1%
5.8%
5.0%
1.2%
SURVEY RESULTS

58 I’M DIGITAL 2010 Report on consumer experience in Chile
18. Have you used the mobile Internet?
Sí 64.2%
No 35.8%
64.2%35.8%
YesNo
Figure 18: A 64.2% of respondents reported getting connected to the Mobile Internet
19. What activities do you carry out when you connect to themobile Internet?
DOWNLOADING / LISTEN MUSIC
UPLOAD AND SHARE PHOTOS
CHAT
SEND / RECIEVE E-MAILS
WRITE/UPDATE BLOGS
SURFING THE WEB JUST FOR FUN
INFORMATION SEARCH (WEATHER, NEWS, ETC.)
MAP SEARCH (ADDRESSING, ROUTING)
70.2%
13.0%
44.1%
50.7%
49.6%
14.1%
21.0%
36.0%
57.4%
8.4%
19.1%
28.0%
32.8%
VISIT SOCIAL NETWORKS (FACEBOOK, OTHERS)
ONLINE GAMES
BANKING SERVICES
MICROBLOGGING
GEOLOCATION
Figure 19: Shows the activities that mobile users carry out
SURVEY RESULTS

I’M DIGITAL 2010 Report on consumer experience in Chile 59
The popularization of mobile equipment has led to a Hyperconnectivity of users, where the undisputed leader in terms of activities is e-mail. Probably, what it has helped his bid has been the explosion in the market for Smartphones that allow greater responsiveness in their connectivity.
Mobile Internet remains primarily a tool of work and productivity for businesses and telecom companies have promoted the recruitment of their plans with dedicated advertising campaigns.
Furthermore, it is noteworthy that the use of social networking via mobile Internet appears un second place, unlike what happens with the use of Internet search engines traditional, indicating that they prefer to socialize through their mobile equipment and do the search on the second screen (computer). If a make a cross-tabulation is made between users of mobile Internet and the age of the respondents we observe that 36% are between 18 and 24 years and 46% are between 24 and 32 years, the first of these most used social networks and also
shows that in some cases are already accessing mobile internet plans to maintain its connection to their communities.
SURVEY RESULTS

60 I’M DIGITAL 2010 Report on consumer experience in Chile
20. Instances when users access mobile Internet
Figure 20: Represents the movement of mobile Internet connection with the navigation context
Apart from users who use mobile web connection in emergency contexts - who use it mainly to send e-mails - we see a strong use of this service during the downtimes or idle (when people use the public transport, while they are waiting for someone).
Interesting thought: how can a brand build entertaiment content for mobile users who are using their phones during idle time?
100%
When I have something important to say / review
I am always connected in any place
42.9%
41.7%
38.4%
While I wait for something or someone
35.4%When I’m transported from
one place to another
31.9%
20.1%
14.7%Emergencies Every tome I have
planty of timeAt work / of�ce
SURVEY RESULTS

I’M DIGITAL 2010 Report on consumer experience in Chile 61
21.Why don’t users access to mobile Internet?
Figure 21: Main reasons why users do not use the Mobile Internet
The entry barrier remains the very high prices for consumers who want mobile Internet access (43.1%). This increases telecom companies’ efforts to gain new customers.
But you can clearly see that 37.7% don’t need a mobile web connection, making duplicate efforts of sales and marketing areas to provide more accessible plans, proving to be useful for those who do not see the need to be connected to the Web from the third screen.
It’s too expensive
I don’t need it
My cell phone isn’t capable I did once but didn’t found it ef�cient
Don’t have cell phone
43.1%
37.6%
33.2%
11.2%I tried but failed,
I didn’t tried again
5.9%
2.5%
SURVEY RESULTS

62 I’M DIGITAL 2010 Report on consumer experience in Chile
22. What reason do you think would motivate you to accessthe Internet using your cell phone?
CHEAPER FARES
FASTER INTERNET
MORE MOBILE SOTES OF INTEREST
NOTHING
65.1%21.8%
34.3%
17.6%
24.4%
MOBILE SITES EASIER TO USE/MORE FRIENDLY
Figure 22: Motivations to increase the number of mobile Internet users
It is clear that for potential mobile Internet users, the price is the key variable to get started.
A relevant aspect is that 39.2% of people polled, who are under 24 years, say that lowering mobile internet plans would motivate them to use it, which means there is a potential market waiting for this service.
In parallel, another relevant point is that 24% of the people polled say that “Nothing can motivate them to access mobile Internet”, which means that in the market still exists a lack of digital and transversal maturity from users on this technology.
SURVEY RESULTS

I’M DIGITAL 2010 Report on consumer experience in Chile 63
SURVEY RESULTS
23. Country of Residence
Figure 23: All the people polled who participated on this survey are Chilean
24. Please indicate your area of residence
Figure 24: The Metropolitan area concentrates the bulk of participants in this survey
REGIÓN METROPOLITANA 61,2%
18,7%
5,1%
2,5%
2.1%
1,6%
VALPARAÍSO
BÍO-BÍO
ANTOFAGASTA
MAULE
LA ARAUCANÍA
64 I’M DIGITAL 2010 Report on consumer experience in Chile
SURVEY RESULTS
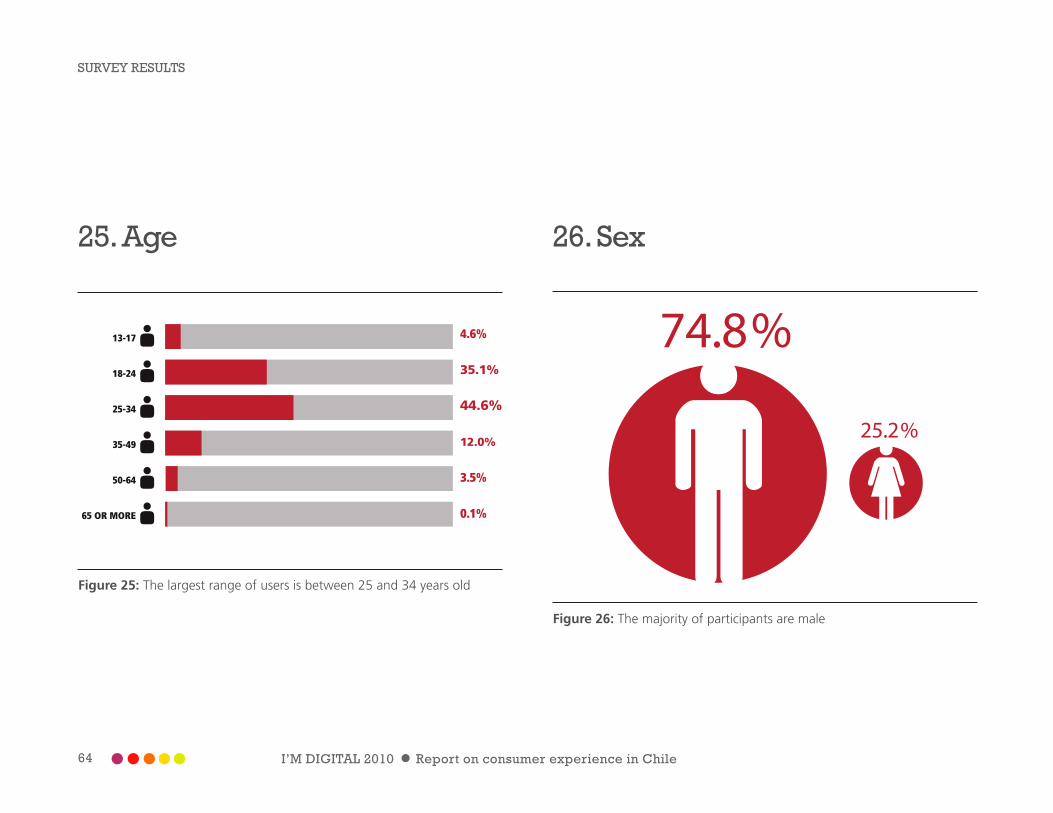
25. Age
Figure 25: The largest range of users is between 25 and 34 years old
26. Sex
13-17
18-24
25-34
35-49
50-64
65 OR MORE
4.6%
35.1%
44.6%
12.0%
3.5%
0.1%
74.8%
25.2%
1.333 CONTESTADAS
6 SIN CONTESTAR
74.8%25.2%
Figure 26: The majority of participants are male

I’M DIGITAL 2010 Report on consumer experience in Chile 65
27. Education Level
Figure 27: The 59.3% of people polled have higher education
28. Average income
PRIMARY
SECONDARY
TECHNICAL DEGREE
COLLEGE
PROFESSIONAL DEGREE
MASTER
3.7%
10.6%
8.3%
59.3%
9.6%
7.0%
1.4%DOCTOR
1.265 ANSWERED
74 NO ANSWER
159.000 or less 26.4
%
160.000 - 400.000 18
.1%
401.000 - 650.000 17
.2%
651.000 - 900.000 12
.0%
901.000 - 1.100.000 9.
2%
1.101.000 or more 17
.1%
Figure 28: The 26.4% reported having a mean income equal to or less than $ 159,000 Chilean pesos
SURVEY RESULTS

66 I’M DIGITAL 2010 Report on consumer experience in Chile
Jorge Barahona
Digital Experience Designer. Professor of User-Centered Design,
School of Architecture and Design, PUCV. Professor of Applied
Communication Master of UDD.
Herbert Spencer
Interaction Designer, Professor, School of Architecture and Design
PUCV. MDes Interaction Design, Carnegie Mellon.
Pedro Arellano
AyerViernes Head of Research Area. Pyschologist in User Experience
Research. MS in Consumer Behavior, UAI. Professor of Applied
Communication Master of UDD.
Katherine Exss
Information Architect and Research Experience Users. PUCV graphic
designer.
Rodrigo Frías
Communicator expert in brand building in digital environments.
Publicist, MS un Applied Communication, UDD. Professor of Digital
Communication and Digital Media Marketing, UPA.
TEAM WORKPaulina Meyer
Graphic designer PUCV. Expert generate communication throughout
the design between brands and audiences in digital environments.
Pablo Altamirano
Industrial Engineer UAI. Executor of methodology and analyst in the
interpretation of statistics.
Estefanía Trisotti
Graphic designer PUCV. Expert in interface design and interpretation
of statisticsoriented visual design.
Robert Sharman
Consultant modeling methodology and statistics. Industrial Engineer
UAI.
I’M DIGITAL 2010 Report on consumer experience in Chile 67
ABOUT AYERVIERNES
AyerViernes is a strategy and design company dedicated to deliver digital solutions that foster better communication between brands and their audiences.
Using a people-centered design methodology, we position our clients in new and valuable relationships with their audiences by promoting through design spaces where consumers can perceive succesful experiences of use in both web and mobile, intranet, social networks, among others.
A fundamental part of our work involves understanding the behavior and usage trends in digital media, considering users as the articulators of our work; we are constantly researching and innovating, looking for solutions that can raise the return on investment (ROI) of our customers and the positions of their competitors.
For more information AyerViernes on the projects he has done or work areas, visit our website: www.ayerviernes.com or follow us through the following social media:
• Blog: www.erresese.com
• Twitter: @ayerviernes
• Facebook: www.facebook.com/ayerviernes
• Flickr: www.flickr.com/ayerviernes (All graphics are avaliable in high resolution)
Contact Information
Santiago, Chile: +56 - 2- 361 0505
Viña del Mar: +56 - 32 - 215 6588
AyerViernes a member of: