illustrative financial statements 2011 - ias plus
TRANSCRIPT

Illustrative Financial Statements 2011
GAAP Singapore Ltd and its subsidiaries(Registration No. 200001999A)
Report of the directors and financial statements
Year ended December 31, 2011
Scope This publication provides a set of sample financial statements of a fictitious group of companies. GAAP Singapore Ltd is a company incorporated in Singapore and its shares are listed on the Main Board of the Singapore Exchange Securities Trading Limited (“SGX-ST”). The names of people and entities included in this publication are fictitious. Any resemblance to a person or entity is purely coincidental.
GAAP Singapore Ltd is assumed to have presented its financial statements in accordance with Singapore Financial Reporting Standards (“FRS”) for a number of years.
Effective date The illustrative financial statements include the disclosures required by the Singapore Companies Act, SGX-ST Listing Manual, and FRSs and INT FRSs that are issued at the date of publication (October 31, 2011)
Illustrative in nature The sample disclosures in this set of illustrative financial statements should not be considered to be the only acceptable form of presentation. The form and content of each reporting entity’s financial statements are the responsibility of the entity’s directors, and other forms of presentation which are equally acceptable may be preferred and adopted, provided they include the specific disclosures prescribed in the Singapore Companies Act, SGX-ST Listing Manual, and FRSs and INT FRSs.
For the purposes of presenting the statement of comprehensive income, and cash flow statement / statement of cash flows, the various alternatives allowed under FRSs for those statements have been illustrated. Preparers of financial statements should select the alternatives most appropriate to their circumstances.
The illustrative financial statements contains general information and are not intended to be a substitute for reading the legislation or accounting standards themselves, or for professional judgement as to adequacy of disclosures and fairness of presentation. They do not encompass all possible disclosures required by the Singapore Companies Act, SGX-ST Listing Manual, and FRSs and INT FRSs. Depending on the circumstances, further specific information may be required in order to ensure fair presentation and compliance with laws and accounting standards and stock exchange regulations in Singapore.
Guidance NotesDirect references to the source of disclosure requirements are included in the reference column on each page of the illustrative financial statements. Guidance notes are provided where additional matters may need to be considered in relation to a particular disclosure. These notes are inserted within the relevant section or note. The illustrative financial statements are prepared by the Technical Department of Deloitte & Touche LLP in Singapore for the use of clients and staff and are written in general terms. Accordingly, we recommend that readers seek appropriate professional advice regarding the application of its contents to their specific situations and circumstances. The illustrative financial statements should not be relied on as a substitute for such professional advice. Partners and professional staff of Deloitte & Touche LLP in Singapore would be pleased to advise you. While all reasonable care has been taken in the preparation of these illustrative financial statements, Deloitte & Touche LLP in Singapore accepts no responsibility for any errors it might contain, whether caused by negligence or otherwise, or for any loss, howsoever caused, incurred by any person as a result of relying on it.
Abbreviations used References are made in this publication to the Singapore Companies Act, Singapore accounting pronouncements, guidelines and SGX listing rules that require a particular disclosure or accounting treatment. The abbreviations used to identify the source of authority are as follows:
Alt AlternativeCA Singapore Companies Act CCG Code of Corporate GovernanceFRS Singapore Financial Reporting Standards INT FRS Interpretation of Singapore Financial Reporting Standards LM Singapore Exchange Securities Trading (SGX-ST) Listing ManualRAP Recommended Accounting Practice SSA Singapore Standards on Auditing
Preface
Summary of key changes from the 2010 version of the Singapore Illustrative Financial Statements
a) INT FRS 115 Agreements for Construction of Real EstateINT FRS 115 is effective for annual periods beginning on or after January 1, 2011. The Interpretation addresses how entities should determine whether an agreement of the construction of real estate is within the scope of FRS 11 Construction Contracts or FRS 18 Revenue and when revenue from the construction of real estate should be recognised.
GAAP Singapore Ltd does not have any sales of development properties. The effects of adopting INT FRS 115 are instead illustrated in the guidance boxes in these illustrative financial statements as summarised below:
• The effects of adopting INT FRS 115 during the year, showing:
i. the amount of adjustments for each financial statement line item affected for the current period and each prior period presented; and
ii. the amount of adjustments for basic and diluted earnings per share for the current period and each prior period presented;
are illustrated in the guidance to Note 2 on page 37.
• The presentation of the Statement of Changes in Equity showing, for each component of equity, the effects of retrospectively adopting INT FRS 115 is illustrated in the guidance box on page 29.
• The accounting policy notes for revenue recognition under INT FRS 115 are illustrated in the guidance box on page 55.
• Sample disclosures of critical judgment in applying INT FRS 115 are illustrated in the guidance box on page 60.
b) Amendments to FRS 12 Income taxes – Deferred tax: Recovery of underlying assetsThe amendments to FRS 12 are effective for annual periods beginning on or after January 1, 2012. The amendments affect the measurement of deferred taxes on investment properties measured using the fair value model. In determining the manner of recovering the carrying amounts of such investment properties, the amendments introduce a rebuttable presumption that the carrying amounts of such properties will be recovered entirely through sale. This presumption is rebutted if the investment properties are depreciable and is held within a business model whose objective is to consume substantially all of the economic benefits over time, rather than through sale. With the introduction of this rebuttable presumption, the measurement of deferred taxes arising from fair value changes of such investment properties may change.
Illustration on early adoption of amendments to FRS 12GAAP Singapore Ltd does not have any material deferred taxes on fair value changes of investment property. However, for illustration, the effects of early adopting the amendments to FRS 12 are instead illustrated in the guidance boxes in these illustrative financial statements as summarised below:
• TheeffectsofearlyadoptingtheamendmentstoFRS12duringtheyear,showing:
i. the amount of adjustments for each financial statement line item affected for the current period and each prior period presented; and
ii. the amount of adjustments for basic and diluted earnings per share for the current period and each prior period presented;
are illustrated in the guidance to Note 2 on page 39. iii. the presentation of the Statement of Changes in Equity showing, for each component of equity, the
effects of retrospectively adopting the amendments to FRS 12 is illustrated on the guidance box on page 29.
iv. guidance on accounting policy notes for income taxes is included on page 57 for suggested wordings for early adopters of the amendments to FRS 12.
Illustration on non-early adoption of amendments to FRS 12The effects of adopting the amendments to FRS 12 from its effective date (i.e. annual periods beginning on or after January 1, 2012) are illustrated in Appendix A on page 161.
c) Revised FRS 24 Related party disclosuresThe revised FRS 24 is effective for annual periods beginning on or after January 1, 2011.
The revised standard clarifies the definition of a related party and provides partial disclosure exemptions forgovernment-related entities.
The effects of adopting the revised FRS 24 are illustrated in Notes 2 (page 36) and 6 (page 80).
Additional guidance for government-related entities is included on page 81.
d) Amendments to FRS 107 Financial instruments: disclosures – Transfers of financial assetsThe amendments to FRS 107 are effective for annual periods beginning on or after July 1, 2011.
The amendments clarify the required disclosures to help users of financial statements evaluate the risk exposures relating to transfers of financial assets and the effect of those risks on an entity’s financial position.
An entity need not provide the disclosures required by those amendments for any period presented that begins before the date of initial application of the amendments.
For illustration, the effects of early adopting the amendments to FRS 107 are illustrated in a guidance box in these illustrative financial statements in Note 8 on page 87.
e) Improvements to FRS 2010 – Amendments to FRS 1 Presentation of financial statementsImprovements to FRS 2010 amended FRS 1 to clarify that an entity may present the analysis of other comprehensive income by item either in the statement of changes in equity or in the notes to the financial statements. The amendment is effective for annual periods beginning on or after January 1, 2011.
The amendments to FRS 1 are included in the guidance to the Statement of Changes in Equity on page 28.
f) Improvements to FRS 2010 – Amendments to FRS 103 Business combinationsImprovements to FRS 2010 amended FRS 103 on initial measurements of non-controlling interests and accounting for unreplaced and voluntarily replaced share-based payment awards. The amendments are effective for annual periods beginning on or after July 1, 2010, and are to be applied prospectively.
The amendments to FRS 103 affect the accounting policy notes on Business Combinations in Note 2 on pages 40 and 42.
g) Improvements to FRS 2010 – Amendments to FRS 107 Financial instruments: DisclosuresImprovements to FRS 2010 amended FRS 107 to clarify the required level of disclosures about credit risk and collateral held and provide relief from disclosures previously required regarding renegotiated loans. The amendments are effective for annual periods beginning on or after January 1, 2011.
The amendments clarify that an entity with financial instruments whose carrying amount best represents the maximum exposure to credit risk is relieved from disclosing “the amount that best represents its maximum exposure to credit risk”. The guidance to Note 4(b)(iv) on page 69 is updated for this clarification.
The amendments regarding additional disclosures on the financial effect of collateral held as security (e.g. a quantification of the extent to which collateral and other credit enhancements mitigate credit risk) is illustrated in Note 10 on page 90.
h) Sample disclosures on FRSs that have been issued but are not yet effectiveAppendix A contains sample disclosures required by FRS 8.30 on new / revised FRSs, INT FRSs and amendments to FRSs that may be relevant to an entity that were issued but not effective at the date of authorisation of the financial statements. The disclosures are purely for illustrative purposes and may not be relevant to GAAP Singapore Ltd for the year ended December 31, 2011.
The disclosures in Appendix A relate to FRSs in issue as at October 31, 2011.
i) Selected changes to the SGX-ST Listing ManualThe key changes to the SGX-ST Listing Manual included in the guidance to these financial statements are as follows:
• amendment to Listing Rule 1207(6)(a) on disclosure of: - Aggregate amount of fees paid to the auditors; - Breakdown of fees for audit and non-audit services; and - A negative statement if no audit fees paid or no non-audit fees paid.
The effects of adopting the amendments to Listing Rule 1207(6)(a) are illustrated in Note 47 on page 145.
• amendmenttoListingRule1207(12)torequiredisclosureofDirectors’andKeyExecutive’sRemuneration as recommended in the Code of Corporate Governance, or otherwise disclose and explain any deviation from the recommendation.
The requirements of Listing Rule 1207(12) are included in the guidance to Note 6 on page 83.
The requirements for the disclosures above apply to a listed company’s annual report instead of its financial statements. Thus, the disclosures may not necessarily be made in the financial statements of the listed company.
Contents
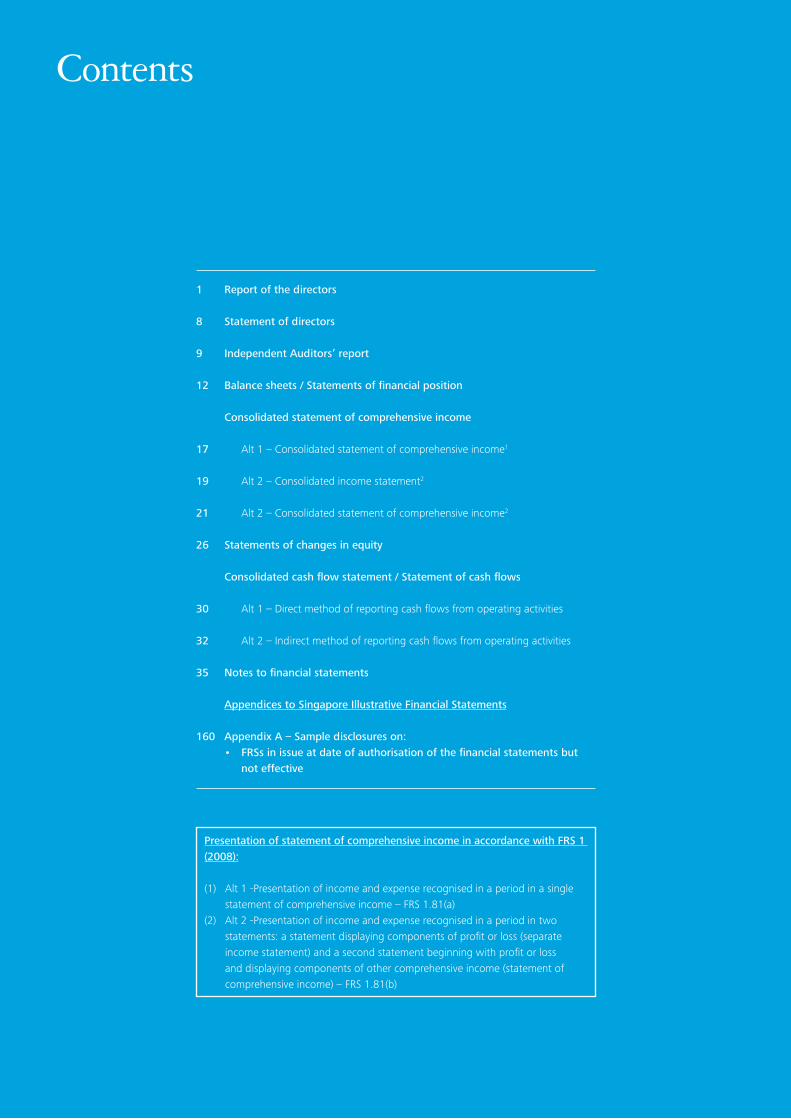
1 Report of the directors 8 Statement of directors 9 Independent Auditors’ report 12 Balance sheets / Statements of financial position Consolidated statement of comprehensive income 17 Alt 1 – Consolidated statement of comprehensive income1
19 Alt 2 – Consolidated income statement2
21 Alt 2 – Consolidated statement of comprehensive income2
26 Statements of changes in equity Consolidated cash flow statement / Statement of cash flows 30 Alt 1 – Direct method of reporting cash flows from operating activities 32 Alt 2 – Indirect method of reporting cash flows from operating activities 35 Notes to financial statements Appendices to Singapore Illustrative Financial Statements 160 Appendix A – Sample disclosures on: • FRSsinissueatdateofauthorisationofthefinancialstatementsbut not effective
Presentation of statement of comprehensive income in accordance with FRS 1 (2008):
(1) Alt 1 -Presentation of income and expense recognised in a period in a single statement of comprehensive income – FRS 1.81(a)(2) Alt 2 -Presentation of income and expense recognised in a period in two statements: a statement displaying components of profit or loss (separate income statement) and a second statement beginning with profit or loss and displaying components of other comprehensive income (statement of comprehensive income) – FRS 1.81(b)
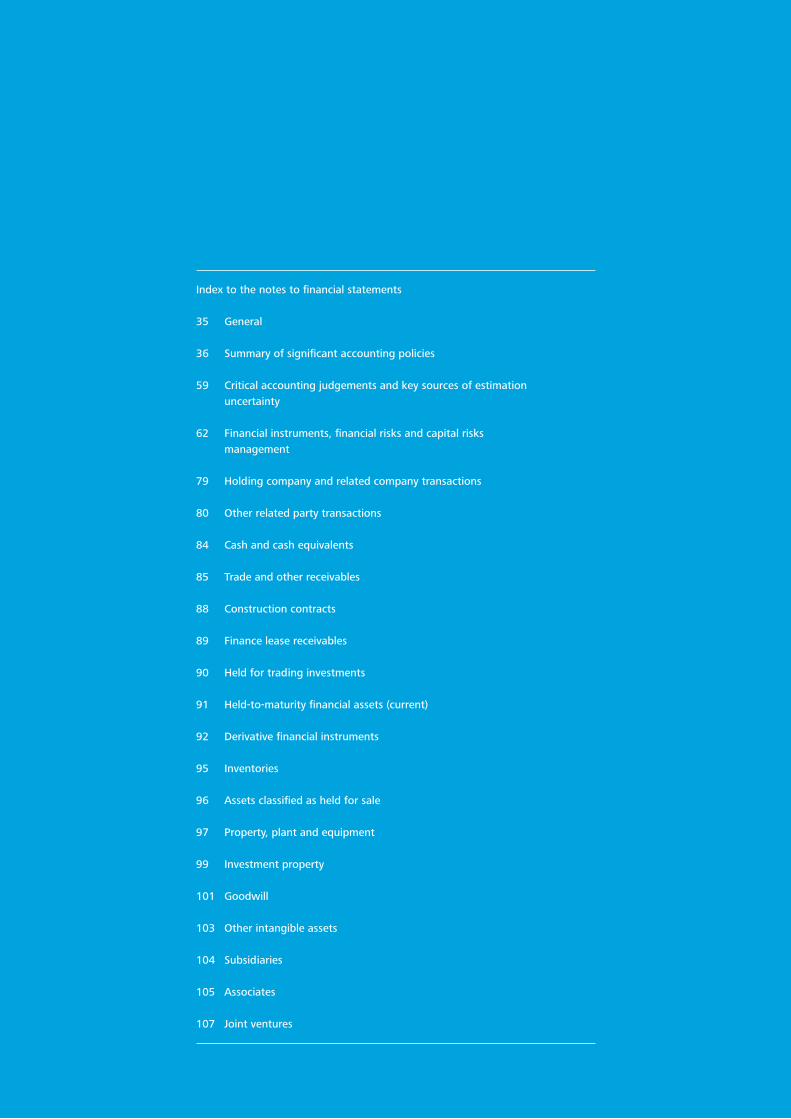
Index to the notes to financial statements 35 General 36 Summary of significant accounting policies 59 Critical accounting judgements and key sources of estimation uncertainty 62 Financial instruments, financial risks and capital risks management 79 Holding company and related company transactions 80 Other related party transactions 84 Cash and cash equivalents 85 Trade and other receivables 88 Construction contracts 89 Finance lease receivables 90 Held for trading investments 91 Held-to-maturity financial assets (current) 92 Derivative financial instruments 95 Inventories 96 Assets classified as held for sale 97 Property, plant and equipment 99 Investment property 101 Goodwill 103 Other intangible assets 104 Subsidiaries 105 Associates 107 Joint ventures
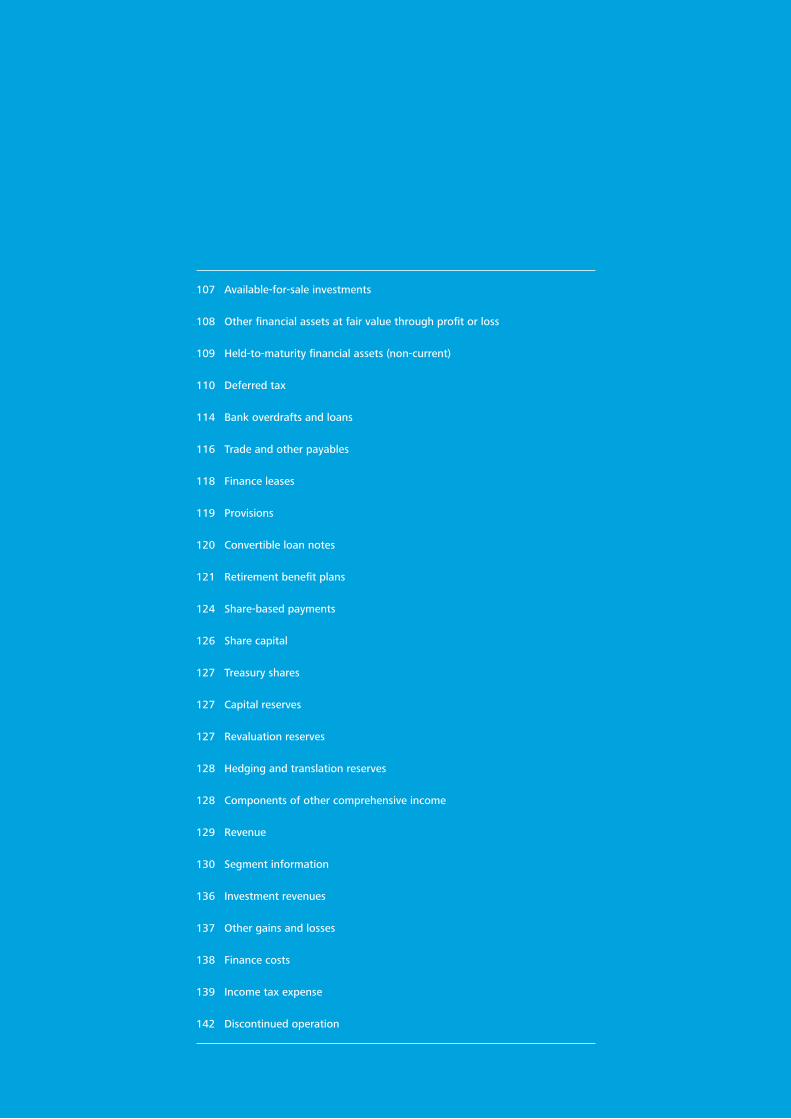
107 Available-for-sale investments 108 Other financial assets at fair value through profit or loss 109 Held-to-maturity financial assets (non-current) 110 Deferred tax 114 Bank overdrafts and loans 116 Trade and other payables 118 Finance leases 119 Provisions 120 Convertible loan notes 121 Retirement benefit plans 124 Share-based payments 126 Share capital 127 Treasury shares 127 Capital reserves 127 Revaluation reserves 128 Hedging and translation reserves 128 Components of other comprehensive income 129 Revenue 130 Segment information 136 Investment revenues 137 Other gains and losses 138 Finance costs 139 Income tax expense 142 Discontinued operation

143 Profit for the year 145 Dividends 146 Earnings per share 148 Disposal of subsidiary 150 Acquisition of subsidiary 156 Non-cash transactions 156 Contingent liabilities 156 Commitments 157 Operating lease arrangements 158 Events after the reporting period 159 Reclassifications and comparative figures
Illustrative Financial Statements 2011 GAAP Singapore Ltd and its subsidiaries 1
SourceThe directors present their report together with the audited consolidated financial statements of the group and balance sheet / statement of financial position(9) and statement of changes in equity of the company for the financial year ended December 31, 2011.(1)
1 Directors(2)
The directors of the company in office at the date of this report are:
Ang Boey ChweeDesmond Ee Fong GuanHeng Ing JongKennethLimMengNam (AppointedonJuly11,2011)Ooi Puay Quan (Appointed on September 7, 2011)Raymond See Teoh Un (Appointed on November 6, 2011)Vanessa Wong Xiao Ying (Alternate to Ang Boey Chwee and appointed on January 3, 2012)
2 Arrangements to enable directors to acquire benefits by means of the acquisition of shares and debentures
Neither at the end of the financial year nor at any time during the financial year did there subsist any arrangement whose object is to enable the directors of the company to acquire benefits by means of the acquisition of shares or debentures in the company or any other body corporate, except for the options mentioned in paragraph 3 and 5 of the Report of the Directors.
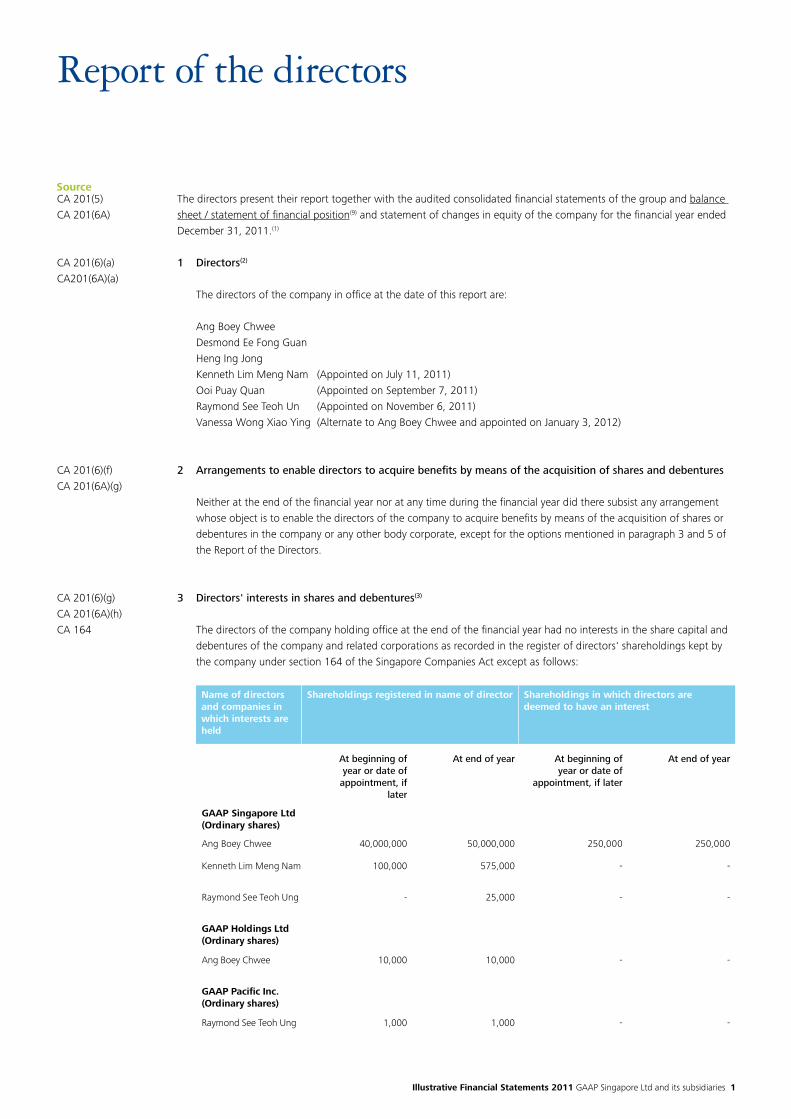
3 Directors' interests in shares and debentures(3)
The directors of the company holding office at the end of the financial year had no interests in the share capital and debentures of the company and related corporations as recorded in the register of directors' shareholdings kept by the company under section 164 of the Singapore Companies Act except as follows:
Report of the directors
CA 201(5)CA 201(6A)
CA 201(6)(a)CA201(6A)(a)
CA 201(6)(f)CA 201(6A)(g)
CA 201(6)(g)CA 201(6A)(h)CA 164
Name of directors and companies in which interests are held
Shareholdings registered in name of director Shareholdings in which directors are deemed to have an interest
At beginning of year or date of
appointment, if later
At end of year At beginning of year or date of
appointment, if later
At end of year
GAAP Singapore Ltd (Ordinary shares)
Ang Boey Chwee 40,000,000 50,000,000 250,000 250,000
KennethLimMengNam 100,000 575,000 - -
Raymond See Teoh Ung - 25,000 - -
GAAP Holdings Ltd (Ordinary shares)
Ang Boey Chwee 10,000 10,000 - -
GAAP Pacific Inc.(Ordinary shares)
Raymond See Teoh Ung 1,000 1,000 - -
2
SourceBy virtue of section 7 of the Singapore Companies Act, Mr Ang Boey Chwee is deemed to have an interest in all the related corporations of the company.
The directors’ interests in the shares and options of the company at January 21, 2012 were the same atDecember 31, 2011.
4 Directors' receipt and entitlement to contractual benefits(4)
Since the beginning of the financial year, no director has received or become entitled to receive a benefit which is required to be disclosed under section 201(8) of the Singapore Companies Act, by reason of a contract made by the company or a related corporation with the director or with a firm of which he is a member, or with a company in which he has a substantial financial interest except for salaries, bonuses and other benefits as disclosed in the financial statements. Certain directors received remuneration from related corporations in their capacity as directors and / or executives of those related corporations.
5 Share options(5)
(a) Options to take up unissued sharesThe Employee Share Option Scheme (the “Scheme”) in respect of unissued ordinary shares in the company was approved by the shareholders of the company at an Extraordinary General Meeting held on March 15, 2007.
The scheme is administered by the Remuneration and Share Options Committee whose members are:
Heng Ing Jong (Chairman)Desmond Ee Fong GuanKennethLimMengNamOoi Puay Quan
MrKennethLimMengNamdidnotparticipateinanydeliberationordecisioninrespectoftheoptionsgrantedtohim.
Under the Scheme, options granted to the directors and employees may, except in certain special circumstances, be exercised at any time after two years but no later than the expiry date. The ordinary shares of the company (“Shares”) under option may be exercised in full or in respect of 100 Shares or a multiple thereof, on the payment of the exercise price. The exercise price is based on the average of closing prices of the Shares on the Singapore Exchange Securities Trading Limited for the three market days immediately preceding the date of grant. The Remuneration and Share Options Committee may at its discretion fix the exercise price at a discount not exceeding 20 percent to the above price. No options have been granted at a discount.
CA 7CA 164
LM 1207(7)
CA 201(8)
CA 201(11B)LM 843(3)
LM 852(1)(a)
LM 849
CA 201(12)LM 852(1)(d), 852(2)845(5)
Report of the directors
Illustrative Financial Statements 2011 GAAP Singapore Ltd and its subsidiaries 3
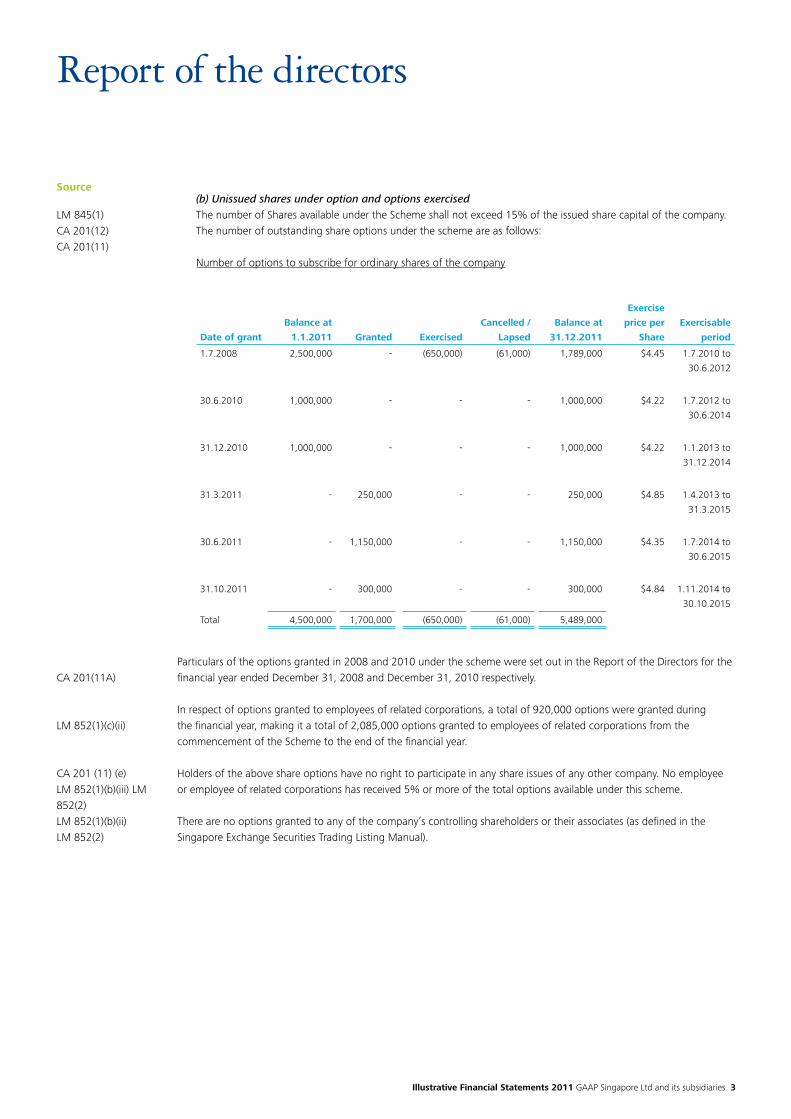
Source (b) Unissued shares under option and options exercised
The number of Shares available under the Scheme shall not exceed 15% of the issued share capital of the company. The number of outstanding share options under the scheme are as follows:
Number of options to subscribe for ordinary shares of the company
Particulars of the options granted in 2008 and 2010 under the scheme were set out in the Report of the Directors for the financial year ended December 31, 2008 and December 31, 2010 respectively.
In respect of options granted to employees of related corporations, a total of 920,000 options were granted during the financial year, making it a total of 2,085,000 options granted to employees of related corporations from the commencement of the Scheme to the end of the financial year.
Holders of the above share options have no right to participate in any share issues of any other company. No employee or employee of related corporations has received 5% or more of the total options available under this scheme.
There are no options granted to any of the company’s controlling shareholders or their associates (as defined in the Singapore Exchange Securities Trading Listing Manual).
LM 845(1)CA 201(12)CA 201(11)
CA 201(11A)
LM 852(1)(c)(ii)
CA 201 (11) (e)LM 852(1)(b)(iii) LM 852(2)LM 852(1)(b)(ii)LM 852(2)
Date of grant
Balance at
1.1.2011 Granted Exercised
Cancelled /
Lapsed
Balance at
31.12.2011
Exercise
price per
Share
Exercisable
period
1.7.2008 2,500,000 - (650,000) (61,000) 1,789,000 $4.45 1.7.2010 to
30.6.2012
30.6.2010 1,000,000 - - - 1,000,000 $4.22 1.7.2012 to
30.6.2014
31.12.2010 1,000,000 - - - 1,000,000 $4.22 1.1.2013 to
31.12.2014
31.3.2011 - 250,000 - - 250,000 $4.85 1.4.2013 to
31.3.2015
30.6.2011 - 1,150,000 - - 1,150,000 $4.35 1.7.2014 to
30.6.2015
31.10.2011 - 300,000 - - 300,000 $4.84 1.11.2014 to
30.10.2015
Total 4,500,000 1,700,000 (650,000) (61,000) 5,489,000
Report of the directors
4
SourceLM 852(1)(b)(i)
CA 201B(9)CA 201B(2), (3)
CA 201B(5)(a)
CA 201B(6)
CA 201B(5)(b)
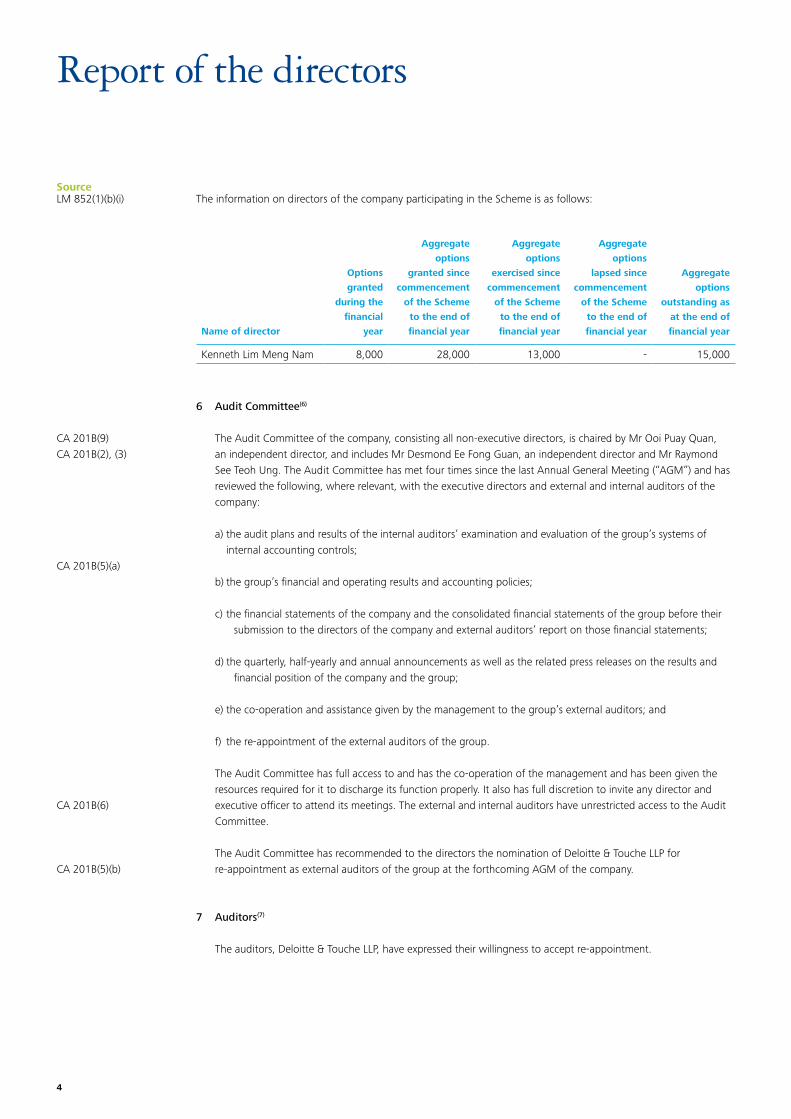
The information on directors of the company participating in the Scheme is as follows:
6 Audit Committee(6)
The Audit Committee of the company, consisting all non-executive directors, is chaired by Mr Ooi Puay Quan, an independent director, and includes Mr Desmond Ee Fong Guan, an independent director and Mr Raymond See Teoh Ung. The Audit Committee has met four times since the last Annual General Meeting (“AGM”) and has reviewed the following, where relevant, with the executive directors and external and internal auditors of the company:
a) the audit plans and results of the internal auditors’ examination and evaluation of the group’s systems of internal accounting controls;
b) the group’s financial and operating results and accounting policies;
c) the financial statements of the company and the consolidated financial statements of the group before their submission to the directors of the company and external auditors’ report on those financial statements;
d) the quarterly, half-yearly and annual announcements as well as the related press releases on the results and financial position of the company and the group;
e) the co-operation and assistance given by the management to the group’s external auditors; and
f) the re-appointment of the external auditors of the group.
The Audit Committee has full access to and has the co-operation of the management and has been given the resources required for it to discharge its function properly. It also has full discretion to invite any director and executive officer to attend its meetings. The external and internal auditors have unrestricted access to the Audit Committee.
The Audit Committee has recommended to the directors the nomination of Deloitte & Touche LLP for re-appointment as external auditors of the group at the forthcoming AGM of the company.
7 Auditors(7)
The auditors, Deloitte & Touche LLP, have expressed their willingness to accept re-appointment.
Name of director
Options
granted
during the
financial
year
Aggregate
options
granted since
commencement
of the Scheme
to the end of
financial year
Aggregate
options
exercised since
commencement
of the Scheme
to the end of
financial year
Aggregate
options
lapsed since
commencement
of the Scheme
to the end of
financial year
Aggregate
options
outstanding as
at the end of
financial year
KennethLimMengNam 8,000 28,000 13,000 - 15,000
Report of the directors
Illustrative Financial Statements 2011 GAAP Singapore Ltd and its subsidiaries 5
SourceOn behalf of the directors(8)
Ang Boey ChweeDesmond Ee Fong Guan
January 31, 2012
CA 201(6A)
CA 4FRS 1.38FRS 1.37
CA 201(6), (6A)
CA 201(6)(g)CA 201(6A)(h)CA 201(11)CA 201(11B)
CA 164(3)
CA 201(8)
Guidance Notes – Report of the directors1. Financial year If the company’s financial year is less than 12 months, the term “financial year” is defined in the first paragraph of
the Report of the Directors and therefore the rest of the report can still be “year” and does not require amendment to “period”. Where there is a change of financial year end, the reason for the change should be disclosed in the Report of the Directors as well as the notes to financial statements.
2. Directors in office at the date of the report If a director was appointed during the financial year and up to the date of the Report of the Directors, the date
of the appointment, although not required, is recommended to be disclosed clearly to identify the new director. There is no requirement to give details of director(s) who resigned during the financial year and up to the date of the Report of the Directors.
3. Directors’ interests in shares and debentures Directors’ interests include personal holdings, beneficial interest of their immediate family and deemed interests as
defined by Section 7 of the Singapore Companies Act. Directors’ interests in rights or share options are also to be disclosed accordingly.
If a director resigns after the end of the financial year but before the date of the Report of the Directors, his interest at the end of the financial year should be disclosed.
Where the company is a wholly owned subsidiary of another company (the “holding company”), the company may be deemed to have complied with section 164 of the Singapore Companies Act in relation to a director who is also a director of that other company if the particulars required by this section to be shown in the register of the company are shown in the register of the holding company. The following should be disclosed:
“The directors, Mr / Ms _________ and Mr / Ms__________ are also directors of GAAP Holdings Ltd, incorporated in the Republic of Singapore, which owns all the shares of the company. Their interests in shares are recorded in the register of directors’ shareholdings kept under section 164 of the Singapore Companies Act by the holding company and are therefore not disclosed in this report.”
4. Directors’ receipt and entitlement to contractual benefits The directors of the company shall state in the report whether since the end of the previous financial year, a
director of the company has received or become entitled to receive a benefit (other than a benefit included in the aggregate amount of emoluments received or due and receivable by the directors shown in the financial statements or, if the company is a holding company, the consolidated financial statements in accordance with FRS or the fixed salary of a full-time employee of the company) by reason of a contract made by the company or a related corporation with the director or with a firm of which he is a member, or with a company in which he has a substantial financial interest and if so, the general nature of the benefit. Examples include professional or directors’ fees to a law firm in which the director(s) are partners. The amount disclosed must appear in Note 47 "Profit for the year". The general nature of the benefit should be disclosed where a contract subsists. Where there are such transactions, the following should be disclosed:
“There were certain transactions (as shown in the financial statements) with a corporation(s) in which certain directors have an interest”.
Report of the directors
6
Source
Guidance Notes – Report of the directors (cont'd)5. Share options The disclosures required by section 201(11) of the Singapore Companies Act relate to options granted by the
company. Where any of the disclosures have been made in a previous report, the company need only make reference to that report.
For options granted by the company during the financial year, the following disclosures have to be made:
(a) the number and class of shares in respect of which the option has been granted;
(b) the date of expiration of the option;
(c) the basis upon which the option may be exercised; and
(d) whether the person to whom the option has been granted has any right to participate by virtue of the option in any share issue of any other company.
Where there are share options of subsidiaries, the following should be disclosed:
“At the end of the financial year, there were XX,XXX ordinary shares of GAAP Logistics Pte Ltd under option relating to the (name of option scheme) Share Option Scheme. Details and terms of the options have been disclosed in the Report of the Directors of GAAP Logistics Pte Ltd.”
If there are no options to take up unissued shares during the financial year, the following should be disclosed:
“OPTIONS TO TAKE UP UNISSUED SHARES During the financial year, no options to take up unissued shares of the company or any corporation in the group
were granted.”
If no options were exercised during the financial year, the following should be disclosed:
“OPTIONS EXERCISED During the financial year, there were no shares of the company or any corporation in the group issued by virtue of
the exercise of an option to take up unissued shares.”
If there are no unissued shares under option at the end of the financial year, the following should be disclosed:
“UNISSUED SHARES UNDER OPTION At the end of the financial year, there were no unissued shares of the company or any corporation in the group
under options.”
6. Audit committee Every listed company shall have an audit committee. For listed companies, the details and functions of the audit
committee should be disclosed in the Report of the Directors if the statutory accounts (which would not contain a section on corporate governance), rather than the annual report, is filed with the Accounting and Corporate Regulatory Authority of Singapore.
CA 201(11)CA 201(11A)CA 201(11B)
CA 201(11B)
CA 201(11B)
CA 201(12)(a)
CA 201(12)(b)
CA 201B(1)CA 201B(9)
Report of the directors
Illustrative Financial Statements 2011 GAAP Singapore Ltd and its subsidiaries 7
Source
Guidance Notes – Report of the directors (cont'd)7. Auditor The information on the auditor is not compulsory, but it is often disclosed.
8. Dating and signing of the Report of the Directors The phrase “On behalf of the directors” is not necessary if the company only has 2 directors.
The Report of the Directors shall be made out not less than 14 days before the date of the company’s annual general meeting (“AGM”). The report shall be made in accordance with a resolution of the board of directors, which will specify the day on which it is to be made out and be signed by 2 directors.
AGMs should be held within 4 and 6 months of the end of each financial year for listed and non-listed companies respectively.
9. Delete where appropriate
CA 203(1)LM 707CA 201(5)LM Appdx 2.2(10)CA 201(1)(a), (b)CA 201(3A)(i), (ii)
Report of the directors
8
Source
CA 201(15)
CA 201(15)(a), (b)
CA 201(15)(c)
CA 201(15)
Statement of directors
In the opinion of the directors, the consolidated financial statements of the group and the balance sheet / statement of financial position(3) and statement of changes in equity of the company as set out on pages 11 to 151 are drawn up so as to give a true and fair view of the state of affairs of the group and of the company as at December 31, 2011, and of the results, changes in equity and cash flows of the group and changes in equity of the company for the financial year then ended and at the date of this statement(1), there are reasonable grounds to believe that the company will be able to pay its debts when they fall due.
On behalf of the directors
Ang Boey ChweeDesmond Ee Fong Guan
January 31, 2012
Statement of Directors
Guidance Notes: 1. Section 201(15) of the Singapore Companies Act (the “Act”) appears to require this statement to accompany the
statutory financial statements of a company “before the auditor reports on the accounts” under Part VI of the Act. Consequently, this statement is presented before the auditors’ report to the financial statements.
2. If the entity is in a capital deficiency and is dependent on the continuing financial support from its shareholders / holding company, this fact should be stated on the statement of directors as follows:
“…and at the date of this statement, with the continued financial support from its shareholders / holding company, there are reasonable grounds to believe that the company will be able to pay its debts when they fall due.”
Accordingly, the basis of preparing the financial statements on a going concern basis due to this fact should be disclosed in Note 1 of the financial statements.
3. Delete where appropriate.
Illustrative Financial Statements 2011 GAAP Singapore Ltd and its subsidiaries 9
Source
Independent auditors' report
SSA 700
SSA 700(21), (22)
SSA 700(23)
SSA 700(24 to 27)SSA 700(A22)
SSA 700(28), (30)
SSA 700(31), (33)
SSA 700(35)
CA 207(2)(a)
CA 207(2)(b)
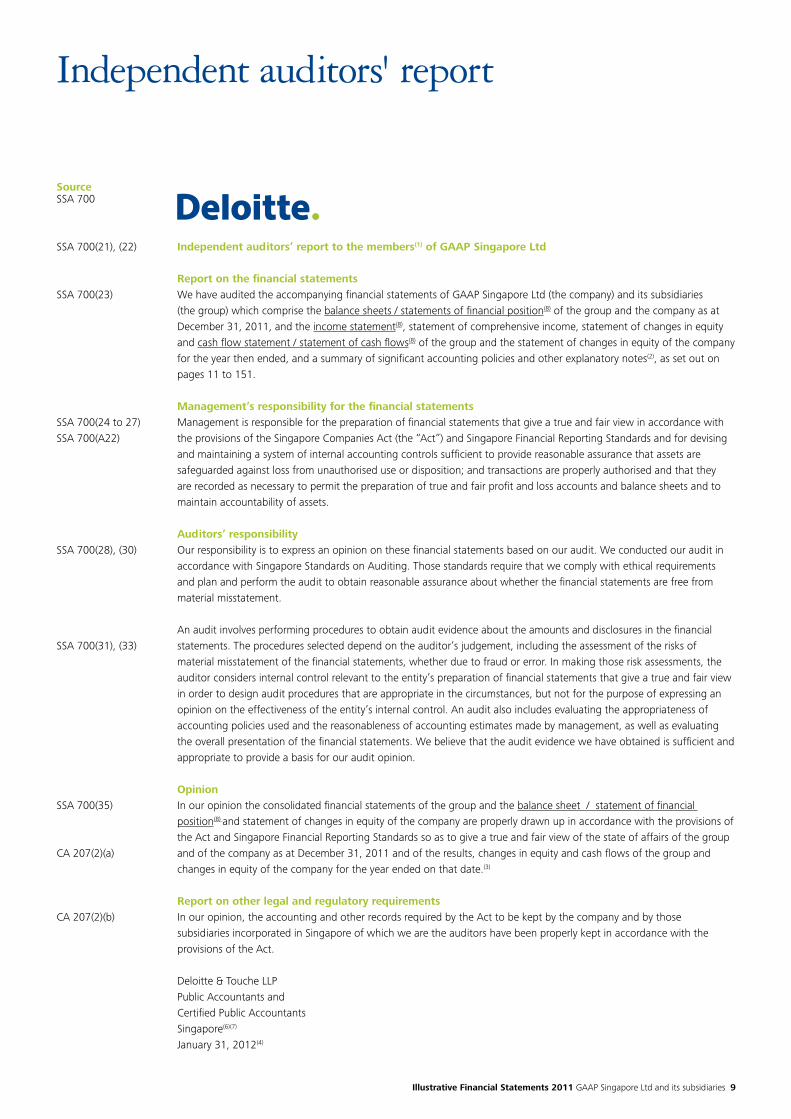
Independent auditors’ report to the members(1) of GAAP Singapore Ltd
Report on the financial statementsWe have audited the accompanying financial statements of GAAP Singapore Ltd (the company) and its subsidiaries (the group) which comprise the balance sheets / statements of financial position(8) of the group and the company as at December 31, 2011, and the income statement(8), statement of comprehensive income, statement of changes in equity and cash flow statement / statement of cash flows(8) of the group and the statement of changes in equity of the company for the year then ended, and a summary of significant accounting policies and other explanatory notes(2), as set out on pages 11 to 151.
Management’s responsibility for the financial statementsManagement is responsible for the preparation of financial statements that give a true and fair view in accordance with the provisions of the Singapore Companies Act (the “Act”) and Singapore Financial Reporting Standards and for devising and maintaining a system of internal accounting controls sufficient to provide reasonable assurance that assets are safeguarded against loss from unauthorised use or disposition; and transactions are properly authorised and that they are recorded as necessary to permit the preparation of true and fair profit and loss accounts and balance sheets and to maintain accountability of assets.
Auditors’ responsibilityOur responsibility is to express an opinion on these financial statements based on our audit. We conducted our audit in accordance with Singapore Standards on Auditing. Those standards require that we comply with ethical requirements and plan and perform the audit to obtain reasonable assurance about whether the financial statements are free from material misstatement.
An audit involves performing procedures to obtain audit evidence about the amounts and disclosures in the financial statements. The procedures selected depend on the auditor’s judgement, including the assessment of the risks of material misstatement of the financial statements, whether due to fraud or error. In making those risk assessments, the auditor considers internal control relevant to the entity’s preparation of financial statements that give a true and fair view in order to design audit procedures that are appropriate in the circumstances, but not for the purpose of expressing an opinion on the effectiveness of the entity’s internal control. An audit also includes evaluating the appropriateness of accounting policies used and the reasonableness of accounting estimates made by management, as well as evaluating the overall presentation of the financial statements. We believe that the audit evidence we have obtained is sufficient and appropriate to provide a basis for our audit opinion.
OpinionIn our opinion the consolidated financial statements of the group and the balance sheet / statement of financial position(8) and statement of changes in equity of the company are properly drawn up in accordance with the provisions of the Act and Singapore Financial Reporting Standards so as to give a true and fair view of the state of affairs of the group and of the company as at December 31, 2011 and of the results, changes in equity and cash flows of the group and changes in equity of the company for the year ended on that date.(3)
Report on other legal and regulatory requirementsIn our opinion, the accounting and other records required by the Act to be kept by the company and by those subsidiaries incorporated in Singapore of which we are the auditors have been properly kept in accordance with the provisions of the Act.
Deloitte & Touche LLPPublic Accountants andCertified Public AccountantsSingapore(6)(7)
January 31, 2012(4)
10
Source
SSA 700(22)
SSA 710(17)Illustration 3
SSA 710(17)
SSA 700(41)CA 201(4A)
SSA 700(A39)
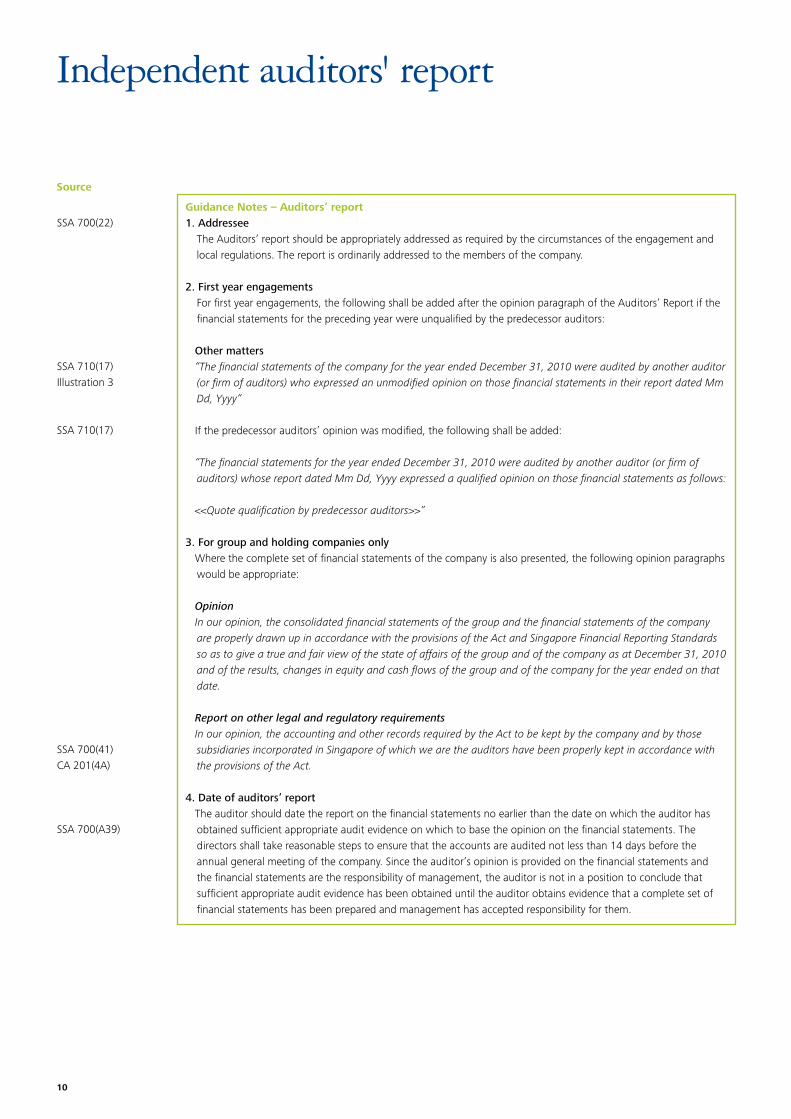
Guidance Notes – Auditors’ report1. Addressee
The Auditors’ report should be appropriately addressed as required by the circumstances of the engagement and local regulations. The report is ordinarily addressed to the members of the company.
2. First year engagementsFor first year engagements, the following shall be added after the opinion paragraph of the Auditors’ Report if the financial statements for the preceding year were unqualified by the predecessor auditors:
Other matters “The financial statements of the company for the year ended December 31, 2010 were audited by another auditor
(or firm of auditors) who expressed an unmodified opinion on those financial statements in their report dated Mm Dd, Yyyy”
If the predecessor auditors’ opinion was modified, the following shall be added:
“The financial statements for the year ended December 31, 2010 were audited by another auditor (or firm of auditors) whose report dated Mm Dd, Yyyy expressed a qualified opinion on those financial statements as follows:
<<Quote qualification by predecessor auditors>>”
3. For group and holding companies only Where the complete set of financial statements of the company is also presented, the following opinion paragraphs
would be appropriate:
Opinion In our opinion, the consolidated financial statements of the group and the financial statements of the company
are properly drawn up in accordance with the provisions of the Act and Singapore Financial Reporting Standards so as to give a true and fair view of the state of affairs of the group and of the company as at December 31, 2010 and of the results, changes in equity and cash flows of the group and of the company for the year ended on that date.
Report on other legal and regulatory requirements In our opinion, the accounting and other records required by the Act to be kept by the company and by those
subsidiaries incorporated in Singapore of which we are the auditors have been properly kept in accordance with the provisions of the Act.
4. Date of auditors’ report The auditor should date the report on the financial statements no earlier than the date on which the auditor has
obtained sufficient appropriate audit evidence on which to base the opinion on the financial statements. The directors shall take reasonable steps to ensure that the accounts are audited not less than 14 days before the annual general meeting of the company. Since the auditor’s opinion is provided on the financial statements and the financial statements are the responsibility of management, the auditor is not in a position to conclude that sufficient appropriate audit evidence has been obtained until the auditor obtains evidence that a complete set of financial statements has been prepared and management has accepted responsibility for them.
Independent auditors' report
Illustrative Financial Statements 2011 GAAP Singapore Ltd and its subsidiaries 11
Source
Guidance Notes – Auditors’ report (cont'd)5. Other specimens and modified reports
For other specimens and modified reports, please refer to SSA 705, SSA 706, SSA 710 and AGS 1.
6. Auditor’s addressThe report should name a specific location, which is ordinarily the city where the auditor maintains the office that has responsibility for the audit.
7. Name of audit partner The listing manual requires an issuer to disclose in its annual report the date of appointment and the name of the audit partner in charge of auditing the issuer and its group of companies. However, this information need not be in the audit report. For example, an issuer may typically disclose this information in the corporate information section of its annual report.
8. Delete where appropriate
SSA 700(42)
LM 713(1)
Independent auditors' report
12
SourceFRS 1.51(a), (b)
CA 201.3A(a, b)FRS 1.51 (b), (c)FRS 1.10(a)LM 1207(5)(a), (b)FRS 1.38, 1.113FRS 1.51(d), (e)FRS 8.28, 8.29, 8.42(a)FRS 1.60FRS 1.66(d), 1.54(i)FRS 1.66(a, c), 1.54(h)FRS 1.55FRS 1.55FRS 1.55FRS 1.55FRS 1.66(a, c), 1.54(g)
FRS 1.66(b), 1.54(j)
FRS 1.60FRS 1.54(a)FRS 1.54(b)FRS 1.55FRS 1.54(c)FRS 1.55FRS 1.54(e)FRS 1.55FRS 1.55FRS 1.55FRS 1.55FRS 1.55FRS 1.54(o), 1.56
Group Company2011 2010 2011 2010
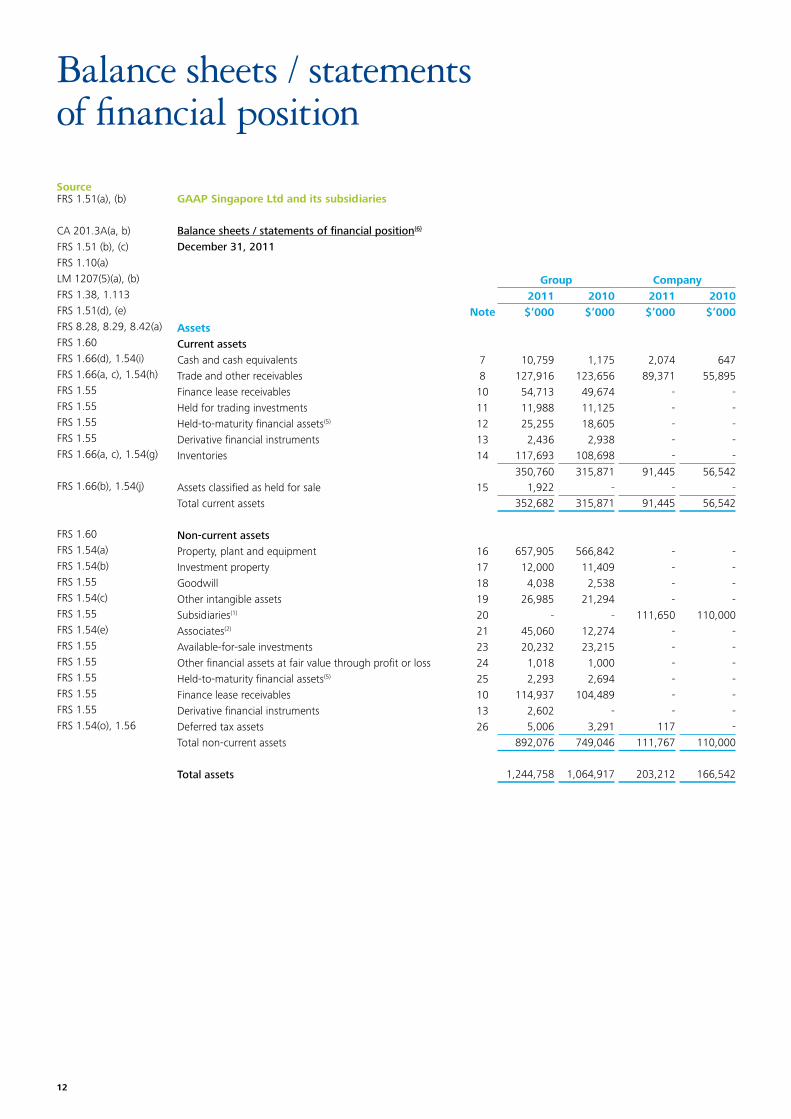
Note $’000 $’000 $’000 $’000AssetsCurrent assetsCash and cash equivalents 7 10,759 1,175 2,074 647Trade and other receivables 8 127,916 123,656 89,371 55,895Finance lease receivables 10 54,713 49,674 - -Held for trading investments 11 11,988 11,125 - -Held-to-maturity financial assets(5) 12 25,255 18,605 - -Derivative financial instruments 13 2,436 2,938 - -Inventories 14 117,693 108,698 - -
350,760 315,871 91,445 56,542Assets classified as held for sale 15 1,922 - - -Total current assets 352,682 315,871 91,445 56,542
Non-current assetsProperty, plant and equipment 16 657,905 566,842 - -Investment property 17 12,000 11,409 - -Goodwill 18 4,038 2,538 - -Other intangible assets 19 26,985 21,294 - -Subsidiaries(1) 20 - - 111,650 110,000Associates(2) 21 45,060 12,274 - -Available-for-sale investments 23 20,232 23,215 - -Other financial assets at fair value through profit or loss 24 1,018 1,000 - -Held-to-maturity financial assets(5) 25 2,293 2,694 - -Finance lease receivables 10 114,937 104,489 - -Derivative financial instruments 13 2,602 - - -Deferred tax assets 26 5,006 3,291 117 -Total non-current assets 892,076 749,046 111,767 110,000
Total assets 1,244,758 1,064,917 203,212 166,542
GAAP Singapore Ltd and its subsidiaries
Balance sheets / statements of financial position(6)
December 31, 2011
Balance sheets / statementsof financial position
Illustrative Financial Statements 2011 GAAP Singapore Ltd and its subsidiaries 13
SourceGroup Company
2011 2010 2011 2010Note $’000 $’000 $’000 $’000
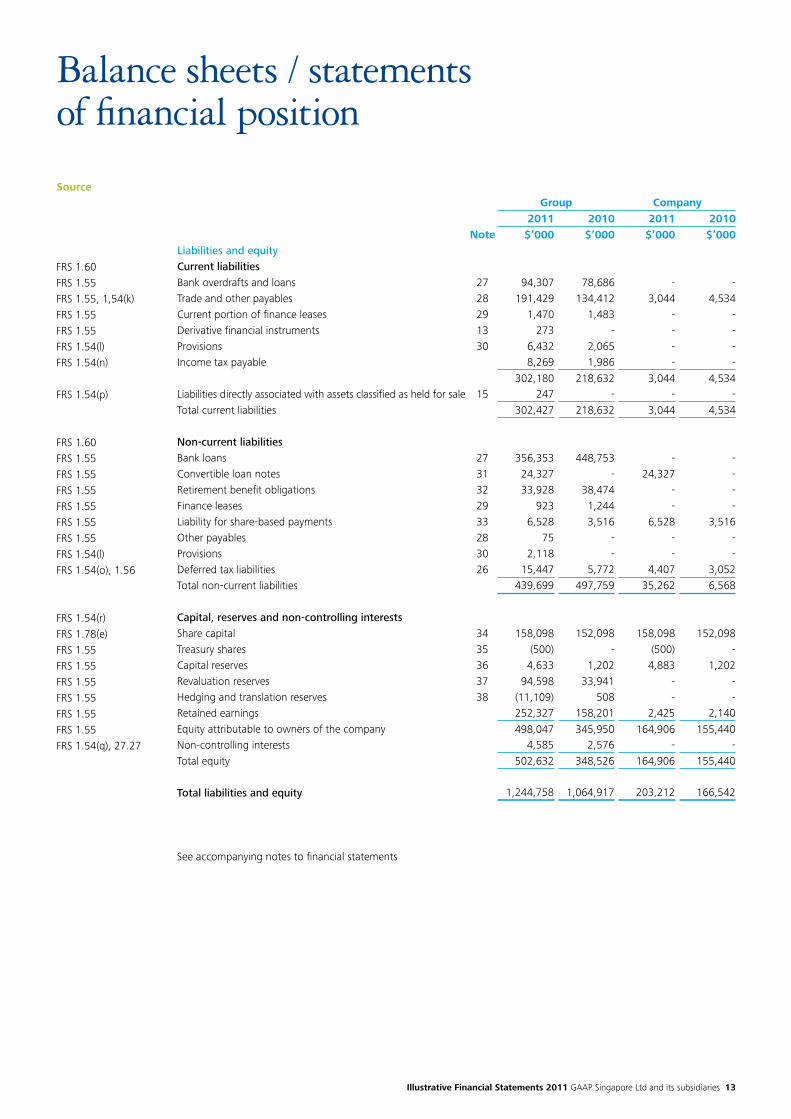
Liabilities and equityCurrent liabilitiesBank overdrafts and loans 27 94,307 78,686 - -Trade and other payables 28 191,429 134,412 3,044 4,534Current portion of finance leases 29 1,470 1,483 - -Derivative financial instruments 13 273 - - -Provisions 30 6,432 2,065 - -Income tax payable 8,269 1,986 - -
302,180 218,632 3,044 4,534Liabilities directly associated with assets classified as held for sale 15 247 - - -Total current liabilities 302,427 218,632 3,044 4,534
Non-current liabilitiesBank loans 27 356,353 448,753 - -Convertible loan notes 31 24,327 - 24,327 -Retirement benefit obligations 32 33,928 38,474 - -Finance leases 29 923 1,244 - -Liability for share-based payments 33 6,528 3,516 6,528 3,516Other payables 28 75 - - -Provisions 30 2,118 - - -Deferred tax liabilities 26 15,447 5,772 4,407 3,052Total non-current liabilities 439,699 497,759 35,262 6,568
Capital, reserves and non-controlling interestsShare capital 34 158,098 152,098 158,098 152,098Treasury shares 35 (500) - (500) -Capital reserves 36 4,633 1,202 4,883 1,202Revaluation reserves 37 94,598 33,941 - -Hedging and translation reserves 38 (11,109) 508 - -Retained earnings 252,327 158,201 2,425 2,140Equity attributable to owners of the company 498,047 345,950 164,906 155,440Non-controlling interests 4,585 2,576 - -Total equity 502,632 348,526 164,906 155,440
Total liabilities and equity 1,244,758 1,064,917 203,212 166,542
See accompanying notes to financial statements
FRS 1.60FRS 1.55FRS 1.55, 1,54(k)FRS 1.55FRS 1.55FRS 1.54(l)FRS 1.54(n)
FRS 1.54(p)
FRS 1.60FRS 1.55FRS 1.55FRS 1.55FRS 1.55FRS 1.55FRS 1.55FRS 1.54(l)FRS 1.54(o), 1.56
FRS 1.54(r)FRS 1.78(e)FRS 1.55FRS 1.55FRS 1.55FRS 1.55FRS 1.55FRS 1.55FRS 1.54(q), 27.27
Balance sheets / statementsof financial position
14
Source
FRS 27.10CA 201.3A(a, b)CA 201(3BA)
FRS 27.42
FRS 27.16
Guidance Notes – Balance sheets / Statements of financial position1. Exemption from presenting consolidated financial statements A parent shall consolidate all subsidiaries in its consolidated balance sheet / statement of financial position. A
parent is exempted from presenting consolidated financial statements if and only if the following conditions are all met:
(a) the parent is itself a wholly-owned subsidiary, or is a partially-owned subsidiary of another entity and its other owners, including those not otherwise entitled to vote, have been informed about, and do not object to, the parent not presenting consolidated financial statements;
(b) the parent’s debt or equity instruments are not traded in a public market (a domestic or foreign stock exchange or an over-the-counter market, including local and regional markets);
(c) the parent did not file, nor is it in the process of filing, its financial statements with a securities commission or other regulatory organisation for the purpose of issuing any class of instruments in a public market; and
(d) the ultimate or any intermediate parent of the parent produces consolidated financial statements available for public use.
If a parent company satisfies all the above conditions and elects not to present consolidated financial statements, it shall disclose the following:
(a) the fact that the financial statements are separate financial statements;
(b) that the exemption from consolidation has been used;
(c) the name and country of incorporation or residence of the entity whose consolidated financial statements have been produced for public use;
(d) the address where those consolidated financial statements are obtainable;
(e) a list and description of significant investments in subsidiaries, jointly controlled entities and associates, including the name, country of incorporation or residence, proportion of ownership interest and, if different, proportion of voting power held; and
(f) the method used to account for investments listed under (e).
FRS 27 departs from IAS 27 in that, to qualify for exemption under FRS 27.10, the consolidated financial statements prepared by the ultimate or any intermediate parent of the company available for public use need not comply with International Financial Reporting Standards or Singapore Financial Reporting Standards.
The following disclosure should be included in the notes on the summary of significant accounting policies:
“CONSOLIDATED FINANCIAL STATEMENTS – The financial statements of the subsidiaries have not been consolidated with the company’s financial statements as the company itself is a wholly-owned subsidiary of (name of holding company), incorporated in (country of holding company), which prepares consolidated financial statements on a worldwide basis. Such financial statements are publicly available.
The registered address of (name of holding company) is (address of holding company).
Investments in subsidiaries in the financial statements of the company are stated at cost, less any impairment in recoverable value.”
Balance sheets / statementsof financial position
Illustrative Financial Statements 2011 GAAP Singapore Ltd and its subsidiaries 15
Source
Guidance Notes – Balance sheets / Statements of financial position (cont'd) Companies that are venture capital organisations, mutual funds, unit trusts and similar entities are not excluded
from consolidating their subsidiaries.
2. Exemption from equity accounting for associates A company shall equity account for all associates. A company is exempted from equity accounting for associates
if and only if in the following circumstances or the following conditions are all met:
(a) the investment is classified as held for sale in accordance with FRS 105 Non-current Assets Held for Sale and Discontinued Operations and are accounted for in accordance with FRS 105;
(b) the company is a venture capital organisation, mutual fund, unit trust or similar entity, including investment- linked insurance funds, that upon initial recognition are designated as at fair value through profit or loss or are classified as held for trading and accounted for in accordance with FRS 39; or
(c) if all of the following apply:(i) the investor is a wholly-owned subsidiary, or is a partially-owned subsidiary of another entity and its other owners, including those not otherwise entitled to vote, have been informed about, and do not object to, the investor not applying the equity method;
(ii) the investor’s debt or equity instruments are not traded in a public market (a domestic or foreign stock exchange or an over-the-counter market, including local and regional markets);
(iii) the investor did not file, nor is it in the process of filing, its financial statements with a securities commission or other regulatory organisation, for the purpose of issuing any class of instruments in a public market; and
(iv) the ultimate or any intermediate parent of the investor produces consolidated financial statements available for public use.
3.Exemption from proportionate consolidation or equity accounting for joint ventures A venturer with an interest in a jointly controlled entity is exempted from the requirements of FRS 31.30
(proportionate consolidation) and FRS 31.38 (equity method) when it meets the following conditions:
(a) the interest is classified as held for sale in accordance with FRS 105 Non-current Assets Held for Sale and Discontinued Operations;
(b) the company is a venture capital organization, mutual fund, unit trust or similar entity, including investment- linked insurance funds, that upon initial recognition are designated as at fair value through profit or loss or are classified as held for trading and accounted in accordance with FRS 39; or
(c) if all of the following apply:(i) the venturer is a wholly-owned subsidiary, or is a partially-owned subsidiary of another entity and its owners, including those not otherwise entitled to vote, have been informed about, and do not object to, the venturer not applying proportionate consolidation or the equity method;
(ii) the venturer’s debt or equity instruments are not traded in a public market (a domestic or foreign stock exchange or an over-the-counter market, including local and regional markets);
FRS 28.13
FRS 28.13(a)
FRS 28.1
FRS 28.13(b) and (c)
FRS 31.2
FRS 31.2(a)
FRS 31.1
FRS 31.2(b) and (c)
Balance sheets / statementsof financial position
16
Source
Guidance Notes – Balance sheets / Statements of financial position (cont'd)(iii) the venturer did not file, nor is it in the process of filing, its financial statements with a securities commission or other regulatory organisation, for the purpose of issuing any class of instruments in a public market; and
(iv) the ultimate or any intermediate parent of the venturer produces consolidated financial statements available for public use.
4. Restatements and reclassifications FRS 1.39 states that when an entity applies an accounting policy retrospectively or makes a retrospective
restatement of items in its financial statements or when it reclassifies items in its financial statements, it shall present, as a minimum, three statements of financial position, two of each of the other statements, and related notes. However, other than stating the requirements, FRS 1 does not provide further clarification on those requirements. FRS 1.31 states that an entity need not provide a specific disclosure required by an FRS if the information is not material. In determining whether it is necessary to present an additional statement of financial position, entities should consider the materiality of the information that would be contained in the additional statement of financial position and whether this would affect economic decisions made by a user of the financial statements. Specifically, it would be useful to consider factors such as the nature of the change, the alternative disclosures provided and whether the change in accounting policy actually affected the financial position at the beginning of the comparative period. Specific views from regulators should be considered in the assessment.
Where the presentation or classification of items in the statements is amended, comparative amounts shall be reclassified unless the reclassification is impracticable. When comparative amounts are reclassified, an entity shall disclose the nature of the reclassification, the amount of each item or class of items that is reclassified and the reason for the reclassification (See Note 57 to the Illustrative Financial Statements for a sample disclosure format as required by FRS 1.41).
5. Presentation of financial instruments in of the balance sheet / statement of financial position FRS 1.54 and FRS 107.8 do not require separate line items for held-for-trading investments, held-to-maturity
financial assets, derivative financial instruments, available-for-sale investments and other financial assets at FVTPL. Hence, it is acceptable to combine them into one line item on the balance sheet / statement of financial position with details in a note. However, depending on the significance of these items, each can be separately shown as a line item respectively as illustrated in these illustrative financial statements.
FRS 107.8 requires the carrying amounts of each of the following categories as defined in FRS 39, to be disclosed either in the balance sheet / statement of financial position or in the notes [see illustration in Note 4(a)]:
(a) financial assets at FVTPL, showing separately (i) those designated upon initial recognition and (ii) those classified as held-for-trading;
(b) Held-to-maturity investments;
(c) Loans and receivables;
(d) Available-for-sale financial assets
(e) Financial liabilities at FVTPL, showing separately (i) those designated as such upon initial recognition and (ii) those classified as held-for-trading
(f) Financial liabilities measured at amortised cost.
6. Delete where appropriate
FRS 1.39
FRS 1.31
FRS 1.41FRS 1.42
FRS 1.55
FRS 107.8
Balance sheets / statementsof financial position
Illustrative Financial Statements 2011 GAAP Singapore Ltd and its subsidiaries 17
SourceFRS 1.51(a)
FRS 1.10(b), 1.51(b)FRS 1.51(c)LM 1207(5)(a)CA 201.3A(a)FRS 1.113FRS 1.51(d), (e)
FRS 1.82(a)
FRS 1.85FRS 1.99FRS 1.99FRS 1.99FRS 1.99FRS 1.99FRS 1.82(c)FRS 1.85FRS 1.85FRS 1.82(b)
FRS 1.85FRS 1.82(d)
FRS 1.85
FRS 1.82(e)
FRS 1.82(f)
FRS 1.82(g)
FRS 1.82(i)
FRS 1.83(a)(ii)FRS 1.83(a)(i)
FRS 1.83(b)(ii)FRS 1.83(b)(i)
GroupNote 2011 2010
$’000 $’000
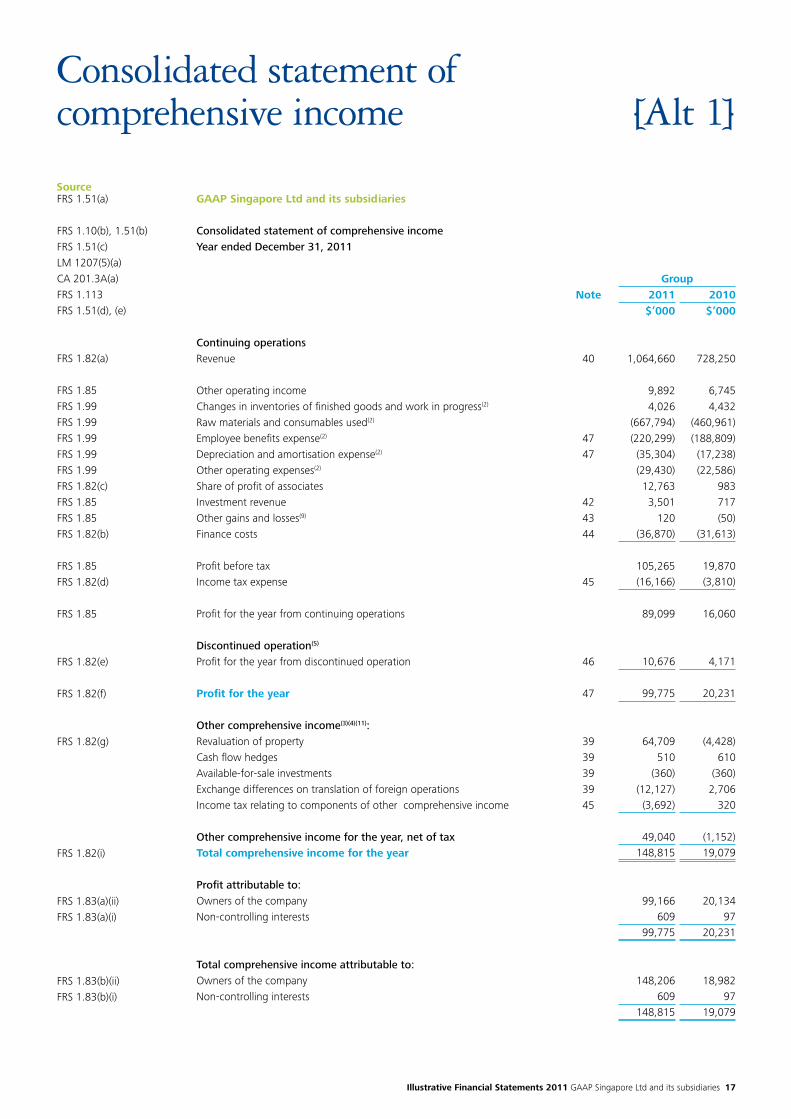
Continuing operationsRevenue 40 1,064,660 728,250
Other operating income 9,892 6,745Changes in inventories of finished goods and work in progress(2) 4,026 4,432Raw materials and consumables used(2) (667,794) (460,961)Employee benefits expense(2) 47 (220,299) (188,809)Depreciation and amortisation expense(2) 47 (35,304) (17,238)Other operating expenses(2) (29,430) (22,586)Share of profit of associates 12,763 983Investment revenue 42 3,501 717Other gains and losses(9) 43 120 (50)Finance costs 44 (36,870) (31,613)
Profit before tax 105,265 19,870Income tax expense 45 (16,166) (3,810)
Profit for the year from continuing operations 89,099 16,060
Discontinued operation(5)
Profit for the year from discontinued operation 46 10,676 4,171
Profit for the year 47 99,775 20,231
Other comprehensive income(3)(4)(11):Revaluation of property 39 64,709 (4,428)Cash flow hedges 39 510 610Available-for-sale investments 39 (360) (360)Exchange differences on translation of foreign operations 39 (12,127) 2,706Income tax relating to components of other comprehensive income 45 (3,692) 320
Other comprehensive income for the year, net of tax 49,040 (1,152)Total comprehensive income for the year 148,815 19,079
Profit attributable to:Owners of the company 99,166 20,134Non-controlling interests 609 97
99,775 20,231
Total comprehensive income attributable to:Owners of the company 148,206 18,982Non-controlling interests 609 97
148,815 19,079
GAAP Singapore Ltd and its subsidiaries
Consolidated statement of comprehensive incomeYear ended December 31, 2011
Consolidated statement ofcomprehensive income [Alt 1]
18
SourceGroup
Note 2011 2010$’000 $’000
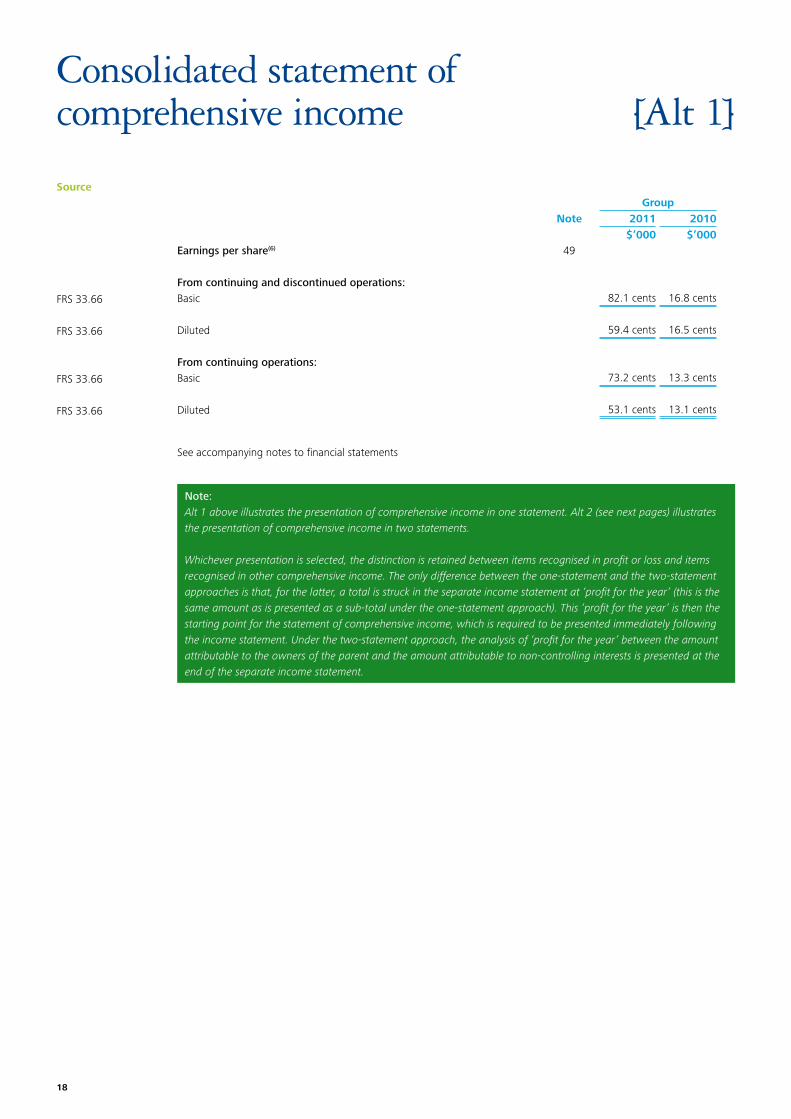
Earnings per share(6) 49
From continuing and discontinued operations:Basic 82.1 cents 16.8 cents
Diluted 59.4 cents 16.5 cents
From continuing operations:Basic 73.2 cents 13.3 cents
Diluted 53.1 cents 13.1 cents
See accompanying notes to financial statements
Note:Alt 1 above illustrates the presentation of comprehensive income in one statement. Alt 2 (see next pages) illustrates the presentation of comprehensive income in two statements.
Whichever presentation is selected, the distinction is retained between items recognised in profit or loss and items recognised in other comprehensive income. The only difference between the one-statement and the two-statement approaches is that, for the latter, a total is struck in the separate income statement at ‘profit for the year’ (this is the same amount as is presented as a sub-total under the one-statement approach). This ‘profit for the year’ is then the starting point for the statement of comprehensive income, which is required to be presented immediately following the income statement. Under the two-statement approach, the analysis of ‘profit for the year’ between the amount attributable to the owners of the parent and the amount attributable to non-controlling interests is presented at the end of the separate income statement.
FRS 33.66
FRS 33.66
FRS 33.66
FRS 33.66
Consolidated statement ofcomprehensive income [Alt 1]
Illustrative Financial Statements 2011 GAAP Singapore Ltd and its subsidiaries 19
SourceFRS 1.51(a)
FRS 1.10(b), 1.51(b)FRS 1.51(c)LM 1207(5)(a)CA 201.3A(a)FRS 1.113FRS 1.51(d), (e)
FRS 1.82(a)
FRS 1.85FRS 1.99
FRS 1.99FRS 1.99FRS 1.99FRS 1.99FRS 1.82(c)FRS 1.85FRS 1.85FRS 1.82(b)
FRS 1.85FRS 1.82(d)
FRS 1.85
FRS 1.82(e)
FRS 1.82(f)
FRS 1.83(a)(ii)FRS 1.83(a)(i)
GroupNote 2011 2010
$’000 $’000
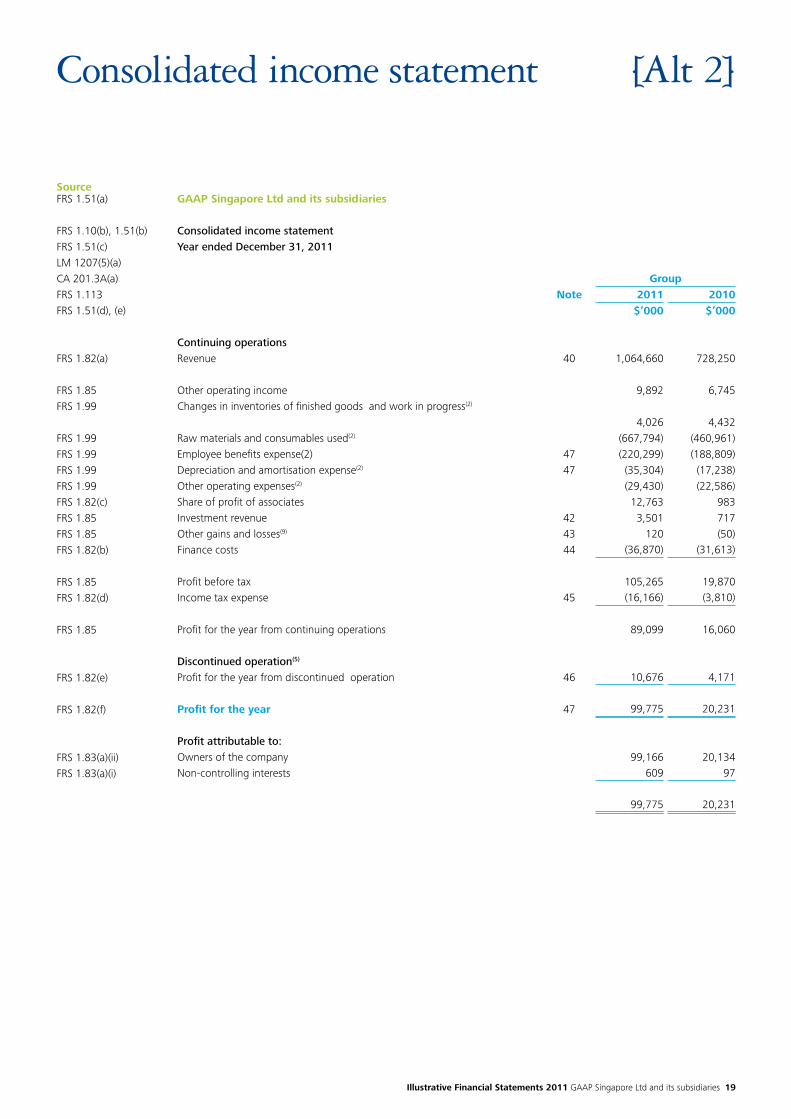
Continuing operationsRevenue 40 1,064,660 728,250
Other operating income 9,892 6,745Changes in inventories of finished goods and work in progress(2)
4,026 4,432Raw materials and consumables used(2) (667,794) (460,961)Employee benefits expense(2) 47 (220,299) (188,809)Depreciation and amortisation expense(2) 47 (35,304) (17,238)Other operating expenses(2) (29,430) (22,586)Share of profit of associates 12,763 983Investment revenue 42 3,501 717Other gains and losses(9) 43 120 (50)Finance costs 44 (36,870) (31,613)
Profit before tax 105,265 19,870Income tax expense 45 (16,166) (3,810)
Profit for the year from continuing operations 89,099 16,060
Discontinued operation(5)
Profit for the year from discontinued operation 46 10,676 4,171
Profit for the year 47 99,775 20,231
Profit attributable to:Owners of the company 99,166 20,134Non-controlling interests 609 97
99,775 20,231
GAAP Singapore Ltd and its subsidiaries
Consolidated income statementYear ended December 31, 2011
Consolidated income statement [Alt 2]
20
SourceGroup
Note 2011 2010$’000 $’000
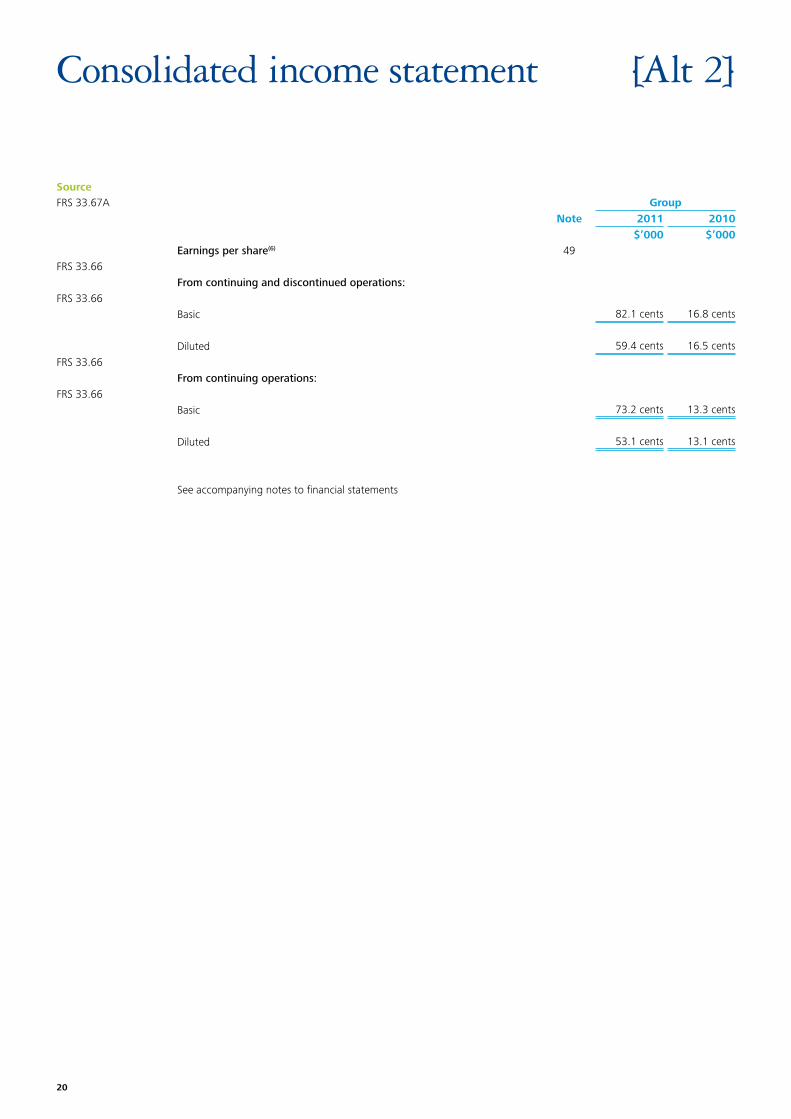
Earnings per share(6) 49
From continuing and discontinued operations:
Basic 82.1 cents 16.8 cents
Diluted 59.4 cents 16.5 cents
From continuing operations:
Basic 73.2 cents 13.3 cents
Diluted 53.1 cents 13.1 cents
See accompanying notes to financial statements
FRS 33.67A
FRS 33.66
FRS 33.66
FRS 33.66
FRS 33.66
Consolidated income statement [Alt 2]
Illustrative Financial Statements 2011 GAAP Singapore Ltd and its subsidiaries 21
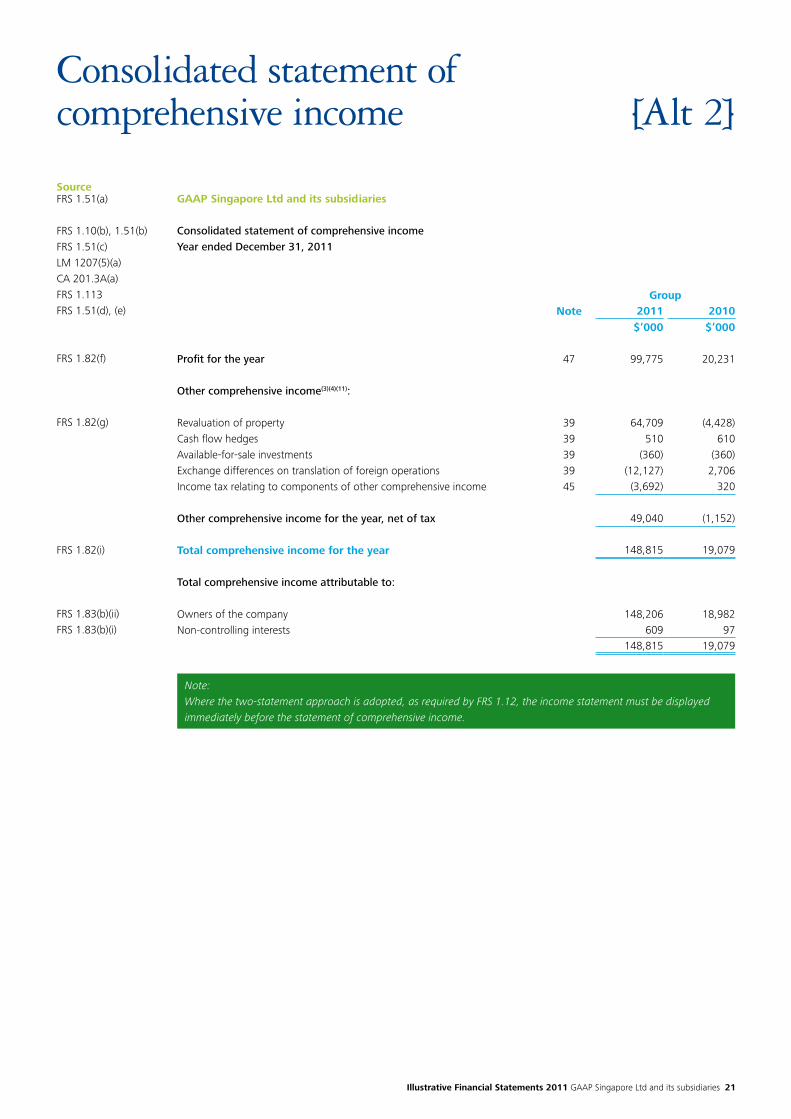
SourceGAAP Singapore Ltd and its subsidiaries
Consolidated statement of comprehensive incomeYear ended December 31, 2011
GroupNote 2011 2010
$’000 $’000
Profit for the year 47 99,775 20,231
Other comprehensive income(3)(4)(11):
Revaluation of property 39 64,709 (4,428)Cash flow hedges 39 510 610Available-for-sale investments 39 (360) (360)Exchange differences on translation of foreign operations 39 (12,127) 2,706Income tax relating to components of other comprehensive income 45 (3,692) 320
Other comprehensive income for the year, net of tax 49,040 (1,152)
Total comprehensive income for the year 148,815 19,079
Total comprehensive income attributable to:
Owners of the company 148,206 18,982Non-controlling interests 609 97
148,815 19,079
Note:Where the two-statement approach is adopted, as required by FRS 1.12, the income statement must be displayed immediately before the statement of comprehensive income.
FRS 1.51(a)
FRS 1.10(b), 1.51(b)FRS 1.51(c)LM 1207(5)(a)CA 201.3A(a)FRS 1.113FRS 1.51(d), (e)
FRS 1.82(f)
FRS 1.82(g)
FRS 1.82(i)
FRS 1.83(b)(ii)FRS 1.83(b)(i)
Consolidated statement ofcomprehensive income [Alt 2]
22
Source
CA 201.3ACA 201.3A(b)LM 1207(5)(b)CA 201.3BA
FRS 1.99
FRS 1.82(a)
FRS 1.99
FRS 1.85FRS 1.85FRS 1.99FRS 1.99FRS 1.99FRS 1.82(c)FRS 1.85FRS 1.85FRS 1.82(b)
FRS 1.85FRS 1.82(d)
FRS 1.85
FRS 1.82(e)
FRS 1.82(f)
FRS 1.83(a)(ii)
FRS 1.83(a)(i)
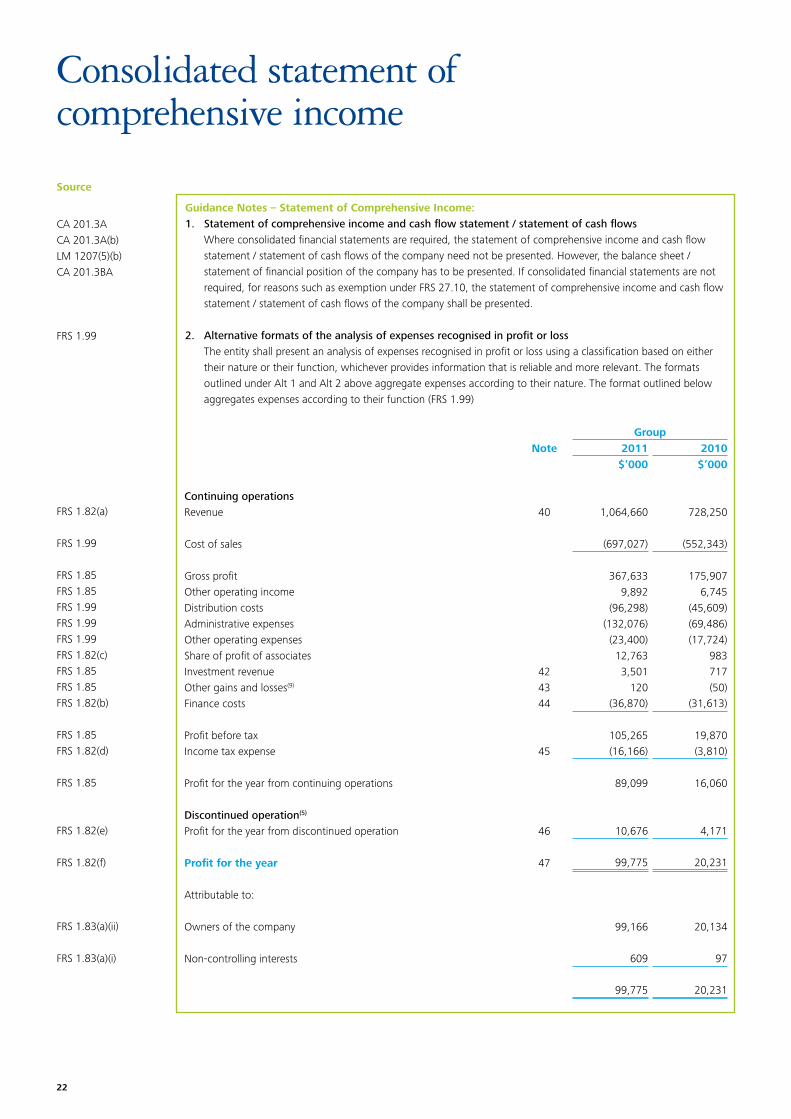
Guidance Notes – Statement of Comprehensive Income: 1. Statement of comprehensive income and cash flow statement / statement of cash flows Where consolidated financial statements are required, the statement of comprehensive income and cash flow
statement / statement of cash flows of the company need not be presented. However, the balance sheet / statement of financial position of the company has to be presented. If consolidated financial statements are not required, for reasons such as exemption under FRS 27.10, the statement of comprehensive income and cash flow statement / statement of cash flows of the company shall be presented.
2. Alternative formats of the analysis of expenses recognised in profit or loss The entity shall present an analysis of expenses recognised in profit or loss using a classification based on either
their nature or their function, whichever provides information that is reliable and more relevant. The formats outlined under Alt 1 and Alt 2 above aggregate expenses according to their nature. The format outlined below aggregates expenses according to their function (FRS 1.99)
GroupNote 2011 2010
$’000 $’000
Continuing operationsRevenue 40 1,064,660 728,250
Cost of sales (697,027) (552,343)
Gross profit 367,633 175,907Other operating income 9,892 6,745Distribution costs (96,298) (45,609)Administrative expenses (132,076) (69,486)Other operating expenses (23,400) (17,724)Share of profit of associates 12,763 983Investment revenue 42 3,501 717Other gains and losses(9) 43 120 (50)Finance costs 44 (36,870) (31,613)
Profit before tax 105,265 19,870Income tax expense 45 (16,166) (3,810)
Profit for the year from continuing operations 89,099 16,060
Discontinued operation(5)
Profit for the year from discontinued operation 46 10,676 4,171
Profit for the year 47 99,775 20,231
Attributable to:
Owners of the company 99,166 20,134
Non-controlling interests 609 97
99,775 20,231
Consolidated statement ofcomprehensive income
Illustrative Financial Statements 2011 GAAP Singapore Ltd and its subsidiaries 23
Source
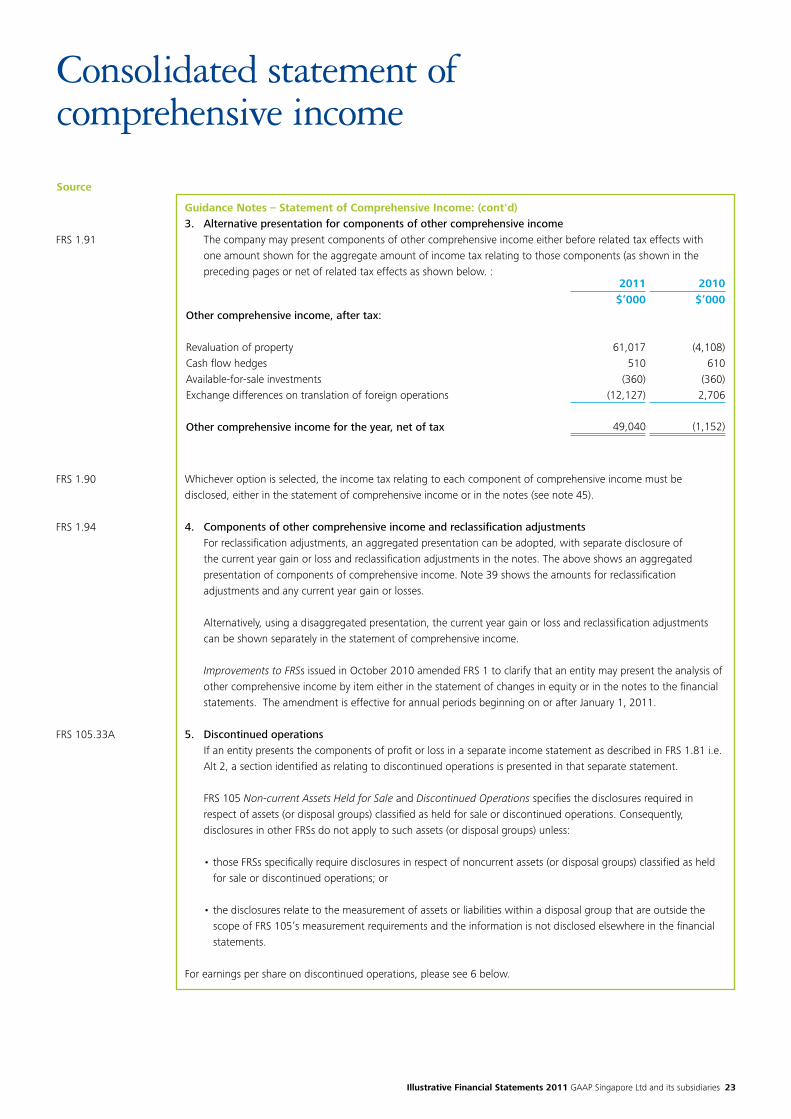
Guidance Notes – Statement of Comprehensive Income: (cont'd)3. Alternative presentation for components of other comprehensive income The company may present components of other comprehensive income either before related tax effects with
one amount shown for the aggregate amount of income tax relating to those components (as shown in the preceding pages or net of related tax effects as shown below. :
Whichever option is selected, the income tax relating to each component of comprehensive income must be disclosed, either in the statement of comprehensive income or in the notes (see note 45).
4. Components of other comprehensive income and reclassification adjustments For reclassification adjustments, an aggregated presentation can be adopted, with separate disclosure of
the current year gain or loss and reclassification adjustments in the notes. The above shows an aggregated presentation of components of comprehensive income. Note 39 shows the amounts for reclassification adjustments and any current year gain or losses.
Alternatively, using a disaggregated presentation, the current year gain or loss and reclassification adjustments can be shown separately in the statement of comprehensive income.
Improvements to FRSs issued in October 2010 amended FRS 1 to clarify that an entity may present the analysis of other comprehensive income by item either in the statement of changes in equity or in the notes to the financial statements. The amendment is effective for annual periods beginning on or after January 1, 2011.
5. Discontinued operations If an entity presents the components of profit or loss in a separate income statement as described in FRS 1.81 i.e.
Alt 2, a section identified as relating to discontinued operations is presented in that separate statement.
FRS 105 Non-current Assets Held for Sale and Discontinued Operations specifies the disclosures required in respect of assets (or disposal groups) classified as held for sale or discontinued operations. Consequently, disclosures in other FRSs do not apply to such assets (or disposal groups) unless:
•thoseFRSsspecificallyrequiredisclosuresinrespectofnoncurrentassets(ordisposalgroups)classifiedasheld for sale or discontinued operations; or
•thedisclosuresrelatetothemeasurementofassetsorliabilitieswithinadisposalgroupthatareoutsidethe scope of FRS 105’s measurement requirements and the information is not disclosed elsewhere in the financial statements.
For earnings per share on discontinued operations, please see 6 below.
FRS 1.91
FRS 1.90
FRS 1.94
FRS 105.33A
2011 2010
$’000 $’000Other comprehensive income, after tax:
Revaluation of property 61,017 (4,108)Cash flow hedges 510 610Available-for-sale investments (360) (360)Exchange differences on translation of foreign operations (12,127) 2,706
Other comprehensive income for the year, net of tax 49,040 (1,152)
Consolidated statement ofcomprehensive income
24
Source
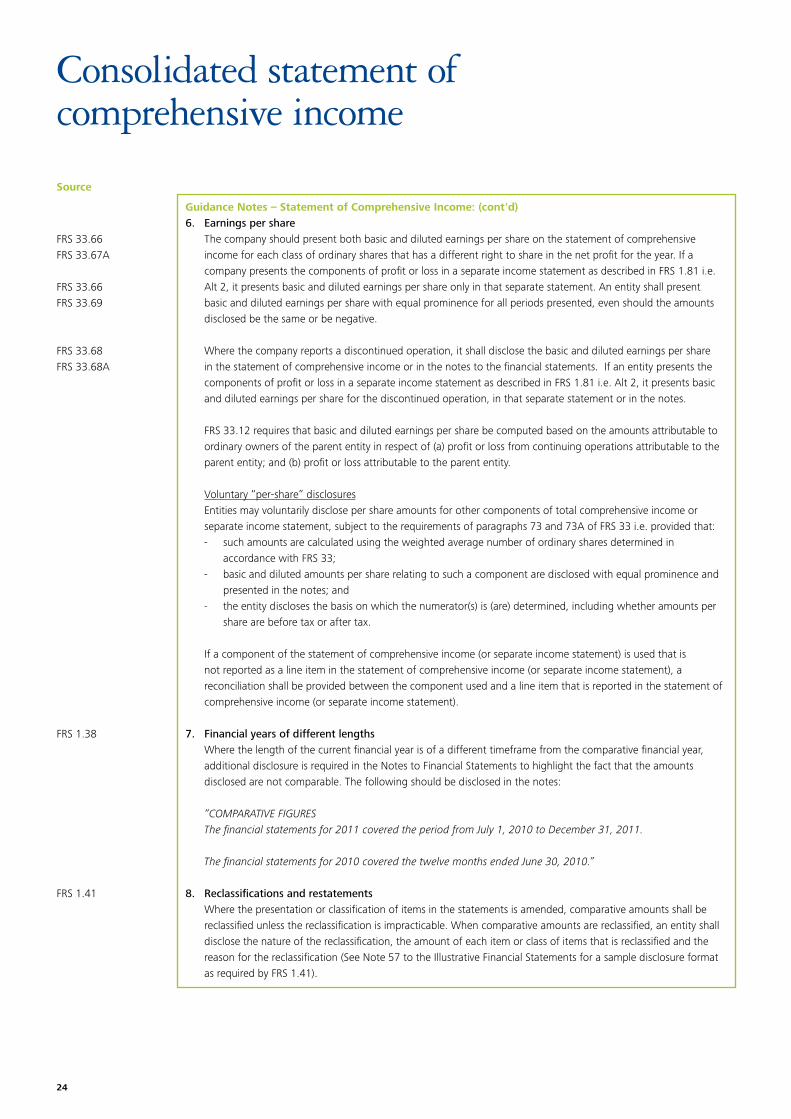
Guidance Notes – Statement of Comprehensive Income: (cont'd)6. Earnings per share The company should present both basic and diluted earnings per share on the statement of comprehensive
income for each class of ordinary shares that has a different right to share in the net profit for the year. If a company presents the components of profit or loss in a separate income statement as described in FRS 1.81 i.e. Alt 2, it presents basic and diluted earnings per share only in that separate statement. An entity shall present basic and diluted earnings per share with equal prominence for all periods presented, even should the amounts disclosed be the same or be negative.
Where the company reports a discontinued operation, it shall disclose the basic and diluted earnings per share in the statement of comprehensive income or in the notes to the financial statements. If an entity presents the components of profit or loss in a separate income statement as described in FRS 1.81 i.e. Alt 2, it presents basic and diluted earnings per share for the discontinued operation, in that separate statement or in the notes.
FRS 33.12 requires that basic and diluted earnings per share be computed based on the amounts attributable to ordinary owners of the parent entity in respect of (a) profit or loss from continuing operations attributable to the parent entity; and (b) profit or loss attributable to the parent entity.
Voluntary “per-share” disclosures Entities may voluntarily disclose per share amounts for other components of total comprehensive income or
separate income statement, subject to the requirements of paragraphs 73 and 73A of FRS 33 i.e. provided that:- such amounts are calculated using the weighted average number of ordinary shares determined in accordance with FRS 33; - basic and diluted amounts per share relating to such a component are disclosed with equal prominence and presented in the notes; and- the entity discloses the basis on which the numerator(s) is (are) determined, including whether amounts per share are before tax or after tax.
If a component of the statement of comprehensive income (or separate income statement) is used that is not reported as a line item in the statement of comprehensive income (or separate income statement), a reconciliation shall be provided between the component used and a line item that is reported in the statement of comprehensive income (or separate income statement).
7. Financial years of different lengths Where the length of the current financial year is of a different timeframe from the comparative financial year,
additional disclosure is required in the Notes to Financial Statements to highlight the fact that the amounts disclosed are not comparable. The following should be disclosed in the notes:
“COMPARATIVE FIGURES The financial statements for 2011 covered the period from July 1, 2010 to December 31, 2011.
The financial statements for 2010 covered the twelve months ended June 30, 2010.”
8. Reclassifications and restatements Where the presentation or classification of items in the statements is amended, comparative amounts shall be
reclassified unless the reclassification is impracticable. When comparative amounts are reclassified, an entity shall disclose the nature of the reclassification, the amount of each item or class of items that is reclassified and the reason for the reclassification (See Note 57 to the Illustrative Financial Statements for a sample disclosure format as required by FRS 1.41).
FRS 33.66FRS 33.67A
FRS 33.66FRS 33.69
FRS 33.68FRS 33.68A
FRS 1.38
FRS 1.41
Consolidated statement ofcomprehensive income
Illustrative Financial Statements 2011 GAAP Singapore Ltd and its subsidiaries 25
Source
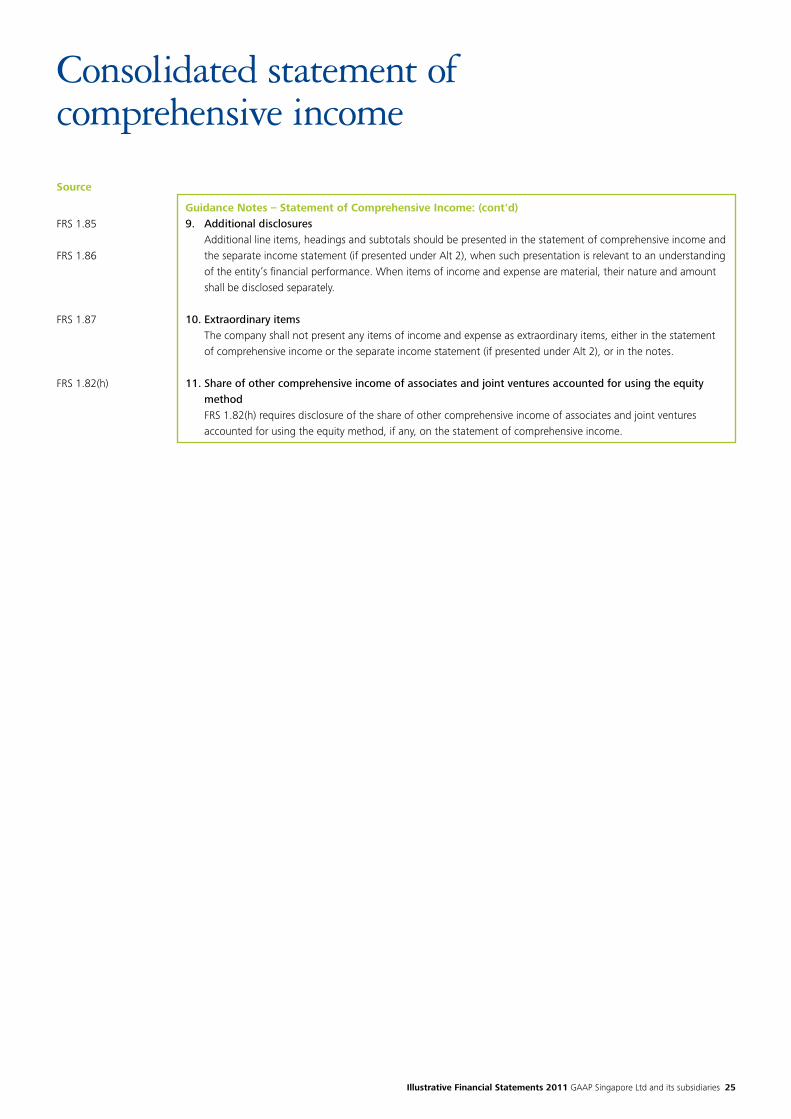
Guidance Notes – Statement of Comprehensive Income: (cont'd)9. Additional disclosures Additional line items, headings and subtotals should be presented in the statement of comprehensive income and
the separate income statement (if presented under Alt 2), when such presentation is relevant to an understanding of the entity’s financial performance. When items of income and expense are material, their nature and amount shall be disclosed separately.
10. Extraordinary items The company shall not present any items of income and expense as extraordinary items, either in the statement
of comprehensive income or the separate income statement (if presented under Alt 2), or in the notes.
11. Share of other comprehensive income of associates and joint ventures accounted for using the equity method
FRS 1.82(h) requires disclosure of the share of other comprehensive income of associates and joint ventures accounted for using the equity method, if any, on the statement of comprehensive income.
FRS 1.85
FRS 1.86
FRS 1.87
FRS 1.82(h)
Consolidated statement ofcomprehensive income
26
FRS
1.51
(a)
FRS
1.10
(c),
1.51
(b)
FRS
1.51
(c)
FRS
1.51
(d),
(e)
FRS
1.10
6(d)
FRS
1.10
6(a)
FRS
1.10
6(d)
FRS
1.10
6(d)
FRS
1.10
7FR
S 1.
106(
d)
FRS
1.10
6(a)
FRS
1.10
6(d)
FRS
1.10
6(d)
FRS
1.10
6(d)
FRS
1.10
6(d)
FRS
1.10
6(d)
FRS
1.10
6(d)
FRS
1.10
7FR
S 1.
106(
d)
FRS
1.10
6(d)
FRS
1.10
6(d)
GA
AP
Sin
gap
ore
Ltd
and
its
sub
sid
iari
es
Stat
emen
ts o
f ch
ange
s in
equ
ity
Year
end
ed D
ecem
ber
31, 2
011
Gro
up
Shar
e
cap
ital
Trea
sury
shar
es
Equit
y
rese
rve
Shar
e
op
tio
ns
rese
rve
Pro
per
ty
reva
luat
ion
rese
rves
Inve
stm
ents
reva
luat
ion
rese
rves
Tran
slat
ion
rese
rves
Hed
gin
g
rese
rves
Ret
ained
earn
ing
s
Att
rib
uta
ble
to e
quit
y
ho
lder
s o
f
the
Co
mp
any
No
n-
Co
ntr
olli
ng
Inte
rest
sTo
tal
$’0
00
$’0
00
$’0
00
$’0
00
$’0
00
$’0
00
$’0
00
$’0
00
$’0
00
$’0
00
$’0
00
$’0
00
(No
te 3
4)
(No
te 3
5)
(No
te 3
6)
(No
te 3
6)
(No
te 3
7)
(No
te 3
7)
(No
te 3
8)
(No
te 3
8)
Bala
nce
at Ja
nuar
y 1,
201
015
2,09
8-
--
37,9
7743
2(5
,098
) 2,
290
146,
107
333,
806
2,47
933
6,28
5
Tota
l com
preh
ensi
ve in
com
e fo
r th
e ye
ar-
--
- (4
,108
) (3
60)
2,70
661
020
,134
18,9
8297
19,0
79
Reco
gniti
on o
f sha
re-b
ased
pay
men
ts-
--
1,20
2-
--
--
1,20
2-
1,20
2
Div
iden
ds-
--
--
--
-(8
,040
)(8
,040
)-
(8,0
40)
Bala
nce
at D
ecem
ber
31, 2
010
152,
098
--
1,20
233
,869
72(2
,392
)2,
900
158,
201
345,
950
2,57
634
8,52
6
Tota
l com
preh
ensi
ve in
com
e fo
r th
e ye
ar-
--
-61
,017
(360
)(1
2,12
7)
510
99,1
6614
8,20
660
914
8,81
5
Non
-con
trol
ling
inte
rest
aris
ing
from
acq
uisi
tion
of s
ubsi
diar
y (N
ote
51.3
)-
--
--
--
--
-1,
500
1,50
0
Effe
cts
of a
cqui
ring
part
of n
on-c
ontr
ollin
g
inte
rest
s in
a s
ubsi
diar
y-
-(2
50)
--
--
--
(250
)(1
00)
(350
)
Reco
gniti
on o
f equ
ity c
ompo
nent
of c
onve
rtib
le
loan
not
es-
-99
5-
--
--
-99
5-
995
Def
erre
d ta
x lia
bilit
y on
reco
gniti
on o
f equ
ity
com
pone
nt o
f con
vert
ible
loan
not
es-
-(1
74)
--
--
--
(174
)-
(174
)
Reco
gniti
on o
f sha
re-b
ased
pay
men
ts-
--
2,86
0-
--
--
2,86
0-
2,86
0
Div
iden
ds-
--
--
--
-(5
,040
)(5
,040
)-
(5,0
40)
Issu
e of
sha
re c
apita
l6,
000
--
--
--
--
6,00
0-
6,00
0
Repu
rcha
se o
f sha
res
-(5
00)
-
-
-
-
-
-
-
(500
)
-
(500
)
Bala
nce
at D
ecem
ber
31, 2
011
158
,098
(5
00)
571
4,06
2 9
4,88
6(2
88)
(14,
519)
3,41
025
2,32
749
8,04
74,
585
502,
632
Sourc
eSt
atem
ents
of c
hang
es in
equ
ity
See
acco
mpa
nyin
g no
tes
to fi
nanc
ial s
tate
men
ts
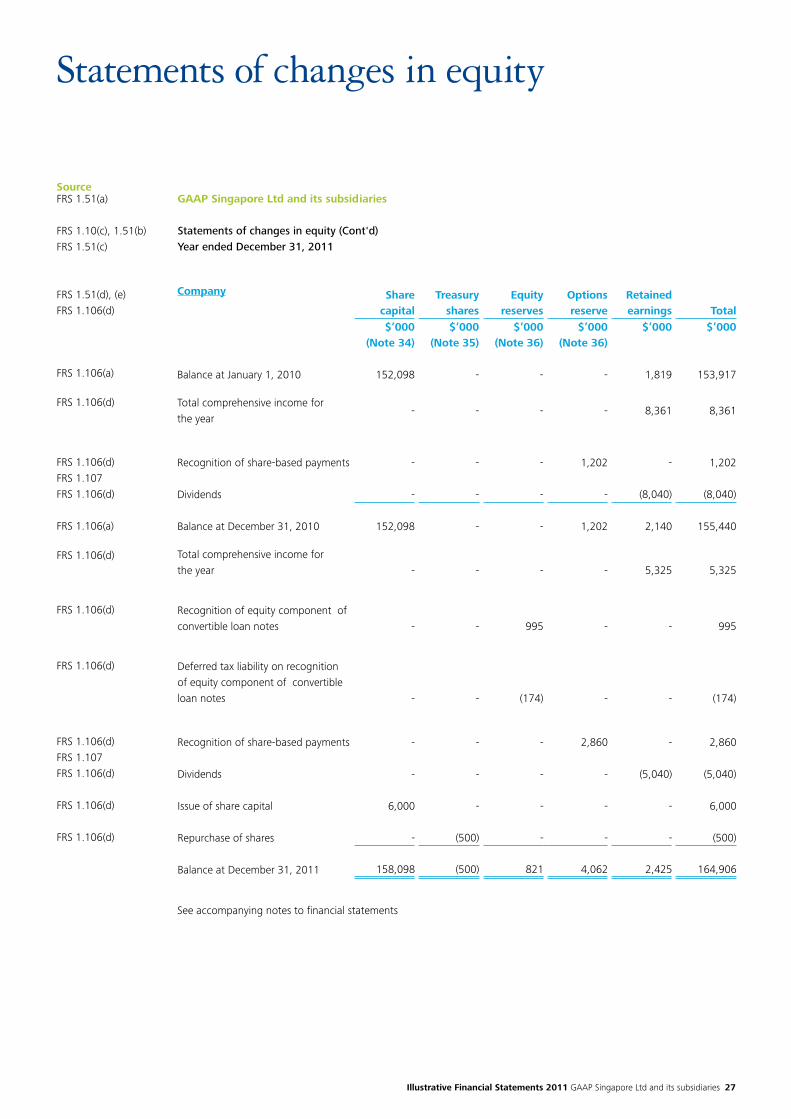
Illustrative Financial Statements 2011 GAAP Singapore Ltd and its subsidiaries 27
SourceFRS 1.51(a)
FRS 1.10(c), 1.51(b)FRS 1.51(c)
FRS 1.51(d), (e)FRS 1.106(d)
FRS 1.106(a)
FRS 1.106(d)
FRS 1.106(d)FRS 1.107FRS 1.106(d)
FRS 1.106(a)
FRS 1.106(d)
FRS 1.106(d)
FRS 1.106(d)
FRS 1.106(d)FRS 1.107FRS 1.106(d)
FRS 1.106(d)
FRS 1.106(d)
Company Share Treasury Equity Options Retainedcapital shares reserves reserve earnings Total
$’000 $’000 $’000 $’000 $’000 $’000(Note 34) (Note 35) (Note 36) (Note 36)
Balance at January 1, 2010 152,098 - - - 1,819 153,917
Total comprehensive income forthe year
- - - - 8,361 8,361
Recognition of share-based payments - - - 1,202 - 1,202
Dividends - - - - (8,040) (8,040)
Balance at December 31, 2010 152,098 - - 1,202 2,140 155,440
Total comprehensive income forthe year - - - - 5,325 5,325
Recognition of equity component of convertible loan notes - - 995 - - 995
Deferred tax liability on recognition of equity component of convertible loan notes - - (174) - - (174)
Recognition of share-based payments - - - 2,860 - 2,860
Dividends - - - - (5,040) (5,040)
Issue of share capital 6,000 - - - - 6,000
Repurchase of shares - (500) - - - (500)
Balance at December 31, 2011 158,098 (500) 821 4,062 2,425 164,906
GAAP Singapore Ltd and its subsidiaries
Statements of changes in equity (Cont'd)Year ended December 31, 2011
Statements of changes in equity
See accompanying notes to financial statements
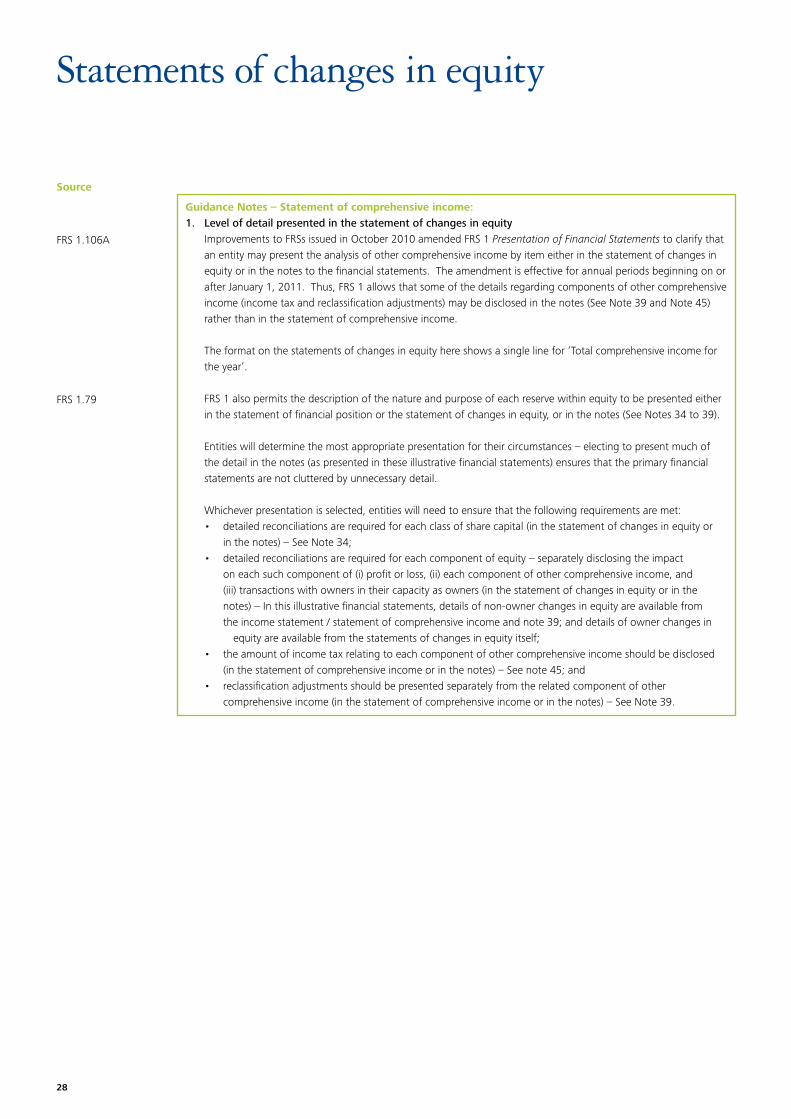
28
Source
FRS 1.106A
FRS 1.79
Guidance Notes – Statement of comprehensive income: 1. Level of detail presented in the statement of changes in equity Improvements to FRSs issued in October 2010 amended FRS 1 Presentation of Financial Statements to clarify that
an entity may present the analysis of other comprehensive income by item either in the statement of changes in equity or in the notes to the financial statements. The amendment is effective for annual periods beginning on or after January 1, 2011. Thus, FRS 1 allows that some of the details regarding components of other comprehensive income (income tax and reclassification adjustments) may be disclosed in the notes (See Note 39 and Note 45) rather than in the statement of comprehensive income.
The format on the statements of changes in equity here shows a single line for ‘Total comprehensive income for the year’.
FRS 1 also permits the description of the nature and purpose of each reserve within equity to be presented either in the statement of financial position or the statement of changes in equity, or in the notes (See Notes 34 to 39).
Entities will determine the most appropriate presentation for their circumstances – electing to present much of the detail in the notes (as presented in these illustrative financial statements) ensures that the primary financial statements are not cluttered by unnecessary detail.
Whichever presentation is selected, entities will need to ensure that the following requirements are met: • detailedreconciliationsarerequiredforeachclassofsharecapital(inthestatementofchangesinequityor
in the notes) – See Note 34; • detailedreconciliationsarerequiredforeachcomponentofequity–separatelydisclosingtheimpact
on each such component of (i) profit or loss, (ii) each component of other comprehensive income, and (iii) transactions with owners in their capacity as owners (in the statement of changes in equity or in the notes) – In this illustrative financial statements, details of non-owner changes in equity are available from the income statement / statement of comprehensive income and note 39; and details of owner changes in equity are available from the statements of changes in equity itself;
• theamountofincometaxrelatingtoeachcomponentofothercomprehensiveincomeshouldbedisclosed (in the statement of comprehensive income or in the notes) – See note 45; and
• reclassificationadjustmentsshouldbepresentedseparatelyfromtherelatedcomponentofother comprehensive income (in the statement of comprehensive income or in the notes) – See Note 39.
Statements of changes in equity
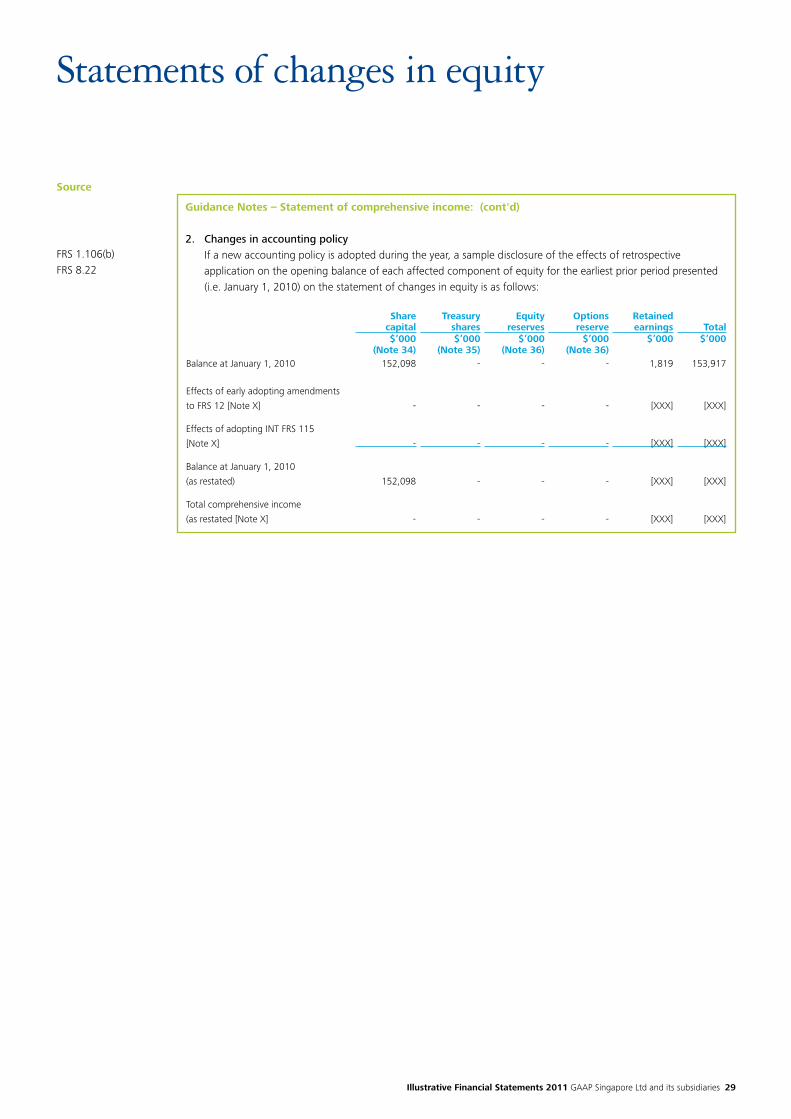
Illustrative Financial Statements 2011 GAAP Singapore Ltd and its subsidiaries 29
Source
Share Treasury Equity Options Retainedcapital shares reserves reserve earnings Total$’000 $’000 $’000 $’000 $’000 $’000
(Note 34) (Note 35) (Note 36) (Note 36)Balance at January 1, 2010 152,098 - - - 1,819 153,917
Effects of early adopting amendments
to FRS 12 [Note X] - - - - [XXX] [XXX]
Effects of adopting INT FRS 115
[Note X] - - - - [XXX] [XXX]
Balance at January 1, 2010
(as restated) 152,098 - - - [XXX] [XXX]
Total comprehensive income
(as restated [Note X] - - - - [XXX] [XXX]
Guidance Notes – Statement of comprehensive income: (cont'd)
2. Changes in accounting policy If a new accounting policy is adopted during the year, a sample disclosure of the effects of retrospective
application on the opening balance of each affected component of equity for the earliest prior period presented (i.e. January 1, 2010) on the statement of changes in equity is as follows:
FRS 1.106(b)FRS 8.22
Statements of changes in equity
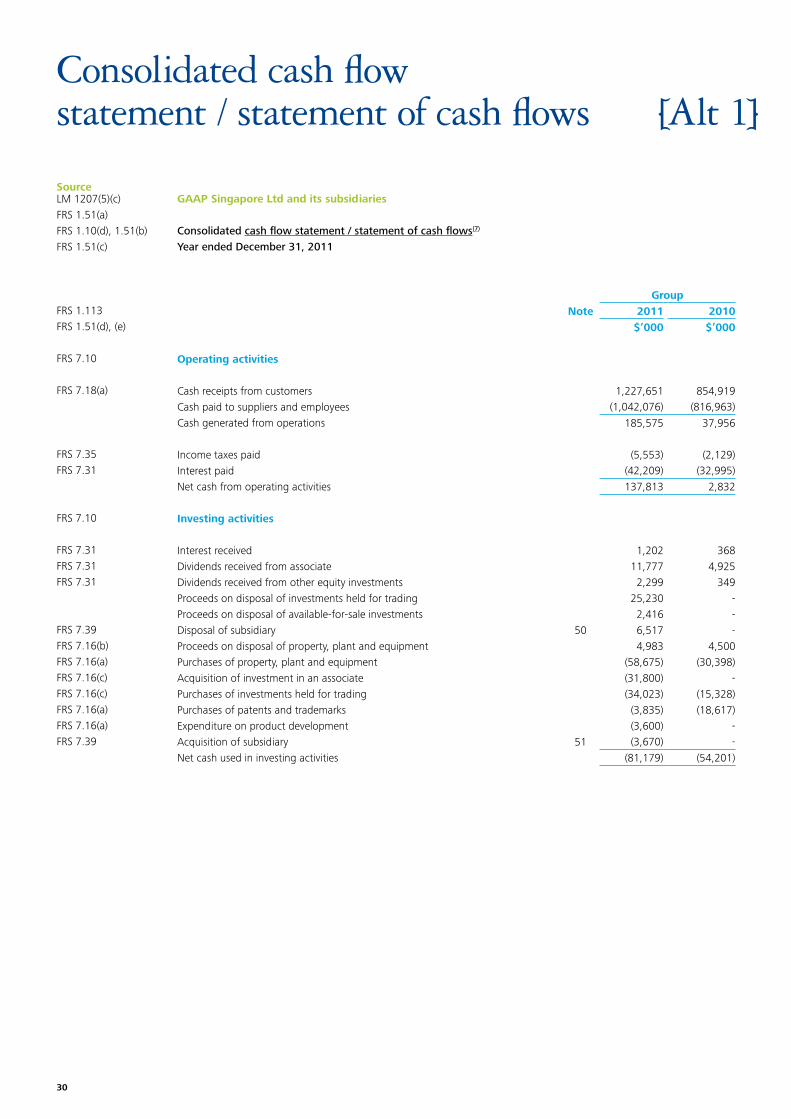
30
SourceLM 1207(5)(c) FRS 1.51(a)FRS 1.10(d), 1.51(b)FRS 1.51(c)
FRS 1.113FRS 1.51(d), (e)
FRS 7.10
FRS 7.18(a)
FRS 7.35FRS 7.31
FRS 7.10
FRS 7.31FRS 7.31FRS 7.31
FRS 7.39FRS 7.16(b)FRS 7.16(a)FRS 7.16(c)FRS 7.16(c)FRS 7.16(a)FRS 7.16(a)FRS 7.39
GroupNote 2011 2010
$’000 $’000
Operating activities
Cash receipts from customers 1,227,651 854,919Cash paid to suppliers and employees (1,042,076) (816,963)Cash generated from operations 185,575 37,956
Income taxes paid (5,553) (2,129)Interest paid (42,209) (32,995)Net cash from operating activities 137,813 2,832
Investing activities
Interest received 1,202 368Dividends received from associate 11,777 4,925Dividends received from other equity investments 2,299 349Proceeds on disposal of investments held for trading 25,230 -Proceeds on disposal of available-for-sale investments 2,416 -Disposal of subsidiary 50 6,517 -Proceeds on disposal of property, plant and equipment 4,983 4,500Purchases of property, plant and equipment (58,675) (30,398)Acquisition of investment in an associate (31,800) -Purchases of investments held for trading (34,023) (15,328)Purchases of patents and trademarks (3,835) (18,617)Expenditure on product development (3,600) -Acquisition of subsidiary 51 (3,670) -Net cash used in investing activities (81,179) (54,201)
GAAP Singapore Ltd and its subsidiaries
Consolidated cash flow statement / statement of cash flows(7)
Year ended December 31, 2011
Consolidated cash flowstatement / statement of cash flows [Alt 1]
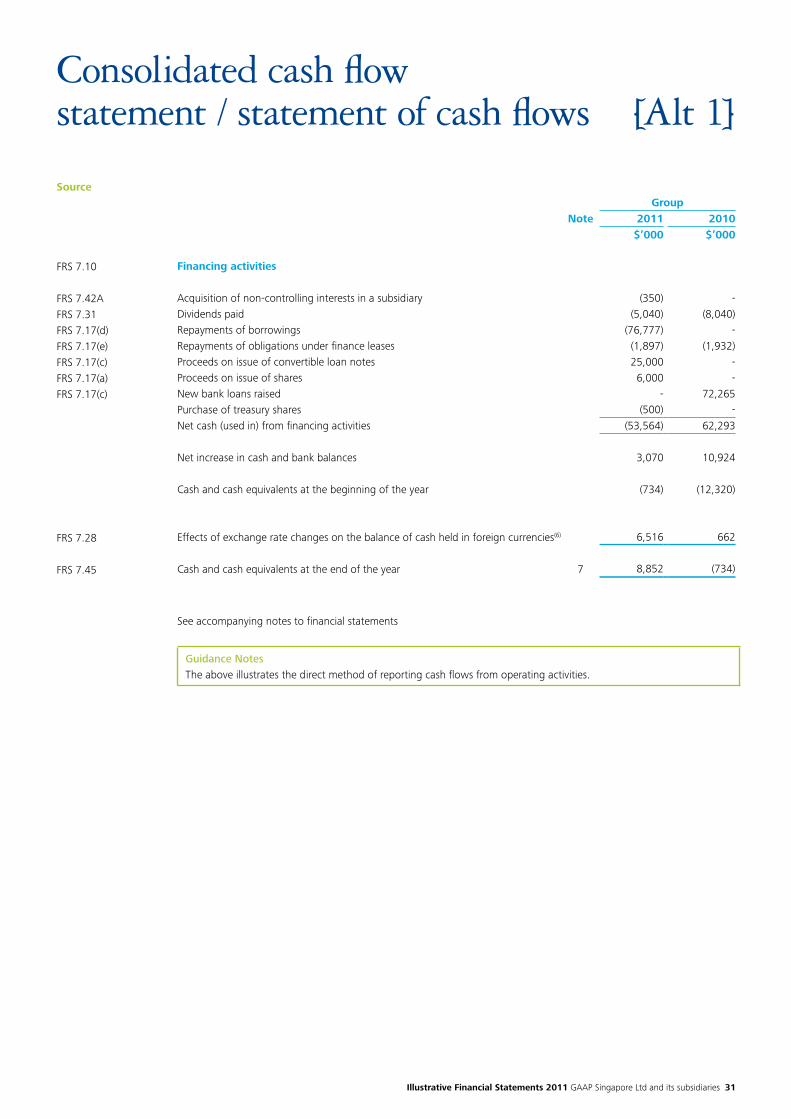
Illustrative Financial Statements 2011 GAAP Singapore Ltd and its subsidiaries 31
Source
See accompanying notes to financial statements
Guidance NotesThe above illustrates the direct method of reporting cash flows from operating activities.
GroupNote 2011 2010
$’000 $’000
Financing activities
Acquisition of non-controlling interests in a subsidiary (350) -Dividends paid (5,040) (8,040)Repayments of borrowings (76,777) -Repayments of obligations under finance leases (1,897) (1,932)Proceeds on issue of convertible loan notes 25,000 -Proceeds on issue of shares 6,000 -New bank loans raised - 72,265Purchase of treasury shares (500) -Net cash (used in) from financing activities (53,564) 62,293
Net increase in cash and bank balances 3,070 10,924
Cash and cash equivalents at the beginning of the year (734) (12,320)
Effects of exchange rate changes on the balance of cash held in foreign currencies(6) 6,516 662
Cash and cash equivalents at the end of the year 7 8,852 (734)
FRS 7.10
FRS 7.42AFRS 7.31FRS 7.17(d)FRS 7.17(e)FRS 7.17(c)FRS 7.17(a)FRS 7.17(c)
FRS 7.28
FRS 7.45
Consolidated cash flowstatement / statement of cash flows [Alt 1]
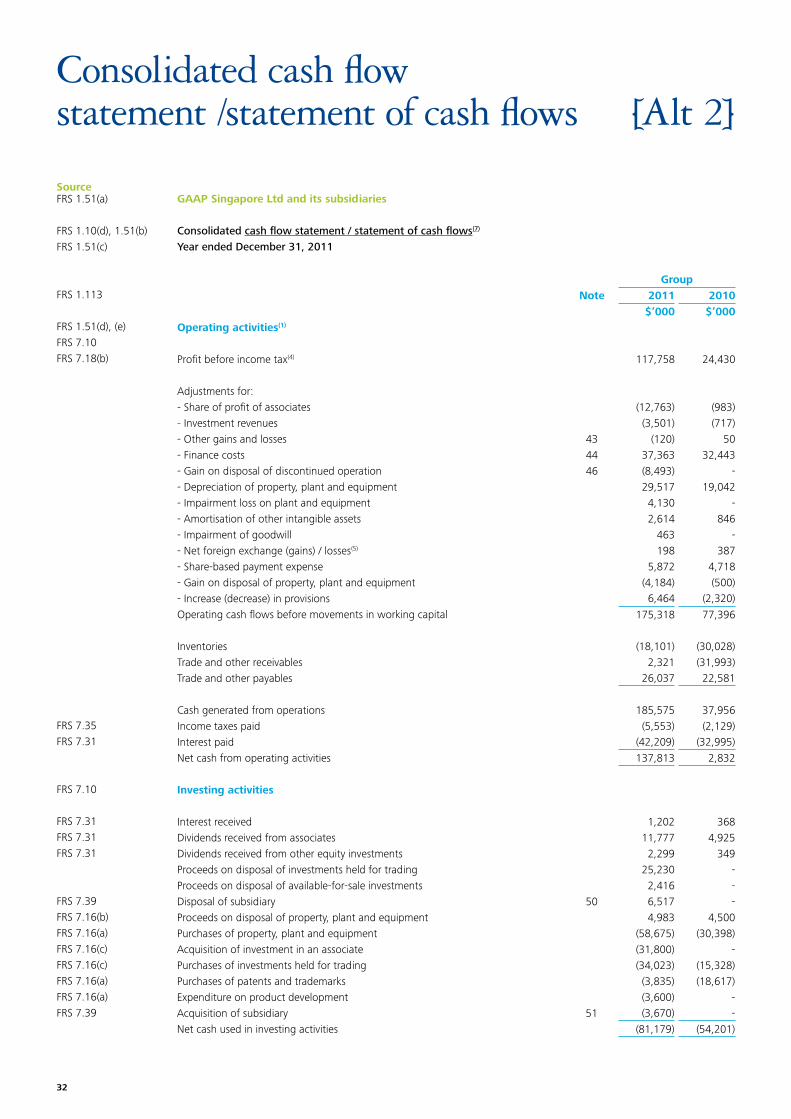
32
SourceFRS 1.51(a)
FRS 1.10(d), 1.51(b)FRS 1.51(c)
FRS 1.113
FRS 1.51(d), (e)FRS 7.10FRS 7.18(b)
FRS 7.35FRS 7.31
FRS 7.10
FRS 7.31FRS 7.31FRS 7.31
FRS 7.39FRS 7.16(b)FRS 7.16(a)FRS 7.16(c)FRS 7.16(c)FRS 7.16(a)FRS 7.16(a)FRS 7.39
GroupNote 2011 2010
$’000 $’000Operating activities(1)
Profit before income tax(4) 117,758 24,430
Adjustments for:- Share of profit of associates (12,763) (983)- Investment revenues (3,501) (717)- Other gains and losses 43 (120) 50- Finance costs 44 37,363 32,443- Gain on disposal of discontinued operation 46 (8,493) -- Depreciation of property, plant and equipment 29,517 19,042- Impairment loss on plant and equipment 4,130 -- Amortisation of other intangible assets 2,614 846- Impairment of goodwill 463 -- Net foreign exchange (gains) / losses(5) 198 387- Share-based payment expense 5,872 4,718- Gain on disposal of property, plant and equipment (4,184) (500)- Increase (decrease) in provisions 6,464 (2,320)Operating cash flows before movements in working capital 175,318 77,396
Inventories (18,101) (30,028)Trade and other receivables 2,321 (31,993)Trade and other payables 26,037 22,581
Cash generated from operations 185,575 37,956Income taxes paid (5,553) (2,129)Interest paid (42,209) (32,995)Net cash from operating activities 137,813 2,832
Investing activities
Interest received 1,202 368Dividends received from associates 11,777 4,925Dividends received from other equity investments 2,299 349Proceeds on disposal of investments held for trading 25,230 -Proceeds on disposal of available-for-sale investments 2,416 -Disposal of subsidiary 50 6,517 -Proceeds on disposal of property, plant and equipment 4,983 4,500Purchases of property, plant and equipment (58,675) (30,398)Acquisition of investment in an associate (31,800) -Purchases of investments held for trading (34,023) (15,328)Purchases of patents and trademarks (3,835) (18,617)Expenditure on product development (3,600) -Acquisition of subsidiary 51 (3,670) -Net cash used in investing activities (81,179) (54,201)
GAAP Singapore Ltd and its subsidiaries
Consolidated cash flow statement / statement of cash flows(7)
Year ended December 31, 2011
Consolidated cash flowstatement /statement of cash flows [Alt 2]
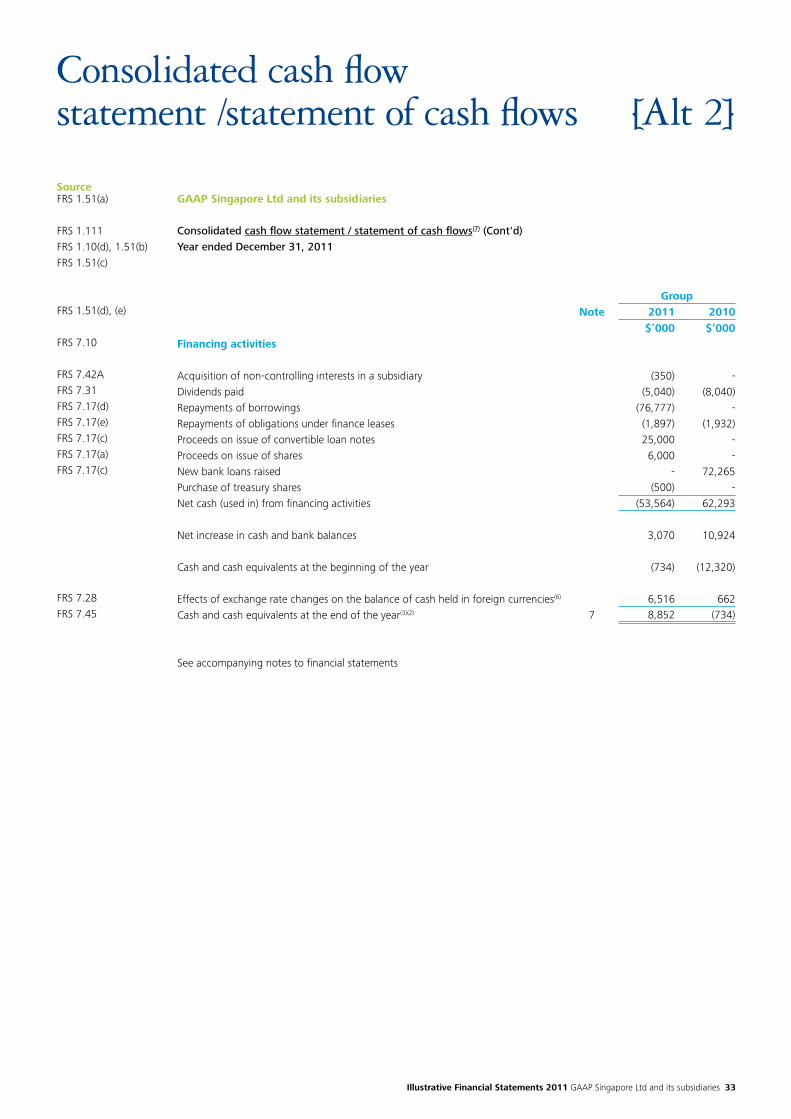
Illustrative Financial Statements 2011 GAAP Singapore Ltd and its subsidiaries 33
Source
GroupNote 2011 2010
$’000 $’000Financing activities
Acquisition of non-controlling interests in a subsidiary (350) -Dividends paid (5,040) (8,040)Repayments of borrowings (76,777) -Repayments of obligations under finance leases (1,897) (1,932)Proceeds on issue of convertible loan notes 25,000 -Proceeds on issue of shares 6,000 -New bank loans raised - 72,265Purchase of treasury shares (500) -Net cash (used in) from financing activities (53,564) 62,293
Net increase in cash and bank balances 3,070 10,924
Cash and cash equivalents at the beginning of the year (734) (12,320)
Effects of exchange rate changes on the balance of cash held in foreign currencies(6) 6,516 662Cash and cash equivalents at the end of the year(3)(2) 7 8,852 (734)
See accompanying notes to financial statements
GAAP Singapore Ltd and its subsidiaries Consolidated cash flow statement / statement of cash flows(7) (Cont'd)Year ended December 31, 2011
FRS 1.51(a)
FRS 1.111FRS 1.10(d), 1.51(b)FRS 1.51(c)
FRS 1.51(d), (e)
FRS 7.10
FRS 7.42AFRS 7.31FRS 7.17(d)FRS 7.17(e)FRS 7.17(c)FRS 7.17(a)FRS 7.17(c)
FRS 7.28FRS 7.45
Consolidated cash flowstatement /statement of cash flows [Alt 2]
34
Source
Guidance Notes – Consolidated cash flow statement / Statement of cash flows1. The above illustrates the indirect method of reporting cash flows from operating activities.
2. Restricted cash and cash equivalents An entity shall disclose, together with a commentary by management, the amount of significant cash and cash
equivalent balances held by the enterprise that are not available for use by the group. Examples include cash and cash equivalent balances held by a subsidiary that operates in a country where exchange controls or other legal restrictions apply where the balances are not available for general use by the parent or other subsidiaries.
3. Definition of cash and cash equivalents An investment normally qualifies as a cash equivalent only when it is a short-term, highly liquid investment that is
readily convertible to known amounts of cash, and which is subject to an insignificant risk of changes in value.
4. Reconciliation to statement of comprehensive income The balance reflected as profit before income tax in the consolidated cash flow statements / statements of
cash flows (indirect method) is derived from the aggregate of profit before tax from discontinued operation [$4,000,000 (2010: $4,560,000)] (Note 46), the gain on disposal of discontinued operation [$8,493,000 (2010: $Nil)] (Note 46) and profit before tax from continuing operations [$105,265,000 (2010: $19,870,000)] (statement of comprehensive income).
5. Net foreign exchange gains or losses (if material) If foreign exchange gains or losses recognised in profit or loss for the year arises from cash flow items other than
operating cash flows, they should be included as an adjustment to profit or loss before tax, in arriving at the operating cash flows under the indirect method.
6. Effects of exchange rate changes on the balance of cash Unrealised gains and losses arising from changes in foreign currency exchange rates are not cash flows. However,
the effect of exchange rate changes on cash and cash equivalents held or due in a foreign currency is reported in the cash flow statement in order to reconcile cash and cash equivalents at the beginning and the end of the period. This amount is presented separately from cash flows from operating, investing and financing activities and includes the differences, if any, had those cash flows been reported at end of period exchange rates.
7. Delete where appropriate
Consolidated cash flowstatement /statement of cash flows
Illustrative Financial Statements 2011 GAAP Singapore Ltd and its subsidiaries 35
SourceFRS 1.10(e)
FRS 1.51(a),(b),(c)FRS 1.112(a)FRS 1.113
FRS 1.138(a)
FRS 1.138(b)
FRS 10.17
FRS 1.25
GAAP Singapore Ltd and its subsidiaries Notes to financial statementsDecember 31, 2011
1. General
The company (Registration Number 200001999A) is incorporated in Singapore with its principal place of business and registered office at 1 Gaap Avenue, #01-00, GAAP Building, Singapore 099001. The company is listed on the Singapore Exchange Securities Trading Limited. The financial statements are expressed in Singapore dollars.
The principal activity of the company is that of investment holding.
The principal activities of the subsidiaries are disclosed in Note 20 to the financial statements.
The consolidated financial statements of the group and balance sheet / statement of financial position and statement of changes in equity of the company for the year ended December 31, 2011 were authorised for issue by the Board of Directors on January 31, 2012.
Guidance Notes:When management is aware, in making its assessment, of material uncertainties related to events or conditions that may cast significant doubt upon the entity’s ability to continue as a going concern, the entity shall disclose those uncertainties. An example of such a disclosure is as follows:
At the end of the reporting period, the entity’s liabilities exceeded its assets by $xx and the entity made losses of $xx during the financial year. These conditions cast significant doubt upon the entity’s ability to continue as a going concern. The financial statements have been prepared on a going concern basis because the holding company has undertaken to provide continuing financial support to the entity to enable the entity to pay its debts as and when they fall due.
Notes to financial statements
36
Source2. Summary of significant accounting policies
Guidance Notes:Entities are required to disclose in the summary of significant accounting policies the measurement basis (or bases) used in preparing the financial statements and the other accounting policies used that are relevant to an understanding of the financial statements. An accounting policy may be significant because of the nature of the entity's operations even if amounts for the current and prior periods are not material.
In deciding whether a particular accounting policy should be disclosed, management considers whether disclosure would assist users in understanding how transactions, other events and conditions are reflected in the reported financial performance and financial position. Disclosure of particular accounting policies is especially useful to users when those policies are selected from alternatives allowed in FRS.
Each entity considers the nature of its operations and the policies that users of its financial statements would expect to be disclosed for that type of entity. It is also appropriate to disclose each significant accounting policy that is not specifically required by FRSs, but that is selected and applied in accordance with FRS 8 Accounting Policies, Changes in Accounting Estimates and Errors.
Notes on significant accounting policies should be arranged in a manner that follows the sequence of items presented in the financial statements.
Basis of accounting – The financial statements have been prepared in accordance with the historical cost basis except as disclosed in the accounting policies below, and are drawn up in accordance with the provisions of the Singapore Companies Act and Singapore Financial Reporting Standards (“FRS”).
Adoption of new and revised standards - In the current financial year, the group has adopted all the new and revised FRSs and Interpretations of FRS (“INT FRS”) that are relevant to its operations and effective for annual periods beginning on or after January 1, 2011. The adoption of these new / revised FRSs and INT FRSs does not result in changes to the group’s and company’s accounting policies and has no material effect on the amounts reported for the current or prior years except as disclosed below:
FRS 24 (Revised) Related Party DisclosuresFRS 24 (Revised) Related Party Disclosures has been adopted beginning January 1, 2011 and has been applied retrospectively. The revised Standard clarifies the definition of a related party and consequently the following additional party have been identified as related to the group:
•Jointventuresofaninvestorwhohassignificantinfluenceoverthegroup
In addition, the group is required to disclose commitments between itself and its related parties.
The additional disclosures on application of the revised Standard can be found in Note 6.
FRS 1.117(a), (b)
FRS 8.28
FRS 8.30FRS 8.31
Notes to financial statements
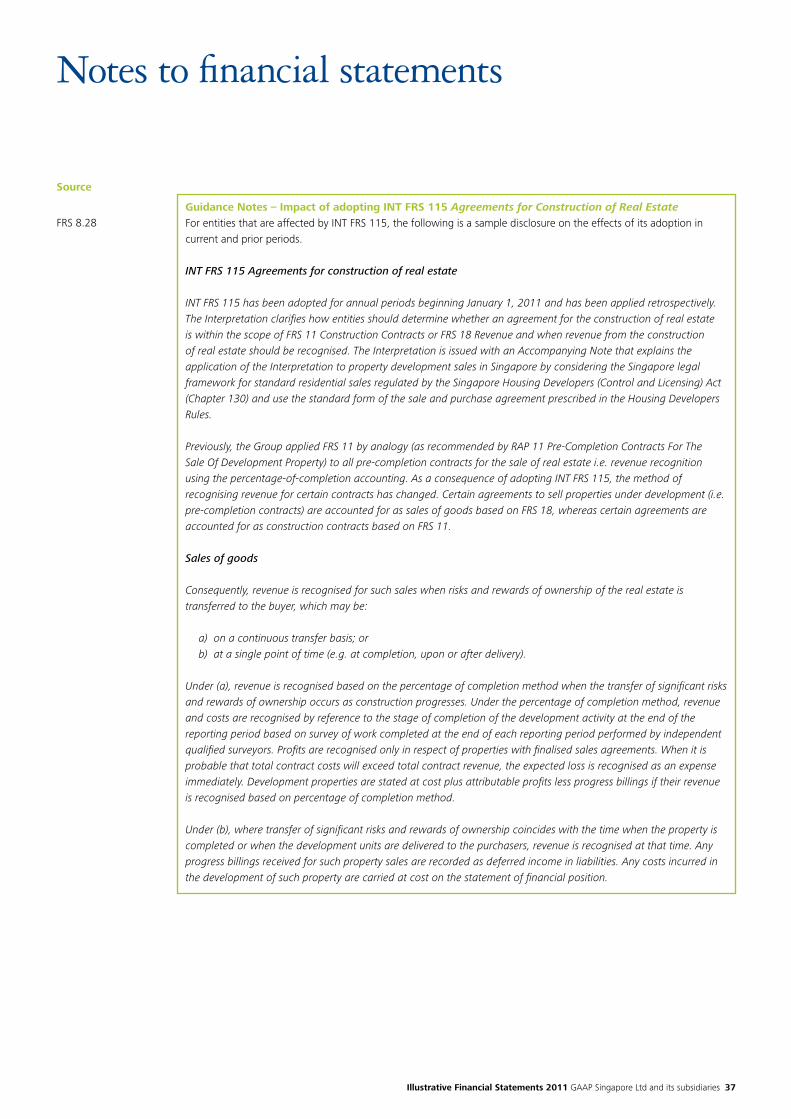
Illustrative Financial Statements 2011 GAAP Singapore Ltd and its subsidiaries 37
Source
Guidance Notes – Impact of adopting INT FRS 115 Agreements for Construction of Real EstateFor entities that are affected by INT FRS 115, the following is a sample disclosure on the effects of its adoption in current and prior periods.
INT FRS 115 Agreements for construction of real estate
INT FRS 115 has been adopted for annual periods beginning January 1, 2011 and has been applied retrospectively. The Interpretation clarifies how entities should determine whether an agreement for the construction of real estate is within the scope of FRS 11 Construction Contracts or FRS 18 Revenue and when revenue from the construction of real estate should be recognised. The Interpretation is issued with an Accompanying Note that explains the application of the Interpretation to property development sales in Singapore by considering the Singapore legal framework for standard residential sales regulated by the Singapore Housing Developers (Control and Licensing) Act (Chapter 130) and use the standard form of the sale and purchase agreement prescribed in the Housing Developers Rules.
Previously, the Group applied FRS 11 by analogy (as recommended by RAP 11 Pre-Completion Contracts For The Sale Of Development Property) to all pre-completion contracts for the sale of real estate i.e. revenue recognition using the percentage-of-completion accounting. As a consequence of adopting INT FRS 115, the method of recognising revenue for certain contracts has changed. Certain agreements to sell properties under development (i.e. pre-completion contracts) are accounted for as sales of goods based on FRS 18, whereas certain agreements are accounted for as construction contracts based on FRS 11.
Sales of goods
Consequently, revenue is recognised for such sales when risks and rewards of ownership of the real estate is transferred to the buyer, which may be:
a) on a continuous transfer basis; or b) at a single point of time (e.g. at completion, upon or after delivery).
Under (a), revenue is recognised based on the percentage of completion method when the transfer of significant risks and rewards of ownership occurs as construction progresses. Under the percentage of completion method, revenue and costs are recognised by reference to the stage of completion of the development activity at the end of the reporting period based on survey of work completed at the end of each reporting period performed by independent qualified surveyors. Profits are recognised only in respect of properties with finalised sales agreements. When it is probable that total contract costs will exceed total contract revenue, the expected loss is recognised as an expense immediately. Development properties are stated at cost plus attributable profits less progress billings if their revenue is recognised based on percentage of completion method.
Under (b), where transfer of significant risks and rewards of ownership coincides with the time when the property is completed or when the development units are delivered to the purchasers, revenue is recognised at that time. Any progress billings received for such property sales are recorded as deferred income in liabilities. Any costs incurred in the development of such property are carried at cost on the statement of financial position.
FRS 8.28
Notes to financial statements

38
Source
Construction contractsAgreements for construction of real estate that fall within scope of construction contracts continue to be accounted for based on the requirements in FRS 11.
The following are the estimated effects of retrospective application on the amounts reported in 2010 and 2011:
Group
2011 2011 2010 2010
$’000 $’000 $’000 $’000
(Restated) (Restated)
Development property xxxx xxxx xxxx xxxx
Deferred income (progress billings received) xxxx xxxx xxxx xxxx
Work-in-progress xxxx xxxx xxxx xxxx
Retained earnings xxxx xxxx xxxx xxxx
Revenue xxxx xxxx xxxx xxxx
Cost of sales xxxx xxxx xxxx xxxx
Profit before income tax (continuing operations) xxxx xxxx xxxx xxxx
Income tax expense (continuing operations) xxxx xxxx xxxx xxxx
Profit after income tax (continuing operations) xxxx xxxx xxxx xxxx
2011 2011 2010 2010
Cents Cents Cents Cents
Impact on basic earnings per share
- continuing and discontinued operation xxx xxx xxx xxx
- continuing operation xxx xxx xxx xxx
Impact on diluted earnings per share
- continuing and discontinued operation xxx xxx xxx xxx
- continuing operation xxx xxx xxx xxx
If the impact on earnings per share is not material, to include a statement to indicate this fact e.g.:
“The change in accounting policy has no impact on the earnings per share as reported in the statement of comprehensive income.”
FRS 8.28(f)
Notes to financial statements
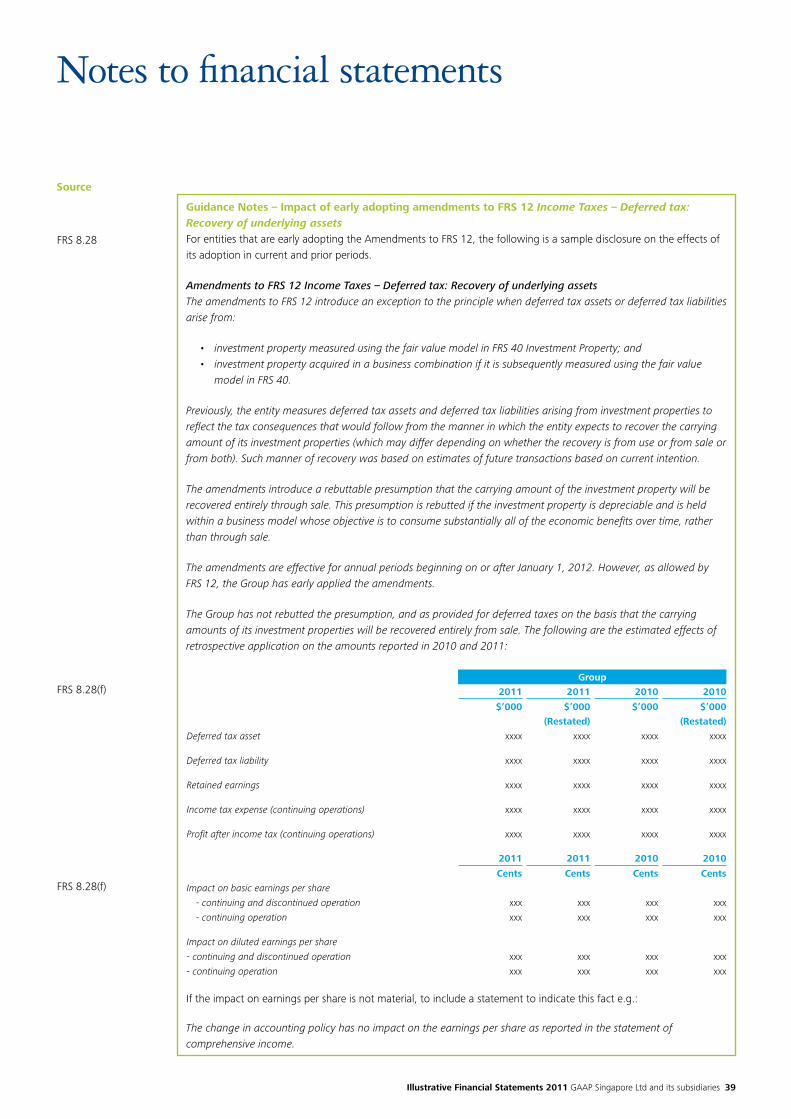
Illustrative Financial Statements 2011 GAAP Singapore Ltd and its subsidiaries 39
Source
FRS 8.28
FRS 8.28(f)
FRS 8.28(f)
Guidance Notes – Impact of early adopting amendments to FRS 12 Income Taxes – Deferred tax: Recovery of underlying assetsFor entities that are early adopting the Amendments to FRS 12, the following is a sample disclosure on the effects of its adoption in current and prior periods.
Amendments to FRS 12 Income Taxes – Deferred tax: Recovery of underlying assetsThe amendments to FRS 12 introduce an exception to the principle when deferred tax assets or deferred tax liabilities arise from:
• investmentpropertymeasuredusingthefairvaluemodelinFRS40InvestmentProperty;and• investmentpropertyacquiredinabusinesscombinationifitissubsequentlymeasuredusingthefairvalue model in FRS 40.
Previously, the entity measures deferred tax assets and deferred tax liabilities arising from investment properties to reflect the tax consequences that would follow from the manner in which the entity expects to recover the carrying amount of its investment properties (which may differ depending on whether the recovery is from use or from sale or from both). Such manner of recovery was based on estimates of future transactions based on current intention.
The amendments introduce a rebuttable presumption that the carrying amount of the investment property will be recovered entirely through sale. This presumption is rebutted if the investment property is depreciable and is held within a business model whose objective is to consume substantially all of the economic benefits over time, rather than through sale.
The amendments are effective for annual periods beginning on or after January 1, 2012. However, as allowed by FRS 12, the Group has early applied the amendments.
The Group has not rebutted the presumption, and as provided for deferred taxes on the basis that the carrying amounts of its investment properties will be recovered entirely from sale. The following are the estimated effects of retrospective application on the amounts reported in 2010 and 2011:
Group
2011 2011 2010 2010
$’000 $’000 $’000 $’000
(Restated) (Restated)
Deferred tax asset xxxx xxxx xxxx xxxx
Deferred tax liability xxxx xxxx xxxx xxxx
Retained earnings xxxx xxxx xxxx xxxx
Income tax expense (continuing operations) xxxx xxxx xxxx xxxx
Profit after income tax (continuing operations) xxxx xxxx xxxx xxxx
2011 2011 2010 2010
Cents Cents Cents Cents
Impact on basic earnings per share
- continuing and discontinued operation xxx xxx xxx xxx
- continuing operation xxx xxx xxx xxx
Impact on diluted earnings per share
- continuing and discontinued operation xxx xxx xxx xxx
- continuing operation xxx xxx xxx xxx
If the impact on earnings per share is not material, to include a statement to indicate this fact e.g.:
The change in accounting policy has no impact on the earnings per share as reported in the statement of comprehensive income.
Notes to financial statements
40
SourceFRS 8.30
FRS 8.30
FRS 27(2009).4
FRS 27(2009).26
FRS 27(2009).24
FRS 27(2009).20
FRS 27(2009).18(c)FRS 103(2009).19
FRS 27(2009).28
At the date of authorisation of these financial statements, the following FRSs, INT FRSs and amendments to FRS that are relevant to the group and the company were issued but not effective:
Guidance Notes:See Appendix A for a list of FRSs that are issued but not effective at the date of authorisation of financial statements.
It is not required to list all FRSs, INT FRSs and amendments to FRS that are issued but not effective at date of authorisation of financial statements. Only those relevant to the entity should be indicated.
The sample list of FRSs issued but not effective yet as of October 31, 2011 is listed in Appendix A. The potential impact of any new or revised FRSs, INT FRSs and amendments to FRS after October 31, 2011 but before the issue of the financial statements should also be considered and disclosed.
The management anticipates that the adoption of the above FRSs, INT FRSs and amendments to FRS in future periods will not have a material impact on the financial statements of the group and of the company in the period of their initial adoption except for the following:
Guidance Notes:See Appendix A for sample disclosures on FRSs that are issued but not effective at the date of authorisation of the financial statements, but will have a material impact on the financial statements in the period of their initial adoption.
Basis of consolidation - The consolidated financial statements incorporate the financial statements of the Company and entities (including special purpose entities) controlled by the Company (its subsidiaries). Control is achieved where the Company has the power to govern the financial and operating policies of an entity so as to obtain benefits from its activities.
The results of subsidiaries acquired or disposed of during the year are included in the consolidated statement of comprehensive income from the effective date of acquisition and up to the effective date of disposal, as appropriate.
Where necessary, adjustments are made to the financial statements of subsidiaries to bring their accounting policies into line with those used by other members of the Group.
All intra-group transactions, balances, income and expenses are eliminated in full on consolidation.
Non-controlling interests in subsidiaries are identified separately from the Group’s equity therein. The interest of non-controlling shareholders that are present ownership interests and entitle their holders to a proportionate share of the entity's net assets in the event of liquidation may be initially measured (at date of original business combination) either at fair value or at the non-controlling interests’ proportionate share of the fair value of the acquiree’s identifiable net assets. The choice of measurement basis is made on an acquisition-by-acquisition basis. Other types of non-controlling interests are measured at fair value or, when applicable, on the basis specified in another FRS. Subsequent to acquisition, the carrying amount of non-controlling interests is the amount of those interests at initial recognition plus the non-controlling interests’ share of subsequent changes in equity. Total comprehensive income is attributed to non-controlling interests even if this results in the non-controlling interests having a deficit balance.
Guidance Notes:The accounting policy note above incorporates the amendments to FRS 103 Business Combinations arising from Improvements to FRS 2010 in relation to initial measurement of non-controlling interests.
Notes to financial statements
Illustrative Financial Statements 2011 GAAP Singapore Ltd and its subsidiaries 41
SourceChanges in the Group’s interest in a subsidiary that do not result in a loss of control are accounted for as equity transactions. The carrying amounts of the Group’s interests and the non-controlling interests are adjusted to reflect the changes in their relative interests in the subsidiary. Any difference between the amount by which the non-controlling interests are adjusted and the fair value of the consideration paid or received is recognised directly in equity and attributed to owners of the Company.
When the Group loses control of a subsidiary, the profit or loss on disposal is calculated as the difference between (i) the aggregate of the fair value of the consideration received and the fair value of any retained interest and (ii) the previous carrying amount of the assets (including goodwill), and liabilities of the subsidiary and any non-controlling interests. Amounts previously recognised in other comprehensive income in relation to the subsidiary are accounted for (i.e. reclassified to profit or loss or transferred directly to retained earnings) in the same manner as would be required if the relevant assets or liabilities were disposed of. The fair value of any investment retained in the former subsidiary at the date when control is lost is regarded as the fair value on initial recognition for subsequent accounting under FRS 39 Financial Instruments: Recognition and Measurement or, when applicable, the cost on initial recognition of an investment in an associate or jointly controlled entity.
In the company’s financial statements, investments in subsidiaries, associates and joint ventures are carried at cost less any impairment in net recoverable value that has been recognised in profit or loss.
Business combinations - Acquisitions of subsidiaries and businesses are accounted for using the acquisition method. The consideration for each acquisition is measured at the aggregate of the acquisition date fair values of assets given, liabilities incurred by the Group to the former owners of the acquiree, and equity interests issued by the Group in exchange for control of the acquiree. Acquisition-related costs are recognised in profit or loss as incurred.
Where applicable, the consideration for the acquisition includes any asset or liability resulting from a contingent consideration arrangement, measured at its acquisition-date fair value. Subsequent changes in such fair values are adjusted against the cost of acquisition where they qualify as measurement period adjustments (see below). The subsequent accounting for changes in the fair value of the contingent consideration that do not qualify as measurement period adjustments depends on how the contingent consideration is classified. Contingent consideration that is classified as equity is not remeasured at subsequent reporting dates and its subsequent settlement is accounted for within equity. Contingent consideration that is classified as an asset or a liability is remeasured at subsequent reporting dates in accordance with FRS 39 Financial Instruments: Recognition and Measurement, or FRS 37 Provisions, Contingent Liabilities and Contingent Assets, as appropriate, with the corresponding gain or loss being recognised in profit or loss.
Where a business combination is achieved in stages, the Group’s previously held interests in the acquired entity are remeasured to fair value at the acquisition date (i.e. the date the Group attains control) and the resulting gain or loss, if any, is recognised in profit or loss. Amounts arising from interests in the acquiree prior to the acquisition date that have previously been recognised in other comprehensive income are reclassified to profit or loss, where such treatment would be appropriate if that interest were disposed of.
The acquiree’s identifiable assets, liabilities and contingent liabilities that meet the conditions for recognition under the FRS are recognised at their fair value at the acquisition date, except that:
• deferredtaxassetsorliabilitiesandliabilitiesorassetsrelatedtoemployeebenefitarrangementsarerecognisedandmeasured in accordance with FRS 12 Income Taxes and FRS 19 Employee Benefits respectively;
• liabilitiesorequityinstrumentsrelatedtoshare-basedpaymenttransactionsoftheacquireeorthereplacementofanacquiree’s share-based payment awards transactions with share-based payment awards transactions of the acquirer in accordance with the method in FRS 102 Share-based Payment at the acquisition date; and
FRS 27(2009).30
FRS 27(2009).31
FRS 27(2009).34
FRS 27(2009).36
FRS 27(2009).43(c)
FRS 103(2009).4 FRS 103(2009).37 FRS 103(2009).38 FRS 103(2009).53
FRS 103(2009).39 FRS 103(2009).58
FRS 103(2009).42
FRS 103(2009).18FRS 103(2009).21
FRS 103(2009).24FRS 103(2009).26
FRS 103(2009).30
Notes to financial statements
42
Source
Guidance Notes:The accounting policy note above incorporates the amendments to FRS 103 Business Combinations arising from Improvements to FRS 2010 in relation to accounting for unreplaced and voluntarily replaced share-based payment awards.
• assets(ordisposalgroups)thatareclassifiedasheldforsaleinaccordancewithFRS105Non-current Assets Held for Sale and Discontinued Operations are measured in accordance with that Standard.
If the initial accounting for a business combination is incomplete by the end of the reporting period in which the combination occurs, the Group reports provisional amounts for the items for which the accounting is incomplete. Those provisional amounts are adjusted during the measurement period (see below), or additional assets or liabilities are recognised, to reflect new information obtained about facts and circumstances that existed as of the acquisition date that, if known, would have affected the amounts recognised as of that date.
The measurement period is the period from the date of acquisition to the date the Group obtains complete information about facts and circumstances that existed as of the acquisition date – and is subject to a maximum of one year from acquisition date.
The accounting policy for initial measurement of non-controlling interests is described above.
The policy described above is applied to all business combinations that take place on or after January 1, 2010.
Financial instruments - Financial assets and financial liabilities are recognised on the group’s balance sheet / statement of financial position when the group becomes a party to the contractual provisions of the instrument.
Effective interest method The effective interest method is a method of calculating the amortised cost of a financial instrument and of allocating interest income or expense over the relevant period. The effective interest rate is the rate that exactly discounts estimated future cash receipts or payments (including all fees on points paid or received that form an integral part of the effective interest rate, transaction costs and other premiums or discounts) through the expected life of the financial instrument, or where appropriate, a shorter period. Income and expense is recognised on an effective interest basis for debt instruments other than those financial instruments “at fair value through profit or loss”.
Financial assets All financial assets are recognised and de-recognised on a trade date where the purchase or sale of an investment is under a contract whose terms require delivery of the investment within the timeframe established by the market concerned, and are initially measured at fair value plus transaction costs, except for those financial assets classified as at fair value through profit or loss which are initially measured at fair value.
Financial assets are classified into the following specified categories: financial assets “at fair value through profit or loss”, “held-to-maturity investments”, “available-for-sale” financial assets and “loans and receivables”. The classification depends on the nature and purpose of financial assets and is determined at the time of initial recognition.
FRS 103(2009).31
FRS 103(2009).45
FRS 103(2009).46
FRS 107.B5(e)
FRS 107.21
Notes to financial statements
Illustrative Financial Statements 2011 GAAP Singapore Ltd and its subsidiaries 43
SourceFinancial assets at fair value through profit or loss (FVTPL)Financial assets are classified as at FVTPL where the financial asset is either held for trading or it is designated as at FVTPL.
A financial asset is classified as held for trading if:
• ithasbeenacquiredprincipallyforthepurposeofsellinginthenearfuture;or
• itisapartofanidentifiedportfoliooffinancialinstrumentsthatthegroupmanagestogetherandhasarecentactualpattern of short-term profit-taking; or
• itisaderivativethatisnotdesignatedandeffectiveasahedginginstrument.
A financial asset other than a financial asset held for trading may be designated as at FVTPL upon initial recognition if:
• suchdesignationeliminatesorsignificantlyreducesameasurementorrecognitioninconsistencythatwouldotherwise arise; or
• thefinancialassetformspartofagroupoffinancialassetsorfinancialliabilitiesorboth,whichismanagedanditsperformance is evaluated on a fair value basis, in accordance with the group's documented risk management or investment strategy, and information about the grouping is provided internally on that basis; or
• itformspartofacontractcontainingoneormoreembeddedderivatives,andFRS39Financial Instruments: Recognition and Measurement permits the entire combined contract (asset or liability) to be designated as at FVTPL.
Financial assets at fair value through profit or loss are stated at fair value, with any resultant gain or loss recognised in profit or loss. The net gain or loss recognised in profit or loss incorporates any dividend or interest earned on the financial asset and is included in ‘other gains and losses’ line in the statement of comprehensive income / income statement. Fair value is determined in the manner described in Note 4.
Held-to-maturity investmentsBonds with fixed or determinable payments and fixed maturity dates where the group has a positive intent and ability to hold to maturity are classified as held-to-maturity investments. Held-to-maturity investments are recorded at amortised cost using the effective interest method less impairment, with revenue recognised on an effective yield basis.
Available-for-sale financial assetsCertain shares and debt securities held by the group are classified as being available for sale and are stated at fair value. Fair value is determined in the manner described in Note 4. Gains and losses arising from changes in fair value are recognised in other comprehensive income with the exception of impairment losses, interest calculated using the effective interest method and foreign exchange gains and losses on monetary assets which are recognised directly in profit or loss. Where the investment is disposed of or is determined to be impaired, the cumulative gain or loss previously recognised in other comprehensive income and accumulated in revaluation reserve is reclassified to profit or loss. Dividends on available-for-sale equity instruments are recognised in profit or loss when the group’s right to receive payments is established. The fair value of available-for-sale monetary assets denominated in a foreign currency is determined in that foreign currency and translated at the spot rate at end of the reporting period. The change in fair value attributable to translation differences that result from a change in amortised cost of the asset is recognised in profit or loss, and other changes are recognised in other comprehensive income.
Loans and receivablesTrade receivables, loans and other receivables that have fixed or determinable payments that are not quoted in an active market are classified as “loans and receivables”. Loans and receivables are measured at amortised cost using the effective interest method less impairment. Interest is recognised by applying the effective interest rate method, except for short-term receivables when the recognition of interest would be immaterial.
FRS 107.B5(e)
Notes to financial statements
44
SourceImpairment of financial assetsFinancial assets, other than those at fair value through profit or loss, are assessed for indicators of impairment at the end of each reporting period. Financial assets are impaired where there is objective evidence that, as a result of one or more events that occurred after the initial recognition of the financial asset, the estimated future cash flows of the investment have been impacted.
For available-for-sale equity instruments, a significant or prolonged decline in the fair value of the investment below its cost is considered to be objective evidence of impairment.
For all other financial assets, objective evidence of impairment could include:
•significantfinancialdifficultyoftheissuerorcounterparty;or
•defaultordelinquencyininterestorprincipalpayments;or
•itbecomingprobablethattheborrowerwillenterbankruptcyorfinancialre-organisation.
For certain categories of financial asset, such as trade receivables, assets that are assessed not to be impaired individually are, in addition, assessed for impairment on a collective basis. Objective evidence of impairment for a portfolio of receivables could include the Group’s past experience of collecting payments, an increase in the number of delayed payments in the portfolio past the average credit period of 60 days, as well as observable changes in national or local economic conditions that correlate with default on receivables.
For financial assets carried at amortised cost, the amount of the impairment is the difference between the asset’s carrying amount and the present value of estimated future cash flows, discounted at the original effective interest rate. The carrying amount of the financial asset is reduced by the impairment loss directly for all financial assets with the exception of trade receivables where the carrying amount is reduced through the use of an allowance account. When a trade receivable is uncollectible, it is written off against the allowance account. Subsequent recoveries of amounts previously written off are credited against the allowance account. Changes in the carrying amount of the allowance account are recognised in profit or loss.
When an available-for-sale financial asset is considered to be impaired, cumulative gains or losses previously recognised in other comprehensive income are reclassified to profit or loss. With the exception of available-for-sale instruments, if, in a subsequent period, the amount of the impairment loss decreases and the decrease can be related objectively to an event occurring after the impairment loss was recognised, the previously recognised impairment loss is reversed through profit or loss to the extent the carrying amount of the investment at the date the impairment is reversed does not exceed what the amortised cost would have been had the impairment not been recognised.
In respect of available-for-sale equity instruments, impairment losses previously recognised in profit or loss are not reversed through profit or loss. Any subsequent increase in fair value after an impairment loss is recognised in other comprehensive income. In respect of available-for-sale debt instruments, impairment losses are subsequently reversed through profit or loss if an increase in the fair value of the investment can be objectively related to an event occurring after the recognition of the impairment loss.
Derecognition of financial assetsThe group derecognises a financial asset only when the contractual rights to the cash flows from the asset expire, or it transfers the financial asset and substantially all the risks and rewards of ownership of the asset to another entity, If the group neither transfers nor retains substantially all the risks and rewards of ownership and continues to control the transferred asset, the group recognises its retained interest in the asset and an associated liability for amounts it may have to pay. If the group retains substantially all the risks and rewards of ownership of a transferred financial asset, the group continues to recognise the financial asset and also recognises a collateralised borrowing for the proceeds received.
FRS 107.B5(f), 37(b)
Notes to financial statements
Illustrative Financial Statements 2011 GAAP Singapore Ltd and its subsidiaries 45
SourceFinancial liabilities and equity instruments
Classification as debt or equityFinancial liabilities and equity instruments issued by the group are classified according to the substance of the contractual arrangements entered into and the definitions of a financial liability and an equity instrument.
Equity instrumentsAn equity instrument is any contract that evidences a residual interest in the assets of the group after deducting all of its liabilities. Equity instruments are recorded at the proceeds received, net of direct issue costs.
Financial liabilitiesFinancial liabilities are classified as either financial liabilities “at fair value through profit or loss” or other financial liabilities.
Financial liabilities at fair value through profit or loss (FVTPL)Financial liabilities are classified as at FVTPL where the financial liability is either held for trading or it is designated as at FVTPL.
A financial liability is classified as held for trading if:
• ithasbeenincurredprincipallyforthepurposeofrepurchasinginthenearfuture;or
• itisapartofanidentifiedportfoliooffinancialinstrumentsthatthegroupmanagestogetherandhasarecentactualpattern of short-term profit-taking; or
• itisaderivativethatisnotdesignatedandeffectiveasahedginginstrument.
A financial liability other than a financial liability held for trading may be designated as at FVTPL upon initial recognition if:
• suchdesignationeliminatesorsignificantlyreducesameasurementorrecognitioninconsistencythatwouldotherwise arise; or
• thefinancialliabilityformspartofagroupoffinancialassetsorfinancialliabilitiesorboth,whichismanagedandits performance is evaluated on a fair value basis, in accordance with the group's documented risk management or investment strategy, and information about the grouping is provided internally on that basis; or
• itformspartofacontractcontainingoneormoreembeddedderivatives,andFRS39permitstheentirecombinedcontract (asset or liability) to be designated as at FVTPL.
Financial liabilities at fair value through profit or loss are initially measured at fair value and subsequently stated at fair value, with any resultant gain or loss recognised in profit or loss. The net gain or loss recognised in profit or loss incorporates any interest paid on the financial liability and is included in the ‘other gains and losses’ line in the statement of comprehensive income / income statement. Fair value is determined in the manner described in Note 4.
FRS 107.21
FRS 107.B5(e)
Notes to financial statements
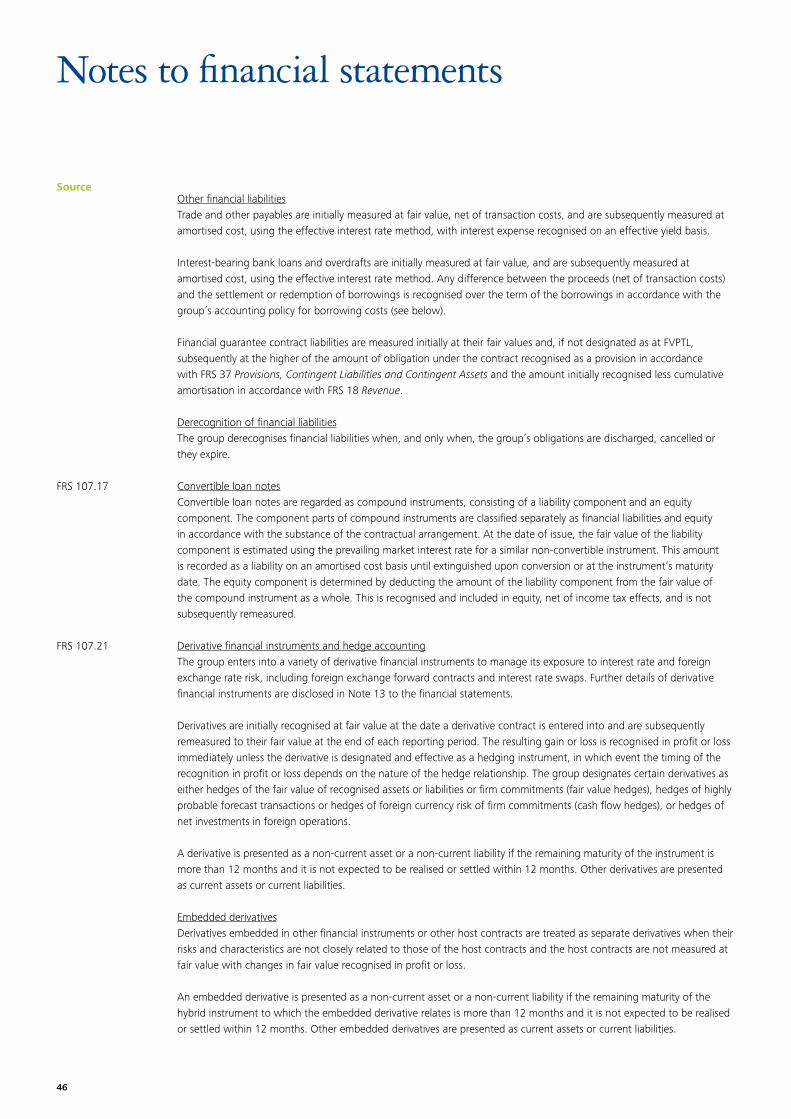
46
SourceOther financial liabilitiesTrade and other payables are initially measured at fair value, net of transaction costs, and are subsequently measured at amortised cost, using the effective interest rate method, with interest expense recognised on an effective yield basis.
Interest-bearing bank loans and overdrafts are initially measured at fair value, and are subsequently measured at amortised cost, using the effective interest rate method. Any difference between the proceeds (net of transaction costs) and the settlement or redemption of borrowings is recognised over the term of the borrowings in accordance with the group’s accounting policy for borrowing costs (see below).
Financial guarantee contract liabilities are measured initially at their fair values and, if not designated as at FVPTL, subsequently at the higher of the amount of obligation under the contract recognised as a provision in accordance with FRS 37 Provisions, Contingent Liabilities and Contingent Assets and the amount initially recognised less cumulative amortisation in accordance with FRS 18 Revenue.
Derecognition of financial liabilitiesThe group derecognises financial liabilities when, and only when, the group’s obligations are discharged, cancelled or they expire.
Convertible loan notesConvertible loan notes are regarded as compound instruments, consisting of a liability component and an equity component. The component parts of compound instruments are classified separately as financial liabilities and equity in accordance with the substance of the contractual arrangement. At the date of issue, the fair value of the liability component is estimated using the prevailing market interest rate for a similar non-convertible instrument. This amount is recorded as a liability on an amortised cost basis until extinguished upon conversion or at the instrument’s maturity date. The equity component is determined by deducting the amount of the liability component from the fair value of the compound instrument as a whole. This is recognised and included in equity, net of income tax effects, and is not subsequently remeasured.
Derivative financial instruments and hedge accountingThe group enters into a variety of derivative financial instruments to manage its exposure to interest rate and foreign exchange rate risk, including foreign exchange forward contracts and interest rate swaps. Further details of derivative financial instruments are disclosed in Note 13 to the financial statements.
Derivatives are initially recognised at fair value at the date a derivative contract is entered into and are subsequently remeasured to their fair value at the end of each reporting period. The resulting gain or loss is recognised in profit or loss immediately unless the derivative is designated and effective as a hedging instrument, in which event the timing of the recognition in profit or loss depends on the nature of the hedge relationship. The group designates certain derivatives as either hedges of the fair value of recognised assets or liabilities or firm commitments (fair value hedges), hedges of highly probable forecast transactions or hedges of foreign currency risk of firm commitments (cash flow hedges), or hedges of net investments in foreign operations.
A derivative is presented as a non-current asset or a non-current liability if the remaining maturity of the instrument is more than 12 months and it is not expected to be realised or settled within 12 months. Other derivatives are presented as current assets or current liabilities.
Embedded derivativesDerivatives embedded in other financial instruments or other host contracts are treated as separate derivatives when their risks and characteristics are not closely related to those of the host contracts and the host contracts are not measured at fair value with changes in fair value recognised in profit or loss.
An embedded derivative is presented as a non-current asset or a non-current liability if the remaining maturity of the hybrid instrument to which the embedded derivative relates is more than 12 months and it is not expected to be realised or settled within 12 months. Other embedded derivatives are presented as current assets or current liabilities.
FRS 107.17
FRS 107.21
Notes to financial statements
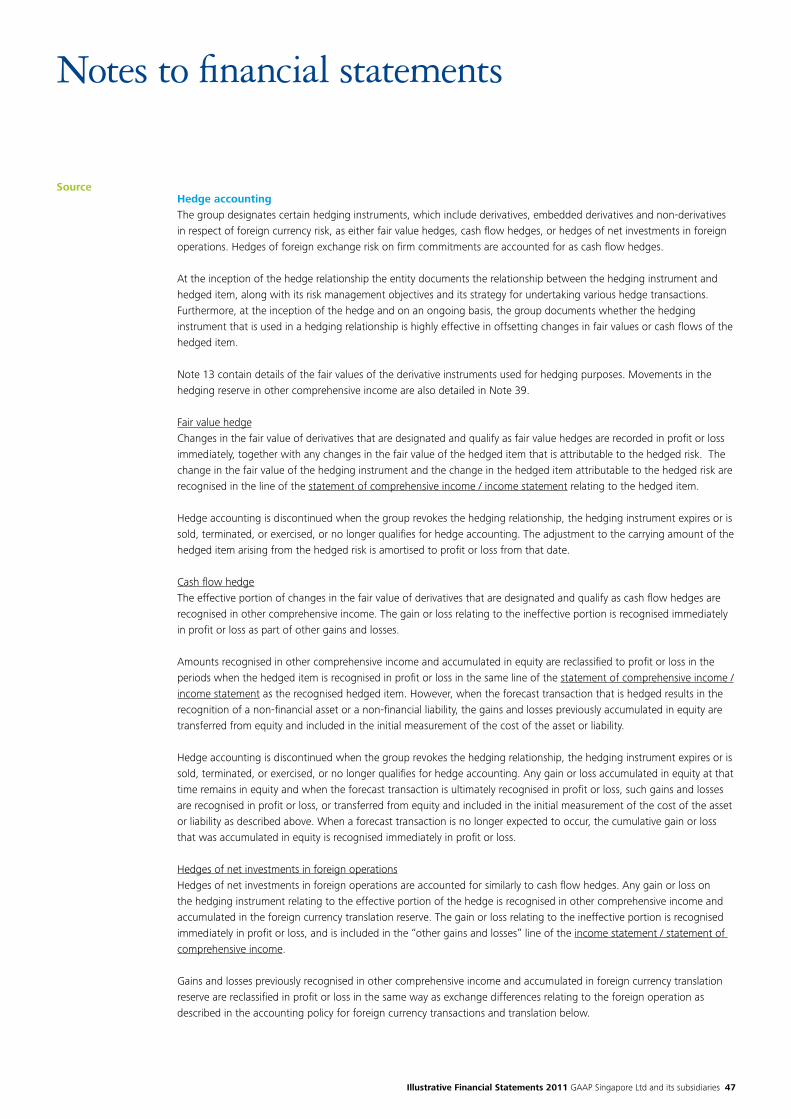
Illustrative Financial Statements 2011 GAAP Singapore Ltd and its subsidiaries 47
SourceHedge accountingThe group designates certain hedging instruments, which include derivatives, embedded derivatives and non-derivatives in respect of foreign currency risk, as either fair value hedges, cash flow hedges, or hedges of net investments in foreign operations. Hedges of foreign exchange risk on firm commitments are accounted for as cash flow hedges.
At the inception of the hedge relationship the entity documents the relationship between the hedging instrument and hedged item, along with its risk management objectives and its strategy for undertaking various hedge transactions. Furthermore, at the inception of the hedge and on an ongoing basis, the group documents whether the hedging instrument that is used in a hedging relationship is highly effective in offsetting changes in fair values or cash flows of the hedged item.
Note 13 contain details of the fair values of the derivative instruments used for hedging purposes. Movements in the hedging reserve in other comprehensive income are also detailed in Note 39.
Fair value hedgeChanges in the fair value of derivatives that are designated and qualify as fair value hedges are recorded in profit or loss immediately, together with any changes in the fair value of the hedged item that is attributable to the hedged risk. The change in the fair value of the hedging instrument and the change in the hedged item attributable to the hedged risk are recognised in the line of the statement of comprehensive income / income statement relating to the hedged item.
Hedge accounting is discontinued when the group revokes the hedging relationship, the hedging instrument expires or is sold, terminated, or exercised, or no longer qualifies for hedge accounting. The adjustment to the carrying amount of the hedged item arising from the hedged risk is amortised to profit or loss from that date.
Cash flow hedgeThe effective portion of changes in the fair value of derivatives that are designated and qualify as cash flow hedges are recognised in other comprehensive income. The gain or loss relating to the ineffective portion is recognised immediately in profit or loss as part of other gains and losses.
Amounts recognised in other comprehensive income and accumulated in equity are reclassified to profit or loss in the periods when the hedged item is recognised in profit or loss in the same line of the statement of comprehensive income /income statement as the recognised hedged item. However, when the forecast transaction that is hedged results in the recognition of a non-financial asset or a non-financial liability, the gains and losses previously accumulated in equity are transferred from equity and included in the initial measurement of the cost of the asset or liability.
Hedge accounting is discontinued when the group revokes the hedging relationship, the hedging instrument expires or is sold, terminated, or exercised, or no longer qualifies for hedge accounting. Any gain or loss accumulated in equity at that time remains in equity and when the forecast transaction is ultimately recognised in profit or loss, such gains and losses are recognised in profit or loss, or transferred from equity and included in the initial measurement of the cost of the asset or liability as described above. When a forecast transaction is no longer expected to occur, the cumulative gain or loss that was accumulated in equity is recognised immediately in profit or loss.
Hedges of net investments in foreign operationsHedges of net investments in foreign operations are accounted for similarly to cash flow hedges. Any gain or loss on the hedging instrument relating to the effective portion of the hedge is recognised in other comprehensive income and accumulated in the foreign currency translation reserve. The gain or loss relating to the ineffective portion is recognised immediately in profit or loss, and is included in the “other gains and losses” line of the income statement / statement of comprehensive income.
Gains and losses previously recognised in other comprehensive income and accumulated in foreign currency translation reserve are reclassified in profit or loss in the same way as exchange differences relating to the foreign operation as described in the accounting policy for foreign currency transactions and translation below.
Notes to financial statements
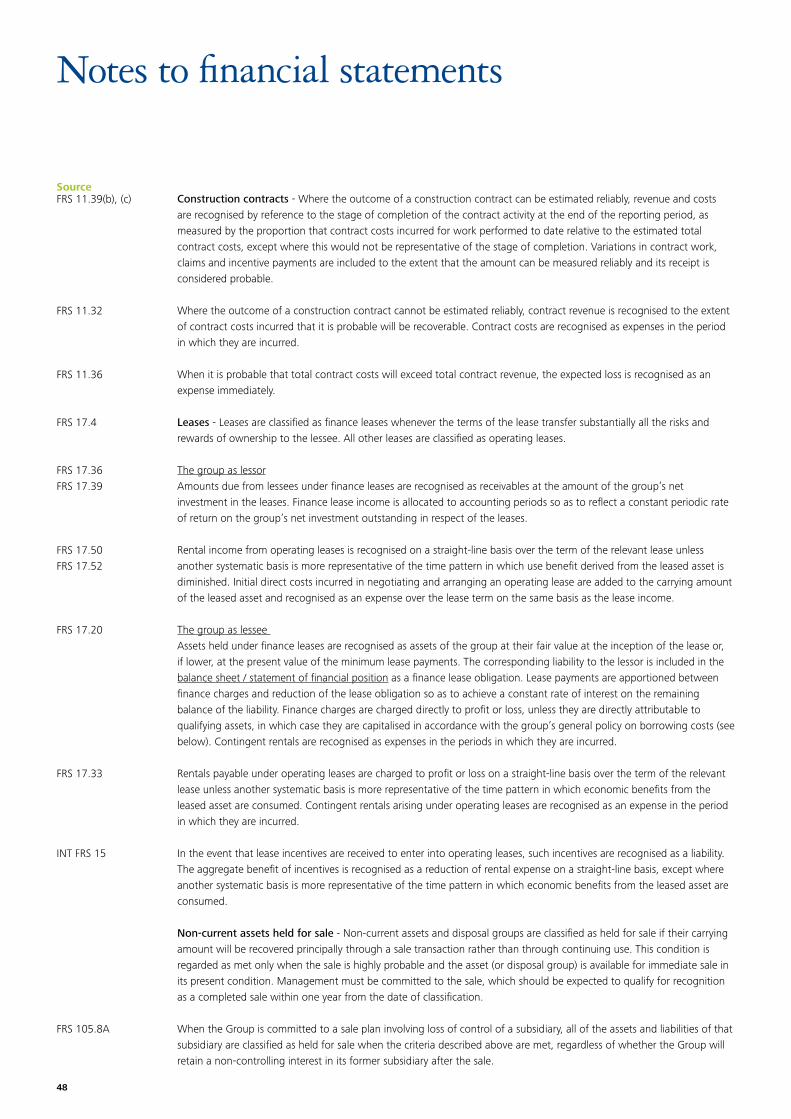
48
SourceConstruction contracts - Where the outcome of a construction contract can be estimated reliably, revenue and costs are recognised by reference to the stage of completion of the contract activity at the end of the reporting period, as measured by the proportion that contract costs incurred for work performed to date relative to the estimated total contract costs, except where this would not be representative of the stage of completion. Variations in contract work, claims and incentive payments are included to the extent that the amount can be measured reliably and its receipt is considered probable.
Where the outcome of a construction contract cannot be estimated reliably, contract revenue is recognised to the extent of contract costs incurred that it is probable will be recoverable. Contract costs are recognised as expenses in the period in which they are incurred.
When it is probable that total contract costs will exceed total contract revenue, the expected loss is recognised as an expense immediately.
Leases - Leases are classified as finance leases whenever the terms of the lease transfer substantially all the risks and rewards of ownership to the lessee. All other leases are classified as operating leases.
The group as lessorAmounts due from lessees under finance leases are recognised as receivables at the amount of the group’s net investment in the leases. Finance lease income is allocated to accounting periods so as to reflect a constant periodic rate of return on the group’s net investment outstanding in respect of the leases.
Rental income from operating leases is recognised on a straight-line basis over the term of the relevant lease unless another systematic basis is more representative of the time pattern in which use benefit derived from the leased asset is diminished. Initial direct costs incurred in negotiating and arranging an operating lease are added to the carrying amount of the leased asset and recognised as an expense over the lease term on the same basis as the lease income.
The group as lessee Assets held under finance leases are recognised as assets of the group at their fair value at the inception of the lease or, if lower, at the present value of the minimum lease payments. The corresponding liability to the lessor is included in the balance sheet / statement of financial position as a finance lease obligation. Lease payments are apportioned between finance charges and reduction of the lease obligation so as to achieve a constant rate of interest on the remaining balance of the liability. Finance charges are charged directly to profit or loss, unless they are directly attributable to qualifying assets, in which case they are capitalised in accordance with the group’s general policy on borrowing costs (see below). Contingent rentals are recognised as expenses in the periods in which they are incurred.
Rentals payable under operating leases are charged to profit or loss on a straight-line basis over the term of the relevant lease unless another systematic basis is more representative of the time pattern in which economic benefits from the leased asset are consumed. Contingent rentals arising under operating leases are recognised as an expense in the period in which they are incurred.
In the event that lease incentives are received to enter into operating leases, such incentives are recognised as a liability. The aggregate benefit of incentives is recognised as a reduction of rental expense on a straight-line basis, except where another systematic basis is more representative of the time pattern in which economic benefits from the leased asset are consumed.
Non-current assets held for sale - Non-current assets and disposal groups are classified as held for sale if their carrying amount will be recovered principally through a sale transaction rather than through continuing use. This condition is regarded as met only when the sale is highly probable and the asset (or disposal group) is available for immediate sale in its present condition. Management must be committed to the sale, which should be expected to qualify for recognition as a completed sale within one year from the date of classification.
When the Group is committed to a sale plan involving loss of control of a subsidiary, all of the assets and liabilities of that subsidiary are classified as held for sale when the criteria described above are met, regardless of whether the Group will retain a non-controlling interest in its former subsidiary after the sale.
FRS 11.39(b), (c)
FRS 11.32
FRS 11.36
FRS 17.4
FRS 17.36FRS 17.39
FRS 17.50FRS 17.52
FRS 17.20
FRS 17.33
INT FRS 15
FRS 105.8A
Notes to financial statements
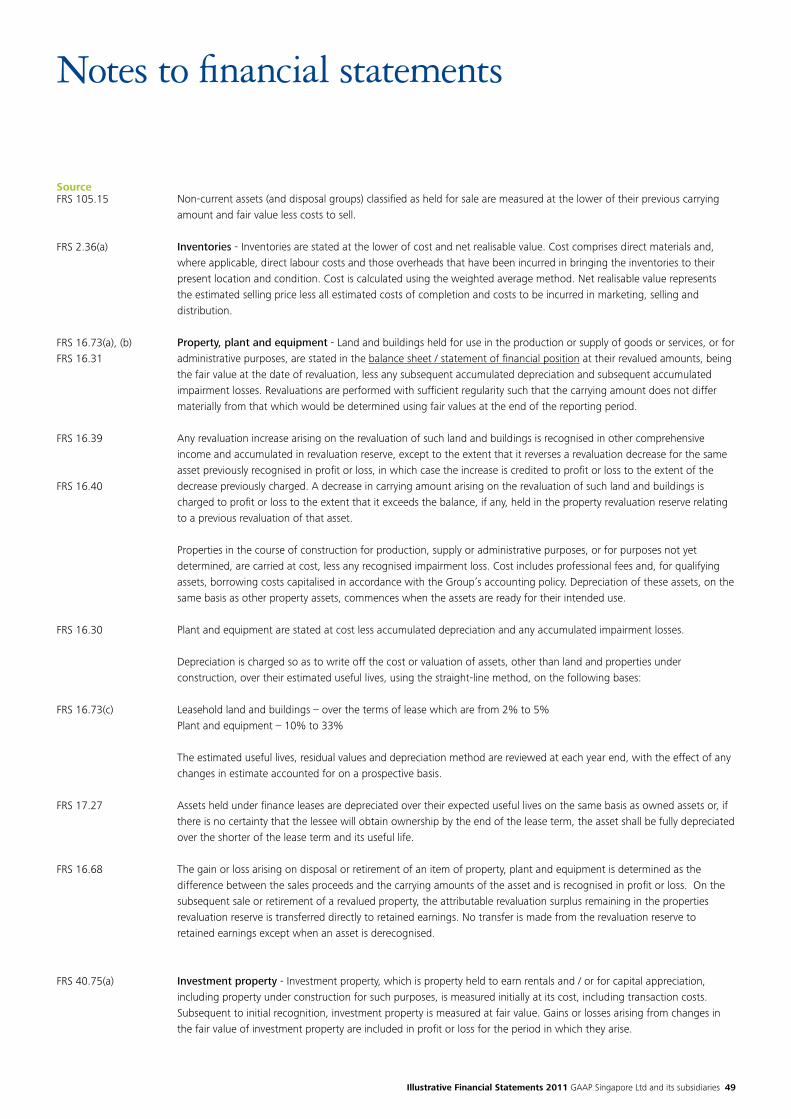
Illustrative Financial Statements 2011 GAAP Singapore Ltd and its subsidiaries 49
SourceNon-current assets (and disposal groups) classified as held for sale are measured at the lower of their previous carrying amount and fair value less costs to sell.
Inventories - Inventories are stated at the lower of cost and net realisable value. Cost comprises direct materials and, where applicable, direct labour costs and those overheads that have been incurred in bringing the inventories to their present location and condition. Cost is calculated using the weighted average method. Net realisable value represents the estimated selling price less all estimated costs of completion and costs to be incurred in marketing, selling and distribution.
Property, plant and equipment - Land and buildings held for use in the production or supply of goods or services, or for administrative purposes, are stated in the balance sheet / statement of financial position at their revalued amounts, being the fair value at the date of revaluation, less any subsequent accumulated depreciation and subsequent accumulated impairment losses. Revaluations are performed with sufficient regularity such that the carrying amount does not differ materially from that which would be determined using fair values at the end of the reporting period.
Any revaluation increase arising on the revaluation of such land and buildings is recognised in other comprehensive income and accumulated in revaluation reserve, except to the extent that it reverses a revaluation decrease for the same asset previously recognised in profit or loss, in which case the increase is credited to profit or loss to the extent of the decrease previously charged. A decrease in carrying amount arising on the revaluation of such land and buildings is charged to profit or loss to the extent that it exceeds the balance, if any, held in the property revaluation reserve relating to a previous revaluation of that asset.
Properties in the course of construction for production, supply or administrative purposes, or for purposes not yet determined, are carried at cost, less any recognised impairment loss. Cost includes professional fees and, for qualifying assets, borrowing costs capitalised in accordance with the Group’s accounting policy. Depreciation of these assets, on the same basis as other property assets, commences when the assets are ready for their intended use.
Plant and equipment are stated at cost less accumulated depreciation and any accumulated impairment losses.
Depreciation is charged so as to write off the cost or valuation of assets, other than land and properties under construction, over their estimated useful lives, using the straight-line method, on the following bases:
Leasehold land and buildings – over the terms of lease which are from 2% to 5%Plant and equipment – 10% to 33%
The estimated useful lives, residual values and depreciation method are reviewed at each year end, with the effect of any changes in estimate accounted for on a prospective basis.
Assets held under finance leases are depreciated over their expected useful lives on the same basis as owned assets or, if there is no certainty that the lessee will obtain ownership by the end of the lease term, the asset shall be fully depreciated over the shorter of the lease term and its useful life.
The gain or loss arising on disposal or retirement of an item of property, plant and equipment is determined as the difference between the sales proceeds and the carrying amounts of the asset and is recognised in profit or loss. On the subsequent sale or retirement of a revalued property, the attributable revaluation surplus remaining in the properties revaluation reserve is transferred directly to retained earnings. No transfer is made from the revaluation reserve to retained earnings except when an asset is derecognised.
Investment property - Investment property, which is property held to earn rentals and / or for capital appreciation, including property under construction for such purposes, is measured initially at its cost, including transaction costs. Subsequent to initial recognition, investment property is measured at fair value. Gains or losses arising from changes in the fair value of investment property are included in profit or loss for the period in which they arise.
FRS 105.15
FRS 2.36(a)
FRS 16.73(a), (b)FRS 16.31
FRS 16.39
FRS 16.40
FRS 16.30
FRS 16.73(c)
FRS 17.27
FRS 16.68
FRS 40.75(a)
Notes to financial statements
50
Source
FRS 103(2009).32
FRS 103(2009).36
FRS 36.80
FRS 36.90, 104
FRS 36.124
FRS 38.118(b)
Guidance Notes:FRS 40 allows a policy choice of accounting for investment property using either fair value model (as described above) or the cost model which is similar to the accounting for property, plant and equipment at cost less accumulated depreciation and impairment.
GoodwillGoodwill arising in a business combination is recognised as an asset at the date that control is acquired (the acquisition date). Goodwill is measured as the excess of the sum of the consideration transferred, the amount of any non-controlling interest in the acquiree and the fair value of the acquirer’s previously held equity interest (if any) in the entity over net of the acquisition-date amounts of the identifiable assets acquired and the liabilities assumed.
If, after reassessment, the Group’s interest in the fair value of the acquiree’s identifiable net assets exceeds the sum of the consideration transferred, the amount of any non-controlling interest in the acquiree and the fair value of the acquirer’s previously held equity interest in the acquiree (if any), the excess is recognised immediately in profit or loss as a bargain purchase gain.
Goodwill is not amortised but is reviewed for impairment at least annually. For the purpose of impairment testing, goodwill is allocated to each of the Group’s cash-generating units expected to benefit from the synergies of the combination. Cash-generating units to which goodwill has been allocated are tested for impairment annually, or more frequently when there is an indication that the unit may be impaired. If the recoverable amount of the cash-generating unit is less than its carrying amount, the impairment loss is allocated first to reduce the carrying amount of any goodwill allocated to the unit and then to the other assets of the unit pro-rata on the basis of the carrying amount of each asset in the unit. An impairment loss recognised for goodwill is not reversed in a subsequent period.
On disposal of a subsidiary or the relevant cash generating unit, the attributable amount of goodwill is included in the determination of the profit or loss on disposal. Intangible assets Intangible assets acquired separatelyIntangible assets acquired separately are reported at cost less accumulated amortisation (where they have finite useful lives) and accumulated impairment losses. Intangible assets with finite useful lives are amortised on a straight-line basis over their estimated useful lives. The estimated useful life and amortisation method are reviewed at the end of each annual reporting period, with the effect of any changes in estimate being accounted for on a prospective basis. Intangible assets with indefinite useful lives are not amortised. Each period, the useful lives of such assets are reviewed to determine whether events and circumstances continue to support an indefinite useful life assessment for the asset. Such assets are tested for impairment in accordance with the policy below.
Internally-generated intangible assets - research and development expenditureExpenditure on research activities is recognised as an expense in the period in which it is incurred.
An internally-generated intangible asset arising from development (or from the development phase of an internal project) is recognised if, and only if, all of the following have been demonstrated:
• thetechnicalfeasibilityofcompletingtheintangibleassetsothatitwillbeavailableforuseorsale;
• theintentiontocompletetheintangibleassetanduseorsellit;
• theabilitytouseorselltheintangibleasset;
• howtheintangibleassetwillgenerateprobablefutureeconomicbenefits;
• theavailabilityofadequatetechnical,financialandotherresourcestocompletethedevelopmentandtouseorsellthe intangible asset; and
• theabilitytomeasurereliablytheexpenditureattributabletotheintangibleassetduringitsdevelopment.
Notes to financial statements
Illustrative Financial Statements 2011 GAAP Singapore Ltd and its subsidiaries 51
SourceThe amount initially recognised for internally-generated intangible assets is the sum of the expenditure incurred from the date when the intangible asset first meets the recognition criteria listed above. Where no internally-generated intangible asset can be recognised, development expenditure is charged to profit or loss in the period in which it is incurred.
Subsequent to initial recognition, internally-generated intangible assets are reported at cost less accumulated amortisation and accumulated impairment losses, on the same basis as intangible assets acquired separately.
Intangible assets acquired in a business combinationIntangible assets acquired in a business combination are identified and recognised separately from goodwill. The cost of such intangible assets is their fair value at the acquisition date.
Subsequent to initial recognition, intangible assets acquired in a business combination are reported at cost less accumulated amortisation and accumulated impairment losses, on the same basis as intangible assets acquired separately.
Impairment of tangible and intangible assets excluding goodwill - At the end of each reporting period, the group reviews the carrying amounts of its tangible and intangible assets to determine whether there is any indication that those assets have suffered an impairment loss. If any such indication exists, the recoverable amount of the asset is estimated in order to determine the extent of the impairment loss (if any). Where it is not possible to estimate the recoverable amount of an individual asset, the group estimates the recoverable amount of the cash-generating unit to which the asset belongs. Where a reasonable and consistent basis of allocation can be identified, corporate assets are also allocated to individual cash-generating units, or otherwise they are allocated to the smallest group of cash-generating units for which a reasonable and consistent allocation basis can be identified.
Intangible assets with indefinite useful lives and intangible assets not yet available for use are tested for impairment annually, and whenever there is an indication that the asset may be impaired.
Recoverable amount is the higher of fair value less costs to sell and value in use. In assessing value in use, the estimated future cash flows are discounted to their present value using a pre-tax discount rate that reflects current market assessments of the time value of money and the risks specific to the asset for which the estimates of future cash flows have not been adjusted.
If the recoverable amount of an asset (or cash-generating unit) is estimated to be less than its carrying amount, the carrying amount of the asset (cash-generating unit) is reduced to its recoverable amount. An impairment loss is recognised immediately in profit or loss, unless the relevant asset is carried at a revalued amount, in which case the impairment loss is treated as a revaluation decrease.
Where an impairment loss subsequently reverses, the carrying amount of the asset (cash-generating unit) is increased to the revised estimate of its recoverable amount, but so that the increased carrying amount does not exceed the carrying amount that would have been determined had no impairment loss been recognised for the asset (cash-generating unit) in prior years. A reversal of an impairment loss is recognised immediately in profit or loss, unless the relevant asset is carried at a revalued amount, in which case the reversal of the impairment loss is treated as a revaluation increase.
Associates - An associate is an entity over which the group has significant influence and that is neither a subsidiary nor an interest in a joint venture. Significant influence is the power to participate in the financial and operating policy decisions of the investee but is not control or joint control over those policies.
The results and assets and liabilities of associates are incorporated in these financial statements using the equity method of accounting, except when the investment is classified as held for sale, in which case it is accounted for under FRS 105 Non-current Assets Held for Sale and Discontinued Operations. Under the equity method, investments in associates are carried in the consolidated balance sheet / statement of financial position at cost as adjusted for post-acquisition changes in the group’s share of the net assets of the associate, less any impairment in the value of individual investments. Losses of an associate in excess of the group’s interest in that associate (which includes any long-term interests that, in substance, form part of the group’s net investment in the associate) are not recognised, unless the group has incurred legal or constructive obligations or made payments on behalf of the associate.
FRS 38.118(b)
FRS 38.118(b)
FRS 36.9
FRS 36.6FRS 36.30
FRS 36.59FRS 36.60
FRS 36.119
FRS 28.2
FRS 28.13(a)
FRS 28.11
Notes to financial statements
52
SourceFRS 28.23(a), (b)
FRS 28.22
FRS 31.3
FRS 31.15, 21FRS 31.24FRS 31.30
FRS 31.57
FRS 37.14
Any excess of the cost of acquisition over the group’s share of the net fair value of the identifiable assets, liabilities and contingent liabilities of the associate recognised at the date of acquisition is recognised as goodwill. The goodwill is included within the carrying amount of the investment and is assessed for impairment as part of the investment. Any excess of the group’s share of the net fair value of the identifiable assets, liabilities and contingent liabilities over the cost of acquisition, after reassessment, is recognised immediately in profit or loss.
Where a group entity transacts with an associate of the group, profits and losses are eliminated to the extent of the group’s interest in the relevant associate.
Interests in joint ventures - A joint venture is a contractual arrangement whereby the group and other parties undertake an economic activity that is subject to joint control, that is when the strategic financial and operating policy decisions relating to the activities require the unanimous consent of the parties sharing control.
Where a group entity undertakes its activities under joint venture arrangements directly, the group’s share of jointly controlled assets and any liabilities incurred jointly with other venturers are recognised in the financial statements of the relevant entity and classified according to their nature. Liabilities and expenses incurred directly in respect of interests in jointly controlled assets are accounted for on an accrual basis. Income from the sale or use of the group’s share of the output of jointly controlled assets, and its share of joint venture expenses, are recognised when it is probable that the economic benefits associated with the transactions will flow to / from the group and their amount can be measured reliably.
Joint venture arrangements that involve the establishment of a separate entity in which each venturer has an interest are referred to as jointly controlled entities. The group reports its interests in jointly controlled entities using proportionate consolidation, except when the investment is classified as held for sale, in which case it is accounted for under FRS 105 Non-current Assets Held for Sale and Discontinued Operations. The group’s share of the assets, liabilities, income and expenses of jointly controlled entities are combined with the equivalent items in the consolidated financial statements on a line-by-line basis.
Any goodwill arising on the acquisition of the group’s interest in a jointly controlled entity is accounted for in accordance with the group’s accounting policy for goodwill arising on the acquisition of a subsidiary (see above).
Where the group transacts with its jointly controlled entities, unrealised profits and losses are eliminated to the extent of the group’s interest in the joint venture.
Provisions - Provisions are recognised when the group has a present obligation (legal or constructive) as a result of a past event, it is probable that the group will be required to settle the obligation, and a reliable estimate can be made of the amount of the obligation.
The amount recognised as a provision is the best estimate of the consideration required to settle the present obligation at the end of the reporting period, taking into account the risks and uncertainties surrounding the obligation. Where a provision is measured using the cash flows estimated to settle the present obligation, its carrying amount is the present value of those cash flows.
When some or all of the economic benefits required to settle a provision are expected to be recovered from a third party, the receivable is recognised as an asset if it is virtually certain that reimbursement will be received and the amount of the receivable can be measured reliably.
Notes to financial statements
Illustrative Financial Statements 2011 GAAP Singapore Ltd and its subsidiaries 53
Source
Guidance Notes – Accounting policies for specific types of provisionsInclude where applicable. For example:-
Onerous contractsPresent obligations arising under onerous contracts are recognised and measured as a provision. An onerous contract is considered to exist where the group has a contract under which the unavoidable costs of meeting the obligations under the contract exceed the economic benefits expected to be received under it.
RestructuringsA restructuring provision is recognised when the group has developed a detailed formal plan for the restructuring and has raised a valid expectation in those affected that it will carry out the restructuring by starting to implement the plan or announcing its main features to those affected by it. The measurement of a restructuring provision includes only the direct expenditures arising from the restructuring, which are those amounts that are both necessarily entailed by the restructuring and not associated with the ongoing activities of the entity.
WarrantiesProvisions for warranty costs are recognised at the date of sale of the relevant products, at the directors’ best estimate of the expenditure required to settle the group’s obligation.
Contingent liabilities acquired in a business combination (under FRS 103(2009))Contingent liabilities acquired in a business combination are initially measured at fair value at the date of acquisition. At the end of each subsequent reporting period, such contingent liabilities are measured at the higher of the amount that would be recognised in accordance with FRS 37 Provisions, Contingent Liabilities and Contingent Assets and the amount initially recognised less cumulative amortisation recognised in accordance with FRS 18 Revenue.
Share-based payments - The group issues equity-settled and cash-settled share-based payments to certain employees.
Equity-settled share-based payments are measured at fair value of the equity instruments at the date of grant. Details regarding the determination of the fair value of equity-settled share-based transactions are set out in Note 33. The fair value determined at the grant date of the equity-settled share-based payments is expensed on a straight-line basis over the vesting period, based on the group’s estimate of the number of equity instruments that will eventually vest. At the end of each reporting period, the Group revises its estimate of the number of equity instruments expected to vest. The impact of the revision of the original estimates, if any, is recognised in profit or loss such that the cumulative expense reflects the revised estimate, with a corresponding adjustment to the equity-settled employee benefits reserve.
The policy described above is applied to all equity-settled share-based payments that were granted after November 22, 2002 that vested after January 1, 2005. No amount has been recognised in the financial statements in respect of other equity-settled share-based payments.
Equity-settled share-based payment transactions with parties other than employees are measured at the fair value of the goods or services received, except where that fair value cannot be estimated reliably, in which case they are measured at the fair value of the equity instruments granted, measured at the date the entity obtains the goods or the counterparty renders the service.
For cash-settled share-based payments, a liability is recognised for the goods or services acquired, measured initially at the fair of the liability. At the end of each reporting period until the liability is settled, and at the date of settlement, the fair value of the liability is remeasured, with any changes in fair value recognised in profit or loss for the year.
FRS 102.10
Notes to financial statements

54
SourceFRS 20.39(a)
FRS 18.35(a)
FRS 18.14(a)
FRS 18.20
Government grants - Government grants are not recognised until there is reasonable assurance that the group will comply with the conditions attaching to them and the grants will be received. The benefit of a government loan at a below-market rate of interest is treated as a government grant, measured as the difference between proceeds received and the fair value of the loan based on prevailing market interest rates. Government grants whose primary condition is that the group should purchase, construct or otherwise acquire non-current assets are recognised as deferred income in the balance sheet / statement of financial position and transferred to profit or loss on a systematic and rational basis over the useful lives of the related assets.
Other government grants are recognised as income over the periods necessary to match them with the costs for which they are intended to compensate, on a systematic basis. Government grants that are receivable as compensation for expenses or losses already incurred or for the purpose of giving immediate financial support to the group with no future related costs are recognised in profit or loss in the period in which they become receivable.
Revenue recognition - Revenue is measured at the fair value of the consideration received or receivable. Revenue is reduced for estimated customer returns, rebates and other similar allowances.
Sale of goodsRevenue from the sale of goods is recognised when all the following conditions are satisfied:
• thegrouphastransferredtothebuyerthesignificantrisksandrewardsofownershipofthegoods;
• thegroupretainsneithercontinuingmanagerialinvolvementtothedegreeusuallyassociatedwithownershipnoreffective control over the goods sold;
• theamountofrevenuecanbemeasuredreliably;
• itisprobablethattheeconomicbenefitsassociatedwiththetransactionwillflowtotheentity;and
• thecostsincurredortobeincurredinrespectofthetransactioncanbemeasuredreliably.
Rendering of servicesRevenue from a contract to provide services is recognised by reference to the stage of completion of the contract. The stage of completion of the contract is determined as follows:
• installationfeesarerecognisedbyreferencetothestageofcompletionoftheinstallation,determinedastheproportion of the total time expected to install that has elapsed at the end of the reporting period;
• servicingfeesincludedinthepriceofproductssoldarerecognisedbyreferencetotheproportionofthetotalcostofproviding the servicing for the product sold, taking into account historical trends in the number of services actually provided on past goods sold; and
• revenuefromtimeandmaterialcontractsisrecognisedatthecontractualratesaslabourhoursaredeliveredanddirect expenses are incurred.
Income from providing financial guarantee is recognised in profit or loss over the guarantee period on a straight line basis.
Revenue from construction contracts is recognised in accordance with the group’s accounting policy on construction contracts (see above).
Notes to financial statements
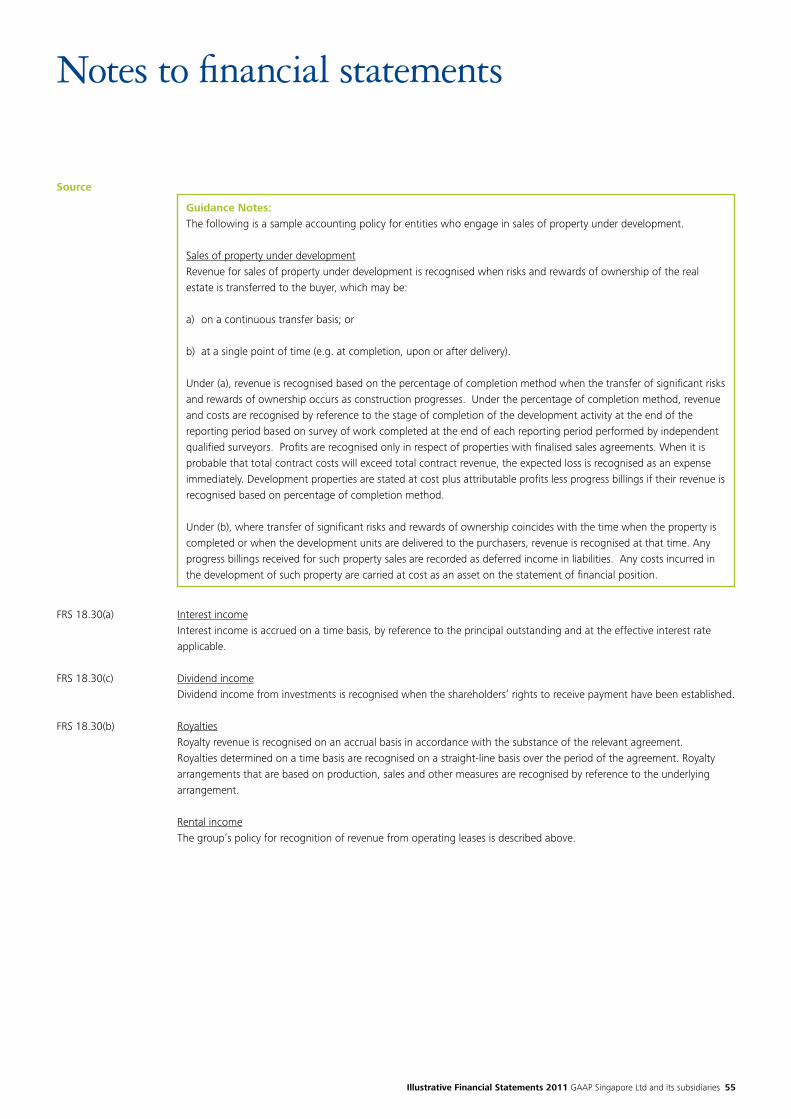
Illustrative Financial Statements 2011 GAAP Singapore Ltd and its subsidiaries 55
Source
FRS 18.30(a)
FRS 18.30(c)
FRS 18.30(b)
Interest incomeInterest income is accrued on a time basis, by reference to the principal outstanding and at the effective interest rate applicable.
Dividend incomeDividend income from investments is recognised when the shareholders’ rights to receive payment have been established.
RoyaltiesRoyalty revenue is recognised on an accrual basis in accordance with the substance of the relevant agreement. Royalties determined on a time basis are recognised on a straight-line basis over the period of the agreement. Royalty arrangements that are based on production, sales and other measures are recognised by reference to the underlying arrangement. Rental incomeThe group’s policy for recognition of revenue from operating leases is described above.
Guidance Notes:The following is a sample accounting policy for entities who engage in sales of property under development.
Sales of property under developmentRevenue for sales of property under development is recognised when risks and rewards of ownership of the real estate is transferred to the buyer, which may be:
a) on a continuous transfer basis; or
b) at a single point of time (e.g. at completion, upon or after delivery).
Under (a), revenue is recognised based on the percentage of completion method when the transfer of significant risks and rewards of ownership occurs as construction progresses. Under the percentage of completion method, revenue and costs are recognised by reference to the stage of completion of the development activity at the end of the reporting period based on survey of work completed at the end of each reporting period performed by independent qualified surveyors. Profits are recognised only in respect of properties with finalised sales agreements. When it is probable that total contract costs will exceed total contract revenue, the expected loss is recognised as an expense immediately. Development properties are stated at cost plus attributable profits less progress billings if their revenue is recognised based on percentage of completion method.
Under (b), where transfer of significant risks and rewards of ownership coincides with the time when the property is completed or when the development units are delivered to the purchasers, revenue is recognised at that time. Any progress billings received for such property sales are recorded as deferred income in liabilities. Any costs incurred in the development of such property are carried at cost as an asset on the statement of financial position.
Notes to financial statements
56
SourceBorrowing costs - Borrowing costs directly attributable to the acquisition, construction or production of qualifying assets, which are assets that necessarily take a substantial period of time to get ready for their intended use or sale, are added to the cost of those assets, until such time as the assets are substantially ready for their intended use or sale. Investment income earned on the temporary investment of specific borrowings pending their expenditure on qualifying assets is deducted from the borrowing costs eligible for capitalisation.
All other borrowing costs are recognised in profit or loss in the period in which they are incurred.
Retirement benefit costs - Payments to defined contribution retirement benefit plans are charged as an expense when employees have rendered the services entitling them to the contributions. Payments made to state-managed retirement benefit schemes, such as the Singapore Central Provident Fund, are dealt with as payments to defined contribution plans where the group’s obligations under the plans are equivalent to those arising in a defined contribution retirement benefit plan.
For defined benefit retirement benefit plans, the cost of providing benefits is determined using the Projected Unit Credit Method, with actuarial valuations being carried out at the end of each reporting period. Actuarial gains and losses that exceed 10% of the greater of the present value of the group’s defined benefit obligation and the fair value of plan assets are amortised over the expected average remaining working lives of the participating employees. Past service cost is recognised immediately to the extent that the benefits are already vested, and otherwise is amortised on a straight-line basis over the average period until the benefits become vested.
The retirement benefit obligation recognised in the balance sheet / statement of financial position represents the present value of the defined benefit obligation as adjusted for unrecognised actuarial gains and losses and unrecognised past service cost, and as reduced by the fair value of plan assets. Any asset resulting from this calculation is limited to unrecognised actuarial losses and past service cost, plus the present value of available refunds and reductions in future contributions to the plan.
Employee leave entitlement – Employee entitlements to annual leave are recognised when they accrue to employees. A provision is made for the estimated liability for annual leave as a result of services rendered by employees up to the end of the reporting period.
Income tax - Income tax expense represents the sum of the tax currently payable and deferred tax.
FRS 23.12FRS 23.22
FRS 23.8
FRS 19.44
FRS 19.120A(a)
Notes to financial statements
Illustrative Financial Statements 2011 GAAP Singapore Ltd and its subsidiaries 57
SourceFRS 12.5
FRS 12.15
FRS 12.24
FRS 12.39
FRS 12.56
FRS 12.58(a)FRS 12.47
FRS 12.71(a), (b)
FRS 21.51FRS 21.17FRS 21.18FRS 21.19
The tax currently payable is based on taxable profit for the year. Taxable profit differs from profit as reported in the statement of comprehensive income because it excludes items of income or expense that are taxable or deductible in other years and it further excludes items that are not taxable or tax deductible. The group’s liability for current tax is calculated using tax rates (and tax laws) that have been enacted or substantively enacted in countries where the company and subsidiaries operate by the end of the reporting period.
Deferred tax is recognised on the differences between the carrying amounts of assets and liabilities in the financial statements and the corresponding tax bases used in the computation of taxable profit, and is accounted for using the balance sheet liability method. Deferred tax liabilities are generally recognised for all taxable temporary differences and deferred tax assets are recognised to the extent that it is probable that taxable profits will be available against which deductible temporary differences can be utilised. Such assets and liabilities are not recognised if the temporary difference arises from goodwill or from the initial recognition (other than in a business combination) of other assets and liabilities in a transaction that affects neither the taxable profit nor the accounting profit.
Deferred tax liabilities are recognised on taxable temporary differences arising on investments in subsidiaries and associates, and interests in joint ventures, except where the group is able to control the reversal of the temporary difference and it is probable that the temporary difference will not reverse in the foreseeable future. Deferred tax assets arising from deductible temporary differences associated with such investments and interests are only recognised to the extent that it is probable that there will be sufficient taxable profits against which to utilise the benefits of the temporary differences and they are expected to reverse in the foreseeable future.
The carrying amount of deferred tax assets is reviewed at the end of each reporting period and reduced to the extent that it is no longer probable that sufficient taxable profits will be available to allow all or part of the asset to be recovered.
Deferred tax is calculated at the tax rates that are expected to apply in the period when the liability is settled or the asset realised based on the tax rates (and tax laws) that have been enacted or substantively enacted by the end of the reporting period. The measurement of deferred tax liabilities and assets reflects the tax consequences that would follow from the manner in which the group expects, at the end of the reporting period, to recover or settle the carrying amount of its assets and liabilities.
Guidance Notes:For entities early adopting the amendments to FRS 12 Income Taxes – Deferred Taxes: Recovery of Underlying Assets, the following is a possible inclusion in the accounting policy notes:
For the purposes of measuring deferred taxes on fair value changes arising from investment properties measured at fair value, the group has not rebutted the presumption that the carrying amount of the investment properties will be recovered entirely through sale.
Deferred tax assets and liabilities are offset when there is a legally enforceable right to set off current tax assets against current tax liabilities and when they relate to income taxes levied by the same taxation authority and the group intends to settle its current tax assets and liabilities on a net basis.
Current and deferred tax are recognised as an expense or income in profit or loss, except when they relate to items credited or debited outside profit or loss (either in other comprehensive income or directly in equity), in which case the tax is also recognised outside profit or loss (either in other comprehensive income or directly in equity, respectively), or where they arise from the initial accounting for a business combination. In the case of a business combination, the tax effect is taken into account in calculating goodwill or determining the excess of the acquirer’s interest in the net fair value of the acquiree’s identifiable assets, liabilities and contingent liabilities over cost.
Foreign currency transactions and translation - The individual financial statements of each group entity are measured and presented in the currency of the primary economic environment in which the entity operates (its functional currency). The consolidated financial statements of the group and the balance sheet / statement of financial position of the company are presented in Singapore dollars, which is the functional currency of the company and the presentation currency for the consolidated financial statements.
Notes to financial statements
58
SourceFRS 21.23(a)-(c)FRS 21.21
FRS 21.32
FRS 21.28, 30
FRS 23.6(e)
FRS 21.39
FRS 21.48FRS 21.48AFRS 21.48B
FRS 21.48CFRS 21.48D
FRS 21.32
FRS 7.46
In preparing the financial statements of the individual entities, transactions in currencies other than the entity’s functional currency are recorded at the rate of exchange prevailing on the date of the transaction. At the end of each reporting period, monetary items denominated in foreign currencies are retranslated at the rates prevailing at the end of the reporting period. Non-monetary items carried at fair value that are denominated in foreign currencies are retranslated at the rates prevailing on the date when the fair value was determined. Non-monetary items that are measured in terms of historical cost in a foreign currency are not retranslated.
Exchange differences arising on the settlement of monetary items, and on retranslation of monetary items are included in profit or loss for the period. Exchange differences arising on the retranslation of non-monetary items carried at fair value are included in profit or loss for the period except for differences arising on the retranslation of non-monetary items in respect of which gains and losses are recognised other comprehensive income. For such non-monetary items, any exchange component of that gain or loss is also recognised in other comprehensive income.
Exchange differences on foreign currency borrowings relating to assets under construction for future productive use, are included in the cost of those assets when they are regarded as an adjustment to interest costs on those foreign currency borrowings.
Exchange differences on transactions entered into in order to hedge certain foreign currency risks are described in the hedge accounting policies above.
For the purpose of presenting consolidated financial statements, the assets and liabilities of the group’s foreign operations (including comparatives) are expressed in Singapore dollars using exchange rates prevailing at the end of the reporting period. Income and expense items (including comparatives) are translated at the average exchange rates for the period, unless exchange rates fluctuated significantly during that period, in which case the exchange rates at the dates of the transactions are used. Exchange differences arising, if any, are recognised in other comprehensive income and accumulated in a separate component of equity under the header of foreign currency translation reserve.
On the disposal of a foreign operation (i.e. a disposal of the Group’s entire interest in a foreign operation, or a disposal involving loss of control over a subsidiary that includes a foreign operation, loss of joint control over a jointly controlled entity that includes a foreign operation, or loss of significant influence over an associate that includes a foreign operation), all of the accumulated exchange differences in respect of that operation attributable to the Group are reclassified to profit or loss. Any exchange differences that have previously been attributed to non-controlling interests are derecognised, but they are not reclassified to profit or loss.
In the case of a partial disposal (i.e. no loss of control) of a subsidiary that includes a foreign operation, the proportionate share of accumulated exchange differences are re-attributed to non-controlling interests and are not recognised in profit or loss. For all other partial disposals (i.e. of associates or jointly controlled entities that do not result in the Group losing significant influence or joint control), the proportionate share of the accumulated exchange differences is reclassified to profit or loss.
On consolidation, exchange differences arising from the translation of the net investment in foreign entities (including monetary items that, in substance, form part of the net investment in foreign entities), and of borrowings and other currency instruments designated as hedges of such investments, are recognised in other comprehensive income and accumulated in a separate component of equity under the header of foreign currency translation reserve.
Goodwill and fair value adjustments arising on the acquisition of a foreign operation are treated as assets and liabilities of the foreign operation and translated at the closing rate.
Cash and cash equivalents in the statement of cash flows - Cash and cash equivalents in the statement of cash flows comprise cash on hand and demand deposits, bank overdrafts, and other short-term highly liquid investments that are readily convertible to a known amount of cash and are subject to an insignificant risk of changes in value.
Notes to financial statements
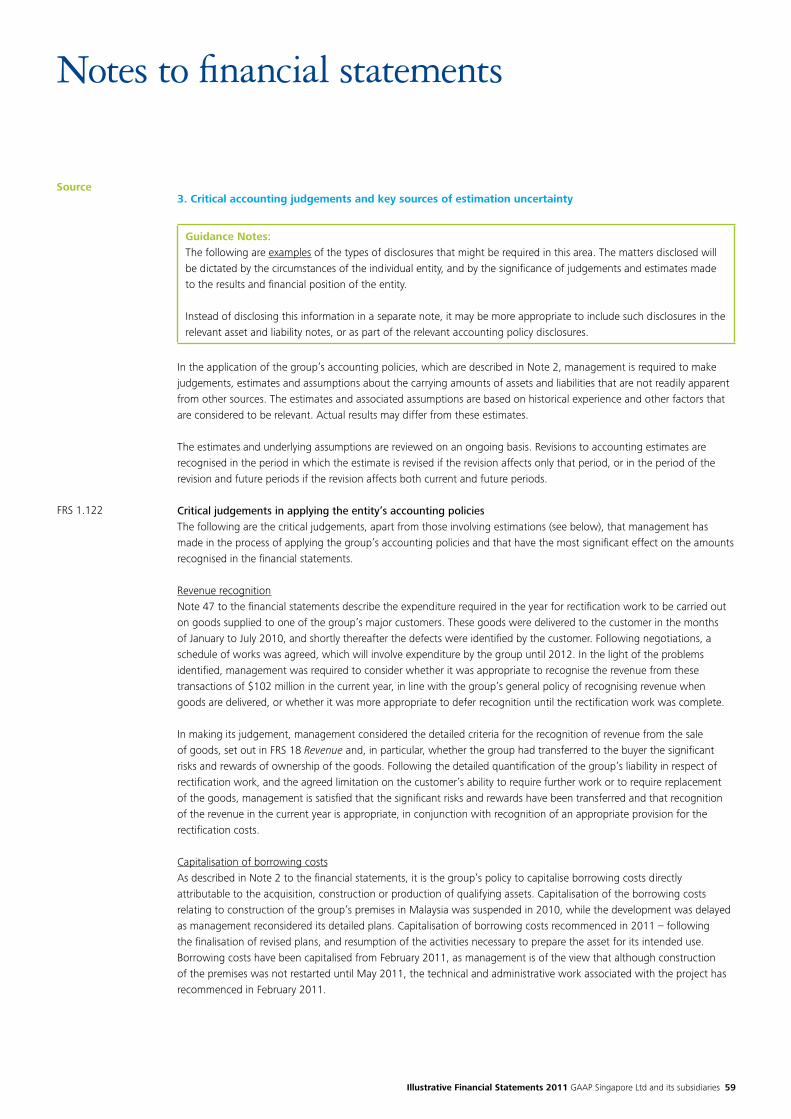
Illustrative Financial Statements 2011 GAAP Singapore Ltd and its subsidiaries 59
Source3. Critical accounting judgements and key sources of estimation uncertainty
Guidance Notes:The following are examples of the types of disclosures that might be required in this area. The matters disclosed will be dictated by the circumstances of the individual entity, and by the significance of judgements and estimates made to the results and financial position of the entity.
Instead of disclosing this information in a separate note, it may be more appropriate to include such disclosures in the relevant asset and liability notes, or as part of the relevant accounting policy disclosures.
In the application of the group’s accounting policies, which are described in Note 2, management is required to make judgements, estimates and assumptions about the carrying amounts of assets and liabilities that are not readily apparent from other sources. The estimates and associated assumptions are based on historical experience and other factors that are considered to be relevant. Actual results may differ from these estimates.
The estimates and underlying assumptions are reviewed on an ongoing basis. Revisions to accounting estimates are recognised in the period in which the estimate is revised if the revision affects only that period, or in the period of the revision and future periods if the revision affects both current and future periods.
Critical judgements in applying the entity’s accounting policiesThe following are the critical judgements, apart from those involving estimations (see below), that management has made in the process of applying the group’s accounting policies and that have the most significant effect on the amounts recognised in the financial statements.
Revenue recognitionNote 47 to the financial statements describe the expenditure required in the year for rectification work to be carried out on goods supplied to one of the group’s major customers. These goods were delivered to the customer in the months of January to July 2010, and shortly thereafter the defects were identified by the customer. Following negotiations, a schedule of works was agreed, which will involve expenditure by the group until 2012. In the light of the problems identified, management was required to consider whether it was appropriate to recognise the revenue from these transactions of $102 million in the current year, in line with the group’s general policy of recognising revenue when goods are delivered, or whether it was more appropriate to defer recognition until the rectification work was complete.
In making its judgement, management considered the detailed criteria for the recognition of revenue from the sale of goods, set out in FRS 18 Revenue and, in particular, whether the group had transferred to the buyer the significant risks and rewards of ownership of the goods. Following the detailed quantification of the group’s liability in respect of rectification work, and the agreed limitation on the customer’s ability to require further work or to require replacement of the goods, management is satisfied that the significant risks and rewards have been transferred and that recognition of the revenue in the current year is appropriate, in conjunction with recognition of an appropriate provision for the rectification costs.
Capitalisation of borrowing costsAs described in Note 2 to the financial statements, it is the group’s policy to capitalise borrowing costs directly attributable to the acquisition, construction or production of qualifying assets. Capitalisation of the borrowing costs relating to construction of the group’s premises in Malaysia was suspended in 2010, while the development was delayed as management reconsidered its detailed plans. Capitalisation of borrowing costs recommenced in 2011 – following the finalisation of revised plans, and resumption of the activities necessary to prepare the asset for its intended use. Borrowing costs have been capitalised from February 2011, as management is of the view that although construction of the premises was not restarted until May 2011, the technical and administrative work associated with the project has recommenced in February 2011.
FRS 1.122
Notes to financial statements
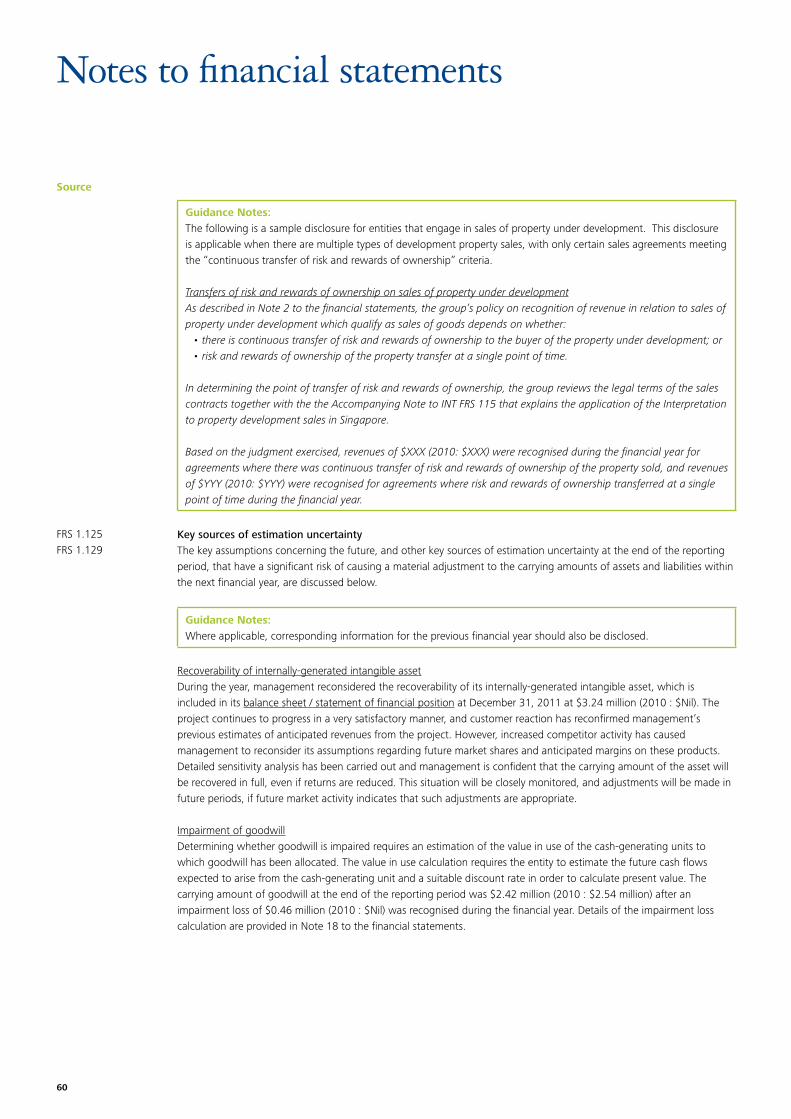
60
Source
Guidance Notes:The following is a sample disclosure for entities that engage in sales of property under development. This disclosure is applicable when there are multiple types of development property sales, with only certain sales agreements meeting the “continuous transfer of risk and rewards of ownership” criteria.
Transfers of risk and rewards of ownership on sales of property under developmentAs described in Note 2 to the financial statements, the group’s policy on recognition of revenue in relation to sales of property under development which qualify as sales of goods depends on whether:•thereiscontinuoustransferofriskandrewardsofownershiptothebuyerofthepropertyunderdevelopment;or•riskandrewardsofownershipofthepropertytransferatasinglepointoftime.
In determining the point of transfer of risk and rewards of ownership, the group reviews the legal terms of the sales contracts together with the the Accompanying Note to INT FRS 115 that explains the application of the Interpretation to property development sales in Singapore.
Based on the judgment exercised, revenues of $XXX (2010: $XXX) were recognised during the financial year for agreements where there was continuous transfer of risk and rewards of ownership of the property sold, and revenues of $YYY (2010: $YYY) were recognised for agreements where risk and rewards of ownership transferred at a single point of time during the financial year.
Key sources of estimation uncertaintyThe key assumptions concerning the future, and other key sources of estimation uncertainty at the end of the reporting period, that have a significant risk of causing a material adjustment to the carrying amounts of assets and liabilities within the next financial year, are discussed below.
Guidance Notes:Where applicable, corresponding information for the previous financial year should also be disclosed.
Recoverability of internally-generated intangible assetDuring the year, management reconsidered the recoverability of its internally-generated intangible asset, which is included in its balance sheet / statement of financial position at December 31, 2011 at $3.24 million (2010 : $Nil). The project continues to progress in a very satisfactory manner, and customer reaction has reconfirmed management’s previous estimates of anticipated revenues from the project. However, increased competitor activity has caused management to reconsider its assumptions regarding future market shares and anticipated margins on these products. Detailed sensitivity analysis has been carried out and management is confident that the carrying amount of the asset will be recovered in full, even if returns are reduced. This situation will be closely monitored, and adjustments will be made in future periods, if future market activity indicates that such adjustments are appropriate.
Impairment of goodwillDetermining whether goodwill is impaired requires an estimation of the value in use of the cash-generating units to which goodwill has been allocated. The value in use calculation requires the entity to estimate the future cash flows expected to arise from the cash-generating unit and a suitable discount rate in order to calculate present value. The carrying amount of goodwill at the end of the reporting period was $2.42 million (2010 : $2.54 million) after an impairment loss of $0.46 million (2010 : $Nil) was recognised during the financial year. Details of the impairment loss calculation are provided in Note 18 to the financial statements.
FRS 1.125 FRS 1.129
Notes to financial statements

Illustrative Financial Statements 2011 GAAP Singapore Ltd and its subsidiaries 61
SourceUseful lives of property, plant and equipmentAs described in Note 2, the group reviews the estimated useful lives of property, plant and equipment at the end of each annual reporting period. During the financial year, management determined that the useful life of certain items of equipment should be shortened, due to developments in technology.
The financial effect of this reassessment, assuming the assets are held until the end of their estimated useful lives, is to increase the consolidated depreciation expense in the current financial year and for the next 3 years, by the following amounts:
$’000
2011 9
2012 7
2013 4
2014 2
Guidance Notes:Generally, where valuation techniques used in determining fair values of financial instruments involve key estimation uncertainties, the following should be disclosed: As described in note XX, the Group uses valuation techniques that include inputs that are not based on observable market data to estimate the fair value of certain types of financial instruments. Note XX provides detailed information about the key assumptions used in the determination of the fair value of financial instruments, as well as the detailed sensitivity analysis for these assumptions.
The management believes that the chosen valuation techniques and assumptions used are appropriate in determining the fair value of financial instruments.
Notes to financial statements
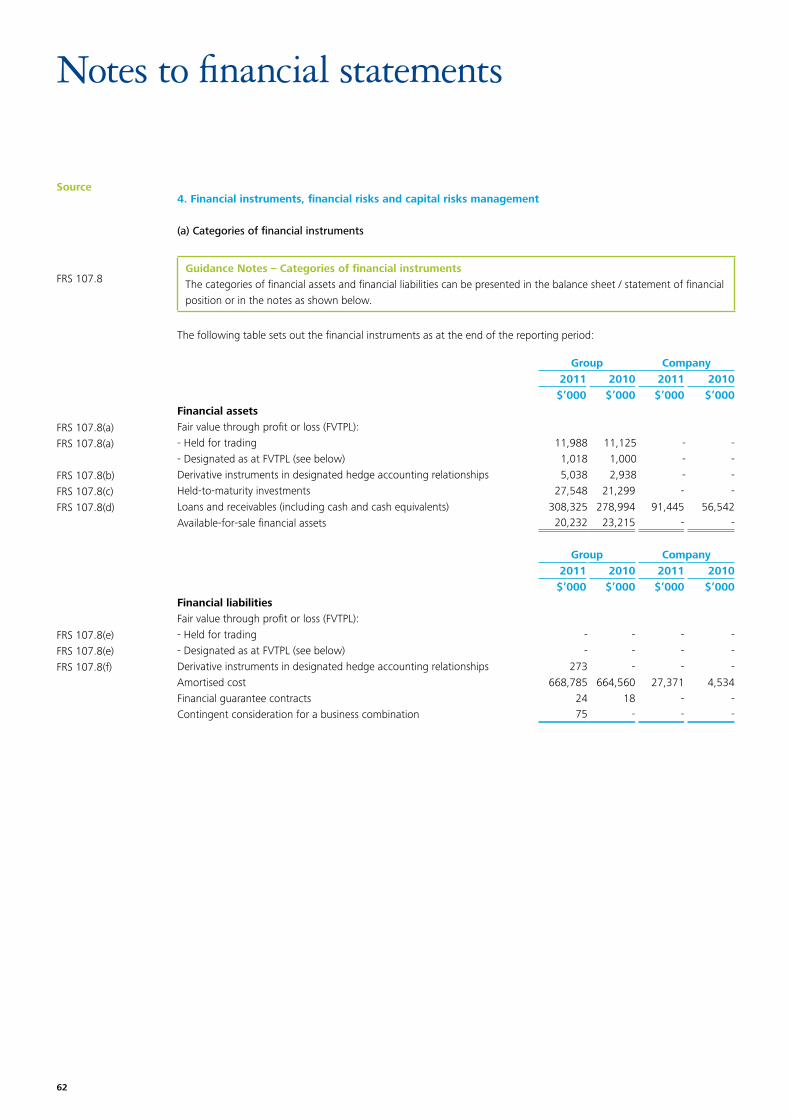
62
Source
FRS 107.8
FRS 107.8(a)FRS 107.8(a)
FRS 107.8(b)FRS 107.8(c)FRS 107.8(d)
FRS 107.8(e)FRS 107.8(e)FRS 107.8(f)
4. Financial instruments, financial risks and capital risks management
(a) Categories of financial instruments
Guidance Notes – Categories of financial instrumentsThe categories of financial assets and financial liabilities can be presented in the balance sheet / statement of financial position or in the notes as shown below.
The following table sets out the financial instruments as at the end of the reporting period:
Group Company2011 2010 2011 2010
$’000 $’000 $’000 $’000Financial assetsFair value through profit or loss (FVTPL):- Held for trading 11,988 11,125 - -- Designated as at FVTPL (see below) 1,018 1,000 - -Derivative instruments in designated hedge accounting relationships 5,038 2,938 - -Held-to-maturity investments 27,548 21,299 - -Loans and receivables (including cash and cash equivalents) 308,325 278,994 91,445 56,542Available-for-sale financial assets 20,232 23,215 - -
Group Company2011 2010 2011 2010
$’000 $’000 $’000 $’000Financial liabilitiesFair value through profit or loss (FVTPL):- Held for trading - - - -- Designated as at FVTPL (see below) - - - -Derivative instruments in designated hedge accounting relationships 273 - - -Amortised cost 668,785 664,560 27,371 4,534Financial guarantee contracts 24 18 - -Contingent consideration for a business combination 75 - - -
Notes to financial statements
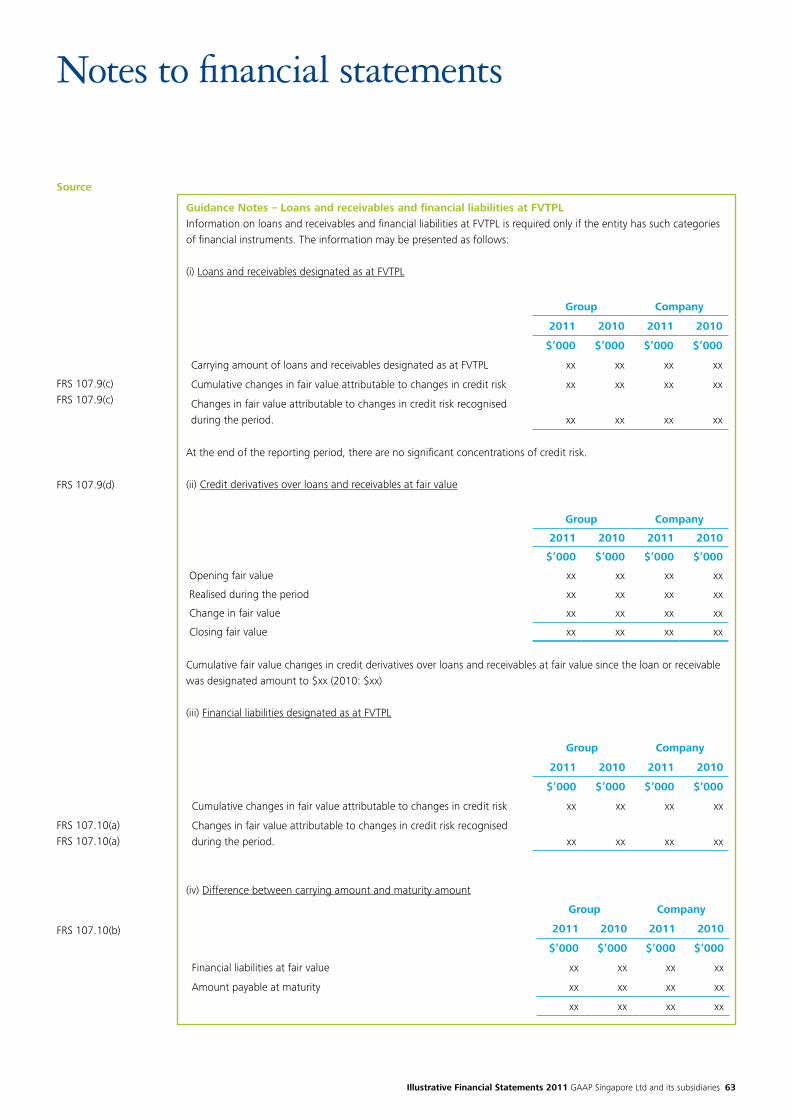
Illustrative Financial Statements 2011 GAAP Singapore Ltd and its subsidiaries 63
Source
Guidance Notes – Loans and receivables and financial liabilities at FVTPLInformation on loans and receivables and financial liabilities at FVTPL is required only if the entity has such categories of financial instruments. The information may be presented as follows:
(i) Loans and receivables designated as at FVTPL
Group Company
2011 2010 2011 2010
$’000 $’000 $’000 $’000
Carrying amount of loans and receivables designated as at FVTPL xx xx xx xx
Cumulative changes in fair value attributable to changes in credit risk xx xx xx xx
Changes in fair value attributable to changes in credit risk recognised during the period. xx xx xx xx
At the end of the reporting period, there are no significant concentrations of credit risk.
(ii) Credit derivatives over loans and receivables at fair value
Group Company
2011 2010 2011 2010
$’000 $’000 $’000 $’000
Opening fair value xx xx xx xx
Realised during the period xx xx xx xx
Change in fair value xx xx xx xx
Closing fair value xx xx xx xx
Cumulative fair value changes in credit derivatives over loans and receivables at fair value since the loan or receivable was designated amount to $xx (2010: $xx)
(iii) Financial liabilities designated as at FVTPL
Group Company
2011 2010 2011 2010
$’000 $’000 $’000 $’000
Cumulative changes in fair value attributable to changes in credit risk xx xx xx xx
Changes in fair value attributable to changes in credit risk recognised during the period. xx xx xx xx
(iv) Difference between carrying amount and maturity amount
Group Company
2011 2010 2011 2010
$’000 $’000 $’000 $’000
Financial liabilities at fair value xx xx xx xx
Amount payable at maturity xx xx xx xx
xx xx xx xx
FRS 107.9(c)FRS 107.9(c)
FRS 107.9(d)
FRS 107.10(a)FRS 107.10(a)
FRS 107.10(b)
Notes to financial statements
64
SourceFRS 107.31, 32FRS 107.33
FRS 107.33(c)FRS 107.40(c)
FRS 107.41
FRS 107 App B19
(b) Financial risk management policies and objectivesThe group has documented financial risk management policies. These policies set out the group’s overall business strategies and its risk management philosophy. The group’s overall financial risk management programme seeks to minimise potential adverse effects of financial performance of the group. The Board of Directors provides written principles for overall financial risk management and written policies covering specific areas, such as market risk (including foreign exchange risk, interest rate risk, equity price risk), credit risk, liquidity risk, cash flow interest rate risk, use of derivative financial instruments and investing excess cash. Such written policies are reviewed annually by the Board of Directors and periodic reviews are undertaken to ensure that the group’s policy guidelines are complied with. Risk management is carried out by the Treasury Department under the policies approved by the Board of Directors.
The group uses a variety of derivative financial instruments to manage its exposure to interest rate and foreign currency risk, including:• forwardexchangecontractstohedgetheexchangeraterisksarisingfromtradereceivablesandtradepayables,and
firm commitments to buy or sell goods; and• interestrateswapstomitigatetheriskofrisinginterestrates.
The group does not hold or issue derivative financial instruments for speculative purposes.
There has been no change to the group's exposure to these financial risks or the manner in which it manages and measures the risk. Market risk exposures are measured using sensitivity analysis indicated below.
Guidance Notes – Sensitivity analysisIf the entity prepares a sensitivity analysis such as value-at-risk that reflects interdependencies between risk variables (e.g. interest rates and exchange rates) and uses it to manage financial risks, it may use that value-at-risk sensitivity analysis in place of the analysis specified in FRS 107.40 which are as illustrated in the following sections for each type of market risk.
In determining what a reasonably possible change in the relevant risk variable is for sensitivity analysis, an entity shall consider:(a) the economic environments in which it operates. This shall not include remote or “worst case” scenarios or “stress test”; and(b) the effects of changes reasonably possible over the period until the entity next presents these disclosures (usually the next annual reporting period).
Notes to financial statements
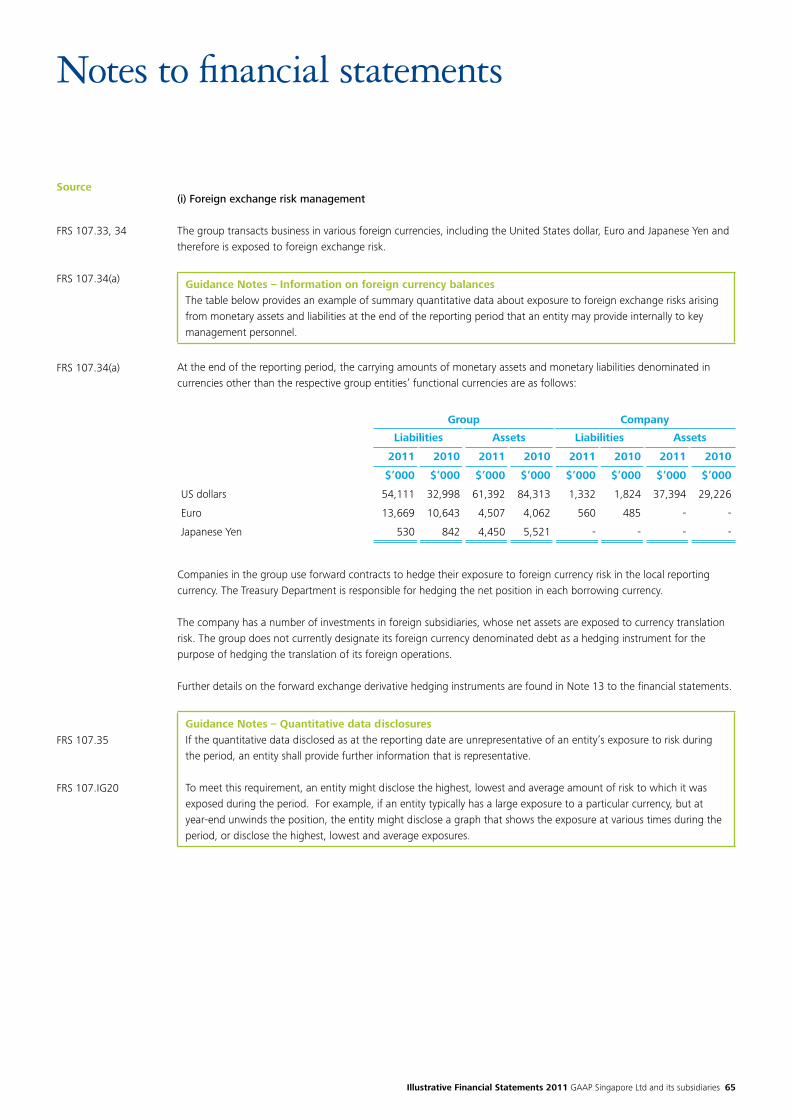
Illustrative Financial Statements 2011 GAAP Singapore Ltd and its subsidiaries 65
Source
FRS 107.33, 34
FRS 107.34(a)
FRS 107.34(a)
FRS 107.35
FRS 107.IG20
(i) Foreign exchange risk management
The group transacts business in various foreign currencies, including the United States dollar, Euro and Japanese Yen and therefore is exposed to foreign exchange risk.
Guidance Notes – Information on foreign currency balancesThe table below provides an example of summary quantitative data about exposure to foreign exchange risks arising from monetary assets and liabilities at the end of the reporting period that an entity may provide internally to key management personnel.
At the end of the reporting period, the carrying amounts of monetary assets and monetary liabilities denominated in currencies other than the respective group entities’ functional currencies are as follows:
Group Company
Liabilities Assets Liabilities Assets
2011 2010 2011 2010 2011 2010 2011 2010
$’000 $’000 $’000 $’000 $’000 $’000 $’000 $’000
US dollars 54,111 32,998 61,392 84,313 1,332 1,824 37,394 29,226
Euro 13,669 10,643 4,507 4,062 560 485 - -
Japanese Yen 530 842 4,450 5,521 - - - -
Companies in the group use forward contracts to hedge their exposure to foreign currency risk in the local reporting currency. The Treasury Department is responsible for hedging the net position in each borrowing currency.
The company has a number of investments in foreign subsidiaries, whose net assets are exposed to currency translation risk. The group does not currently designate its foreign currency denominated debt as a hedging instrument for the purpose of hedging the translation of its foreign operations.
Further details on the forward exchange derivative hedging instruments are found in Note 13 to the financial statements.
Guidance Notes – Quantitative data disclosuresIf the quantitative data disclosed as at the reporting date are unrepresentative of an entity’s exposure to risk during the period, an entity shall provide further information that is representative.
To meet this requirement, an entity might disclose the highest, lowest and average amount of risk to which it was exposed during the period. For example, if an entity typically has a large exposure to a particular currency, but at year-end unwinds the position, the entity might disclose a graph that shows the exposure at various times during the period, or disclose the highest, lowest and average exposures.
Notes to financial statements
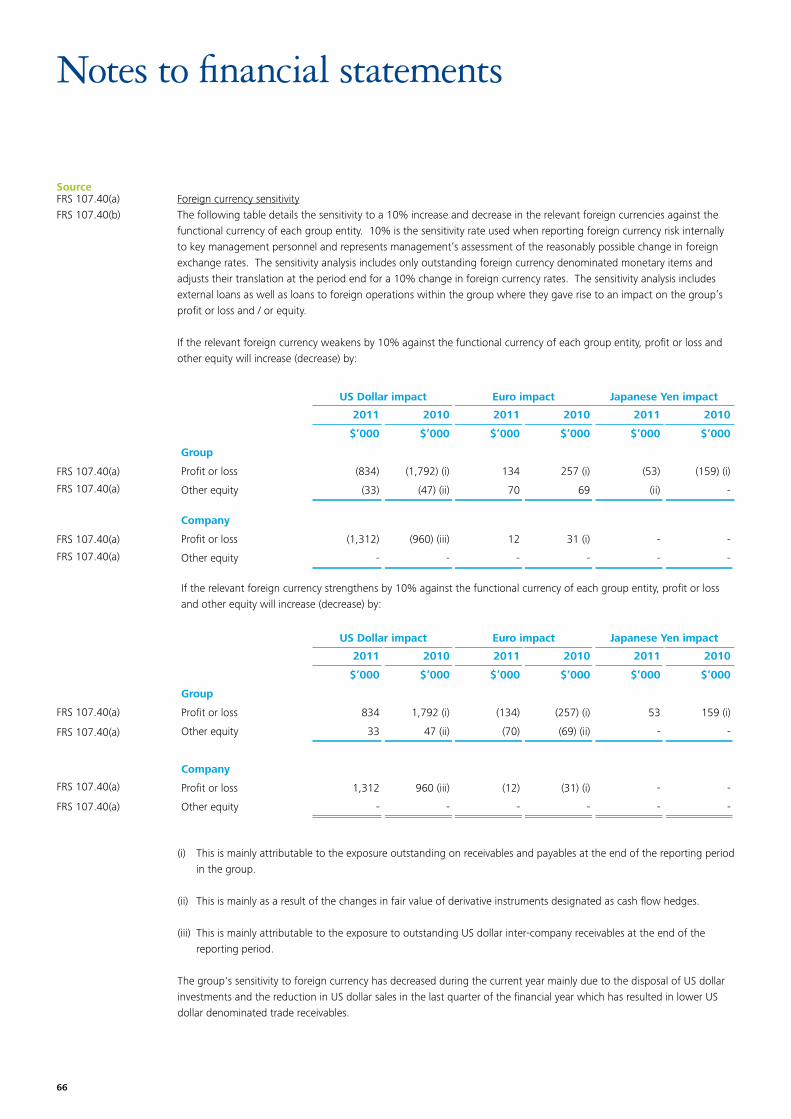
66
Source
Notes to financial statements
FRS 107.40(a)FRS 107.40(b)
FRS 107.40(a)
FRS 107.40(a)
FRS 107.40(a)
FRS 107.40(a)
FRS 107.40(a)
FRS 107.40(a)
FRS 107.40(a)
FRS 107.40(a)
Foreign currency sensitivityThe following table details the sensitivity to a 10% increase and decrease in the relevant foreign currencies against the functional currency of each group entity. 10% is the sensitivity rate used when reporting foreign currency risk internally to key management personnel and represents management’s assessment of the reasonably possible change in foreign exchange rates. The sensitivity analysis includes only outstanding foreign currency denominated monetary items and adjusts their translation at the period end for a 10% change in foreign currency rates. The sensitivity analysis includes external loans as well as loans to foreign operations within the group where they gave rise to an impact on the group’s profit or loss and / or equity.
If the relevant foreign currency weakens by 10% against the functional currency of each group entity, profit or loss and other equity will increase (decrease) by:
US Dollar impact Euro impact Japanese Yen impact
2011 2010 2011 2010 2011 2010
$’000 $’000 $’000 $’000 $’000 $’000
Group
Profit or loss (834) (1,792) (i) 134 257 (i) (53) (159) (i)
Other equity (33) (47) (ii) 70 69 (ii) -
Company
Profit or loss (1,312) (960) (iii) 12 31 (i) - -
Other equity - - - - - -
If the relevant foreign currency strengthens by 10% against the functional currency of each group entity, profit or loss and other equity will increase (decrease) by:
US Dollar impact Euro impact Japanese Yen impact
2011 2010 2011 2010 2011 2010
$’000 $’000 $’000 $’000 $’000 $’000
Group
Profit or loss 834 1,792 (i) (134) (257) (i) 53 159 (i)
Other equity 33 47 (ii) (70) (69) (ii) - -
Company
Profit or loss 1,312 960 (iii) (12) (31) (i) - -
Other equity - - - - - -
(i) This is mainly attributable to the exposure outstanding on receivables and payables at the end of the reporting period in the group.
(ii) This is mainly as a result of the changes in fair value of derivative instruments designated as cash flow hedges.
(iii) This is mainly attributable to the exposure to outstanding US dollar inter-company receivables at the end of the reporting period.
The group's sensitivity to foreign currency has decreased during the current year mainly due to the disposal of US dollar investments and the reduction in US dollar sales in the last quarter of the financial year which has resulted in lower US dollar denominated trade receivables.
Illustrative Financial Statements 2011 GAAP Singapore Ltd and its subsidiaries 67
Source
Notes to financial statements
Guidance Notes – Sensitivity analysesWhen the sensitivity analyses disclosed in accordance with FRS 107.40 or 41 are unrepresentative of a risk inherent in a financial instrument (for example because the year-end exposure does not reflect the exposure during the year), the entity shall disclose that fact and the reason it believes the sensitivity analyses are unrepresentative. An example of such a disclosure may be as follows:
In management’s opinion, the sensitivity analysis is unrepresentative of the inherent foreign exchange risk as the year end exposure does not reflect the exposure during the year. US dollar denominated sales are seasonal with lower sales volume in the last quarter of the financial year, which results in a reduction in US dollar receivables at the end of the reporting period.
(ii) Interest rate risk managementSummary quantitative data of the group’s interest-bearing financial instruments can be found in section (v) of this Note. The group's policy is to maintain cash equivalents and borrowings in fixed rate instruments. The group sometimes borrows at variable rates and uses interest rate swaps as cash flow hedges of future interest payments, which have the economic effect of converting borrowings from floating rates to fixed rates. The interest rate swaps allow the group to raise long-term borrowings at floating rates and swap them into fixed rates that are lower than those available if the group borrowed at fixed rates directly. Under the interest rate swaps, the group agrees with other parties to exchange, at specified intervals, the difference between fixed contract rates and floating rate interest amounts calculated by reference to the agreed notional principal amounts. Further details of the interest rate swaps can be found in Note 13 to the financial statements.
Interest rate sensitivityThe sensitivity analyses below have been determined based on the exposure to interest rates for both derivatives and non-derivative instruments at the end of the reporting period and the stipulated change taking place at the beginning of the financial year and held constant throughout the reporting period in the case of instruments that have floating rates. A 50 basis point increase or decrease is used when reporting interest rate risk internally to key management personnel and represents management’s assessment of the reasonably possible change in interest rates.
If interest rates had been 50 basis points higher or lower and all other variables were held constant, the group's:
•profitfortheyearendedDecember31,2011wouldincrease/decreaseby$93,000(2010:decrease/increaseby$43,000). This is mainly attributable to the group's exposure to interest rates on its variable rate borrowings; and
•otherequityreserveswouldincrease/decreaseby$19,000(2010:decrease/increaseby$12,000)mainlyasaresultofthe changes in the fair value of available-for-sale fixed rate instruments.
The group's sensitivity to interest rates has decreased during the current period mainly due to the reduction in variable rate debt instruments and the increase in interest rate swaps.
The company's profit and loss and equity are not affected by the changes in interest rates as the interest-bearing instruments carry fixed interest and are measured as amortised cost.
FRS 107.42
FRS 107.33,34
FRS 107.40(a), (b)
68
Source
Notes to financial statements
FRS 107.33, 34
FRS 107.40(a), (b)
FRS 107.36
FRS 107.B10(b)
(iii) Equity price risk managementThe group is exposed to equity risks arising from equity investments classified as held-for-trading and available-for-sale. Available-for-sale equity investments are held for strategic rather than trading purposes. The group does not actively trade available-for-sale investments.
Further details of these equity investments can be found in Notes 11, 23 and 24 to the financial statements.
Equity price sensitivityThe sensitivity analyses below have been determined based on the exposure to equity price risks at the end of the reporting period.
In respect of available-for-sale equity investments, if the inputs to the valuation model had been 10% higher / lower while all other variables were held constant:
•thegroup'snetprofitfortheyearendedDecember31,2011wouldhavebeenunaffectedastheequityinvestmentsare classified as available-for-sale and no investments were disposed of or impaired; and
•thegroup'sassetrevaluationreserveswoulddecrease/increaseby$7,000(2010:decrease/increaseby$8,000).
In respect of held-for-trading equity investments, if equity prices had been 10% higher / lower:
•thegroup'snetprofitfortheyearendedDecember31,2011woulddecrease/increaseby$5,000(2010:decrease/increase by $7,000).
The group's sensitivity to equity prices has not changed significantly from the prior year.
(iv) Credit risk managementCredit risk refers to the risk that a counterparty will default on its contractual obligations resulting in financial loss to the group. The group has adopted a policy of only dealing with creditworthy counterparties and obtaining sufficient collateral where appropriate, as a means of mitigating the risk of financial loss from defaults. The group's exposure and the credit ratings of its counterparties are continuously monitored and the aggregate value of transactions concluded is spread amongst approved counterparties. Credit exposure is controlled by the counterparty limits that are reviewed and approved by the risk management committee annually.
Trade receivables consist of a large number of customers, spread across diverse industries and geographical areas. Ongoing credit evaluation is performed on the financial condition of accounts receivable and, where appropriate, credit guarantee insurance cover is purchased.
The group does not have any significant credit risk exposure to any single counterparty or any group of counterparties having similar characteristics. The group defines counterparties as having similar characteristics if they are related entities. Concentration of credit risk did not exceed 5% of gross monetary assets at any time during the year. The credit risk on liquid funds and derivative financial instruments is limited because the counterparties are banks with high credit-ratings assigned by international credit-rating agencies.
The maximum amount the Group could be forced to settle under the financial guarantee contract in Note 28, if the full guaranteed amount is claimed by the counterparty to the guarantee is $2 million (2010: $1.6 million). Based on expectations at the end of the reporting period, the Group considers that it is more likely than not that no amount will be payable under the arrangement. However, this estimate is subject to change depending on the probability of the counterparty claiming under the guarantee which is a function of the likelihood that the financial receivables held by the counterparty which are guaranteed suffer credit losses.
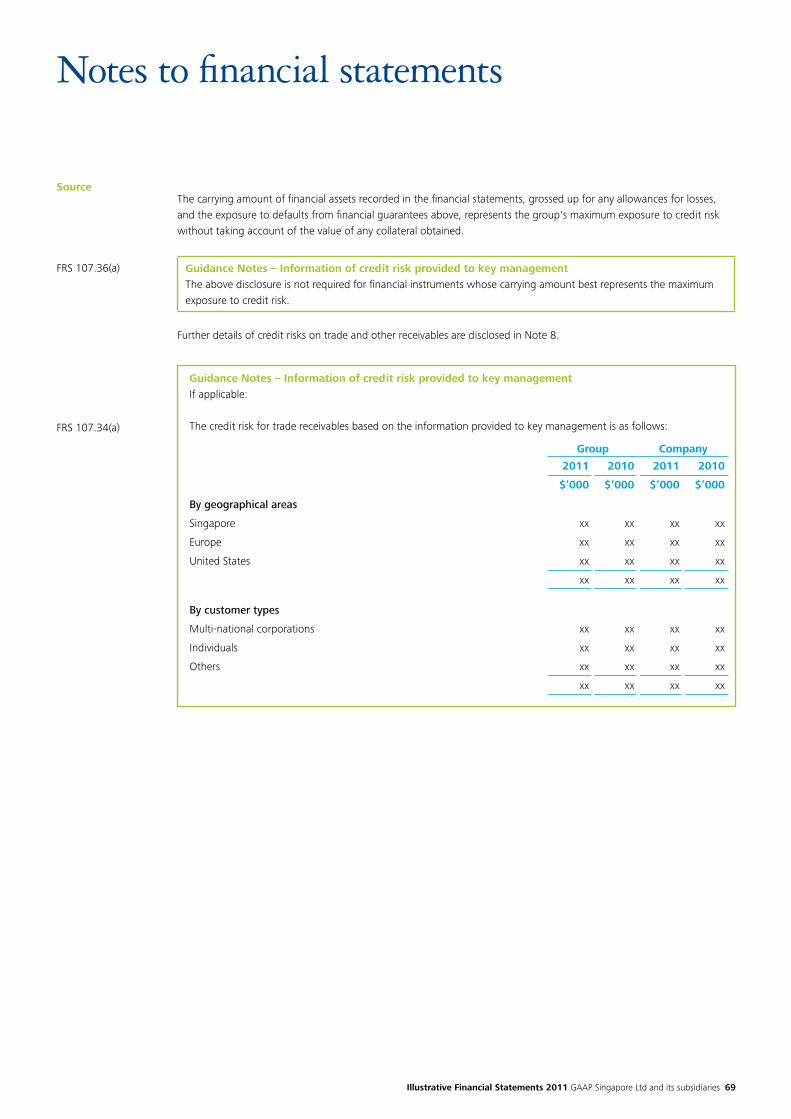
Illustrative Financial Statements 2011 GAAP Singapore Ltd and its subsidiaries 69
Source
Notes to financial statements
The carrying amount of financial assets recorded in the financial statements, grossed up for any allowances for losses, and the exposure to defaults from financial guarantees above, represents the group's maximum exposure to credit risk without taking account of the value of any collateral obtained.
Guidance Notes – Information of credit risk provided to key managementThe above disclosure is not required for financial instruments whose carrying amount best represents the maximum exposure to credit risk.
Further details of credit risks on trade and other receivables are disclosed in Note 8.
FRS 107.36(a)
FRS 107.34(a)
Guidance Notes – Information of credit risk provided to key managementIf applicable: The credit risk for trade receivables based on the information provided to key management is as follows:
Group Company
2011 2010 2011 2010
$’000 $’000 $’000 $’000
By geographical areas
Singapore xx xx xx xx
Europe xx xx xx xx
United States xx xx xx xx
xx xx xx xx
By customer types
Multi-national corporations xx xx xx xx
Individuals xx xx xx xx
Others xx xx xx xx
xx xx xx xx
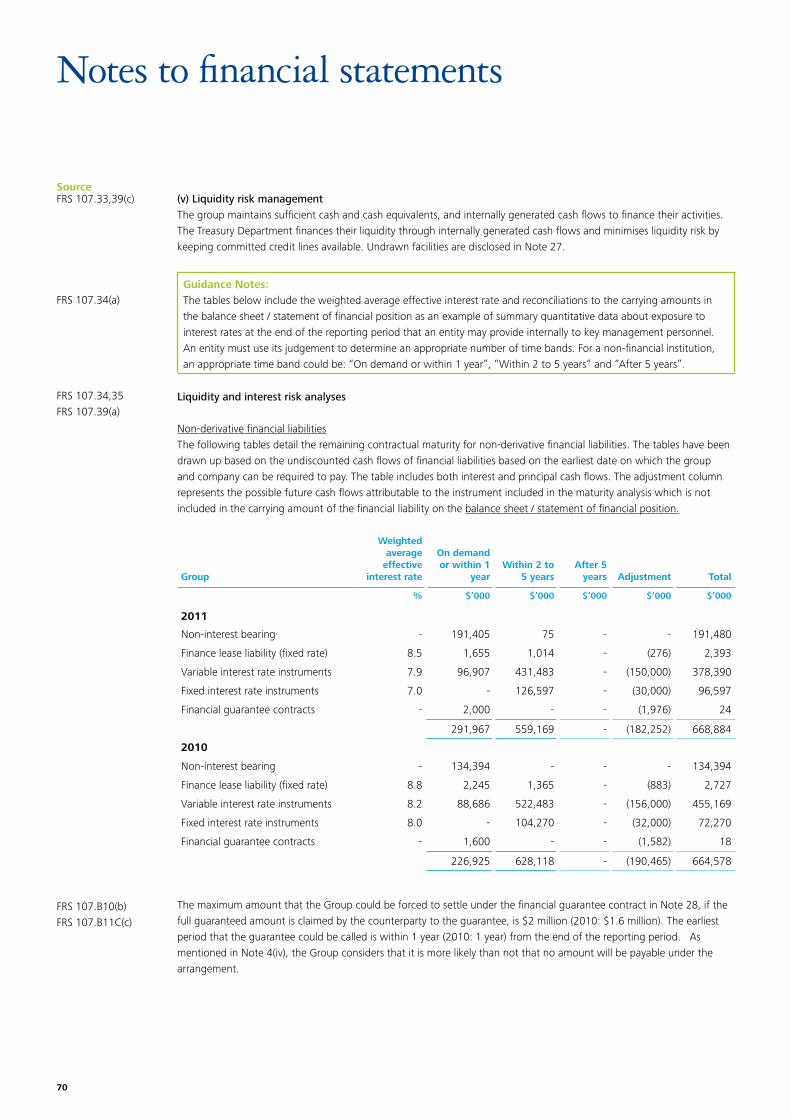
70
Source
Notes to financial statements
(v) Liquidity risk managementThe group maintains sufficient cash and cash equivalents, and internally generated cash flows to finance their activities. The Treasury Department finances their liquidity through internally generated cash flows and minimises liquidity risk by keeping committed credit lines available. Undrawn facilities are disclosed in Note 27.
Guidance Notes:The tables below include the weighted average effective interest rate and reconciliations to the carrying amounts in the balance sheet / statement of financial position as an example of summary quantitative data about exposure to interest rates at the end of the reporting period that an entity may provide internally to key management personnel. An entity must use its judgement to determine an appropriate number of time bands. For a non-financial institution, an appropriate time band could be: “On demand or within 1 year”, “Within 2 to 5 years” and “After 5 years”.
Liquidity and interest risk analyses
Non-derivative financial liabilitiesThe following tables detail the remaining contractual maturity for non-derivative financial liabilities. The tables have been drawn up based on the undiscounted cash flows of financial liabilities based on the earliest date on which the group and company can be required to pay. The table includes both interest and principal cash flows. The adjustment column represents the possible future cash flows attributable to the instrument included in the maturity analysis which is not included in the carrying amount of the financial liability on the balance sheet / statement of financial position.
FRS 107.33,39(c)
FRS 107.34(a)
FRS 107.34,35FRS 107.39(a)
FRS 107.B10(b)FRS 107.B11C(c)
Group
Weighted average
effective interest rate
On demand or within 1
yearWithin 2 to
5 yearsAfter 5
years Adjustment Total
% $’000 $’000 $’000 $’000 $’000
2011
Non-interest bearing - 191,405 75 - - 191,480
Finance lease liability (fixed rate) 8.5 1,655 1,014 - (276) 2,393
Variable interest rate instruments 7.9 96,907 431,483 - (150,000) 378,390
Fixed interest rate instruments 7.0 - 126,597 - (30,000) 96,597
Financial guarantee contracts - 2,000 - - (1,976) 24
291,967 559,169 - (182,252) 668,884
2010
Non-interest bearing - 134,394 - - - 134,394
Finance lease liability (fixed rate) 8.8 2,245 1,365 - (883) 2,727
Variable interest rate instruments 8.2 88,686 522,483 - (156,000) 455,169
Fixed interest rate instruments 8.0 - 104,270 - (32,000) 72,270
Financial guarantee contracts - 1,600 - - (1,582) 18
226,925 628,118 - (190,465) 664,578
The maximum amount that the Group could be forced to settle under the financial guarantee contract in Note 28, if the full guaranteed amount is claimed by the counterparty to the guarantee, is $2 million (2010: $1.6 million). The earliest period that the guarantee could be called is within 1 year (2010: 1 year) from the end of the reporting period. As mentioned in Note 4(iv), the Group considers that it is more likely than not that no amount will be payable under the arrangement.
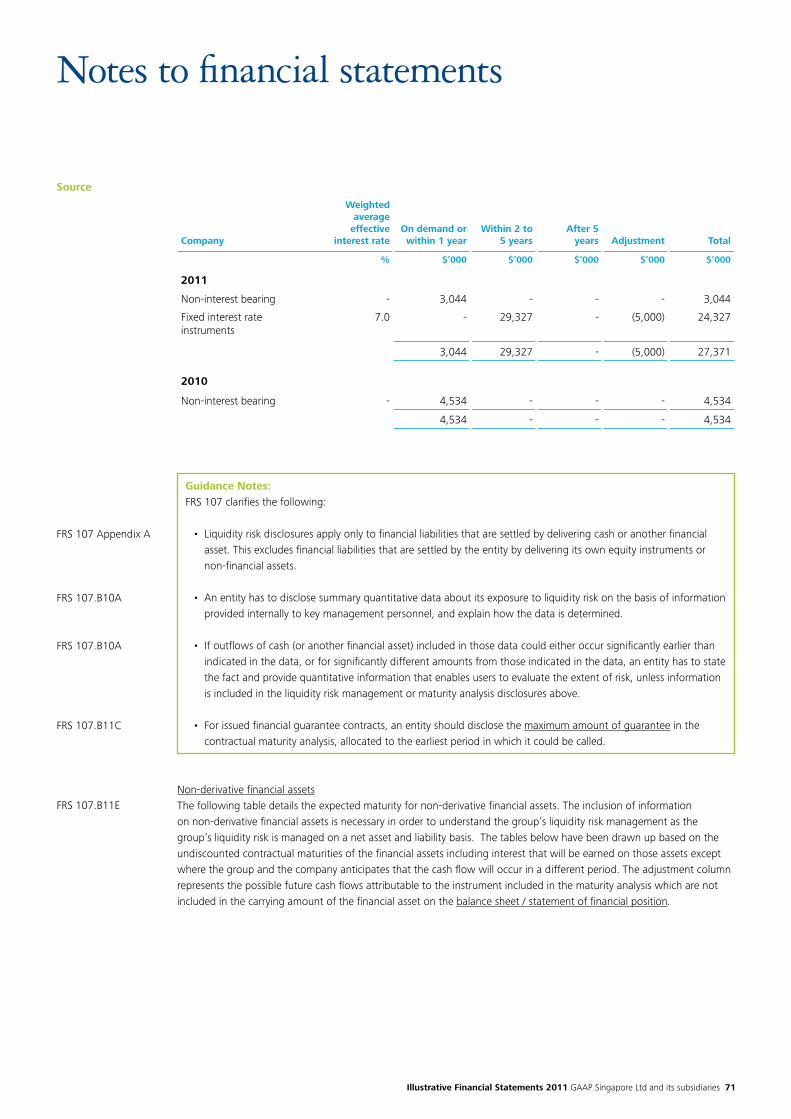
Illustrative Financial Statements 2011 GAAP Singapore Ltd and its subsidiaries 71
Source
Notes to financial statements
Company
Weighted average
effective interest rate
On demand or within 1 year
Within 2 to 5 years
After 5 years Adjustment Total
% $’000 $’000 $’000 $’000 $’000
2011
Non-interest bearing - 3,044 - - - 3,044
Fixed interest rate instruments
7.0 - 29,327 - (5,000) 24,327
3,044 29,327 - (5,000) 27,371
2010
Non-interest bearing - 4,534 - - - 4,534
4,534 - - - 4,534
Guidance Notes: FRS 107 clarifies the following:
• Liquidityriskdisclosuresapplyonlytofinancialliabilitiesthataresettledbydeliveringcashoranotherfinancialasset. This excludes financial liabilities that are settled by the entity by delivering its own equity instruments or non-financial assets.
• Anentityhastodisclosesummaryquantitativedataaboutitsexposuretoliquidityriskonthebasisofinformationprovided internally to key management personnel, and explain how the data is determined.
• Ifoutflowsofcash(oranotherfinancialasset)includedinthosedatacouldeitheroccursignificantlyearlierthanindicated in the data, or for significantly different amounts from those indicated in the data, an entity has to state the fact and provide quantitative information that enables users to evaluate the extent of risk, unless information is included in the liquidity risk management or maturity analysis disclosures above.
• Forissuedfinancialguaranteecontracts,anentityshoulddisclosethemaximum amount of guarantee in the contractual maturity analysis, allocated to the earliest period in which it could be called.
FRS 107 Appendix A
FRS 107.B10A
FRS 107.B10A
FRS 107.B11C
FRS 107.B11ENon-derivative financial assetsThe following table details the expected maturity for non-derivative financial assets. The inclusion of information on non-derivative financial assets is necessary in order to understand the group’s liquidity risk management as the group’s liquidity risk is managed on a net asset and liability basis. The tables below have been drawn up based on the undiscounted contractual maturities of the financial assets including interest that will be earned on those assets except where the group and the company anticipates that the cash flow will occur in a different period. The adjustment column represents the possible future cash flows attributable to the instrument included in the maturity analysis which are not included in the carrying amount of the financial asset on the balance sheet / statement of financial position.
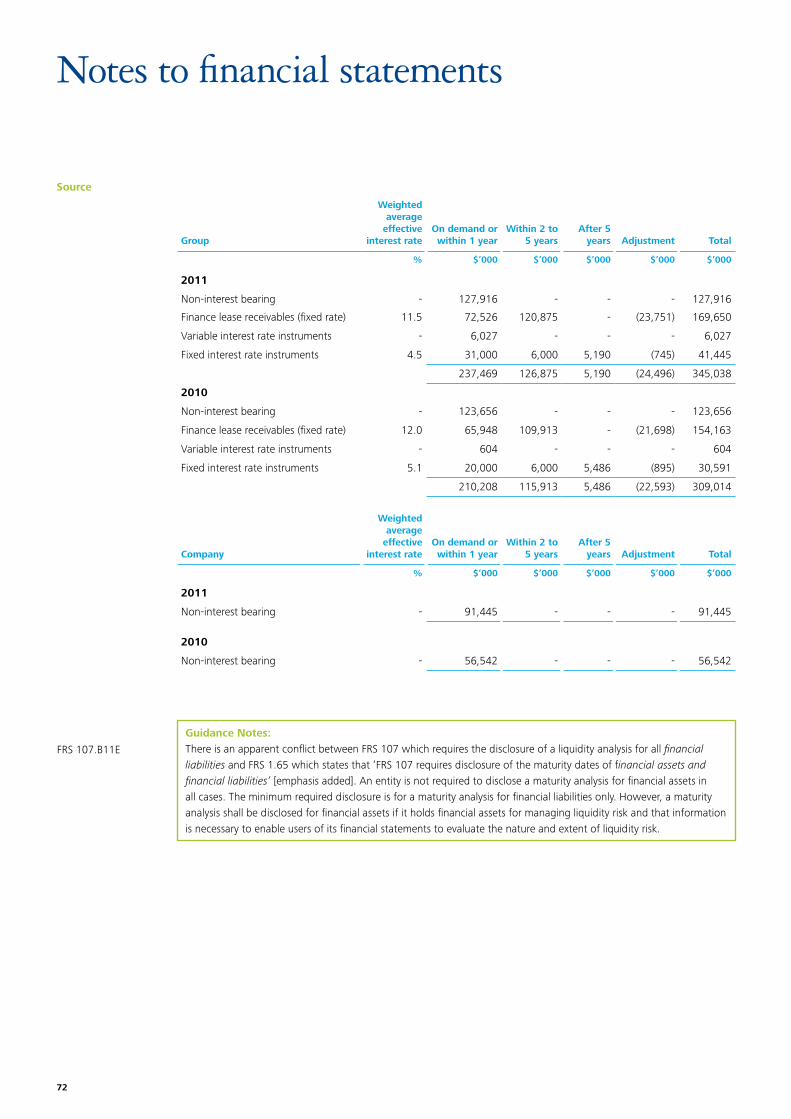
72
Source
Notes to financial statements
Group
Weighted average
effective interest rate
On demand or within 1 year
Within 2 to 5 years
After 5 years Adjustment Total
% $’000 $’000 $’000 $’000 $’000
2011
Non-interest bearing - 127,916 - - - 127,916
Finance lease receivables (fixed rate) 11.5 72,526 120,875 - (23,751) 169,650
Variable interest rate instruments - 6,027 - - - 6,027
Fixed interest rate instruments 4.5 31,000 6,000 5,190 (745) 41,445
237,469 126,875 5,190 (24,496) 345,038
2010
Non-interest bearing - 123,656 - - - 123,656
Finance lease receivables (fixed rate) 12.0 65,948 109,913 - (21,698) 154,163
Variable interest rate instruments - 604 - - - 604
Fixed interest rate instruments 5.1 20,000 6,000 5,486 (895) 30,591
210,208 115,913 5,486 (22,593) 309,014
Company
Weighted average
effective interest rate
On demand or within 1 year
Within 2 to 5 years
After 5 years Adjustment Total
% $’000 $’000 $’000 $’000 $’000
2011
Non-interest bearing - 91,445 - - - 91,445
2010
Non-interest bearing - 56,542 - - - 56,542
Guidance Notes: There is an apparent conflict between FRS 107 which requires the disclosure of a liquidity analysis for all financial liabilities and FRS 1.65 which states that ‘FRS 107 requires disclosure of the maturity dates of financial assets and financial liabilities’ [emphasis added]. An entity is not required to disclose a maturity analysis for financial assets in all cases. The minimum required disclosure is for a maturity analysis for financial liabilities only. However, a maturity analysis shall be disclosed for financial assets if it holds financial assets for managing liquidity risk and that information is necessary to enable users of its financial statements to evaluate the nature and extent of liquidity risk.
FRS 107.B11E
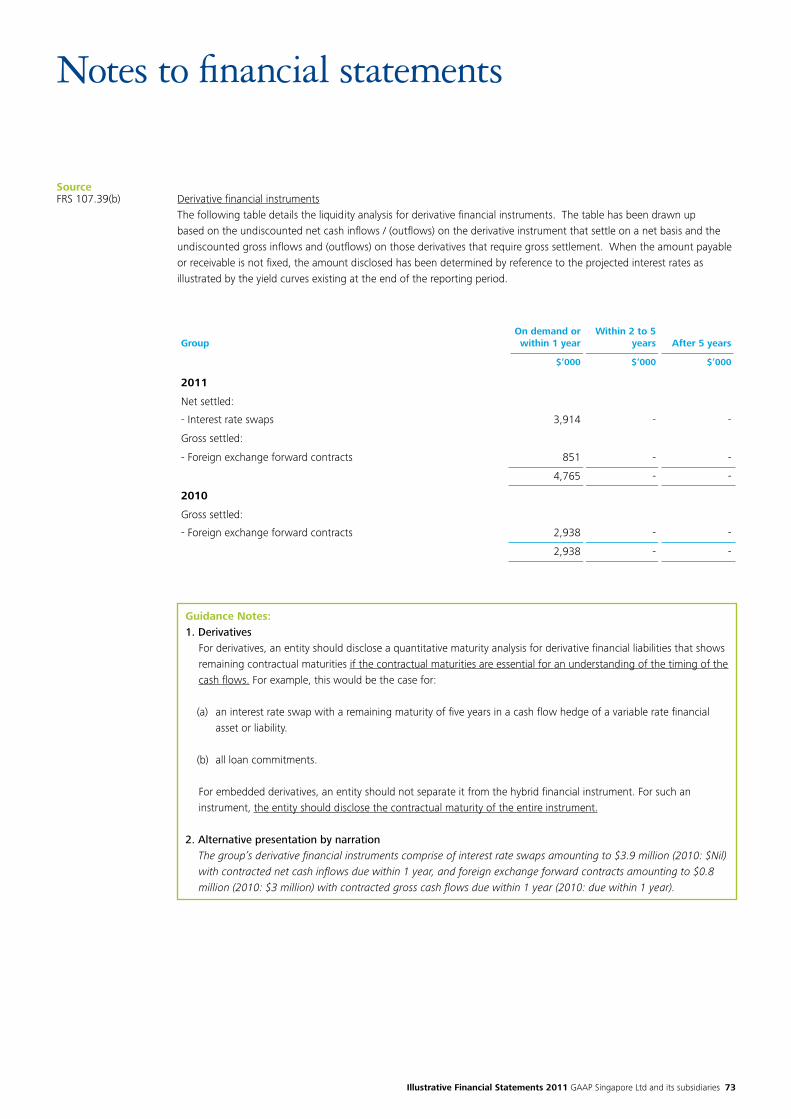
Illustrative Financial Statements 2011 GAAP Singapore Ltd and its subsidiaries 73
Source
Notes to financial statements
FRS 107.39(b) Derivative financial instrumentsThe following table details the liquidity analysis for derivative financial instruments. The table has been drawn up based on the undiscounted net cash inflows / (outflows) on the derivative instrument that settle on a net basis and the undiscounted gross inflows and (outflows) on those derivatives that require gross settlement. When the amount payable or receivable is not fixed, the amount disclosed has been determined by reference to the projected interest rates as illustrated by the yield curves existing at the end of the reporting period.
GroupOn demand orwithin 1 year
Within 2 to 5 years After 5 years
$’000 $’000 $’000
2011
Net settled:
- Interest rate swaps 3,914 - -
Gross settled:
- Foreign exchange forward contracts 851 - -
4,765 - -
2010
Gross settled:
- Foreign exchange forward contracts 2,938 - -
2,938 - -
Guidance Notes: 1. Derivatives
For derivatives, an entity should disclose a quantitative maturity analysis for derivative financial liabilities that shows remaining contractual maturities if the contractual maturities are essential for an understanding of the timing of the cash flows. For example, this would be the case for:
(a) an interest rate swap with a remaining maturity of five years in a cash flow hedge of a variable rate financial asset or liability.
(b) all loan commitments.
For embedded derivatives, an entity should not separate it from the hybrid financial instrument. For such an instrument, the entity should disclose the contractual maturity of the entire instrument.
2. Alternative presentation by narrationThe group’s derivative financial instruments comprise of interest rate swaps amounting to $3.9 million (2010: $Nil) with contracted net cash inflows due within 1 year, and foreign exchange forward contracts amounting to $0.8 million (2010: $3 million) with contracted gross cash flows due within 1 year (2010: due within 1 year).
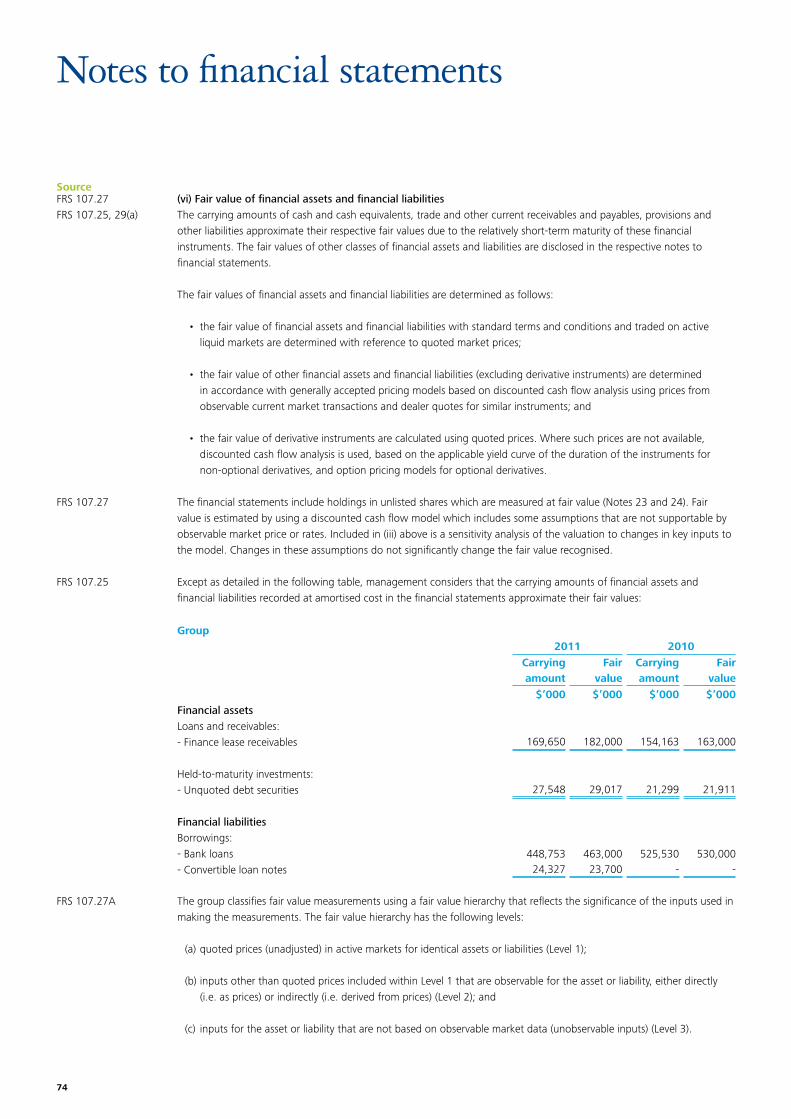
74
Source
Notes to financial statements
FRS 107.27FRS 107.25, 29(a)
FRS 107.27
FRS 107.25
FRS 107.27A
(vi) Fair value of financial assets and financial liabilitiesThe carrying amounts of cash and cash equivalents, trade and other current receivables and payables, provisions and other liabilities approximate their respective fair values due to the relatively short-term maturity of these financial instruments. The fair values of other classes of financial assets and liabilities are disclosed in the respective notes to financial statements.
The fair values of financial assets and financial liabilities are determined as follows:
• thefairvalueoffinancialassetsandfinancialliabilitieswithstandardtermsandconditionsandtradedonactiveliquid markets are determined with reference to quoted market prices;
• thefairvalueofotherfinancialassetsandfinancialliabilities(excludingderivativeinstruments)aredeterminedin accordance with generally accepted pricing models based on discounted cash flow analysis using prices from observable current market transactions and dealer quotes for similar instruments; and
• thefairvalueofderivativeinstrumentsarecalculatedusingquotedprices.Wheresuchpricesarenotavailable,discounted cash flow analysis is used, based on the applicable yield curve of the duration of the instruments for non-optional derivatives, and option pricing models for optional derivatives.
The financial statements include holdings in unlisted shares which are measured at fair value (Notes 23 and 24). Fair value is estimated by using a discounted cash flow model which includes some assumptions that are not supportable by observable market price or rates. Included in (iii) above is a sensitivity analysis of the valuation to changes in key inputs to the model. Changes in these assumptions do not significantly change the fair value recognised.
Except as detailed in the following table, management considers that the carrying amounts of financial assets and financial liabilities recorded at amortised cost in the financial statements approximate their fair values:
Group2011 2010
Carrying Fair Carrying Fairamount value amount value
$’000 $’000 $’000 $’000Financial assetsLoans and receivables:- Finance lease receivables 169,650 182,000 154,163 163,000
Held-to-maturity investments: - Unquoted debt securities 27,548 29,017 21,299 21,911
Financial liabilitiesBorrowings:- Bank loans 448,753 463,000 525,530 530,000- Convertible loan notes 24,327 23,700 - -
The group classifies fair value measurements using a fair value hierarchy that reflects the significance of the inputs used in making the measurements. The fair value hierarchy has the following levels:
(a) quoted prices (unadjusted) in active markets for identical assets or liabilities (Level 1);
(b) inputs other than quoted prices included within Level 1 that are observable for the asset or liability, either directly (i.e. as prices) or indirectly (i.e. derived from prices) (Level 2); and
(c) inputs for the asset or liability that are not based on observable market data (unobservable inputs) (Level 3).
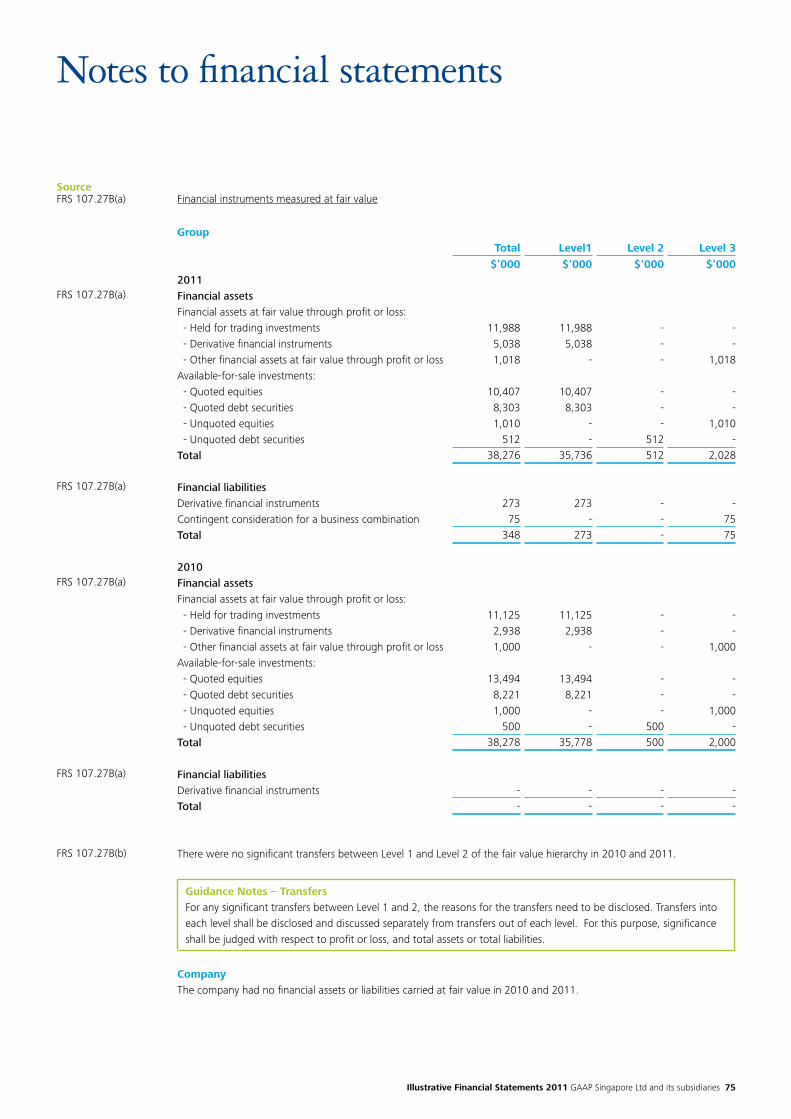
Illustrative Financial Statements 2011 GAAP Singapore Ltd and its subsidiaries 75
Source
Notes to financial statements
Financial instruments measured at fair value
GroupTotal Level1 Level 2 Level 3
$’000 $’000 $’000 $’0002011Financial assetsFinancial assets at fair value through profit or loss: - Held for trading investments 11,988 11,988 - - - Derivative financial instruments 5,038 5,038 - - - Other financial assets at fair value through profit or loss 1,018 - - 1,018Available-for-sale investments: - Quoted equities 10,407 10,407 - - - Quoted debt securities 8,303 8,303 - - - Unquoted equities 1,010 - - 1,010 - Unquoted debt securities 512 - 512 - Total 38,276 35,736 512 2,028
Financial liabilitiesDerivative financial instruments 273 273 - - Contingent consideration for a business combination 75 - - 75Total 348 273 - 75
2010Financial assetsFinancial assets at fair value through profit or loss: - Held for trading investments 11,125 11,125 - - - Derivative financial instruments 2,938 2,938 - - - Other financial assets at fair value through profit or loss 1,000 - - 1,000Available-for-sale investments: - Quoted equities 13,494 13,494 - - - Quoted debt securities 8,221 8,221 - - - Unquoted equities 1,000 - - 1,000 - Unquoted debt securities 500 - 500 - Total 38,278 35,778 500 2,000
Financial liabilitiesDerivative financial instruments - - - - Total - - - -
There were no significant transfers between Level 1 and Level 2 of the fair value hierarchy in 2010 and 2011.
Guidance Notes – Transfers For any significant transfers between Level 1 and 2, the reasons for the transfers need to be disclosed. Transfers into each level shall be disclosed and discussed separately from transfers out of each level. For this purpose, significance shall be judged with respect to profit or loss, and total assets or total liabilities.
CompanyThe company had no financial assets or liabilities carried at fair value in 2010 and 2011.
FRS 107.27B(a)
FRS 107.27B(a)
FRS 107.27B(a)
FRS 107.27B(a)
FRS 107.27B(a)
FRS 107.27B(b)
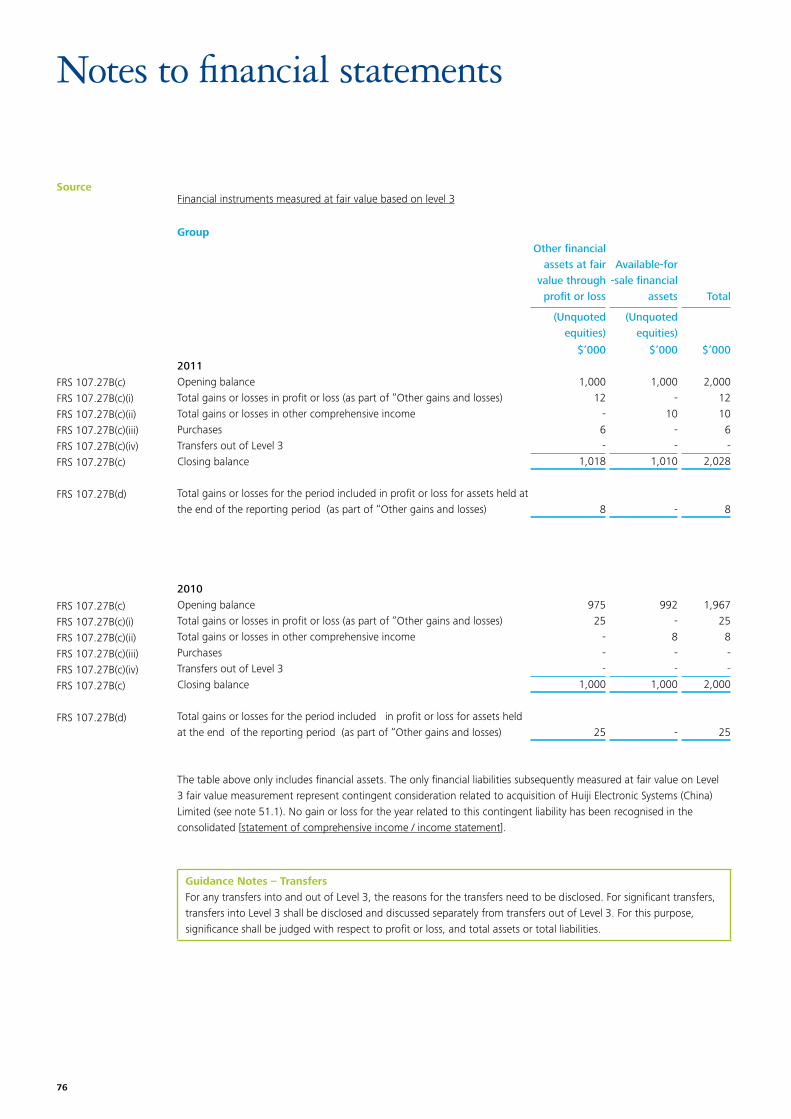
76
Source
Notes to financial statements
Financial instruments measured at fair value based on level 3
Group
Other financial assets at fair
value through profit or loss
Available-for -sale financial
assets Total
(Unquoted equities)
(Unquoted equities)
$’000 $’000 $’0002011Opening balance 1,000 1,000 2,000Total gains or losses in profit or loss (as part of “Other gains and losses) 12 - 12Total gains or losses in other comprehensive income - 10 10Purchases 6 - 6Transfers out of Level 3 - - - Closing balance 1,018 1,010 2,028
Total gains or losses for the period included in profit or loss for assets held at the end of the reporting period (as part of “Other gains and losses) 8 - 8
2010Opening balance 975 992 1,967Total gains or losses in profit or loss (as part of “Other gains and losses) 25 - 25Total gains or losses in other comprehensive income - 8 8Purchases - - - Transfers out of Level 3 - - - Closing balance 1,000 1,000 2,000
Total gains or losses for the period included in profit or loss for assets held at the end of the reporting period (as part of “Other gains and losses) 25 - 25
The table above only includes financial assets. The only financial liabilities subsequently measured at fair value on Level 3 fair value measurement represent contingent consideration related to acquisition of Huiji Electronic Systems (China) Limited (see note 51.1). No gain or loss for the year related to this contingent liability has been recognised in the consolidated [statement of comprehensive income / income statement].
Guidance Notes – Transfers For any transfers into and out of Level 3, the reasons for the transfers need to be disclosed. For significant transfers, transfers into Level 3 shall be disclosed and discussed separately from transfers out of Level 3. For this purpose, significance shall be judged with respect to profit or loss, and total assets or total liabilities.
FRS 107.27B(c)FRS 107.27B(c)(i)FRS 107.27B(c)(ii)FRS 107.27B(c)(iii)FRS 107.27B(c)(iv)FRS 107.27B(c)
FRS 107.27B(d)
FRS 107.27B(c)FRS 107.27B(c)(i)FRS 107.27B(c)(ii)FRS 107.27B(c)(iii)FRS 107.27B(c)(iv)FRS 107.27B(c)
FRS 107.27B(d)
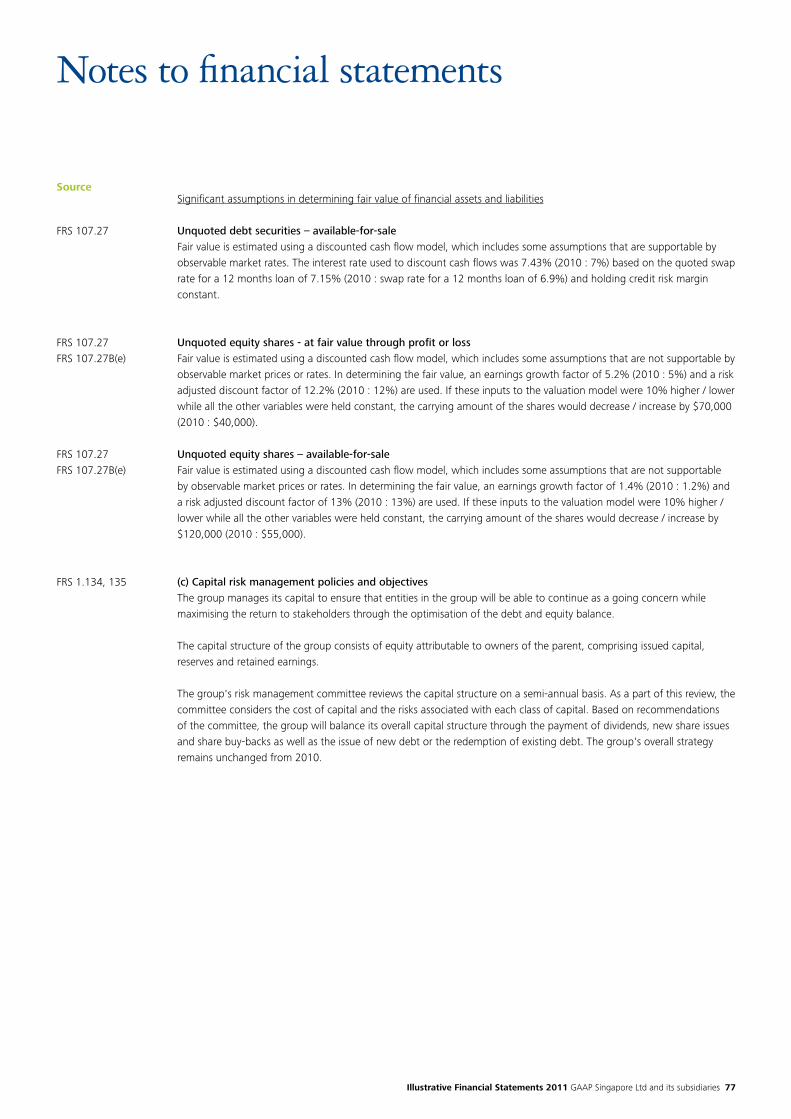
Illustrative Financial Statements 2011 GAAP Singapore Ltd and its subsidiaries 77
Source
Notes to financial statements
Significant assumptions in determining fair value of financial assets and liabilities
Unquoted debt securities – available-for-saleFair value is estimated using a discounted cash flow model, which includes some assumptions that are supportable by observable market rates. The interest rate used to discount cash flows was 7.43% (2010 : 7%) based on the quoted swap rate for a 12 months loan of 7.15% (2010 : swap rate for a 12 months loan of 6.9%) and holding credit risk margin constant.
Unquoted equity shares - at fair value through profit or lossFair value is estimated using a discounted cash flow model, which includes some assumptions that are not supportable by observable market prices or rates. In determining the fair value, an earnings growth factor of 5.2% (2010 : 5%) and a risk adjusted discount factor of 12.2% (2010 : 12%) are used. If these inputs to the valuation model were 10% higher / lower while all the other variables were held constant, the carrying amount of the shares would decrease / increase by $70,000 (2010 : $40,000).
Unquoted equity shares – available-for-saleFair value is estimated using a discounted cash flow model, which includes some assumptions that are not supportable by observable market prices or rates. In determining the fair value, an earnings growth factor of 1.4% (2010 : 1.2%) and a risk adjusted discount factor of 13% (2010 : 13%) are used. If these inputs to the valuation model were 10% higher / lower while all the other variables were held constant, the carrying amount of the shares would decrease / increase by $120,000 (2010 : $55,000).
(c) Capital risk management policies and objectivesThe group manages its capital to ensure that entities in the group will be able to continue as a going concern while maximising the return to stakeholders through the optimisation of the debt and equity balance.
The capital structure of the group consists of equity attributable to owners of the parent, comprising issued capital, reserves and retained earnings.
The group's risk management committee reviews the capital structure on a semi-annual basis. As a part of this review, the committee considers the cost of capital and the risks associated with each class of capital. Based on recommendations of the committee, the group will balance its overall capital structure through the payment of dividends, new share issues and share buy-backs as well as the issue of new debt or the redemption of existing debt. The group's overall strategy remains unchanged from 2010.
FRS 107.27
FRS 107.27FRS 107.27B(e)
FRS 107.27FRS 107.27B(e)
FRS 1.134, 135
78
Source
Notes to financial statements
Guidance Notes – Disclosures on externally imposed capital requirementsWhen an entity is subject to externally imposed capital requirements, FRS 1.135 requires disclosures on:• thenatureofthoserequirements;• howthoserequirementsareincorporatedintothemanagementofcapital;• anychangesinthoserequirementsfromthepreviousperiod;• whetherduringtheperiod,theentitycompliedwithanyexternallyimposedcapitalrequirementstowhichitis
subject to; and• whentheentityhasnotcompliedwithsuchexternallyimposedcapitalrequirements,theconsequencesofsuch
non-compliance.
Only capital requirements imposed by external regulators are required to be disclosed under FRS 1.135(a)(ii)Although FRS 1.135(a)(ii) do not provide any further guidance regarding what is meant by 'externally imposed capital requirements', paragraphs BC92 to BC97 of the Basis for Conclusions to IAS 1(2007) effectively narrow the scope of the requirements to "entity-specific requirement[s] imposed on a particular entity by its prudential supervisor or other regulator". The entity bases these disclosures on the information provided internally to key management personnel.
Although disclosure of details regarding loan covenants is not required under FRS 1.135(a)(ii), entities should consider whether such details should nevertheless be disclosed in line with the requirements in FRS 1.17(c) to provide additional information to enable users of the financial statements to understand the impact of particular transactions, other events and conditions on the entity's financial position and financial performance.
An example of disclosures required by FRS 1.134 and 135 for an entity that is subject to externally imposed capital requirements is as follows:
The Company manages its capital to ensure that it will able to continue as a going concern, to maximise the return to stakeholders through the optimisation of the debt and equity balance, and to ensure that all externally imposed capital requirements are complied with.
The capital structure of the Company consists of debt, which includes borrowings disclosed in Note 27, issued capital, reserves and retained earnings. One of the subsidiaries of the Company is required to set aside a minimum amount of X% of profits annually. Such profits are accumulated in a separate reserve called “Statutory Reserves”. The Statutory Reserves may only be distributed to shareholders upon liquidation of the subsidiary. The Company is in compliance with externally imposed capital requirements for the financial years ended December 31, 2011 and 2010. The Company's risk management committee also reviews the capital structure on a semi-annual basis. As a part of this review, the committee considers the cost of capital and the risks associated with each class of capital. The committee also ensures that the Company maintains gearing ratios within a set range to comply with the loan covenant imposed by a bank. Based on recommendations of the committee, the Company will balance its overall capital structure through the payment of dividends, new share issues and share buy-backs as well as the issue of new debt or the redemption of existing debt.
The management’s strategy remained unchanged from 2010.
[Note - when the entity has not complied with such externally imposed capital requirements, it should disclose the consequences of such non-compliance]
FRS 1.135(a)
FRS 1.135(a)(i) FRS 1.135(a)(ii) FRS 1.135(b)
FRS 1.135(d)
FRS 1.135(a)(iii)
FRS 1.135(c)
FRS 1.135(e)

Illustrative Financial Statements 2011 GAAP Singapore Ltd and its subsidiaries 79
Source
Notes to financial statements
5. Holding company and related company transactions
The company is a subsidiary of GAAP Holdings Ltd, incorporated in the Republic of Singapore, which is also the company’s ultimate holding company. Related companies in these financial statements refer to members of the holding company’s group of companies.
Guidance Notes 1. Disclosure of name of ultimate controlling partyAn entity shall disclose the name of its parent and, if different, the ultimate controlling party. The ultimate controlling party may or may not be a corporate entity. The requirement to disclose the entity’s ultimate controlling party means that, where such control is exercised by an individual, or by a group of individuals acting in concert, their identity must be disclosed.
If neither the entity’s parent nor the ultimate controlling party produces consolidated financial statements available for public use, the name of the next most senior parent that does so shall also be disclosed.
A possible disclosure may be as follows:
The company is a subsidiary of GAAP International Ltd, incorporated in the Country KLM. The ultimate controlling party is Mr Ang Bo Pian whose interest in the company is held through his shareholdings in ABC Ltd and XYZ Ltd. The next senior parent of the company that prepares financial statements for public use is GAAP Holdings Pte Ltd, incorporated in Singapore
Some of the company’s transactions and arrangements are between members of the group and the effect of these on the basis determined between the parties is reflected in these financial statements. The intercompany balances are unsecured, interest-free and repayable on demand unless otherwise stated.
Trading transactionsDuring the year, group entities entered into the following trading transactions with related companies that are not members of the group:
Sales of goodsPurchasesof goods
Amounts owed by related companies
Amounts owed to related companies
2011 2010 2011 2010 2011 2010 2011 2010
$’000 $’000 $’000 $’000 $’000 $’000 $’000 $’000
GAAP Holdings Ltd 693 582 439 427 209 198 231 139
Subsidiaries of GAAP Holdings Ltd 1,289 981 897 883 398 293 149 78
Sales of goods to related companies were made at the group’s usual list prices, less average discounts of 5%. Purchases were made at market price discounted to reflect the quantity of goods purchased and the relationships between the companies.
The amounts outstanding are unsecured and will be settled in cash. No guarantees have been given or received. No expense has been recognised in the period for bad or doubtful debts in respect of the amounts owed by related companies.
In addition to the above, GAAP Holdings Ltd performed certain administrative services for the company, for which a management fee of $0.18 million (2010: $0.16 million) was charged and paid, being an appropriate allocation of costs incurred by relevant administrative departments of GAAP Holdings Ltd.
FRS 24.13FRS 1.138(c)
FRS 24.13
FRS 24.18
FRS 24.18FRS 24.19
FRS 24.23
FRS 24.18(b),(c),(d)
FRS 24.18FRS 24.19
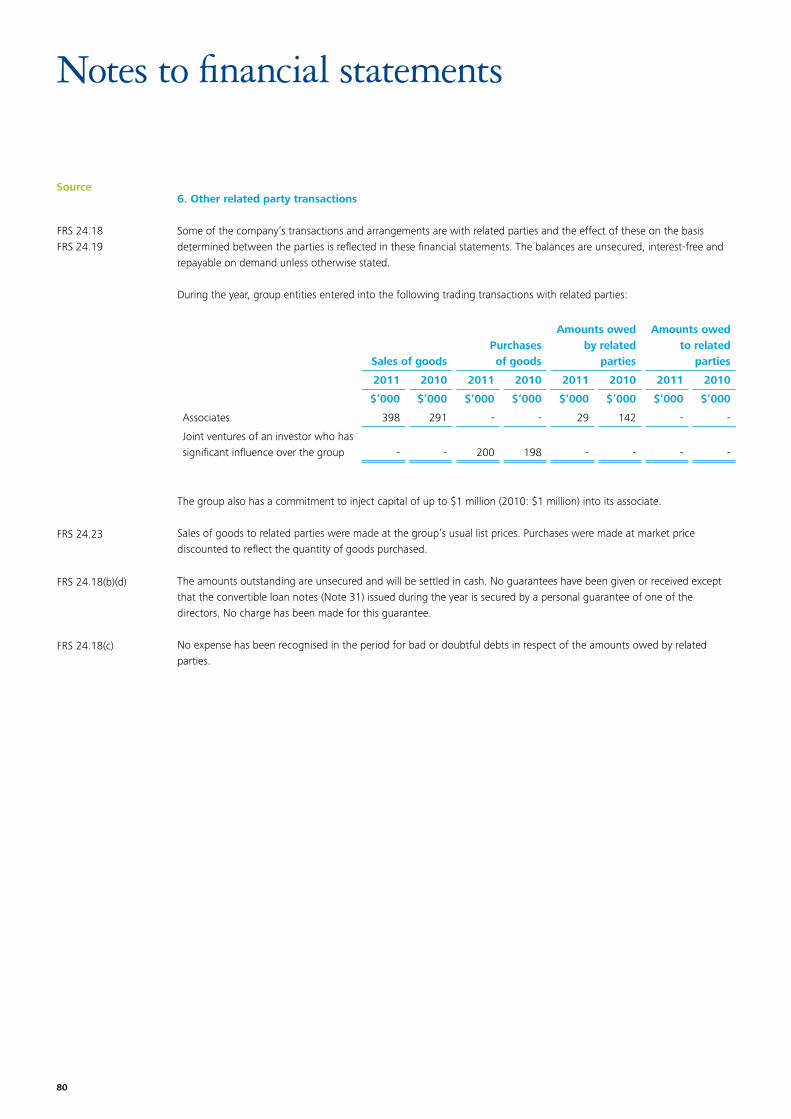
80
Source
Notes to financial statements
FRS 24.18FRS 24.19
FRS 24.23
FRS 24.18(b)(d)
FRS 24.18(c)
6. Other related party transactions
Some of the company’s transactions and arrangements are with related parties and the effect of these on the basis determined between the parties is reflected in these financial statements. The balances are unsecured, interest-free and repayable on demand unless otherwise stated. During the year, group entities entered into the following trading transactions with related parties:
Sales of goodsPurchasesof goods
Amounts owed by related
parties
Amounts owed to related
parties
2011 2010 2011 2010 2011 2010 2011 2010
$’000 $’000 $’000 $’000 $’000 $’000 $’000 $’000
Associates 398 291 - - 29 142 - -
Joint ventures of an investor who has significant influence over the group - - 200 198 - - - -
The group also has a commitment to inject capital of up to $1 million (2010: $1 million) into its associate.
Sales of goods to related parties were made at the group’s usual list prices. Purchases were made at market price discounted to reflect the quantity of goods purchased.
The amounts outstanding are unsecured and will be settled in cash. No guarantees have been given or received except that the convertible loan notes (Note 31) issued during the year is secured by a personal guarantee of one of the directors. No charge has been made for this guarantee.
No expense has been recognised in the period for bad or doubtful debts in respect of the amounts owed by related parties.
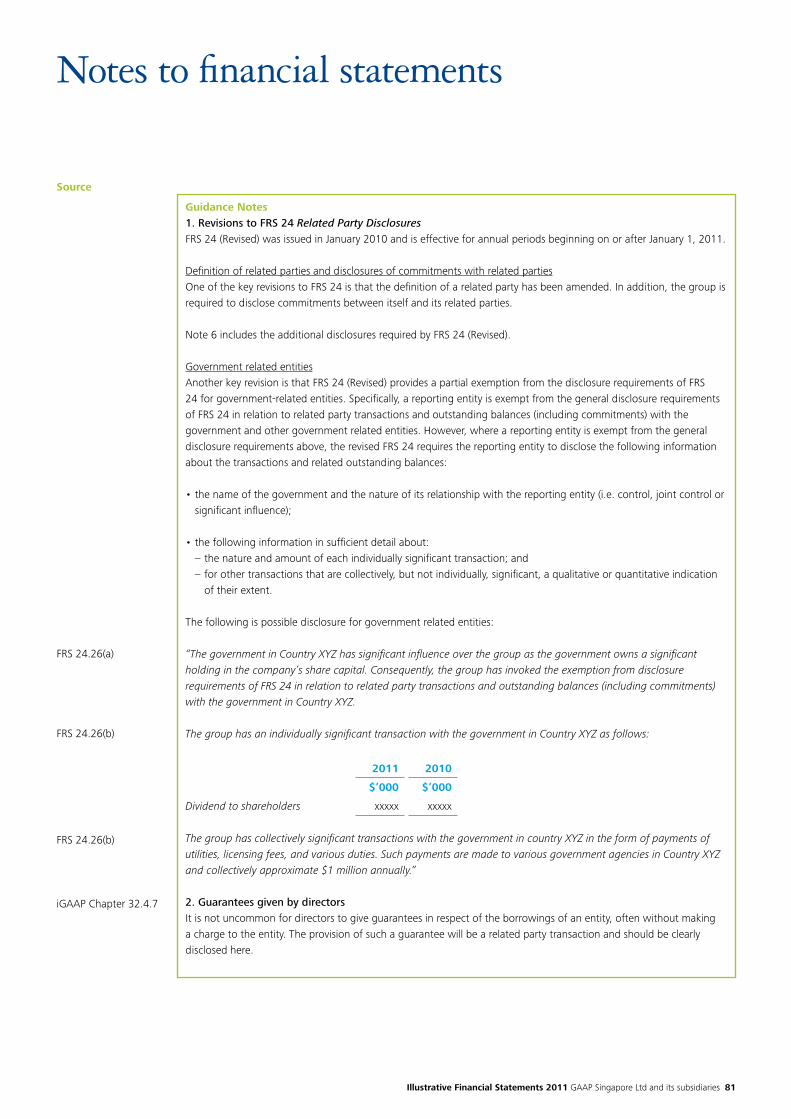
Illustrative Financial Statements 2011 GAAP Singapore Ltd and its subsidiaries 81
Source
Notes to financial statements
Guidance Notes 1. Revisions to FRS 24 Related Party Disclosures FRS 24 (Revised) was issued in January 2010 and is effective for annual periods beginning on or after January 1, 2011.
Definition of related parties and disclosures of commitments with related partiesOne of the key revisions to FRS 24 is that the definition of a related party has been amended. In addition, the group is required to disclose commitments between itself and its related parties.
Note 6 includes the additional disclosures required by FRS 24 (Revised).
Government related entitiesAnother key revision is that FRS 24 (Revised) provides a partial exemption from the disclosure requirements of FRS 24 for government-related entities. Specifically, a reporting entity is exempt from the general disclosure requirements of FRS 24 in relation to related party transactions and outstanding balances (including commitments) with the government and other government related entities. However, where a reporting entity is exempt from the general disclosure requirements above, the revised FRS 24 requires the reporting entity to disclose the following information about the transactions and related outstanding balances:
•thenameofthegovernmentandthenatureofitsrelationshipwiththereportingentity(i.e.control,jointcontrolor significant influence);
•thefollowinginformationinsufficientdetailabout: – the nature and amount of each individually significant transaction; and – for other transactions that are collectively, but not individually, significant, a qualitative or quantitative indication of their extent.
The following is possible disclosure for government related entities:
“The government in Country XYZ has significant influence over the group as the government owns a significant holding in the company’s share capital. Consequently, the group has invoked the exemption from disclosure requirements of FRS 24 in relation to related party transactions and outstanding balances (including commitments) with the government in Country XYZ.
The group has an individually significant transaction with the government in Country XYZ as follows:
2011 2010
$’000 $’000
Dividend to shareholders xxxxx xxxxx
The group has collectively significant transactions with the government in country XYZ in the form of payments of utilities, licensing fees, and various duties. Such payments are made to various government agencies in Country XYZ and collectively approximate $1 million annually.”
2. Guarantees given by directorsIt is not uncommon for directors to give guarantees in respect of the borrowings of an entity, often without making a charge to the entity. The provision of such a guarantee will be a related party transaction and should be clearly disclosed here.
FRS 24.26(a)
FRS 24.26(b)
FRS 24.26(b)
iGAAP Chapter 32.4.7
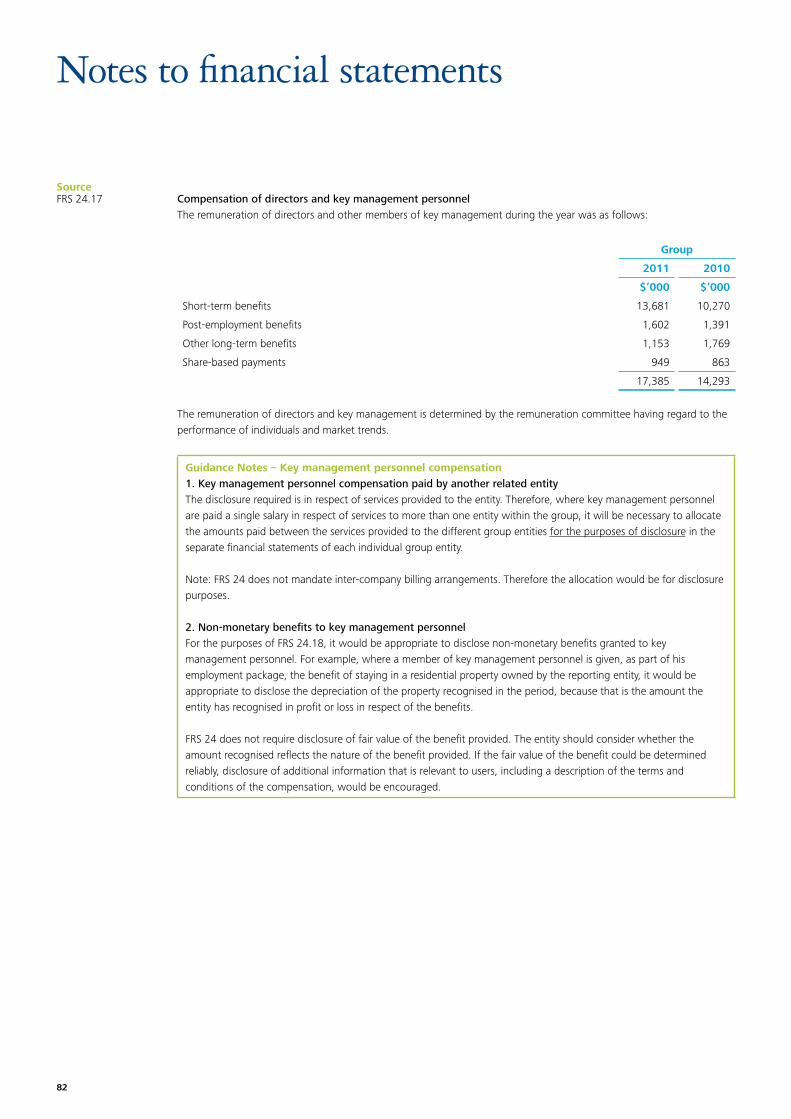
82
Source
Notes to financial statements
Compensation of directors and key management personnelThe remuneration of directors and other members of key management during the year was as follows:
Group
2011 2010
$’000 $’000
Short-term benefits 13,681 10,270
Post-employment benefits 1,602 1,391
Other long-term benefits 1,153 1,769
Share-based payments 949 863
17,385 14,293
The remuneration of directors and key management is determined by the remuneration committee having regard to the performance of individuals and market trends.
Guidance Notes – Key management personnel compensation1. Key management personnel compensation paid by another related entityThe disclosure required is in respect of services provided to the entity. Therefore, where key management personnel are paid a single salary in respect of services to more than one entity within the group, it will be necessary to allocate the amounts paid between the services provided to the different group entities for the purposes of disclosure in the separate financial statements of each individual group entity.
Note: FRS 24 does not mandate inter-company billing arrangements. Therefore the allocation would be for disclosure purposes.
2. Non-monetary benefits to key management personnelFor the purposes of FRS 24.18, it would be appropriate to disclose non-monetary benefits granted to key management personnel. For example, where a member of key management personnel is given, as part of his employment package, the benefit of staying in a residential property owned by the reporting entity, it would be appropriate to disclose the depreciation of the property recognised in the period, because that is the amount the entity has recognised in profit or loss in respect of the benefits.
FRS 24 does not require disclosure of fair value of the benefit provided. The entity should consider whether the amount recognised reflects the nature of the benefit provided. If the fair value of the benefit could be determined reliably, disclosure of additional information that is relevant to users, including a description of the terms and conditions of the compensation, would be encouraged.
FRS 24.17
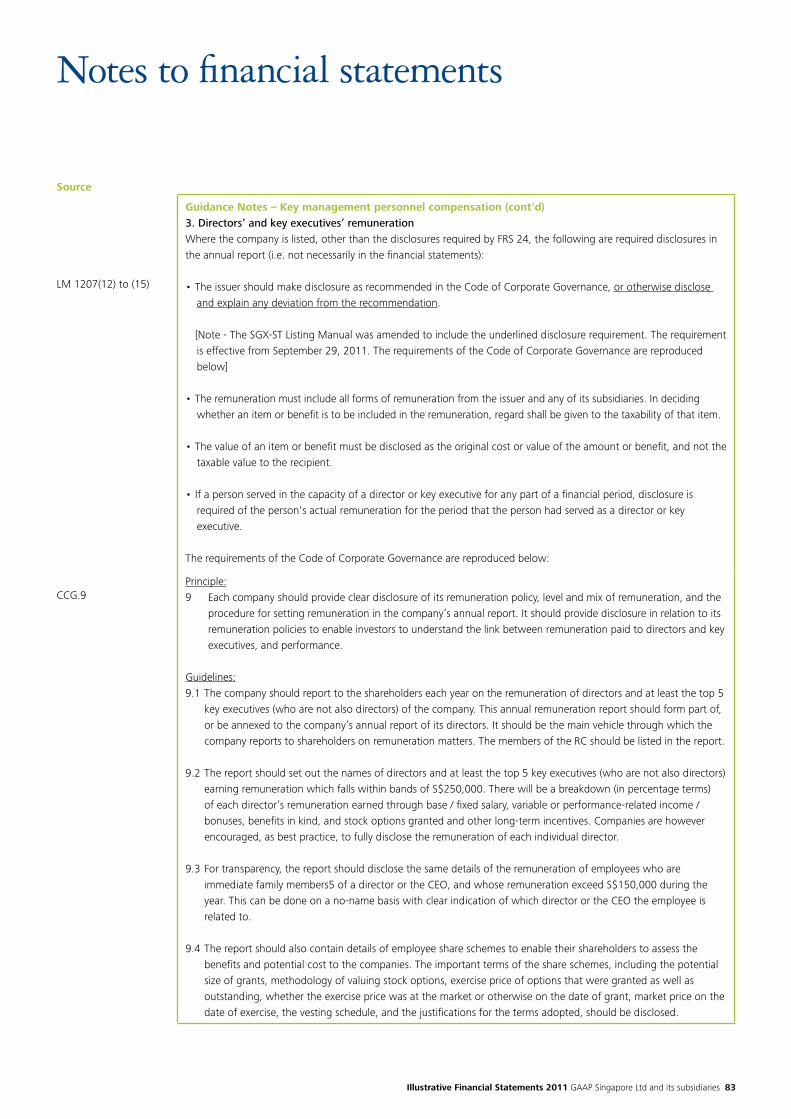
Illustrative Financial Statements 2011 GAAP Singapore Ltd and its subsidiaries 83
Source
Notes to financial statements
Guidance Notes – Key management personnel compensation (cont'd)3. Directors’ and key executives’ remunerationWhere the company is listed, other than the disclosures required by FRS 24, the following are required disclosures in the annual report (i.e. not necessarily in the financial statements):
•TheissuershouldmakedisclosureasrecommendedintheCodeofCorporateGovernance,or otherwise disclose and explain any deviation from the recommendation.
[Note - The SGX-ST Listing Manual was amended to include the underlined disclosure requirement. The requirement is effective from September 29, 2011. The requirements of the Code of Corporate Governance are reproduced below]
•Theremunerationmustincludeallformsofremunerationfromtheissuerandanyofitssubsidiaries.Indecidingwhether an item or benefit is to be included in the remuneration, regard shall be given to the taxability of that item.
•Thevalueofanitemorbenefitmustbedisclosedastheoriginalcostorvalueoftheamountorbenefit,andnotthetaxable value to the recipient.
•Ifapersonservedinthecapacityofadirectororkeyexecutiveforanypartofafinancialperiod,disclosureisrequired of the person's actual remuneration for the period that the person had served as a director or key executive.
The requirements of the Code of Corporate Governance are reproduced below:
Principle:9 Each company should provide clear disclosure of its remuneration policy, level and mix of remuneration, and the
procedure for setting remuneration in the company’s annual report. It should provide disclosure in relation to its remuneration policies to enable investors to understand the link between remuneration paid to directors and key executives, and performance.
Guidelines:9.1 The company should report to the shareholders each year on the remuneration of directors and at least the top 5
key executives (who are not also directors) of the company. This annual remuneration report should form part of, or be annexed to the company’s annual report of its directors. It should be the main vehicle through which the company reports to shareholders on remuneration matters. The members of the RC should be listed in the report.
9.2 The report should set out the names of directors and at least the top 5 key executives (who are not also directors) earning remuneration which falls within bands of S$250,000. There will be a breakdown (in percentage terms) of each director’s remuneration earned through base / fixed salary, variable or performance-related income / bonuses, benefits in kind, and stock options granted and other long-term incentives. Companies are however encouraged, as best practice, to fully disclose the remuneration of each individual director.
9.3 For transparency, the report should disclose the same details of the remuneration of employees who are immediate family members5 of a director or the CEO, and whose remuneration exceed S$150,000 during the year. This can be done on a no-name basis with clear indication of which director or the CEO the employee is related to.
9.4 The report should also contain details of employee share schemes to enable their shareholders to assess the benefits and potential cost to the companies. The important terms of the share schemes, including the potential size of grants, methodology of valuing stock options, exercise price of options that were granted as well as outstanding, whether the exercise price was at the market or otherwise on the date of grant, market price on the date of exercise, the vesting schedule, and the justifications for the terms adopted, should be disclosed.
LM 1207(12) to (15)
CCG.9
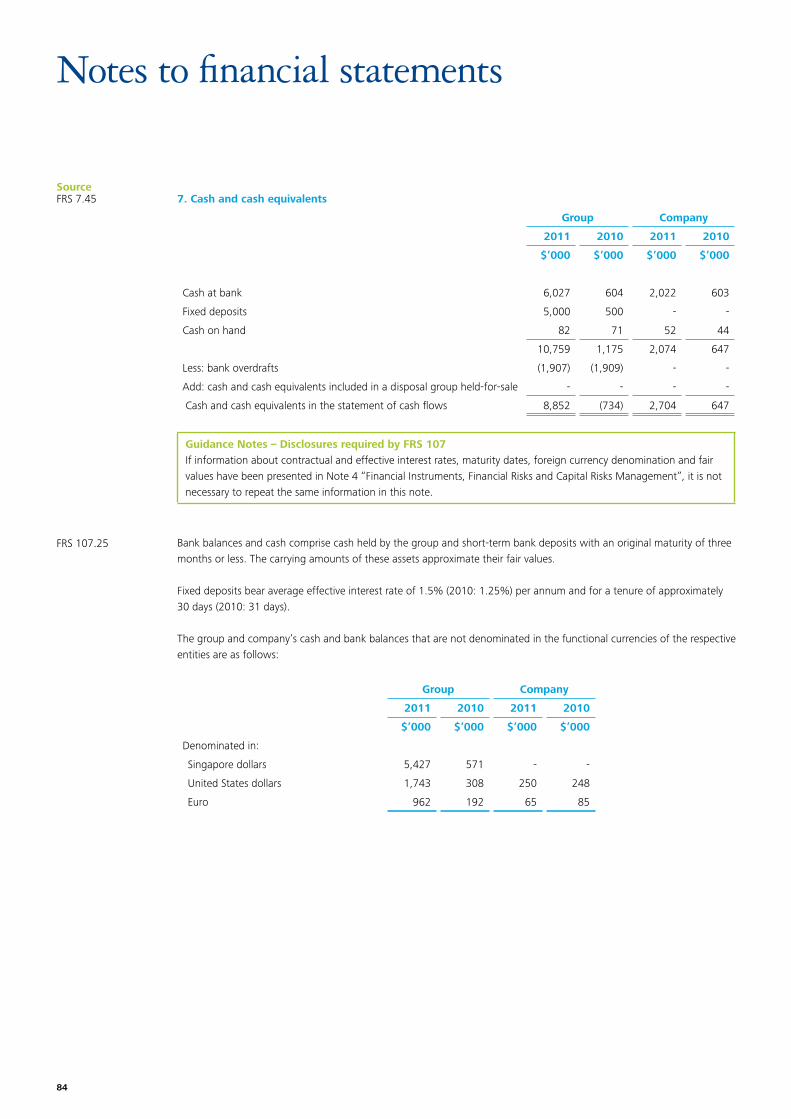
84
Source
Notes to financial statements
7. Cash and cash equivalents
Group Company
2011 2010 2011 2010
$’000 $’000 $’000 $’000
Cash at bank 6,027 604 2,022 603
Fixed deposits 5,000 500 - -
Cash on hand 82 71 52 44
10,759 1,175 2,074 647
Less: bank overdrafts (1,907) (1,909) - -
Add: cash and cash equivalents included in a disposal group held-for-sale - - - -
Cash and cash equivalents in the statement of cash flows 8,852 (734) 2,704 647
Guidance Notes – Disclosures required by FRS 107If information about contractual and effective interest rates, maturity dates, foreign currency denomination and fair values have been presented in Note 4 “Financial Instruments, Financial Risks and Capital Risks Management”, it is not necessary to repeat the same information in this note.
Bank balances and cash comprise cash held by the group and short-term bank deposits with an original maturity of three months or less. The carrying amounts of these assets approximate their fair values.
Fixed deposits bear average effective interest rate of 1.5% (2010: 1.25%) per annum and for a tenure of approximately 30 days (2010: 31 days).
The group and company’s cash and bank balances that are not denominated in the functional currencies of the respective entities are as follows:
Group Company
2011 2010 2011 2010
$’000 $’000 $’000 $’000
Denominated in:
Singapore dollars 5,427 571 - -
United States dollars 1,743 308 250 248
Euro 962 192 65 85
FRS 7.45
FRS 107.25
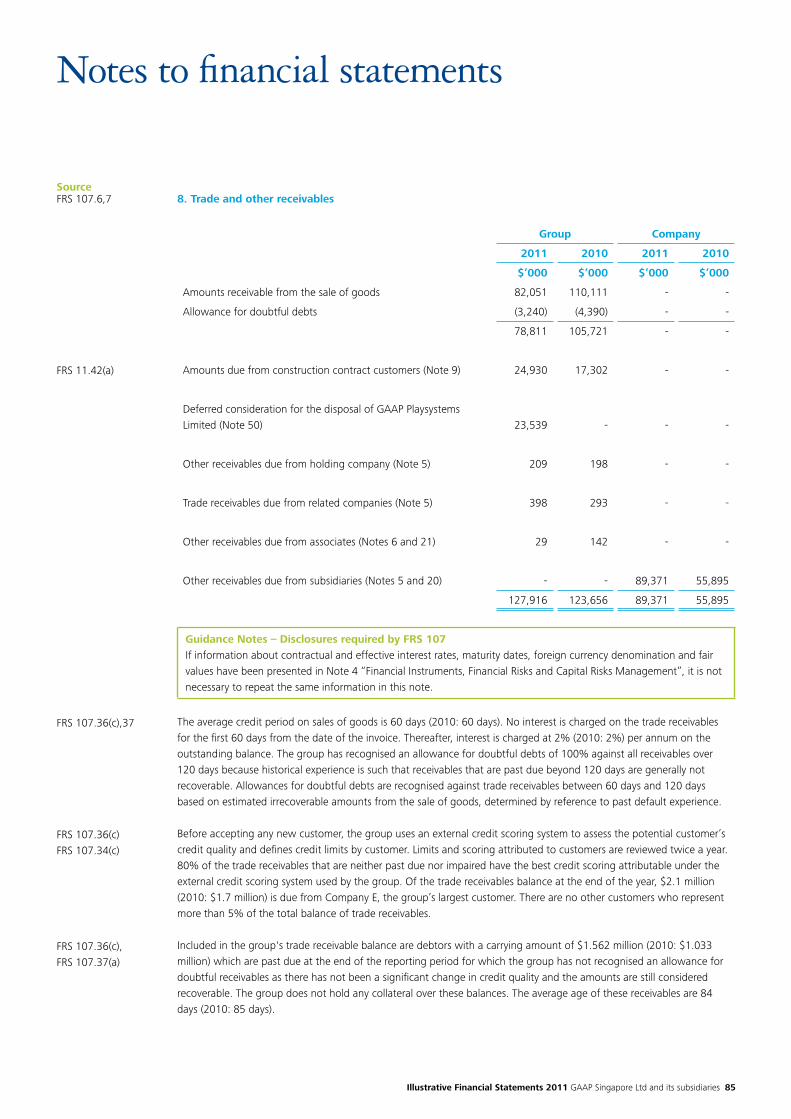
Illustrative Financial Statements 2011 GAAP Singapore Ltd and its subsidiaries 85
Source
Notes to financial statements
FRS 107.6,7
FRS 11.42(a)
FRS 107.36(c),37
FRS 107.36(c)FRS 107.34(c)
FRS 107.36(c),FRS 107.37(a)
8. Trade and other receivables
Group Company
2011 2010 2011 2010
$’000 $’000 $’000 $’000
Amounts receivable from the sale of goods 82,051 110,111 - -
Allowance for doubtful debts (3,240) (4,390) - -
78,811 105,721 - -
Amounts due from construction contract customers (Note 9) 24,930 17,302 - -
Deferred consideration for the disposal of GAAP Playsystems Limited (Note 50) 23,539 - - -
Other receivables due from holding company (Note 5) 209 198 - -
Trade receivables due from related companies (Note 5) 398 293 - -
Other receivables due from associates (Notes 6 and 21) 29 142 - -
Other receivables due from subsidiaries (Notes 5 and 20) - - 89,371 55,895
127,916 123,656 89,371 55,895
Guidance Notes – Disclosures required by FRS 107If information about contractual and effective interest rates, maturity dates, foreign currency denomination and fair values have been presented in Note 4 “Financial Instruments, Financial Risks and Capital Risks Management”, it is not necessary to repeat the same information in this note.
The average credit period on sales of goods is 60 days (2010: 60 days). No interest is charged on the trade receivables for the first 60 days from the date of the invoice. Thereafter, interest is charged at 2% (2010: 2%) per annum on the outstanding balance. The group has recognised an allowance for doubtful debts of 100% against all receivables over 120 days because historical experience is such that receivables that are past due beyond 120 days are generally not recoverable. Allowances for doubtful debts are recognised against trade receivables between 60 days and 120 days based on estimated irrecoverable amounts from the sale of goods, determined by reference to past default experience.
Before accepting any new customer, the group uses an external credit scoring system to assess the potential customer’s credit quality and defines credit limits by customer. Limits and scoring attributed to customers are reviewed twice a year. 80% of the trade receivables that are neither past due nor impaired have the best credit scoring attributable under the external credit scoring system used by the group. Of the trade receivables balance at the end of the year, $2.1 million (2010: $1.7 million) is due from Company E, the group’s largest customer. There are no other customers who represent more than 5% of the total balance of trade receivables.
Included in the group's trade receivable balance are debtors with a carrying amount of $1.562 million (2010: $1.033 million) which are past due at the end of the reporting period for which the group has not recognised an allowance for doubtful receivables as there has not been a significant change in credit quality and the amounts are still considered recoverable. The group does not hold any collateral over these balances. The average age of these receivables are 84 days (2010: 85 days).
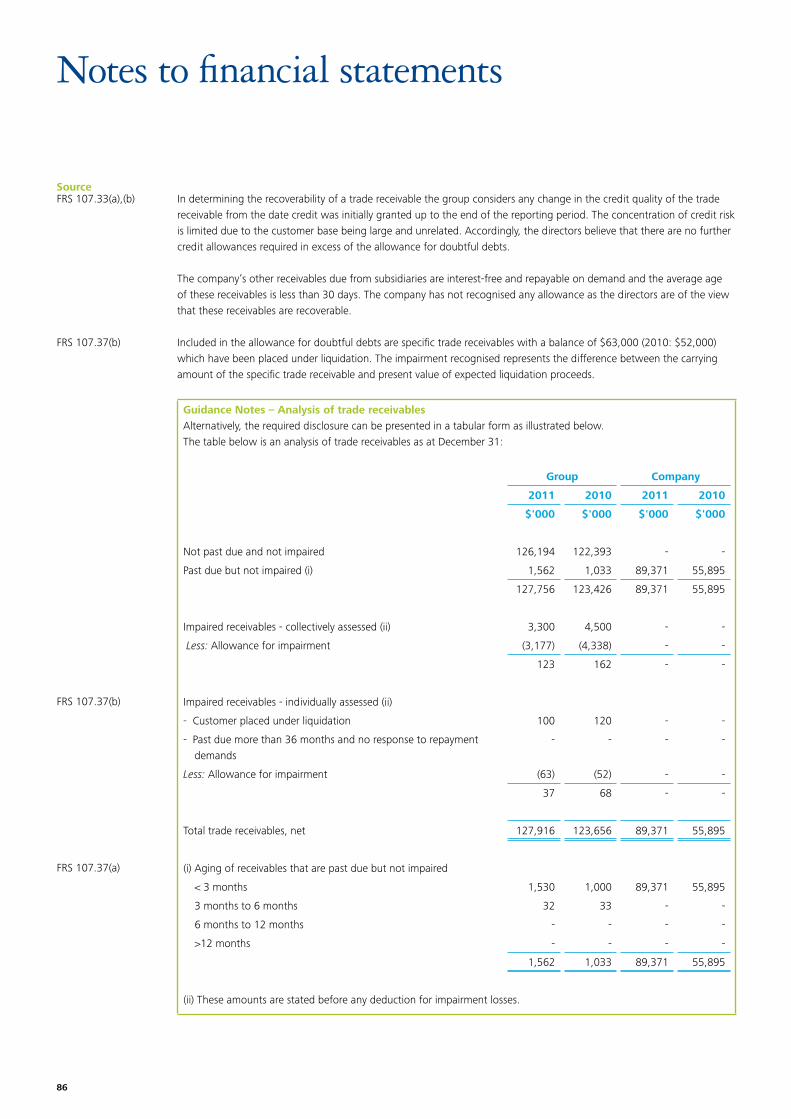
86
Source
Notes to financial statements
In determining the recoverability of a trade receivable the group considers any change in the credit quality of the trade receivable from the date credit was initially granted up to the end of the reporting period. The concentration of credit risk is limited due to the customer base being large and unrelated. Accordingly, the directors believe that there are no further credit allowances required in excess of the allowance for doubtful debts.
The company’s other receivables due from subsidiaries are interest-free and repayable on demand and the average age of these receivables is less than 30 days. The company has not recognised any allowance as the directors are of the view that these receivables are recoverable.
Included in the allowance for doubtful debts are specific trade receivables with a balance of $63,000 (2010: $52,000) which have been placed under liquidation. The impairment recognised represents the difference between the carrying amount of the specific trade receivable and present value of expected liquidation proceeds.
Guidance Notes – Analysis of trade receivablesAlternatively, the required disclosure can be presented in a tabular form as illustrated below.The table below is an analysis of trade receivables as at December 31:
Group Company
2011 2010 2011 2010
$'000 $'000 $'000 $'000
Not past due and not impaired 126,194 122,393 - -
Past due but not impaired (i) 1,562 1,033 89,371 55,895
127,756 123,426 89,371 55,895
Impaired receivables - collectively assessed (ii) 3,300 4,500 - -
Less: Allowance for impairment (3,177) (4,338) - -
123 162 - -
Impaired receivables - individually assessed (ii)
- Customer placed under liquidation 100 120 - -
- Past due more than 36 months and no response to repayment demands
- - - -
Less: Allowance for impairment (63) (52) - -
37 68 - -
Total trade receivables, net 127,916 123,656 89,371 55,895
(i) Aging of receivables that are past due but not impaired
< 3 months 1,530 1,000 89,371 55,895
3 months to 6 months 32 33 - -
6 months to 12 months - - - -
>12 months - - - -
1,562 1,033 89,371 55,895
(ii) These amounts are stated before any deduction for impairment losses.
FRS 107.33(a),(b)
FRS 107.37(b)
FRS 107.37(b)
FRS 107.37(a)
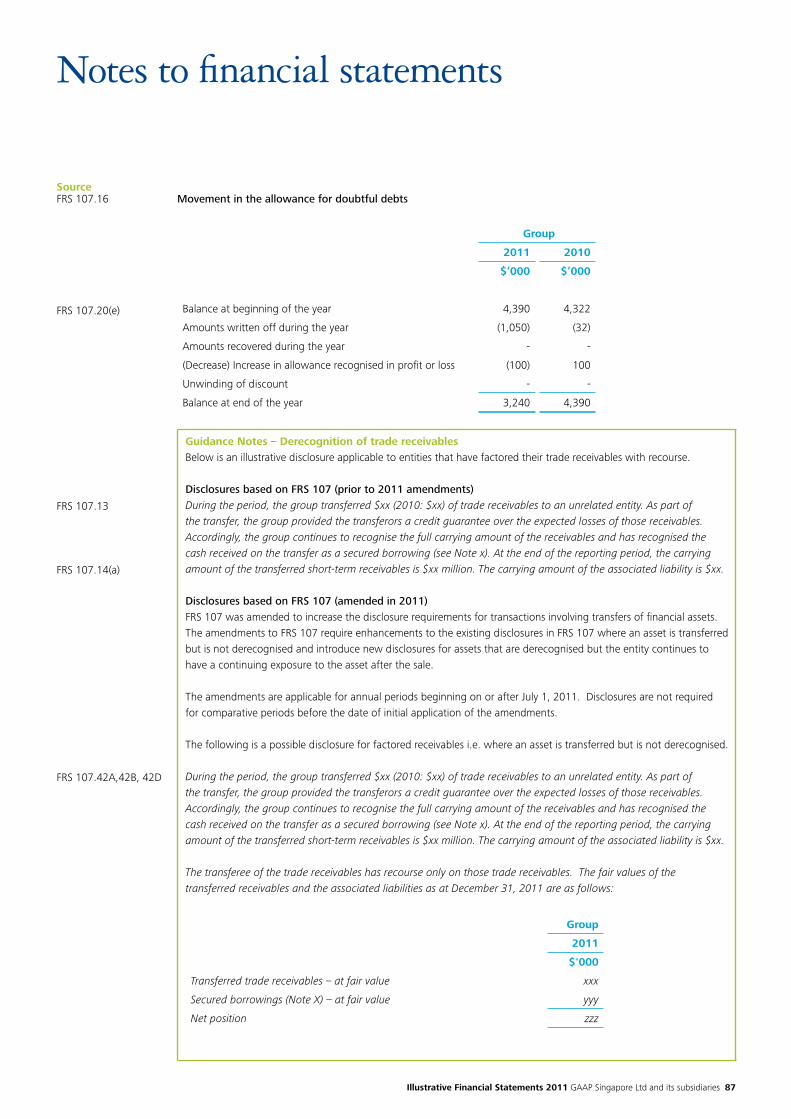
Illustrative Financial Statements 2011 GAAP Singapore Ltd and its subsidiaries 87
Source
Notes to financial statements
Movement in the allowance for doubtful debts
Group
2011 2010
$’000 $’000
Balance at beginning of the year 4,390 4,322
Amounts written off during the year (1,050) (32)
Amounts recovered during the year - -
(Decrease) Increase in allowance recognised in profit or loss (100) 100
Unwinding of discount - -
Balance at end of the year 3,240 4,390
Guidance Notes – Derecognition of trade receivablesBelow is an illustrative disclosure applicable to entities that have factored their trade receivables with recourse.
Disclosures based on FRS 107 (prior to 2011 amendments) During the period, the group transferred $xx (2010: $xx) of trade receivables to an unrelated entity. As part of the transfer, the group provided the transferors a credit guarantee over the expected losses of those receivables. Accordingly, the group continues to recognise the full carrying amount of the receivables and has recognised the cash received on the transfer as a secured borrowing (see Note x). At the end of the reporting period, the carrying amount of the transferred short-term receivables is $xx million. The carrying amount of the associated liability is $xx.
Disclosures based on FRS 107 (amended in 2011) FRS 107 was amended to increase the disclosure requirements for transactions involving transfers of financial assets. The amendments to FRS 107 require enhancements to the existing disclosures in FRS 107 where an asset is transferred but is not derecognised and introduce new disclosures for assets that are derecognised but the entity continues to have a continuing exposure to the asset after the sale.
The amendments are applicable for annual periods beginning on or after July 1, 2011. Disclosures are not required for comparative periods before the date of initial application of the amendments.
The following is a possible disclosure for factored receivables i.e. where an asset is transferred but is not derecognised.
During the period, the group transferred $xx (2010: $xx) of trade receivables to an unrelated entity. As part of the transfer, the group provided the transferors a credit guarantee over the expected losses of those receivables. Accordingly, the group continues to recognise the full carrying amount of the receivables and has recognised the cash received on the transfer as a secured borrowing (see Note x). At the end of the reporting period, the carrying amount of the transferred short-term receivables is $xx million. The carrying amount of the associated liability is $xx.
The transferee of the trade receivables has recourse only on those trade receivables. The fair values of the transferred receivables and the associated liabilities as at December 31, 2011 are as follows:
Group
2011
$'000
Transferred trade receivables – at fair value xxx
Secured borrowings (Note X) – at fair value yyy
Net position zzz
FRS 107.16
FRS 107.20(e)
FRS 107.13
FRS 107.14(a)
FRS 107.42A,42B, 42D
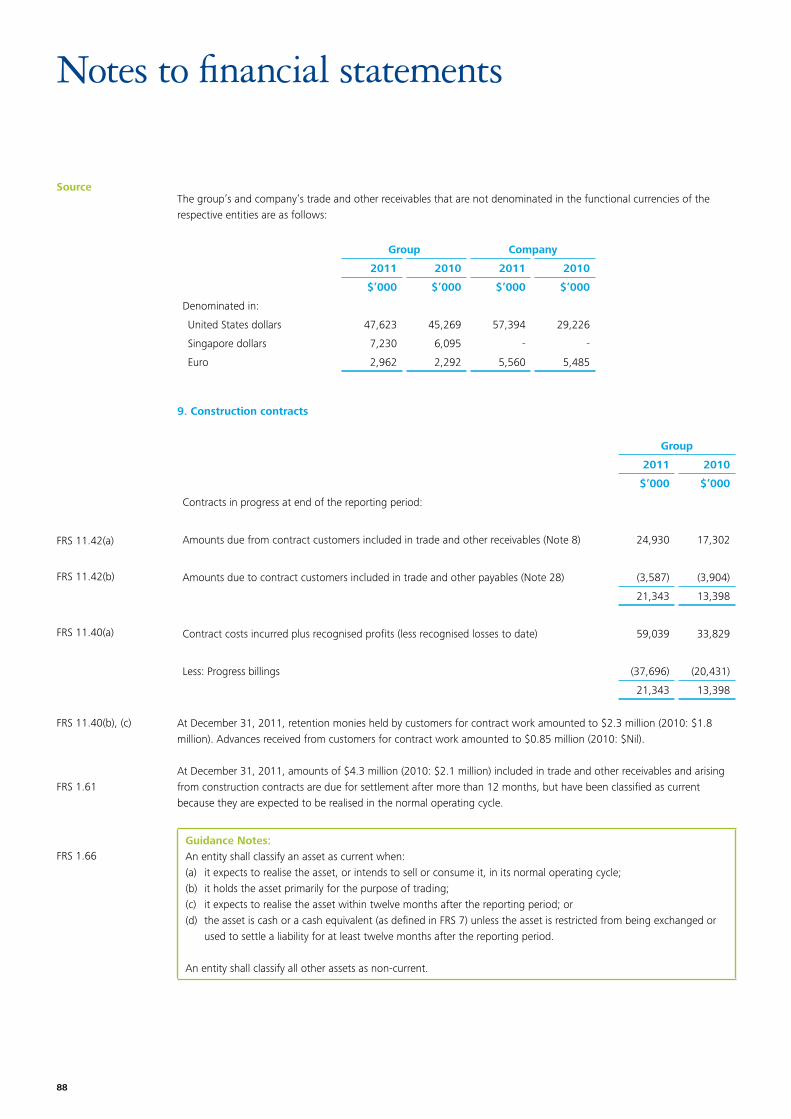
88
Source
Notes to financial statements
The group’s and company’s trade and other receivables that are not denominated in the functional currencies of the respective entities are as follows:
Group Company
2011 2010 2011 2010
$’000 $’000 $’000 $’000
Denominated in:
United States dollars 47,623 45,269 57,394 29,226
Singapore dollars 7,230 6,095 - -
Euro 2,962 2,292 5,560 5,485
9. Construction contracts
Group
2011 2010
$’000 $’000
Contracts in progress at end of the reporting period:
Amounts due from contract customers included in trade and other receivables (Note 8) 24,930 17,302
Amounts due to contract customers included in trade and other payables (Note 28) (3,587) (3,904)
21,343 13,398
Contract costs incurred plus recognised profits (less recognised losses to date) 59,039 33,829
Less: Progress billings (37,696) (20,431)
21,343 13,398
At December 31, 2011, retention monies held by customers for contract work amounted to $2.3 million (2010: $1.8 million). Advances received from customers for contract work amounted to $0.85 million (2010: $Nil).
At December 31, 2011, amounts of $4.3 million (2010: $2.1 million) included in trade and other receivables and arising from construction contracts are due for settlement after more than 12 months, but have been classified as current because they are expected to be realised in the normal operating cycle.
Guidance Notes:An entity shall classify an asset as current when: (a) it expects to realise the asset, or intends to sell or consume it, in its normal operating cycle; (b) it holds the asset primarily for the purpose of trading; (c) it expects to realise the asset within twelve months after the reporting period; or (d) the asset is cash or a cash equivalent (as defined in FRS 7) unless the asset is restricted from being exchanged or
used to settle a liability for at least twelve months after the reporting period.
An entity shall classify all other assets as non-current.
FRS 11.42(a)
FRS 11.42(b)
FRS 11.40(a)
FRS 11.40(b), (c)
FRS 1.61
FRS 1.66
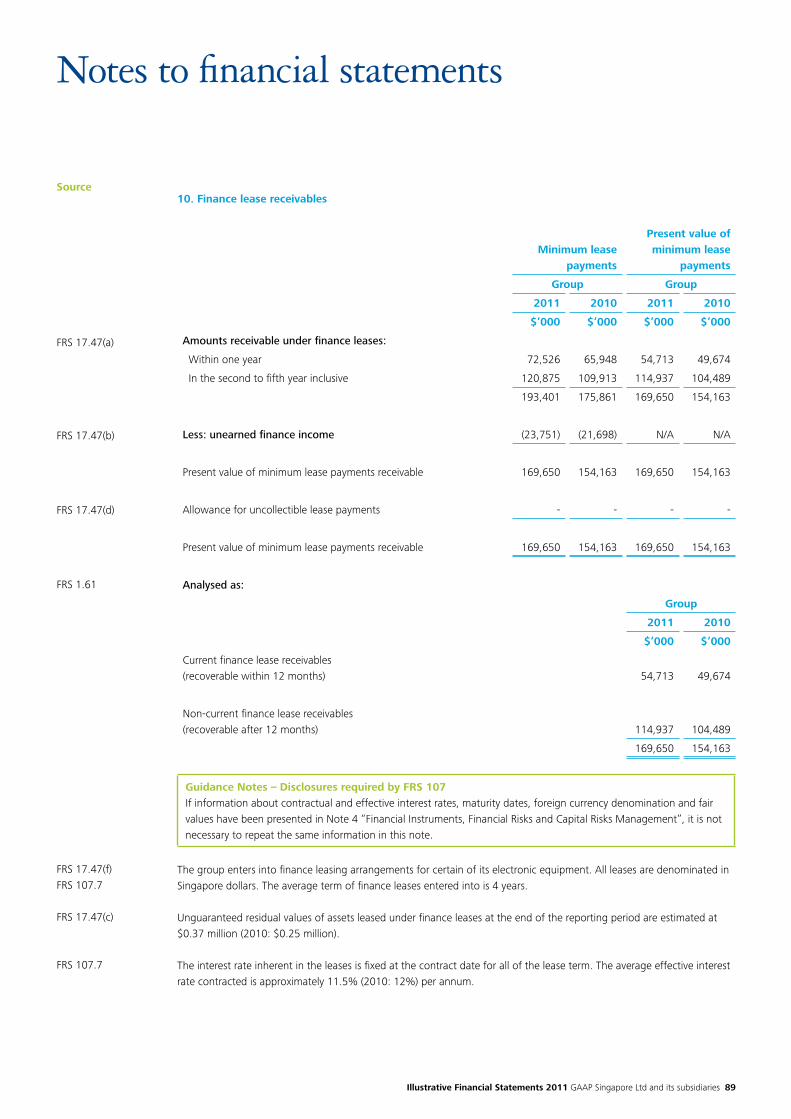
Illustrative Financial Statements 2011 GAAP Singapore Ltd and its subsidiaries 89
Source
Notes to financial statements
FRS 17.47(a)
FRS 17.47(b)
FRS 17.47(d)
FRS 1.61
FRS 17.47(f)FRS 107.7
FRS 17.47(c)
FRS 107.7
10. Finance lease receivables
Minimum lease payments
Present value of minimum lease
payments
Group Group
2011 2010 2011 2010
$’000 $’000 $’000 $’000
Amounts receivable under finance leases:
Within one year 72,526 65,948 54,713 49,674
In the second to fifth year inclusive 120,875 109,913 114,937 104,489
193,401 175,861 169,650 154,163
Less: unearned finance income (23,751) (21,698) N/A N/A
Present value of minimum lease payments receivable 169,650 154,163 169,650 154,163
Allowance for uncollectible lease payments - - - -
Present value of minimum lease payments receivable 169,650 154,163 169,650 154,163
Analysed as:
Group
2011 2010
$’000 $’000
Current finance lease receivables(recoverable within 12 months) 54,713 49,674
Non-current finance lease receivables(recoverable after 12 months) 114,937 104,489
169,650 154,163
Guidance Notes – Disclosures required by FRS 107If information about contractual and effective interest rates, maturity dates, foreign currency denomination and fair values have been presented in Note 4 “Financial Instruments, Financial Risks and Capital Risks Management”, it is not necessary to repeat the same information in this note.
The group enters into finance leasing arrangements for certain of its electronic equipment. All leases are denominated in Singapore dollars. The average term of finance leases entered into is 4 years.
Unguaranteed residual values of assets leased under finance leases at the end of the reporting period are estimated at $0.37 million (2010: $0.25 million).
The interest rate inherent in the leases is fixed at the contract date for all of the lease term. The average effective interest rate contracted is approximately 11.5% (2010: 12%) per annum.
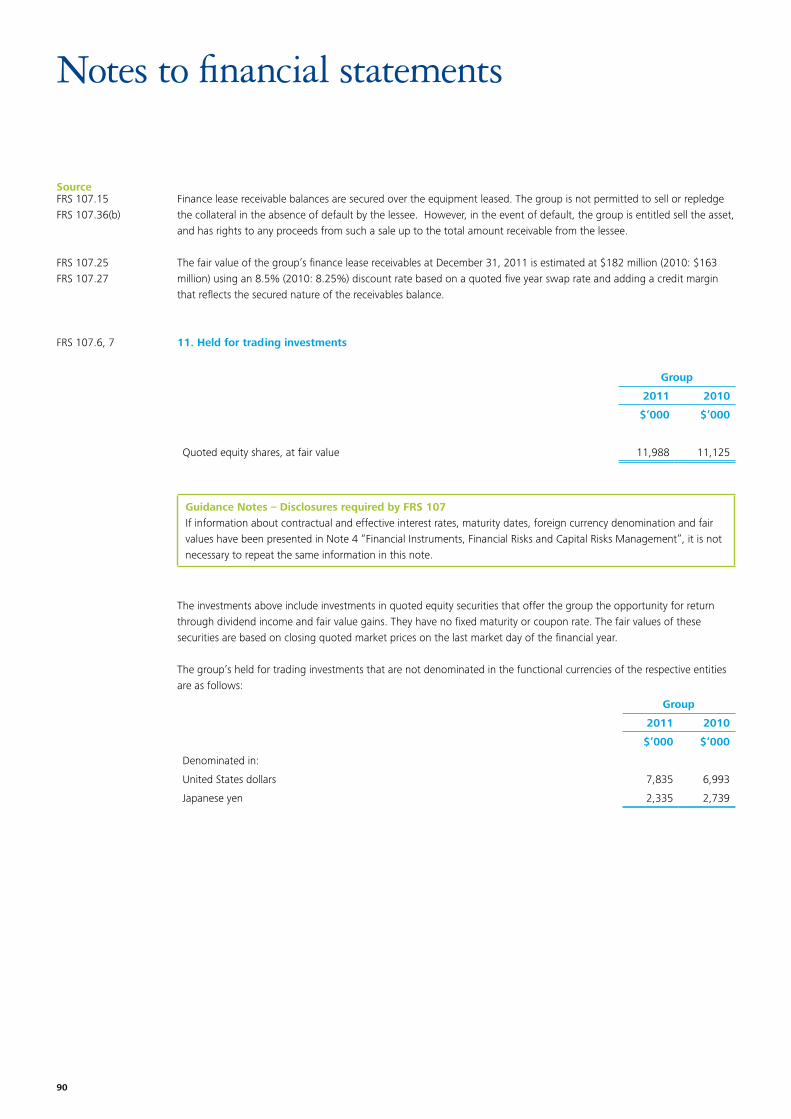
90
Source
Notes to financial statements
Finance lease receivable balances are secured over the equipment leased. The group is not permitted to sell or repledge the collateral in the absence of default by the lessee. However, in the event of default, the group is entitled sell the asset, and has rights to any proceeds from such a sale up to the total amount receivable from the lessee.
The fair value of the group’s finance lease receivables at December 31, 2011 is estimated at $182 million (2010: $163 million) using an 8.5% (2010: 8.25%) discount rate based on a quoted five year swap rate and adding a credit margin that reflects the secured nature of the receivables balance.
11. Held for trading investments
Group
2011 2010
$’000 $’000
Quoted equity shares, at fair value 11,988 11,125
Guidance Notes – Disclosures required by FRS 107If information about contractual and effective interest rates, maturity dates, foreign currency denomination and fair values have been presented in Note 4 “Financial Instruments, Financial Risks and Capital Risks Management”, it is not necessary to repeat the same information in this note.
The investments above include investments in quoted equity securities that offer the group the opportunity for return through dividend income and fair value gains. They have no fixed maturity or coupon rate. The fair values of these securities are based on closing quoted market prices on the last market day of the financial year.
The group’s held for trading investments that are not denominated in the functional currencies of the respective entities are as follows:
Group
2011 2010
$’000 $’000
Denominated in:
United States dollars 7,835 6,993
Japanese yen 2,335 2,739
FRS 107.15FRS 107.36(b)
FRS 107.25FRS 107.27
FRS 107.6, 7
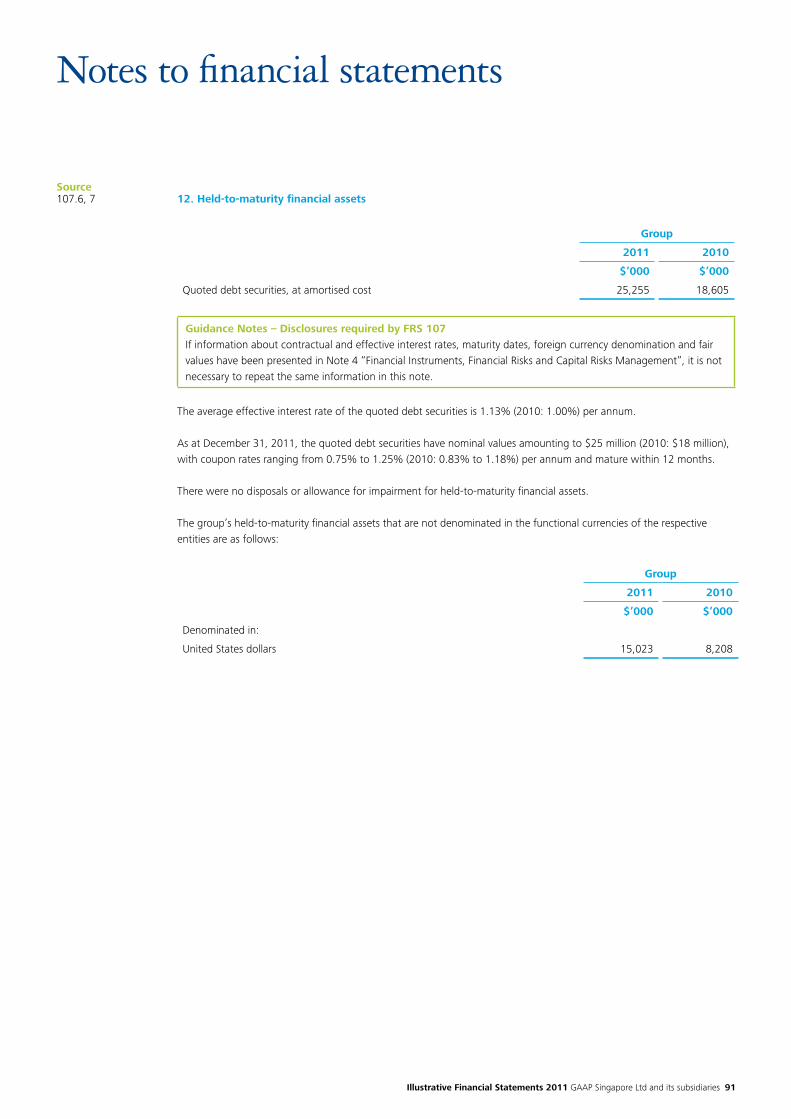
Illustrative Financial Statements 2011 GAAP Singapore Ltd and its subsidiaries 91
Source
Notes to financial statements
12. Held-to-maturity financial assets
Group
2011 2010
$’000 $’000
Quoted debt securities, at amortised cost 25,255 18,605
Guidance Notes – Disclosures required by FRS 107If information about contractual and effective interest rates, maturity dates, foreign currency denomination and fair values have been presented in Note 4 “Financial Instruments, Financial Risks and Capital Risks Management”, it is not necessary to repeat the same information in this note.
The average effective interest rate of the quoted debt securities is 1.13% (2010: 1.00%) per annum.
As at December 31, 2011, the quoted debt securities have nominal values amounting to $25 million (2010: $18 million), with coupon rates ranging from 0.75% to 1.25% (2010: 0.83% to 1.18%) per annum and mature within 12 months.
There were no disposals or allowance for impairment for held-to-maturity financial assets.
The group’s held-to-maturity financial assets that are not denominated in the functional currencies of the respective entities are as follows:
Group
2011 2010
$’000 $’000
Denominated in:
United States dollars 15,023 8,208
107.6, 7

92
Source
Notes to financial statements
13. Derivative financial instruments
Group
2011 2010
Assets Liabilities Assets Liabilities
$’000 $’000 $’000 $’000
Forward foreign exchange contracts 1,124 (273) 2,938 -
Interest rate swaps 3,914 - - -
5,038 (273) 2,938 -
Analysed as:
Current 2,436 (273) 2,938 -
Non-current 2,602 - - -
5,038 (273) 2,938 -
Guidance Notes – Disclosures required by FRS 107If information about contractual and effective interest rates, maturity dates, foreign currency denomination and fair values have been presented in Note 4 “Financial Instruments, Financial Risks and Capital Risks Management”, it is not necessary to repeat the same information in this note.
Forward foreign exchange contractsThe group utilises currency derivatives to hedge significant future transactions and cash flows. The group is party to a variety of forward foreign exchange contracts and options in the management of its exchange rate exposures. The instruments purchased are primarily denominated in the currencies of the group’s principal markets.
At the end of the reporting period, the total notional amount of outstanding forward foreign exchange contracts to which the group is committed are as follows:
Group
2011 2010
$’000 $’000
Forward foreign exchange contracts 547,040 403,573
In addition, the group had options to purchase United States dollars equivalent to an amount of approximately $50 million (2010: $50 million) as a hedge against exchange losses on future purchases of goods.
These arrangements are designed to address significant exchange exposures during the first half of 2011, and are renewed on a revolving basis as required.
At December 31, 2011, the fair value of the group’s currency derivatives is estimated to be approximately $0.85 million (2010: $2.94 million). The fair values are measured using quoted forward exchange rates and yield curves derived from quoted interest rates matching maturity of the contracts, comprising $1.12 million assets (2010: $2.94 million) and $0.27 million liabilities (2010: $Nil).
The fair value of currency derivatives that are designated and effective as cash flow hedges amounting to $1.01 million (2010: $2.9 million) has been recognised in other comprehensive income. Amounts of $7,000 (2010: $3,000) and $5,000 (2010: $4,000) respectively have been reclassified from equity to profit or loss and inventories in respect of contracts matured respectively during the year.
Changes in the fair value of non-hedging currency derivatives amounting to $5,000 have been charged to profit or loss in the year (2010: $Nil) (Note 43).
FRS 107.6, 7
FRS 107.22(a),(b),(c)
FRS 107.23(a)
FRS 107.25FRS 107.27FRS 107.23(c)
FRS 107.23(d)
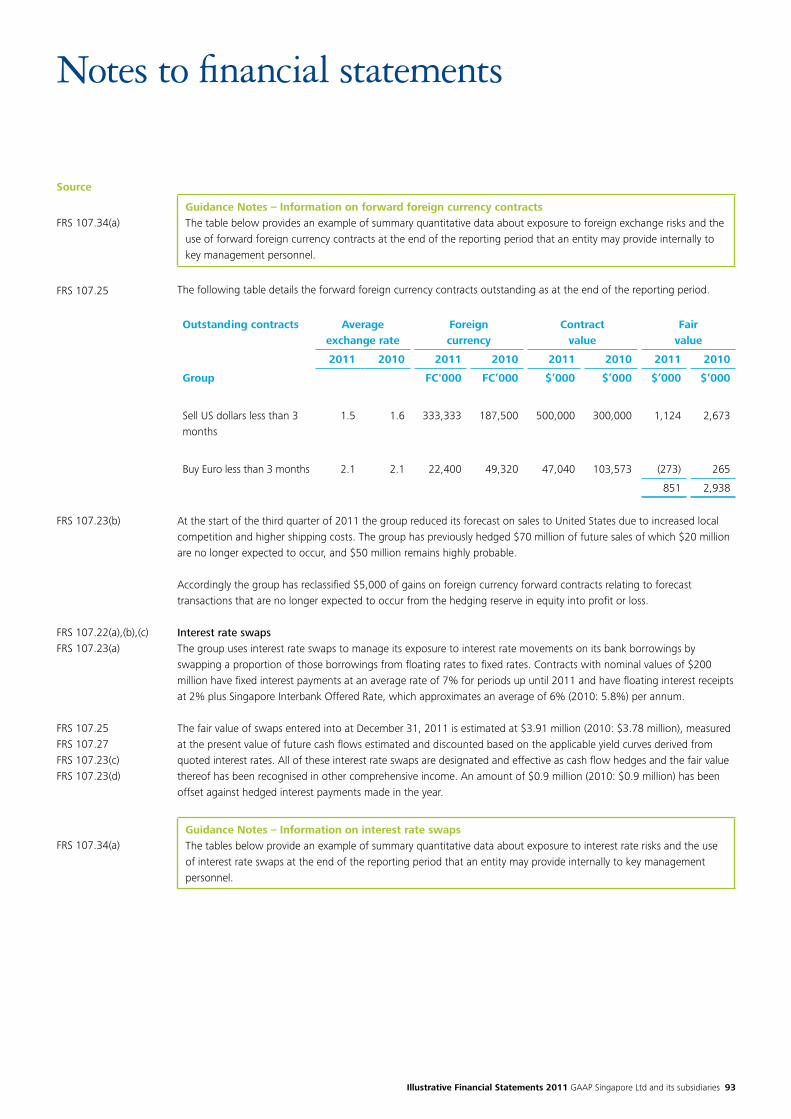
Illustrative Financial Statements 2011 GAAP Singapore Ltd and its subsidiaries 93
Source
Notes to financial statements
Guidance Notes – Information on forward foreign currency contractsThe table below provides an example of summary quantitative data about exposure to foreign exchange risks and the use of forward foreign currency contracts at the end of the reporting period that an entity may provide internally to key management personnel.
The following table details the forward foreign currency contracts outstanding as at the end of the reporting period.
Outstanding contracts Averageexchange rate
Foreigncurrency
Contractvalue
Fairvalue
2011 2010 2011 2010 2011 2010 2011 2010
Group FC'000 FC’000 $’000 $’000 $’000 $’000
Sell US dollars less than 3 months
1.5 1.6 333,333 187,500 500,000 300,000 1,124 2,673
Buy Euro less than 3 months 2.1 2.1 22,400 49,320 47,040 103,573 (273) 265
851 2,938
At the start of the third quarter of 2011 the group reduced its forecast on sales to United States due to increased local competition and higher shipping costs. The group has previously hedged $70 million of future sales of which $20 million are no longer expected to occur, and $50 million remains highly probable.
Accordingly the group has reclassified $5,000 of gains on foreign currency forward contracts relating to forecast transactions that are no longer expected to occur from the hedging reserve in equity into profit or loss.
Interest rate swapsThe group uses interest rate swaps to manage its exposure to interest rate movements on its bank borrowings by swapping a proportion of those borrowings from floating rates to fixed rates. Contracts with nominal values of $200 million have fixed interest payments at an average rate of 7% for periods up until 2011 and have floating interest receipts at 2% plus Singapore Interbank Offered Rate, which approximates an average of 6% (2010: 5.8%) per annum.
The fair value of swaps entered into at December 31, 2011 is estimated at $3.91 million (2010: $3.78 million), measured at the present value of future cash flows estimated and discounted based on the applicable yield curves derived from quoted interest rates. All of these interest rate swaps are designated and effective as cash flow hedges and the fair value thereof has been recognised in other comprehensive income. An amount of $0.9 million (2010: $0.9 million) has been offset against hedged interest payments made in the year.
Guidance Notes – Information on interest rate swapsThe tables below provide an example of summary quantitative data about exposure to interest rate risks and the use of interest rate swaps at the end of the reporting period that an entity may provide internally to key management personnel.
FRS 107.34(a)
FRS 107.25
FRS 107.23(b)
FRS 107.22(a),(b),(c)FRS 107.23(a)
FRS 107.25FRS 107.27FRS 107.23(c)FRS 107.23(d)
FRS 107.34(a)
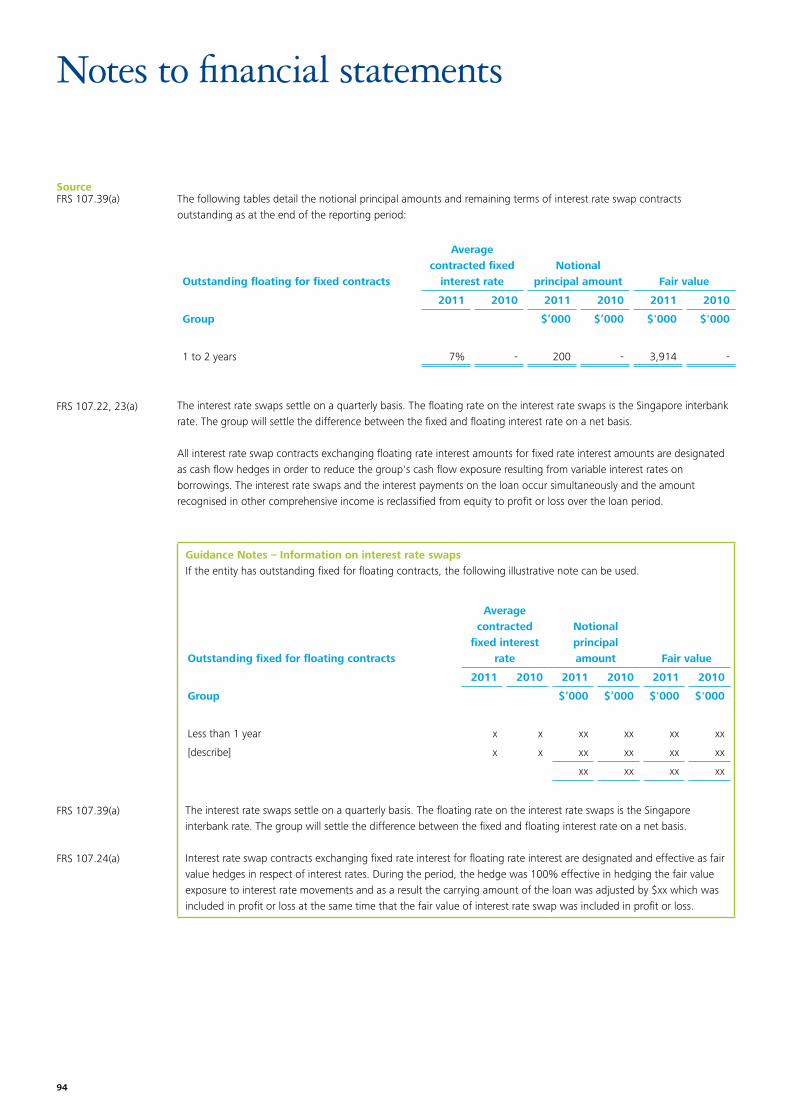
94
Source
Notes to financial statements
The following tables detail the notional principal amounts and remaining terms of interest rate swap contracts outstanding as at the end of the reporting period:
Outstanding floating for fixed contracts
Average contracted fixed
interest rateNotional
principal amount Fair value
2011 2010 2011 2010 2011 2010
Group $’000 $’000 $'000 $'000
1 to 2 years 7% - 200 - 3,914 -
The interest rate swaps settle on a quarterly basis. The floating rate on the interest rate swaps is the Singapore interbank rate. The group will settle the difference between the fixed and floating interest rate on a net basis.
All interest rate swap contracts exchanging floating rate interest amounts for fixed rate interest amounts are designated as cash flow hedges in order to reduce the group's cash flow exposure resulting from variable interest rates on borrowings. The interest rate swaps and the interest payments on the loan occur simultaneously and the amount recognised in other comprehensive income is reclassified from equity to profit or loss over the loan period.
Guidance Notes – Information on interest rate swapsIf the entity has outstanding fixed for floating contracts, the following illustrative note can be used.
Outstanding fixed for floating contracts
Average contracted
fixed interest rate
Notional principal amount Fair value
2011 2010 2011 2010 2011 2010
Group $’000 $’000 $'000 $'000
Less than 1 year x x xx xx xx xx
[describe] x x xx xx xx xx
xx xx xx xx
The interest rate swaps settle on a quarterly basis. The floating rate on the interest rate swaps is the Singapore interbank rate. The group will settle the difference between the fixed and floating interest rate on a net basis.
Interest rate swap contracts exchanging fixed rate interest for floating rate interest are designated and effective as fair value hedges in respect of interest rates. During the period, the hedge was 100% effective in hedging the fair value exposure to interest rate movements and as a result the carrying amount of the loan was adjusted by $xx which was included in profit or loss at the same time that the fair value of interest rate swap was included in profit or loss.
FRS 107.39(a)
FRS 107.22, 23(a)
FRS 107.39(a)
FRS 107.24(a)
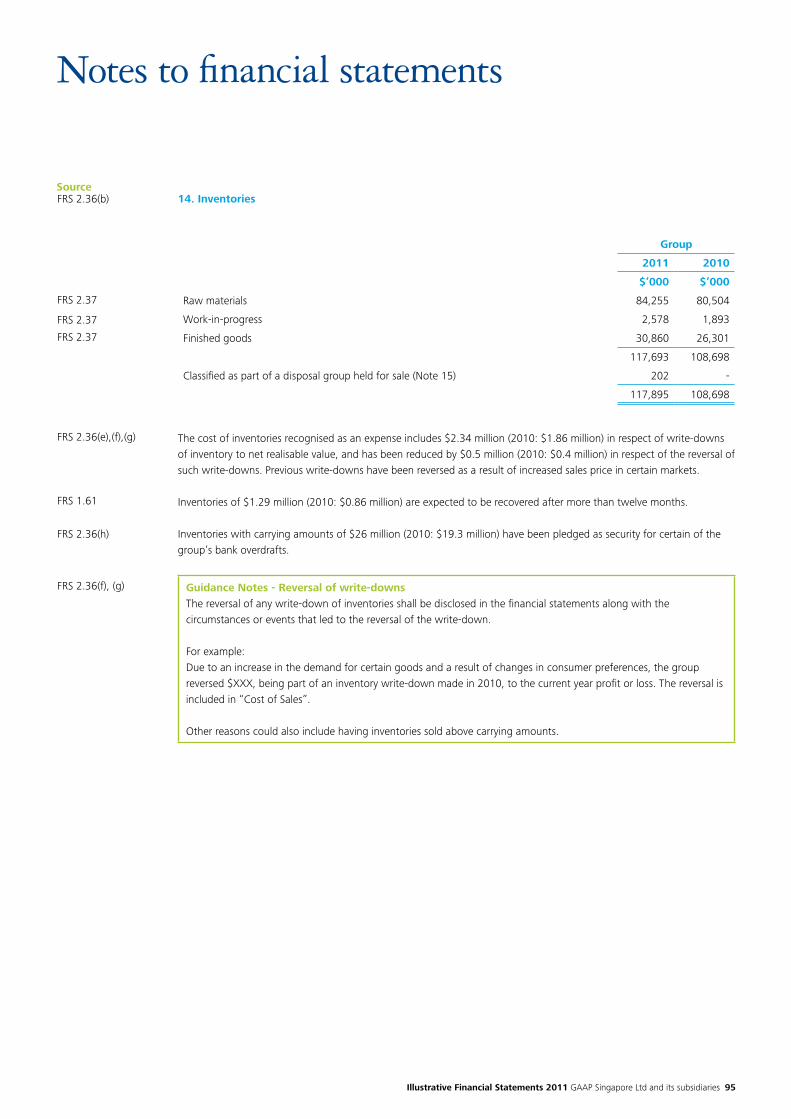
Illustrative Financial Statements 2011 GAAP Singapore Ltd and its subsidiaries 95
Source
Notes to financial statements
FRS 2.36(b)
FRS 2.37
FRS 2.37
FRS 2.37
FRS 2.36(e),(f),(g)
FRS 1.61
FRS 2.36(h)
FRS 2.36(f), (g)
14. Inventories
Group
2011 2010
$’000 $’000
Raw materials 84,255 80,504
Work-in-progress 2,578 1,893
Finished goods 30,860 26,301
117,693 108,698
Classified as part of a disposal group held for sale (Note 15) 202 -
117,895 108,698
The cost of inventories recognised as an expense includes $2.34 million (2010: $1.86 million) in respect of write-downs of inventory to net realisable value, and has been reduced by $0.5 million (2010: $0.4 million) in respect of the reversal of such write-downs. Previous write-downs have been reversed as a result of increased sales price in certain markets.
Inventories of $1.29 million (2010: $0.86 million) are expected to be recovered after more than twelve months.
Inventories with carrying amounts of $26 million (2010: $19.3 million) have been pledged as security for certain of the group’s bank overdrafts.
Guidance Notes - Reversal of write-downsThe reversal of any write-down of inventories shall be disclosed in the financial statements along with the circumstances or events that led to the reversal of the write-down.
For example:Due to an increase in the demand for certain goods and a result of changes in consumer preferences, the group reversed $XXX, being part of an inventory write-down made in 2010, to the current year profit or loss. The reversal is included in “Cost of Sales”.
Other reasons could also include having inventories sold above carrying amounts.
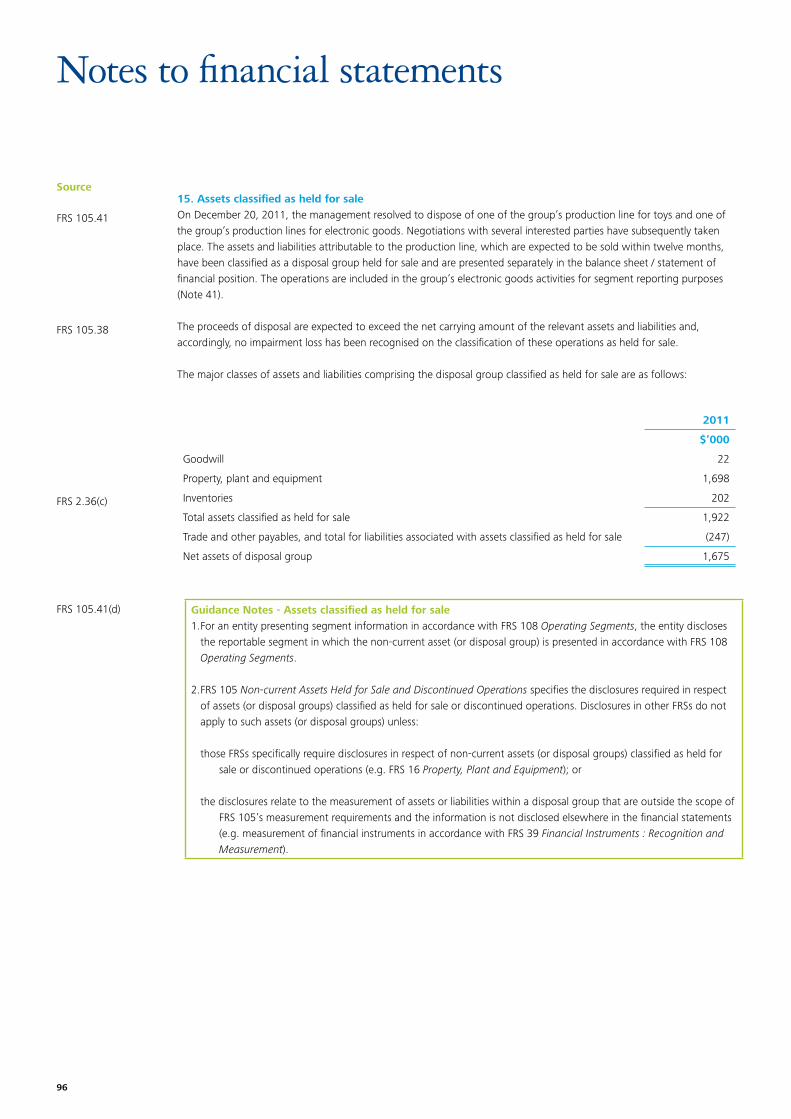
96
Source
Notes to financial statements
FRS 105.41
FRS 105.38
FRS 2.36(c)
FRS 105.41(d)
15. Assets classified as held for saleOn December 20, 2011, the management resolved to dispose of one of the group’s production line for toys and one of the group’s production lines for electronic goods. Negotiations with several interested parties have subsequently taken place. The assets and liabilities attributable to the production line, which are expected to be sold within twelve months, have been classified as a disposal group held for sale and are presented separately in the balance sheet / statement of financial position. The operations are included in the group’s electronic goods activities for segment reporting purposes (Note 41).
The proceeds of disposal are expected to exceed the net carrying amount of the relevant assets and liabilities and, accordingly, no impairment loss has been recognised on the classification of these operations as held for sale.
The major classes of assets and liabilities comprising the disposal group classified as held for sale are as follows:
2011
$’000
Goodwill 22
Property, plant and equipment 1,698
Inventories 202
Total assets classified as held for sale 1,922
Trade and other payables, and total for liabilities associated with assets classified as held for sale (247)
Net assets of disposal group 1,675
Guidance Notes - Assets classified as held for sale1. For an entity presenting segment information in accordance with FRS 108 Operating Segments, the entity discloses
the reportable segment in which the non-current asset (or disposal group) is presented in accordance with FRS 108 Operating Segments.
2. FRS 105 Non-current Assets Held for Sale and Discontinued Operations specifies the disclosures required in respect of assets (or disposal groups) classified as held for sale or discontinued operations. Disclosures in other FRSs do not apply to such assets (or disposal groups) unless:
those FRSs specifically require disclosures in respect of non-current assets (or disposal groups) classified as held for sale or discontinued operations (e.g. FRS 16 Property, Plant and Equipment); or
the disclosures relate to the measurement of assets or liabilities within a disposal group that are outside the scope of FRS 105’s measurement requirements and the information is not disclosed elsewhere in the financial statements (e.g. measurement of financial instruments in accordance with FRS 39 Financial Instruments : Recognition and Measurement).
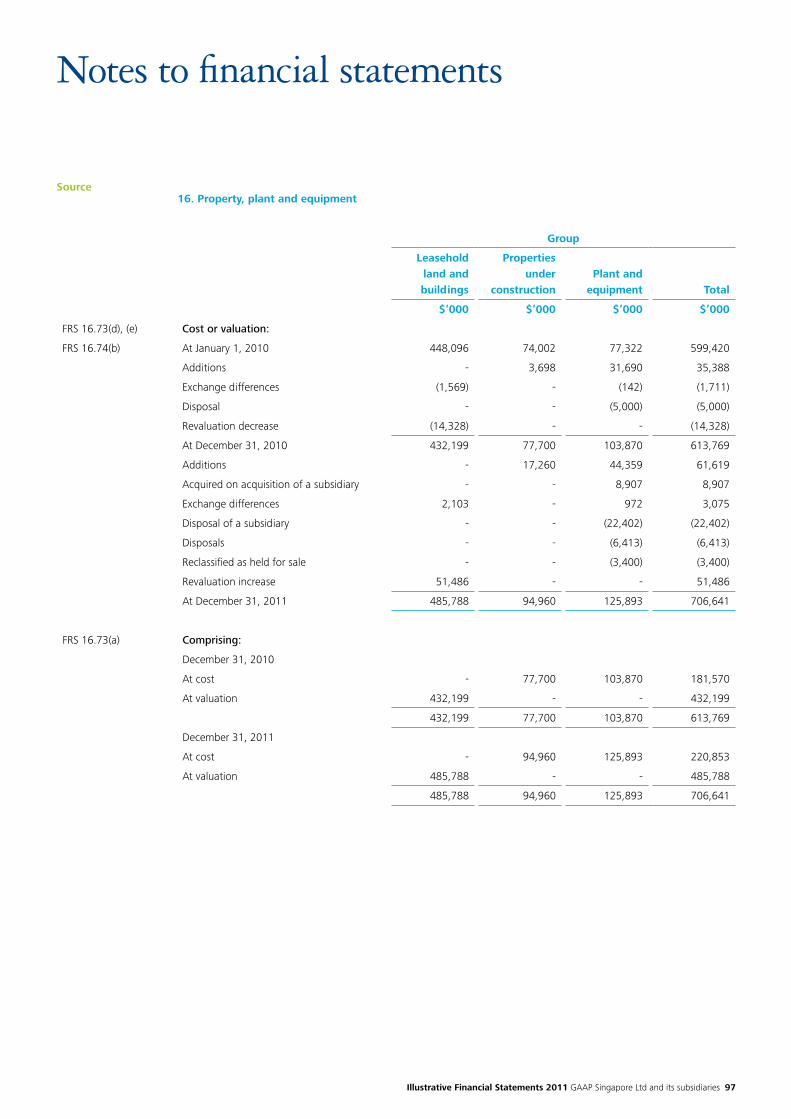
Illustrative Financial Statements 2011 GAAP Singapore Ltd and its subsidiaries 97
Source
Notes to financial statements
Group
Leasehold land and buildings
Properties under
constructionPlant and
equipment Total
$’000 $’000 $’000 $’000
FRS 16.73(d), (e) Cost or valuation:
FRS 16.74(b) At January 1, 2010 448,096 74,002 77,322 599,420
Additions - 3,698 31,690 35,388
Exchange differences (1,569) - (142) (1,711)
Disposal - - (5,000) (5,000)
Revaluation decrease (14,328) - - (14,328)
At December 31, 2010 432,199 77,700 103,870 613,769
Additions - 17,260 44,359 61,619
Acquired on acquisition of a subsidiary - - 8,907 8,907
Exchange differences 2,103 - 972 3,075
Disposal of a subsidiary - - (22,402) (22,402)
Disposals - - (6,413) (6,413)
Reclassified as held for sale - - (3,400) (3,400)
Revaluation increase 51,486 - - 51,486
At December 31, 2011 485,788 94,960 125,893 706,641
FRS 16.73(a) Comprising:
December 31, 2010
At cost - 77,700 103,870 181,570
At valuation 432,199 - - 432,199
432,199 77,700 103,870 613,769
December 31, 2011
At cost - 94,960 125,893 220,853
At valuation 485,788 - - 485,788
485,788 94,960 125,893 706,641
16. Property, plant and equipment
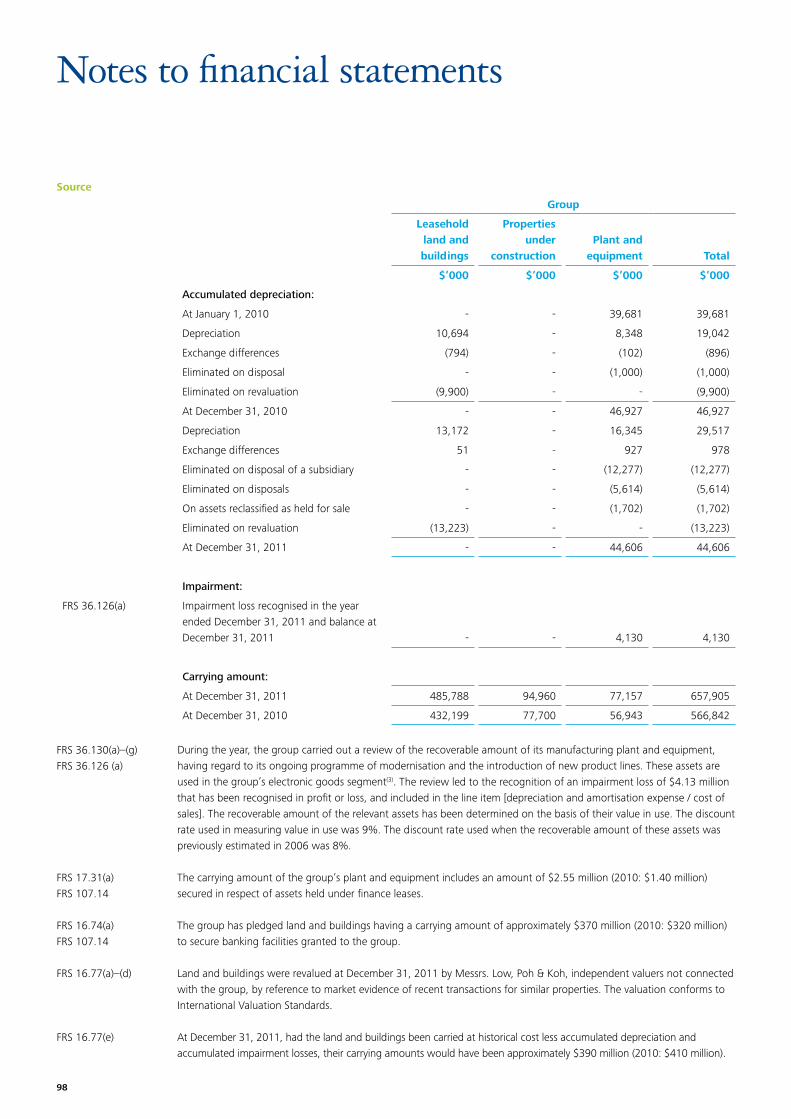
98
Source
Notes to financial statements
Group
Leasehold land and buildings
Properties under
constructionPlant and
equipment Total
$’000 $’000 $’000 $’000
Accumulated depreciation:
At January 1, 2010 - - 39,681 39,681
Depreciation 10,694 - 8,348 19,042
Exchange differences (794) - (102) (896)
Eliminated on disposal - - (1,000) (1,000)
Eliminated on revaluation (9,900) - - (9,900)
At December 31, 2010 - - 46,927 46,927
Depreciation 13,172 - 16,345 29,517
Exchange differences 51 - 927 978
Eliminated on disposal of a subsidiary - - (12,277) (12,277)
Eliminated on disposals - - (5,614) (5,614)
On assets reclassified as held for sale - - (1,702) (1,702)
Eliminated on revaluation (13,223) - - (13,223)
At December 31, 2011 - - 44,606 44,606
Impairment:
FRS 36.126(a) Impairment loss recognised in the year ended December 31, 2011 and balance at December 31, 2011 - - 4,130 4,130
Carrying amount:
At December 31, 2011 485,788 94,960 77,157 657,905
At December 31, 2010 432,199 77,700 56,943 566,842
During the year, the group carried out a review of the recoverable amount of its manufacturing plant and equipment, having regard to its ongoing programme of modernisation and the introduction of new product lines. These assets are used in the group’s electronic goods segment(3). The review led to the recognition of an impairment loss of $4.13 million that has been recognised in profit or loss, and included in the line item [depreciation and amortisation expense / cost of sales]. The recoverable amount of the relevant assets has been determined on the basis of their value in use. The discount rate used in measuring value in use was 9%. The discount rate used when the recoverable amount of these assets was previously estimated in 2006 was 8%. The carrying amount of the group’s plant and equipment includes an amount of $2.55 million (2010: $1.40 million) secured in respect of assets held under finance leases.
The group has pledged land and buildings having a carrying amount of approximately $370 million (2010: $320 million) to secure banking facilities granted to the group.
LandandbuildingswererevaluedatDecember31,2011byMessrs.Low,Poh&Koh,independentvaluersnotconnectedwith the group, by reference to market evidence of recent transactions for similar properties. The valuation conforms to International Valuation Standards.
At December 31, 2011, had the land and buildings been carried at historical cost less accumulated depreciation and accumulated impairment losses, their carrying amounts would have been approximately $390 million (2010: $410 million).
FRS 36.130(a)–(g)FRS 36.126 (a)
FRS 17.31(a)FRS 107.14
FRS 16.74(a)FRS 107.14
FRS 16.77(a)–(d)
FRS 16.77(e)
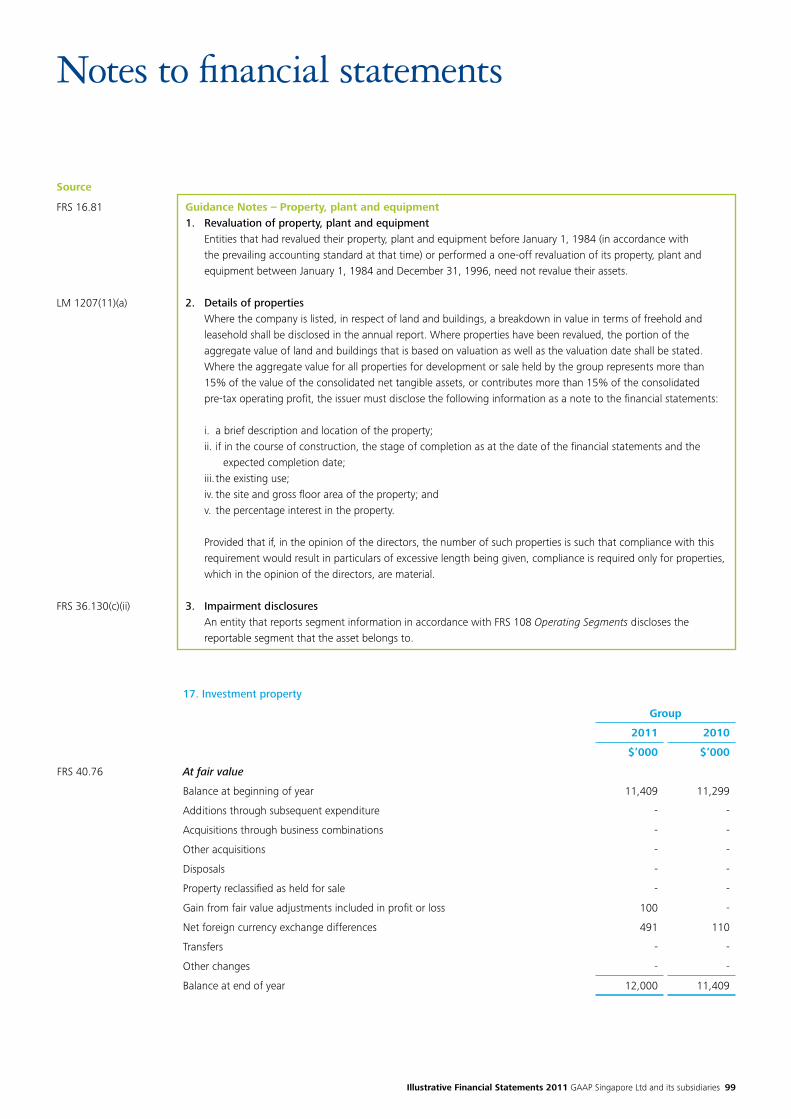
Illustrative Financial Statements 2011 GAAP Singapore Ltd and its subsidiaries 99
Source
Notes to financial statements
Guidance Notes – Property, plant and equipment1. Revaluation of property, plant and equipment Entities that had revalued their property, plant and equipment before January 1, 1984 (in accordance with
the prevailing accounting standard at that time) or performed a one-off revaluation of its property, plant and equipment between January 1, 1984 and December 31, 1996, need not revalue their assets.
2. Details of properties Where the company is listed, in respect of land and buildings, a breakdown in value in terms of freehold and
leasehold shall be disclosed in the annual report. Where properties have been revalued, the portion of the aggregate value of land and buildings that is based on valuation as well as the valuation date shall be stated. Where the aggregate value for all properties for development or sale held by the group represents more than 15% of the value of the consolidated net tangible assets, or contributes more than 15% of the consolidated pre-tax operating profit, the issuer must disclose the following information as a note to the financial statements:
i. a brief description and location of the property;ii. if in the course of construction, the stage of completion as at the date of the financial statements and the
expected completion date;iii. the existing use;iv. the site and gross floor area of the property; andv. the percentage interest in the property.
Provided that if, in the opinion of the directors, the number of such properties is such that compliance with this requirement would result in particulars of excessive length being given, compliance is required only for properties, which in the opinion of the directors, are material.
3. Impairment disclosures An entity that reports segment information in accordance with FRS 108 Operating Segments discloses the
reportable segment that the asset belongs to.
FRS 16.81
LM 1207(11)(a)
FRS 36.130(c)(ii)
17. Investment property
Group
2011 2010
$’000 $’000
At fair value
Balance at beginning of year 11,409 11,299
Additions through subsequent expenditure - -
Acquisitions through business combinations - -
Other acquisitions - -
Disposals - -
Property reclassified as held for sale - -
Gain from fair value adjustments included in profit or loss 100 -
Net foreign currency exchange differences 491 110
Transfers - -
Other changes - -
Balance at end of year 12,000 11,409
FRS 40.76
100
Source
Notes to financial statements
FRS 40.75(a)FRS 40.75(d),(e)
The fair values of the group's investment property at December 31, 2011 and 2010 have been determined on the basis of valuations carried out at the respective year end dates by independent valuers having an appropriate recognised professional qualification and recent experience in the location and category of the properties being valued. The valuations were arrived at by reference to market evidence of transaction prices for similar properties, and were performed in accordance with International Valuation Standards.
All the group's investment property is held under freehold interests.
FRS 40.75(f)(g i-ii) The property rental income from the group's investment properties all of which are leased out under operating leases, amounted to $0.6 million (2010: $0.07 million). Direct operating expenses (including repairs and maintenance) arising from the rental-generating investment properties amounted to $0.4 million (2010: $0.05 million).
LM 1207(11)(b) Guidance Notes - Details of investment propertiesWhere the company is listed, in respect of land and buildings, a breakdown in value in terms of freehold and leasehold shall be disclosed in the annual report. Where properties have been revalued, the portion of the aggregate value of land and buildings that is based on valuation as well as the valuation date shall be stated. Where the aggregate value for all properties for investment purposes held by the group represents more than 15% of the value of the consolidated net tangible assets, or contributes more than 15% of the consolidated pre-tax operating profit, the issuer must disclose the following information as a note to the financial statements:
i. a brief description and location of the property;ii. the existing use; andiii. whether the property is leasehold or freehold. If leasehold, state the unexpired term of the lease.
Provided that if, in the opinion of the directors, the number of such properties is such that compliance with this requirement would result in particulars of excessive length being given, compliance is required only for properties, which in the opinion of the directors, are material.
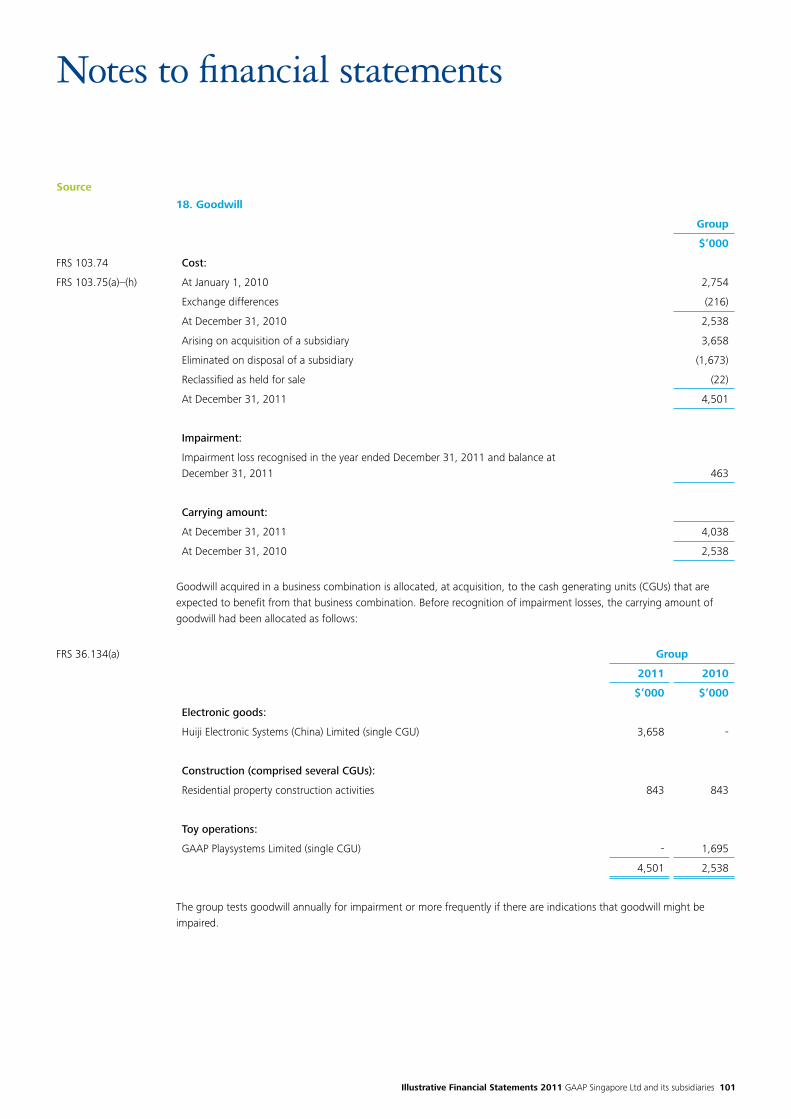
Illustrative Financial Statements 2011 GAAP Singapore Ltd and its subsidiaries 101
Source
Notes to financial statements
18. Goodwill
Group
$’000
FRS 103.74 Cost:
FRS 103.75(a)–(h) At January 1, 2010 2,754
Exchange differences (216)
At December 31, 2010 2,538
Arising on acquisition of a subsidiary 3,658
Eliminated on disposal of a subsidiary (1,673)
Reclassified as held for sale (22)
At December 31, 2011 4,501
Impairment:
Impairment loss recognised in the year ended December 31, 2011 and balance at December 31, 2011 463
Carrying amount:
At December 31, 2011 4,038
At December 31, 2010 2,538
Goodwill acquired in a business combination is allocated, at acquisition, to the cash generating units (CGUs) that are expected to benefit from that business combination. Before recognition of impairment losses, the carrying amount of goodwill had been allocated as follows:
FRS 36.134(a) Group
2011 2010
$’000 $’000
Electronic goods:
Huiji Electronic Systems (China) Limited (single CGU) 3,658 -
Construction (comprised several CGUs):
Residential property construction activities 843 843
Toy operations:
GAAP Playsystems Limited (single CGU) - 1,695
4,501 2,538
The group tests goodwill annually for impairment or more frequently if there are indications that goodwill might be impaired.
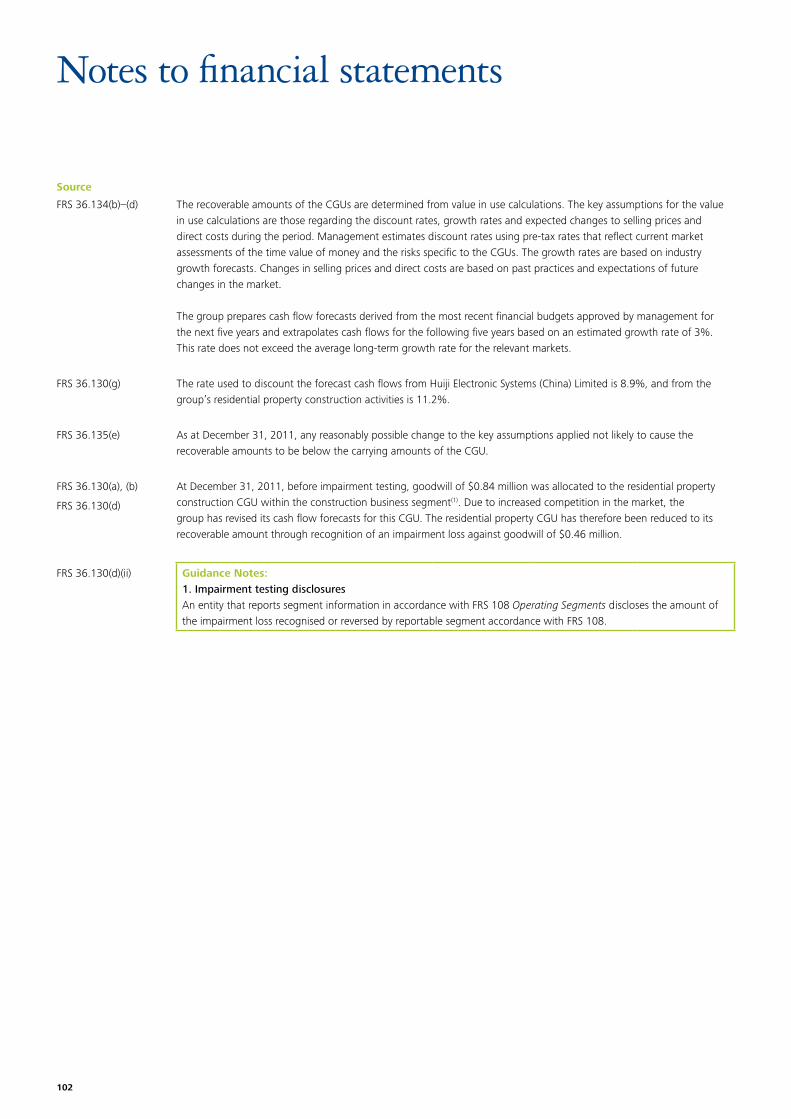
102
Source
Notes to financial statements
FRS 36.134(b)–(d) The recoverable amounts of the CGUs are determined from value in use calculations. The key assumptions for the value in use calculations are those regarding the discount rates, growth rates and expected changes to selling prices and direct costs during the period. Management estimates discount rates using pre-tax rates that reflect current market assessments of the time value of money and the risks specific to the CGUs. The growth rates are based on industry growth forecasts. Changes in selling prices and direct costs are based on past practices and expectations of future changes in the market.
The group prepares cash flow forecasts derived from the most recent financial budgets approved by management for the next five years and extrapolates cash flows for the following five years based on an estimated growth rate of 3%. This rate does not exceed the average long-term growth rate for the relevant markets.
FRS 36.130(g) The rate used to discount the forecast cash flows from Huiji Electronic Systems (China) Limited is 8.9%, and from the group’s residential property construction activities is 11.2%.
FRS 36.135(e) As at December 31, 2011, any reasonably possible change to the key assumptions applied not likely to cause the recoverable amounts to be below the carrying amounts of the CGU.
FRS 36.130(a), (b) At December 31, 2011, before impairment testing, goodwill of $0.84 million was allocated to the residential property construction CGU within the construction business segment(1). Due to increased competition in the market, the group has revised its cash flow forecasts for this CGU. The residential property CGU has therefore been reduced to its recoverable amount through recognition of an impairment loss against goodwill of $0.46 million.
FRS 36.130(d)
FRS 36.130(d)(ii) Guidance Notes:1. Impairment testing disclosuresAn entity that reports segment information in accordance with FRS 108 Operating Segments discloses the amount of the impairment loss recognised or reversed by reportable segment accordance with FRS 108.
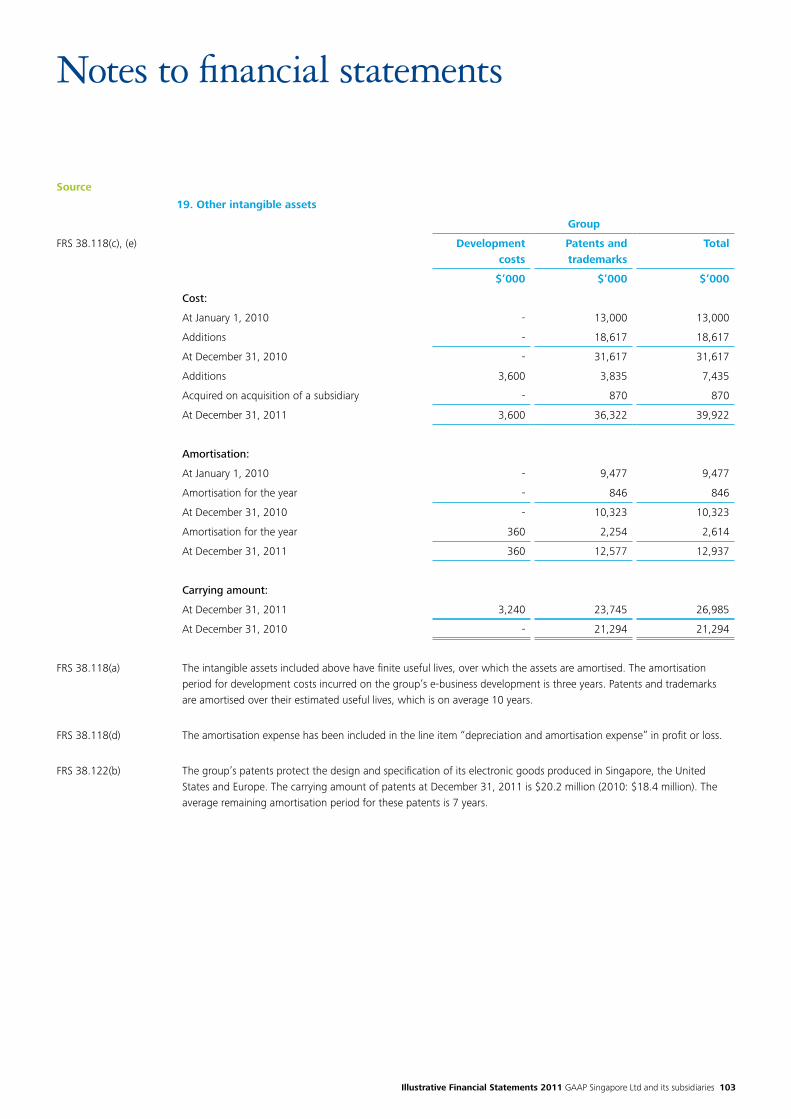
Illustrative Financial Statements 2011 GAAP Singapore Ltd and its subsidiaries 103
Source
Notes to financial statements
19. Other intangible assets
Group
FRS 38.118(c), (e) Development costs
Patents and trademarks
Total
$’000 $’000 $’000
Cost:
At January 1, 2010 - 13,000 13,000
Additions - 18,617 18,617
At December 31, 2010 - 31,617 31,617
Additions 3,600 3,835 7,435
Acquired on acquisition of a subsidiary - 870 870
At December 31, 2011 3,600 36,322 39,922
Amortisation:
At January 1, 2010 - 9,477 9,477
Amortisation for the year - 846 846
At December 31, 2010 - 10,323 10,323
Amortisation for the year 360 2,254 2,614
At December 31, 2011 360 12,577 12,937
Carrying amount:
At December 31, 2011 3,240 23,745 26,985
At December 31, 2010 - 21,294 21,294
FRS 38.118(a) The intangible assets included above have finite useful lives, over which the assets are amortised. The amortisation period for development costs incurred on the group’s e-business development is three years. Patents and trademarks are amortised over their estimated useful lives, which is on average 10 years.
FRS 38.118(d) The amortisation expense has been included in the line item “depreciation and amortisation expense” in profit or loss.
FRS 38.122(b) The group’s patents protect the design and specification of its electronic goods produced in Singapore, the United States and Europe. The carrying amount of patents at December 31, 2011 is $20.2 million (2010: $18.4 million). The average remaining amortisation period for these patents is 7 years.
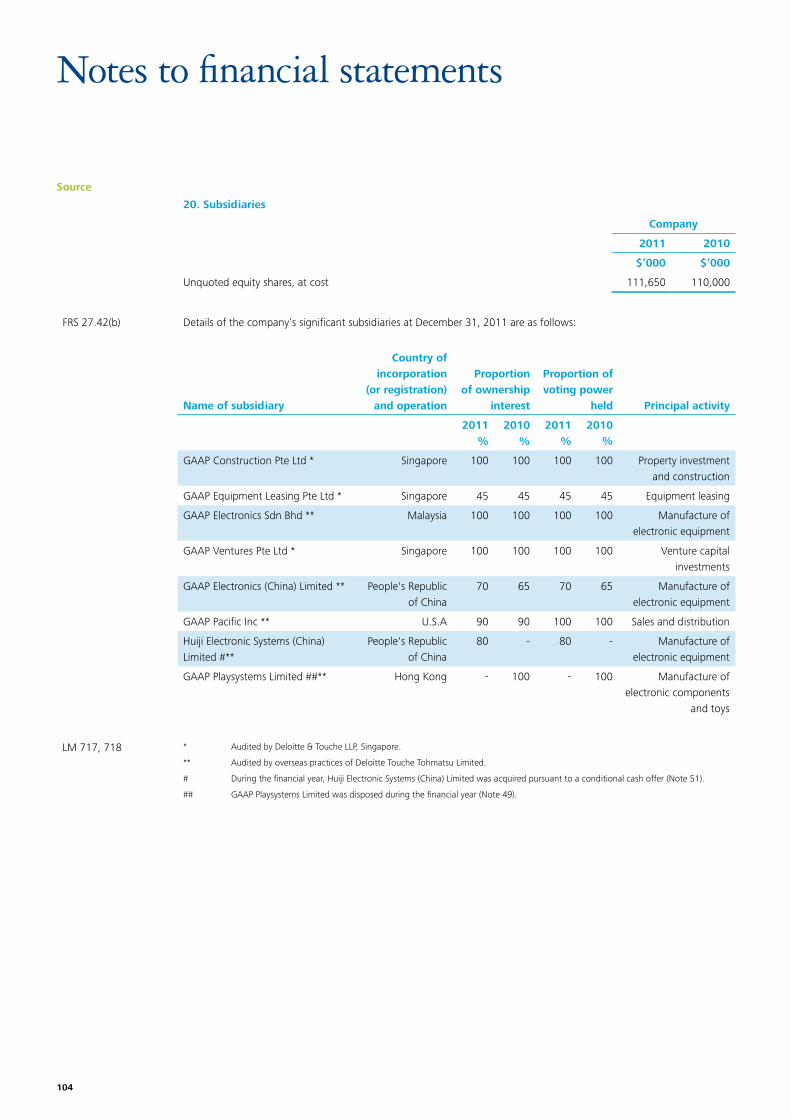
104
Source
Notes to financial statements
20. Subsidiaries
Company
2011 2010
$’000 $’000
Unquoted equity shares, at cost 111,650 110,000
FRS 27.42(b) Details of the company’s significant subsidiaries at December 31, 2011 are as follows:
Name of subsidiary
Country of incorporation
(or registration) and operation
Proportion of ownership
interest
Proportion of voting power
held Principal activity
2011%
2010%
2011%
2010%
GAAP Construction Pte Ltd * Singapore 100 100 100 100 Property investmentand construction
GAAP Equipment Leasing Pte Ltd * Singapore 45 45 45 45 Equipment leasing
GAAP Electronics Sdn Bhd ** Malaysia 100 100 100 100 Manufacture of electronic equipment
GAAP Ventures Pte Ltd * Singapore 100 100 100 100 Venture capitalinvestments
GAAP Electronics (China) Limited ** People's Republic of China
70 65 70 65 Manufacture of electronic equipment
GAAP Pacific Inc ** U.S.A 90 90 100 100 Sales and distribution
Huiji Electronic Systems (China) Limited #**
People's Republic of China
80 - 80 - Manufacture of electronic equipment
GAAP Playsystems Limited ##** HongKong - 100 - 100 Manufacture of electronic components
and toys
LM 717, 718 * Audited by Deloitte & Touche LLP, Singapore.
** Audited by overseas practices of Deloitte Touche Tohmatsu Limited.
# During the financial year, Huiji Electronic Systems (China) Limited was acquired pursuant to a conditional cash offer (Note 51).
## GAAP Playsystems Limited was disposed during the financial year (Note 49).
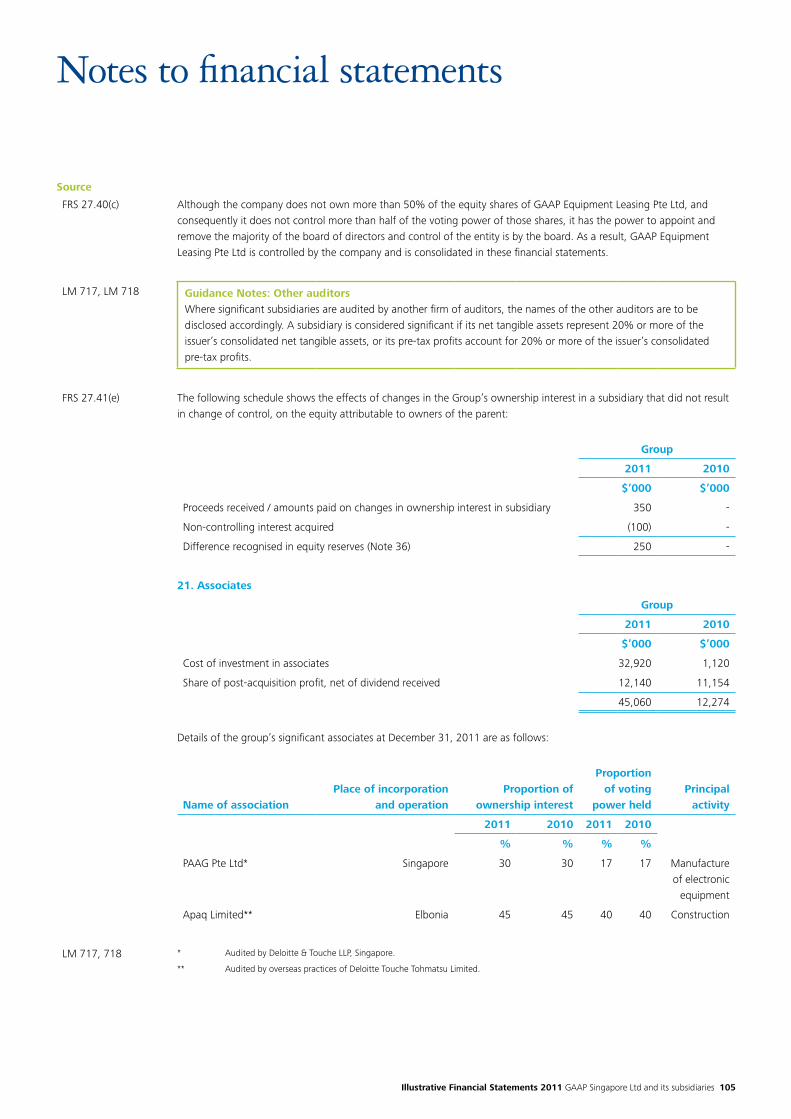
Illustrative Financial Statements 2011 GAAP Singapore Ltd and its subsidiaries 105
Source
Notes to financial statements
FRS 27.40(c) Although the company does not own more than 50% of the equity shares of GAAP Equipment Leasing Pte Ltd, and consequently it does not control more than half of the voting power of those shares, it has the power to appoint and remove the majority of the board of directors and control of the entity is by the board. As a result, GAAP Equipment Leasing Pte Ltd is controlled by the company and is consolidated in these financial statements.
LM 717, LM 718 Guidance Notes: Other auditorsWhere significant subsidiaries are audited by another firm of auditors, the names of the other auditors are to be disclosed accordingly. A subsidiary is considered significant if its net tangible assets represent 20% or more of the issuer’s consolidated net tangible assets, or its pre-tax profits account for 20% or more of the issuer’s consolidated pre-tax profits.
FRS 27.41(e) The following schedule shows the effects of changes in the Group’s ownership interest in a subsidiary that did not result in change of control, on the equity attributable to owners of the parent:
Group
2011 2010
$’000 $’000
Proceeds received / amounts paid on changes in ownership interest in subsidiary 350 -
Non-controlling interest acquired (100) -
Difference recognised in equity reserves (Note 36) 250 -
21. Associates
Group
2011 2010
$’000 $’000
Cost of investment in associates 32,920 1,120
Share of post-acquisition profit, net of dividend received 12,140 11,154
45,060 12,274
Details of the group’s significant associates at December 31, 2011 are as follows:
Name of associationPlace of incorporation
and operationProportion of
ownership interest
Proportionof voting
power heldPrincipal
activity
2011 2010 2011 2010
% % % %
PAAG Pte Ltd* Singapore 30 30 17 17 Manufacture of electronic
equipment
Apaq Limited** Elbonia 45 45 40 40 Construction
LM 717, 718 * Audited by Deloitte & Touche LLP, Singapore.
** Audited by overseas practices of Deloitte Touche Tohmatsu Limited.
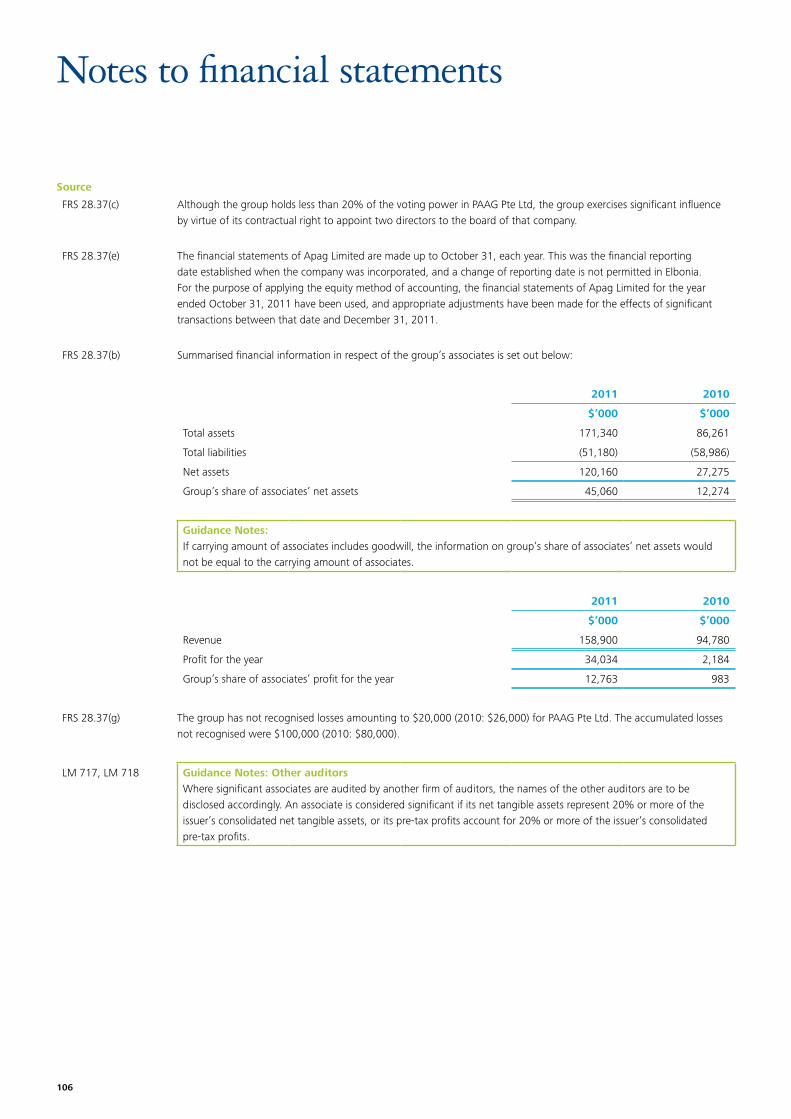
106
Source
Notes to financial statements
FRS 28.37(c) Although the group holds less than 20% of the voting power in PAAG Pte Ltd, the group exercises significant influence by virtue of its contractual right to appoint two directors to the board of that company.
FRS 28.37(e) The financial statements of Apag Limited are made up to October 31, each year. This was the financial reporting date established when the company was incorporated, and a change of reporting date is not permitted in Elbonia. For the purpose of applying the equity method of accounting, the financial statements of Apag Limited for the year ended October 31, 2011 have been used, and appropriate adjustments have been made for the effects of significant transactions between that date and December 31, 2011.
FRS 28.37(b) Summarised financial information in respect of the group’s associates is set out below:
2011 2010
$’000 $’000
Total assets 171,340 86,261
Total liabilities (51,180) (58,986)
Net assets 120,160 27,275
Group’s share of associates’ net assets 45,060 12,274
Guidance Notes:If carrying amount of associates includes goodwill, the information on group’s share of associates’ net assets would not be equal to the carrying amount of associates.
2011 2010
$’000 $’000
Revenue 158,900 94,780
Profit for the year 34,034 2,184
Group’s share of associates’ profit for the year 12,763 983
FRS 28.37(g) The group has not recognised losses amounting to $20,000 (2010: $26,000) for PAAG Pte Ltd. The accumulated losses not recognised were $100,000 (2010: $80,000).
LM 717, LM 718 Guidance Notes: Other auditorsWhere significant associates are audited by another firm of auditors, the names of the other auditors are to be disclosed accordingly. An associate is considered significant if its net tangible assets represent 20% or more of the issuer’s consolidated net tangible assets, or its pre-tax profits account for 20% or more of the issuer’s consolidated pre-tax profits.
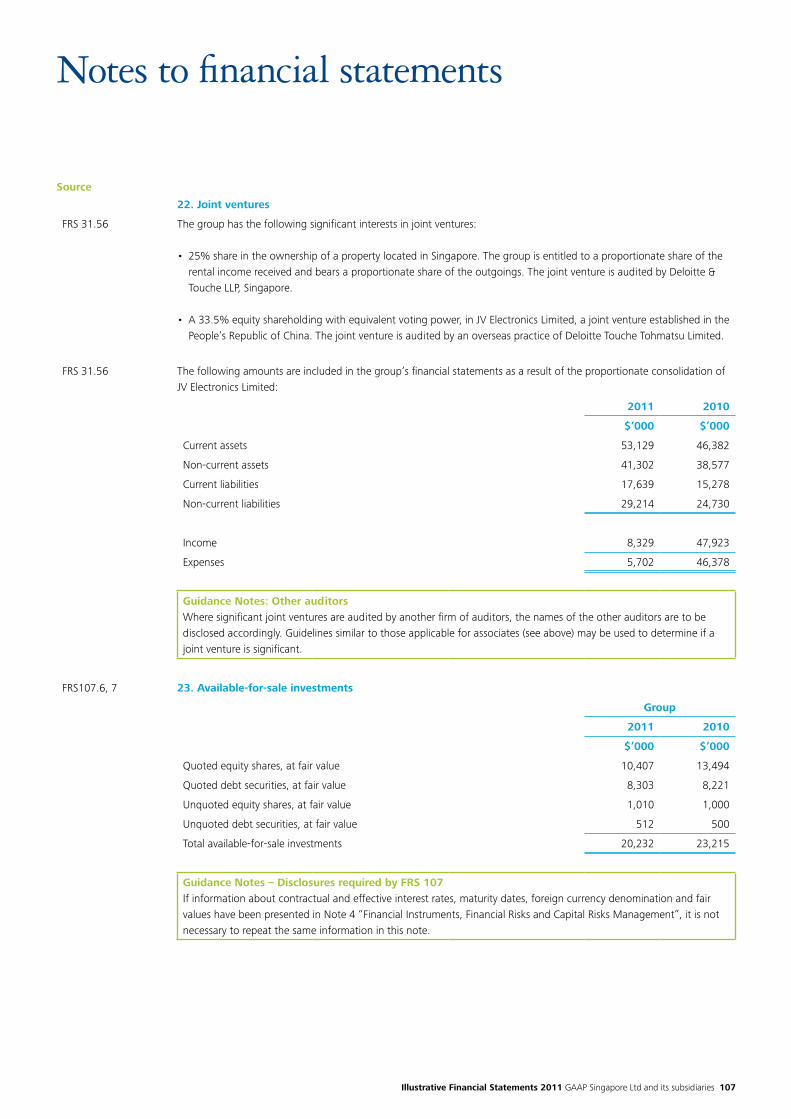
Illustrative Financial Statements 2011 GAAP Singapore Ltd and its subsidiaries 107
Source
Notes to financial statements
22. Joint ventures
FRS 31.56 The group has the following significant interests in joint ventures:
• 25% share in the ownership of a property located in Singapore. The group is entitled to a proportionate share of the rental income received and bears a proportionate share of the outgoings. The joint venture is audited by Deloitte & Touche LLP, Singapore.
• A 33.5% equity shareholding with equivalent voting power, in JV Electronics Limited, a joint venture established in the People’s Republic of China. The joint venture is audited by an overseas practice of Deloitte Touche Tohmatsu Limited.
FRS 31.56 The following amounts are included in the group’s financial statements as a result of the proportionate consolidation of JV Electronics Limited:
2011 2010
$’000 $’000
Current assets 53,129 46,382
Non-current assets 41,302 38,577
Current liabilities 17,639 15,278
Non-current liabilities 29,214 24,730
Income 8,329 47,923
Expenses 5,702 46,378
Guidance Notes: Other auditorsWhere significant joint ventures are audited by another firm of auditors, the names of the other auditors are to be disclosed accordingly. Guidelines similar to those applicable for associates (see above) may be used to determine if a joint venture is significant.
FRS107.6, 7 23. Available-for-sale investments
Group
2011 2010
$’000 $’000
Quoted equity shares, at fair value 10,407 13,494
Quoted debt securities, at fair value 8,303 8,221
Unquoted equity shares, at fair value 1,010 1,000
Unquoted debt securities, at fair value 512 500
Total available-for-sale investments 20,232 23,215
Guidance Notes – Disclosures required by FRS 107If information about contractual and effective interest rates, maturity dates, foreign currency denomination and fair values have been presented in Note 4 “Financial Instruments, Financial Risks and Capital Risks Management”, it is not necessary to repeat the same information in this note.
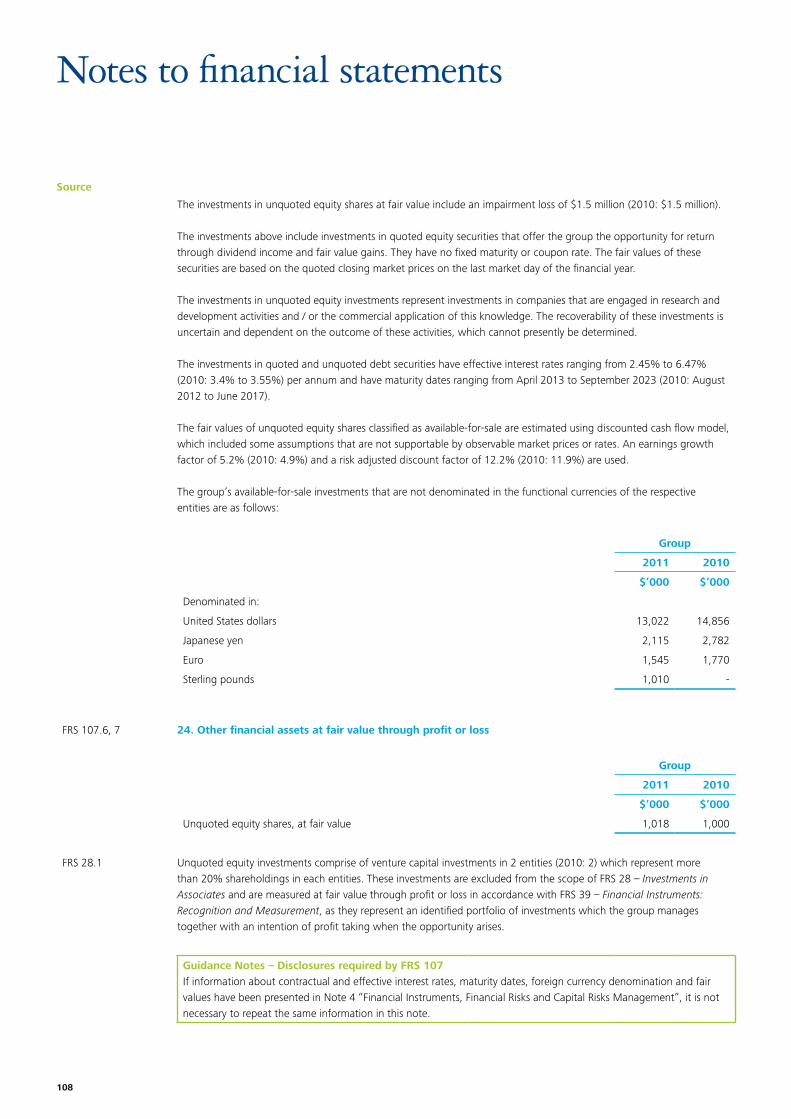
108
Source
Notes to financial statements
The investments in unquoted equity shares at fair value include an impairment loss of $1.5 million (2010: $1.5 million).
The investments above include investments in quoted equity securities that offer the group the opportunity for return through dividend income and fair value gains. They have no fixed maturity or coupon rate. The fair values of these securities are based on the quoted closing market prices on the last market day of the financial year.
The investments in unquoted equity investments represent investments in companies that are engaged in research and development activities and / or the commercial application of this knowledge. The recoverability of these investments is uncertain and dependent on the outcome of these activities, which cannot presently be determined.
The investments in quoted and unquoted debt securities have effective interest rates ranging from 2.45% to 6.47% (2010: 3.4% to 3.55%) per annum and have maturity dates ranging from April 2013 to September 2023 (2010: August 2012 to June 2017).
The fair values of unquoted equity shares classified as available-for-sale are estimated using discounted cash flow model, which included some assumptions that are not supportable by observable market prices or rates. An earnings growth factor of 5.2% (2010: 4.9%) and a risk adjusted discount factor of 12.2% (2010: 11.9%) are used.
The group’s available-for-sale investments that are not denominated in the functional currencies of the respective entities are as follows:
Group
2011 2010
$’000 $’000
Denominated in:
United States dollars 13,022 14,856
Japanese yen 2,115 2,782
Euro 1,545 1,770
Sterling pounds 1,010 -
FRS 107.6, 7 24. Other financial assets at fair value through profit or loss
Group
2011 2010
$’000 $’000
Unquoted equity shares, at fair value 1,018 1,000
FRS 28.1 Unquoted equity investments comprise of venture capital investments in 2 entities (2010: 2) which represent more than 20% shareholdings in each entities. These investments are excluded from the scope of FRS 28 – Investments in Associates and are measured at fair value through profit or loss in accordance with FRS 39 – Financial Instruments: Recognition and Measurement, as they represent an identified portfolio of investments which the group manages together with an intention of profit taking when the opportunity arises.
Guidance Notes – Disclosures required by FRS 107If information about contractual and effective interest rates, maturity dates, foreign currency denomination and fair values have been presented in Note 4 “Financial Instruments, Financial Risks and Capital Risks Management”, it is not necessary to repeat the same information in this note.
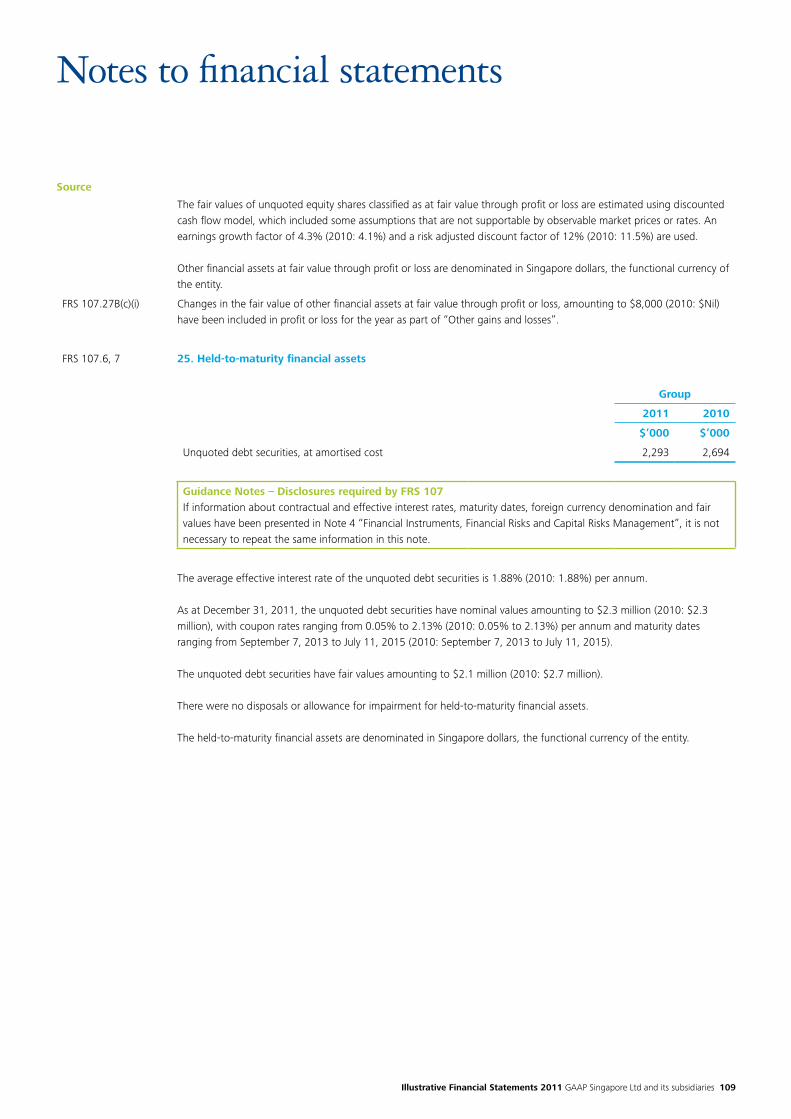
Illustrative Financial Statements 2011 GAAP Singapore Ltd and its subsidiaries 109
Source
Notes to financial statements
The fair values of unquoted equity shares classified as at fair value through profit or loss are estimated using discounted cash flow model, which included some assumptions that are not supportable by observable market prices or rates. An earnings growth factor of 4.3% (2010: 4.1%) and a risk adjusted discount factor of 12% (2010: 11.5%) are used.
Other financial assets at fair value through profit or loss are denominated in Singapore dollars, the functional currency of the entity.
FRS 107.27B(c)(i) Changes in the fair value of other financial assets at fair value through profit or loss, amounting to $8,000 (2010: $Nil) have been included in profit or loss for the year as part of “Other gains and losses”.
FRS 107.6, 7 25. Held-to-maturity financial assets
Group
2011 2010
$’000 $’000
Unquoted debt securities, at amortised cost 2,293 2,694
Guidance Notes – Disclosures required by FRS 107If information about contractual and effective interest rates, maturity dates, foreign currency denomination and fair values have been presented in Note 4 “Financial Instruments, Financial Risks and Capital Risks Management”, it is not necessary to repeat the same information in this note.
The average effective interest rate of the unquoted debt securities is 1.88% (2010: 1.88%) per annum.
As at December 31, 2011, the unquoted debt securities have nominal values amounting to $2.3 million (2010: $2.3 million), with coupon rates ranging from 0.05% to 2.13% (2010: 0.05% to 2.13%) per annum and maturity dates ranging from September 7, 2013 to July 11, 2015 (2010: September 7, 2013 to July 11, 2015).
The unquoted debt securities have fair values amounting to $2.1 million (2010: $2.7 million).
There were no disposals or allowance for impairment for held-to-maturity financial assets.
The held-to-maturity financial assets are denominated in Singapore dollars, the functional currency of the entity.
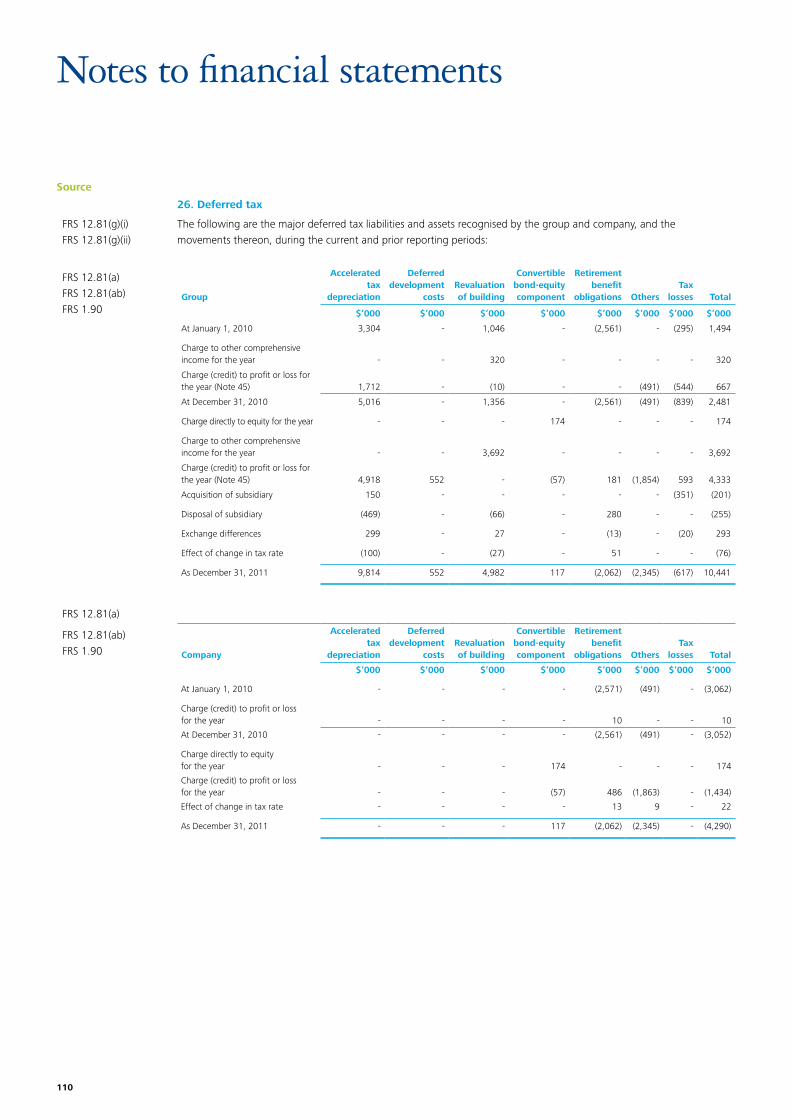
110
Source
Notes to financial statements
26. Deferred tax
FRS 12.81(g)(i)FRS 12.81(g)(ii)
The following are the major deferred tax liabilities and assets recognised by the group and company, and the movements thereon, during the current and prior reporting periods:
FRS 12.81(a)FRS 12.81(ab)FRS 1.90
Group
Accelerated tax
depreciation
Deferred development
costsRevaluation of building
Convertible bond-equity component
Retirement benefit
obligations OthersTax
losses Total
$’000 $’000 $’000 $’000 $’000 $’000 $’000 $’000
At January 1, 2010 3,304 - 1,046 - (2,561) - (295) 1,494
Charge to other comprehensiveincome for the year - - 320 - - - - 320
Charge (credit) to profit or loss for the year (Note 45) 1,712 - (10) - - (491) (544) 667
At December 31, 2010 5,016 - 1,356 - (2,561) (491) (839) 2,481
Charge directly to equity for the year - - - 174 - - - 174
Charge to other comprehensive income for the year - - 3,692 - - - - 3,692
Charge (credit) to profit or loss for the year (Note 45) 4,918 552 - (57) 181 (1,854) 593 4,333
Acquisition of subsidiary 150 - - - - - (351) (201)
Disposal of subsidiary (469) - (66) - 280 - - (255)
Exchange differences 299 - 27 - (13) - (20) 293
Effect of change in tax rate (100) - (27) - 51 - - (76)
As December 31, 2011 9,814 552 4,982 117 (2,062) (2,345) (617) 10,441
FRS 12.81(a)
FRS 12.81(ab)FRS 1.90 Company
Accelerated tax
depreciation
Deferred development
costsRevaluation of building
Convertible bond-equity component
Retirement benefit
obligations OthersTax
losses Total
$’000 $’000 $’000 $’000 $’000 $’000 $’000 $’000
At January 1, 2010 - - - - (2,571) (491) - (3,062)
Charge (credit) to profit or lossfor the year - - - - 10 - - 10
At December 31, 2010 - - - - (2,561) (491) - (3,052)
Charge directly to equityfor the year - - - 174 - - - 174
Charge (credit) to profit or lossfor the year - - - (57) 486 (1,863) - (1,434)
Effect of change in tax rate - - - - 13 9 - 22
As December 31, 2011 - - - 117 (2,062) (2,345) - (4,290)
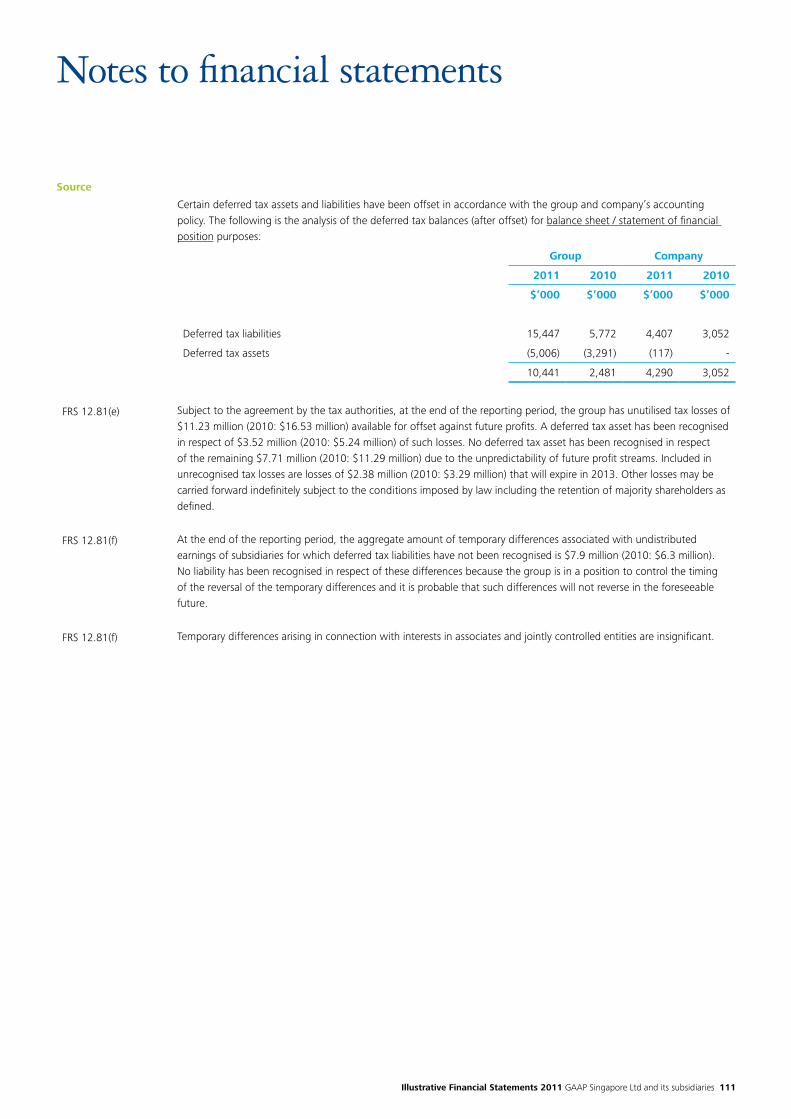
Illustrative Financial Statements 2011 GAAP Singapore Ltd and its subsidiaries 111
Source
Notes to financial statements
Certain deferred tax assets and liabilities have been offset in accordance with the group and company’s accounting policy. The following is the analysis of the deferred tax balances (after offset) for balance sheet / statement of financial position purposes:
Group Company
2011 2010 2011 2010
$’000 $’000 $’000 $’000
Deferred tax liabilities 15,447 5,772 4,407 3,052
Deferred tax assets (5,006) (3,291) (117) -
10,441 2,481 4,290 3,052
FRS 12.81(e) Subject to the agreement by the tax authorities, at the end of the reporting period, the group has unutilised tax losses of $11.23 million (2010: $16.53 million) available for offset against future profits. A deferred tax asset has been recognised in respect of $3.52 million (2010: $5.24 million) of such losses. No deferred tax asset has been recognised in respect of the remaining $7.71 million (2010: $11.29 million) due to the unpredictability of future profit streams. Included in unrecognised tax losses are losses of $2.38 million (2010: $3.29 million) that will expire in 2013. Other losses may be carried forward indefinitely subject to the conditions imposed by law including the retention of majority shareholders as defined.
FRS 12.81(f) At the end of the reporting period, the aggregate amount of temporary differences associated with undistributed earnings of subsidiaries for which deferred tax liabilities have not been recognised is $7.9 million (2010: $6.3 million). No liability has been recognised in respect of these differences because the group is in a position to control the timing of the reversal of the temporary differences and it is probable that such differences will not reverse in the foreseeable future.
FRS 12.81(f) Temporary differences arising in connection with interests in associates and jointly controlled entities are insignificant.
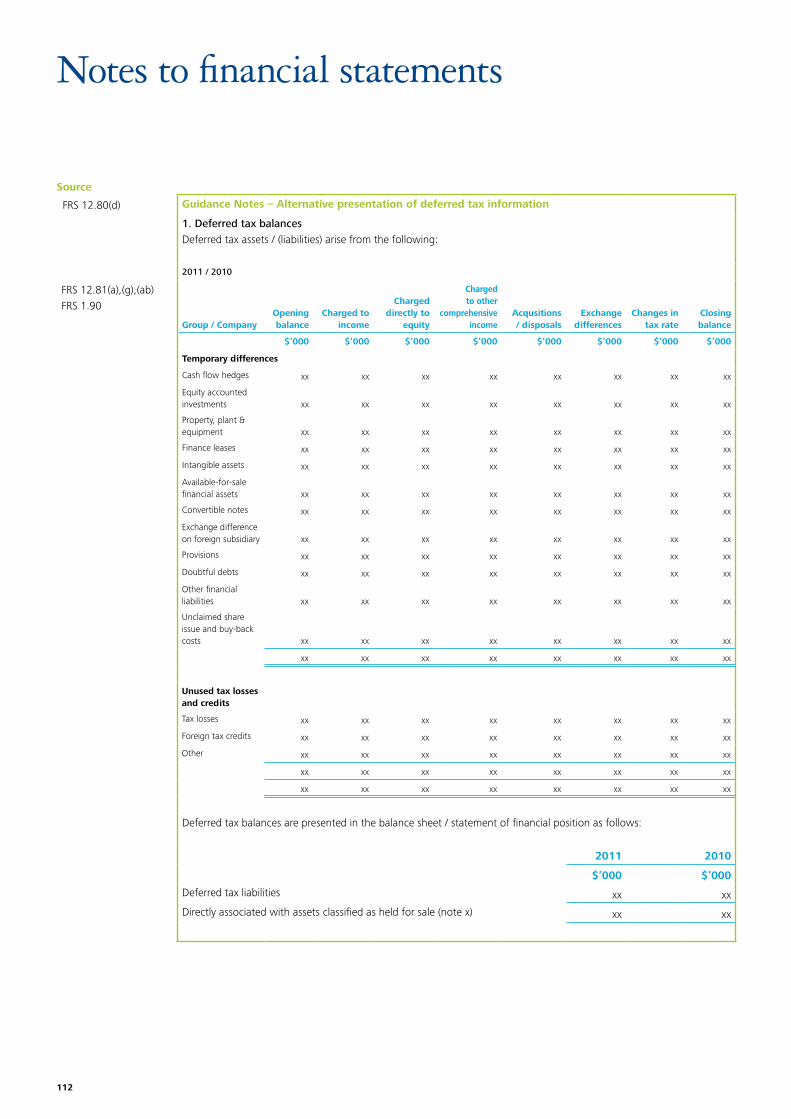
112
Source
Notes to financial statements
FRS 12.80(d) Guidance Notes – Alternative presentation of deferred tax information
1. Deferred tax balancesDeferred tax assets / (liabilities) arise from the following:
2011 / 2010
FRS 12.81(a),(g),(ab)FRS 1.90
Group / CompanyOpening balance
Charged to income
Charged directly to
equity
Charged to other
comprehensive income
Acqusitions / disposals
Exchange differences
Changes in tax rate
Closing balance
$’000 $’000 $’000 $’000 $’000 $’000 $’000 $’000
Temporary differences
Cash flow hedges xx xx xx xx xx xx xx xx
Equity accountedinvestments xx xx xx xx xx xx xx xx
Property, plant &equipment xx xx xx xx xx xx xx xx
Finance leases xx xx xx xx xx xx xx xx
Intangible assets xx xx xx xx xx xx xx xx
Available-for-salefinancial assets xx xx xx xx xx xx xx xx
Convertible notes xx xx xx xx xx xx xx xx
Exchange differenceon foreign subsidiary xx xx xx xx xx xx xx xx
Provisions xx xx xx xx xx xx xx xx
Doubtful debts xx xx xx xx xx xx xx xx
Other financial liabilities xx xx xx xx xx xx xx xx
Unclaimed share issue and buy-back costs xx xx xx xx xx xx xx xx
xx xx xx xx xx xx xx xx
Unused tax losses and credits
Tax losses xx xx xx xx xx xx xx xx
Foreign tax credits xx xx xx xx xx xx xx xx
Other xx xx xx xx xx xx xx xx
xx xx xx xx xx xx xx xx
xx xx xx xx xx xx xx xx
Deferred tax balances are presented in the balance sheet / statement of financial position as follows:
2011 2010
$’000 $’000
Deferred tax liabilities xx xx
Directly associated with assets classified as held for sale (note x) xx xx
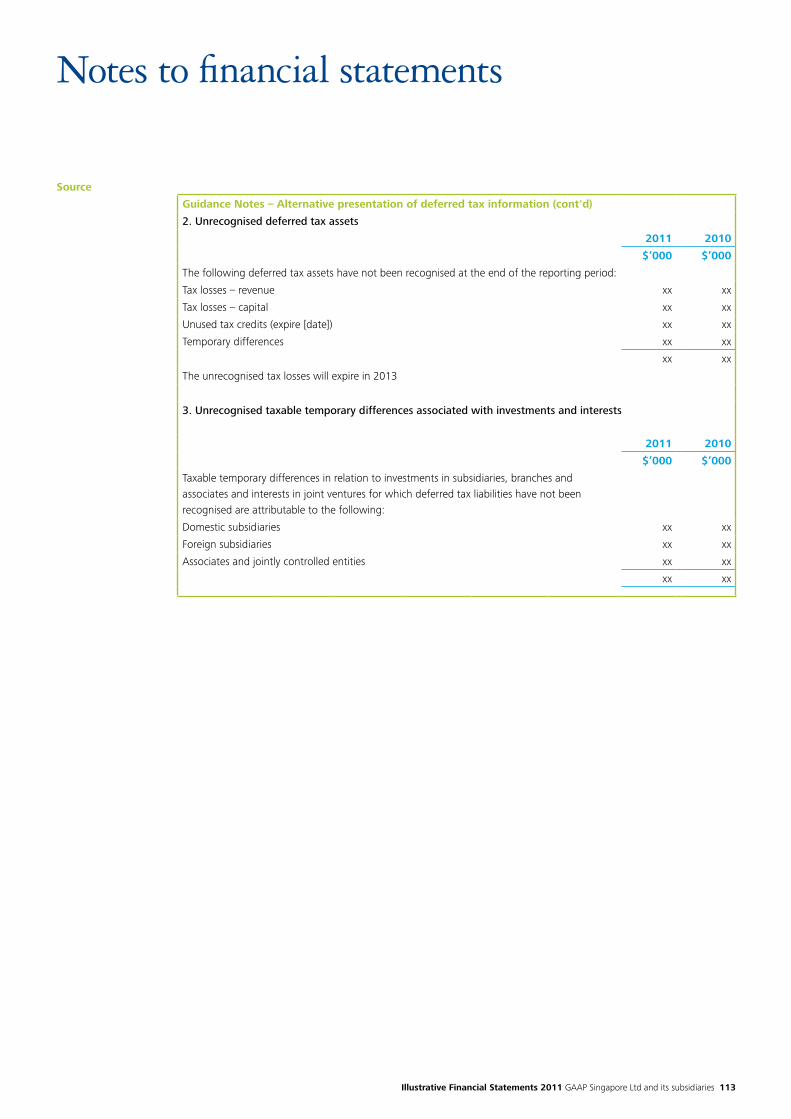
Illustrative Financial Statements 2011 GAAP Singapore Ltd and its subsidiaries 113
Source
Notes to financial statements
Guidance Notes – Alternative presentation of deferred tax information (cont'd)
2. Unrecognised deferred tax assets
2011 2010
$’000 $’000
The following deferred tax assets have not been recognised at the end of the reporting period:
Tax losses – revenue xx xx
Tax losses – capital xx xx
Unused tax credits (expire [date]) xx xx
Temporary differences xx xx
xx xx
The unrecognised tax losses will expire in 2013
3. Unrecognised taxable temporary differences associated with investments and interests
2011 2010
$’000 $’000
Taxable temporary differences in relation to investments in subsidiaries, branches and associates and interests in joint ventures for which deferred tax liabilities have not been recognised are attributable to the following:
Domestic subsidiaries xx xx
Foreign subsidiaries xx xx
Associates and jointly controlled entities xx xx
xx xx
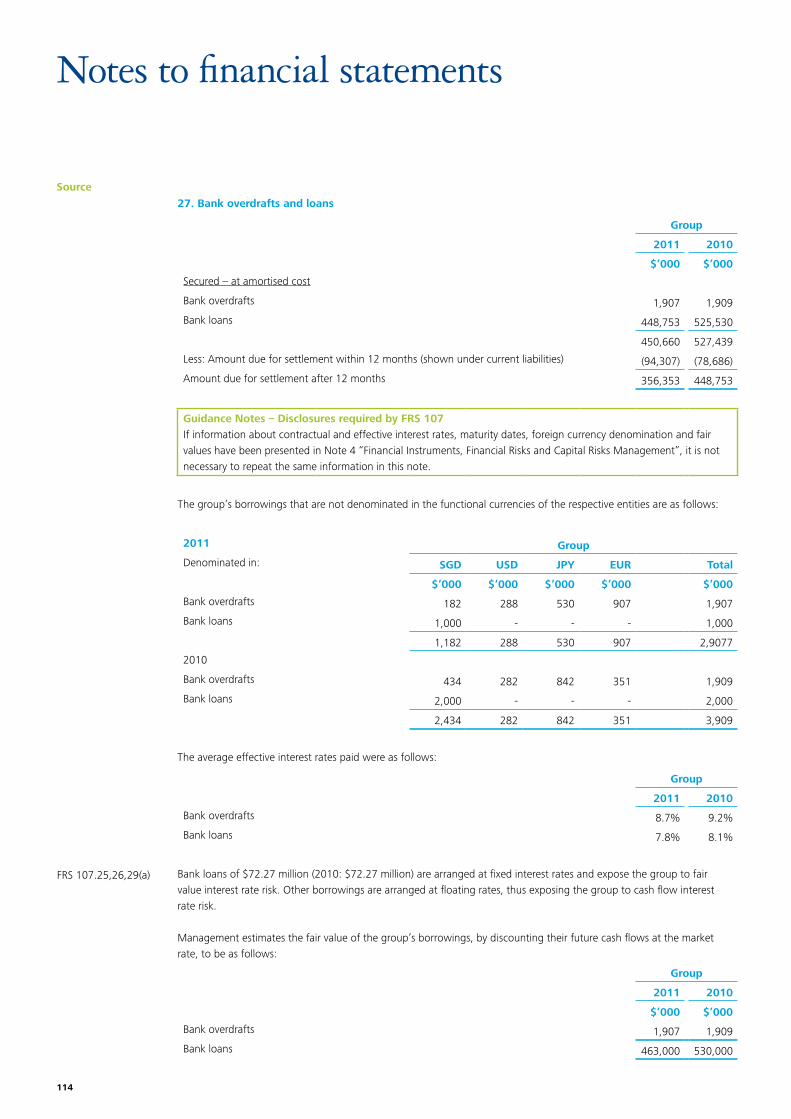
114
Source
Notes to financial statements
27. Bank overdrafts and loans
Group
2011 2010
$’000 $’000
Secured – at amortised cost
Bank overdrafts 1,907 1,909
Bank loans 448,753 525,530
450,660 527,439
Less: Amount due for settlement within 12 months (shown under current liabilities) (94,307) (78,686)
Amount due for settlement after 12 months 356,353 448,753
Guidance Notes – Disclosures required by FRS 107If information about contractual and effective interest rates, maturity dates, foreign currency denomination and fair values have been presented in Note 4 “Financial Instruments, Financial Risks and Capital Risks Management”, it is not necessary to repeat the same information in this note.
The group’s borrowings that are not denominated in the functional currencies of the respective entities are as follows:
2011 Group
Denominated in: SGD USD JPY EUR Total
$’000 $’000 $’000 $’000 $’000
Bank overdrafts 182 288 530 907 1,907
Bank loans 1,000 - - - 1,000
1,182 288 530 907 2,9077
2010
Bank overdrafts 434 282 842 351 1,909
Bank loans 2,000 - - - 2,000
2,434 282 842 351 3,909
The average effective interest rates paid were as follows:
Group
2011 2010
Bank overdrafts 8.7% 9.2%
Bank loans 7.8% 8.1%
FRS 107.25,26,29(a) Bank loans of $72.27 million (2010: $72.27 million) are arranged at fixed interest rates and expose the group to fair value interest rate risk. Other borrowings are arranged at floating rates, thus exposing the group to cash flow interest rate risk.
Management estimates the fair value of the group’s borrowings, by discounting their future cash flows at the market rate, to be as follows:
Group
2011 2010
$’000 $’000
Bank overdrafts 1,907 1,909
Bank loans 463,000 530,000
Illustrative Financial Statements 2011 GAAP Singapore Ltd and its subsidiaries 115
Source
Notes to financial statements
Bank overdrafts are repayable on demand. Overdrafts of $1.1 million (2010: $1.1 million) have been secured by a charge over the group’s inventories. The average effective interest rate on bank overdrafts approximated 8.7% (2010: 9.2%) in the year and is determined based on 2% plus prime rate.
The group has two principal bank loans:
i. a loan of $376.49 million (2010: $463.27 million). The loan was raised on February 1, 2008. Repayments commenced on January 31, 2011 and will continue until January 2, 2015. The loan is secured by a charge over certain of the group’s properties. The loan carries interest at 1% plus prime rate
ii. a loan of $72.27 million (2010: $72.27 million) secured on certain current and non-current assets of the group. This loan was advanced on July 1, 2010 and is due for repayment on January 3,2014. The bank loan carries fixed interest rate at 8% (2010: 8%) per annum.
FRS 7.50 At December 31, 2011, the group had available $200 million (2010: $200 million) of undrawn committed borrowing facilities in respect of which all conditions precedent had been met.
FRS 107.18
Guidance Notes 1. Breach of loan agreement
If applicable, the following is an illustrative disclosure:During 2011, the group was late in paying interest for the first quarter on one of its loans with a carrying amount of $x million. The delay arose because of a temporary lack of funds on the date interest was payable due to a technical problem on settlement. The interest payment outstanding of $y was repaid in full on the following day, including the additional interest and penalty. The lender did not request accelerated repayment of the loan and the terms of the loan were not changed. Management has reviewed the group’s settlement procedures to ensure that such circumstances do not recur.
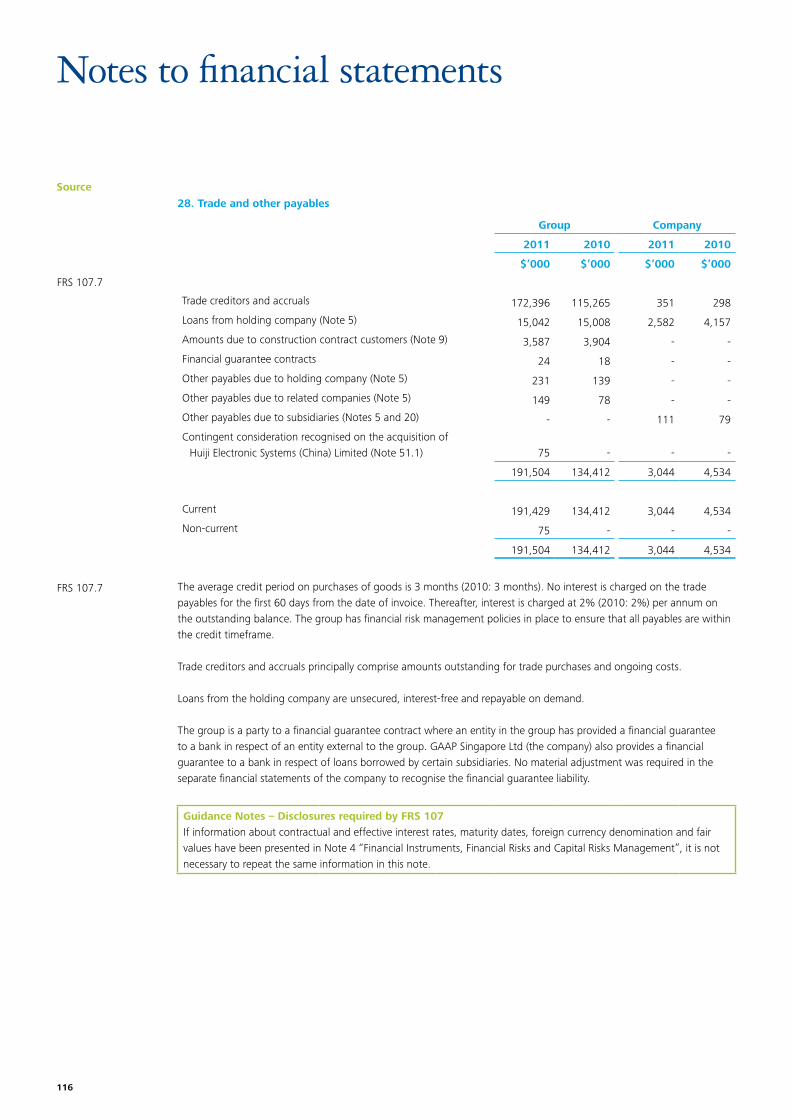
116
Source
Notes to financial statements
28. Trade and other payables
Group Company
2011 2010 2011 2010
$’000 $’000 $’000 $’000
FRS 107.7
Trade creditors and accruals 172,396 115,265 351 298
Loans from holding company (Note 5) 15,042 15,008 2,582 4,157
Amounts due to construction contract customers (Note 9) 3,587 3,904 - -
Financial guarantee contracts 24 18 - -
Other payables due to holding company (Note 5) 231 139 - -
Other payables due to related companies (Note 5) 149 78 - -
Other payables due to subsidiaries (Notes 5 and 20) - - 111 79
Contingent consideration recognised on the acquisition ofHuiji Electronic Systems (China) Limited (Note 51.1) 75 - - -
191,504 134,412 3,044 4,534
Current 191,429 134,412 3,044 4,534
Non-current 75 - - -
191,504 134,412 3,044 4,534
FRS 107.7 The average credit period on purchases of goods is 3 months (2010: 3 months). No interest is charged on the trade payables for the first 60 days from the date of invoice. Thereafter, interest is charged at 2% (2010: 2%) per annum on the outstanding balance. The group has financial risk management policies in place to ensure that all payables are within the credit timeframe.
Trade creditors and accruals principally comprise amounts outstanding for trade purchases and ongoing costs.
Loans from the holding company are unsecured, interest-free and repayable on demand.
The group is a party to a financial guarantee contract where an entity in the group has provided a financial guarantee to a bank in respect of an entity external to the group. GAAP Singapore Ltd (the company) also provides a financial guarantee to a bank in respect of loans borrowed by certain subsidiaries. No material adjustment was required in the separate financial statements of the company to recognise the financial guarantee liability.
Guidance Notes – Disclosures required by FRS 107If information about contractual and effective interest rates, maturity dates, foreign currency denomination and fair values have been presented in Note 4 “Financial Instruments, Financial Risks and Capital Risks Management”, it is not necessary to repeat the same information in this note.
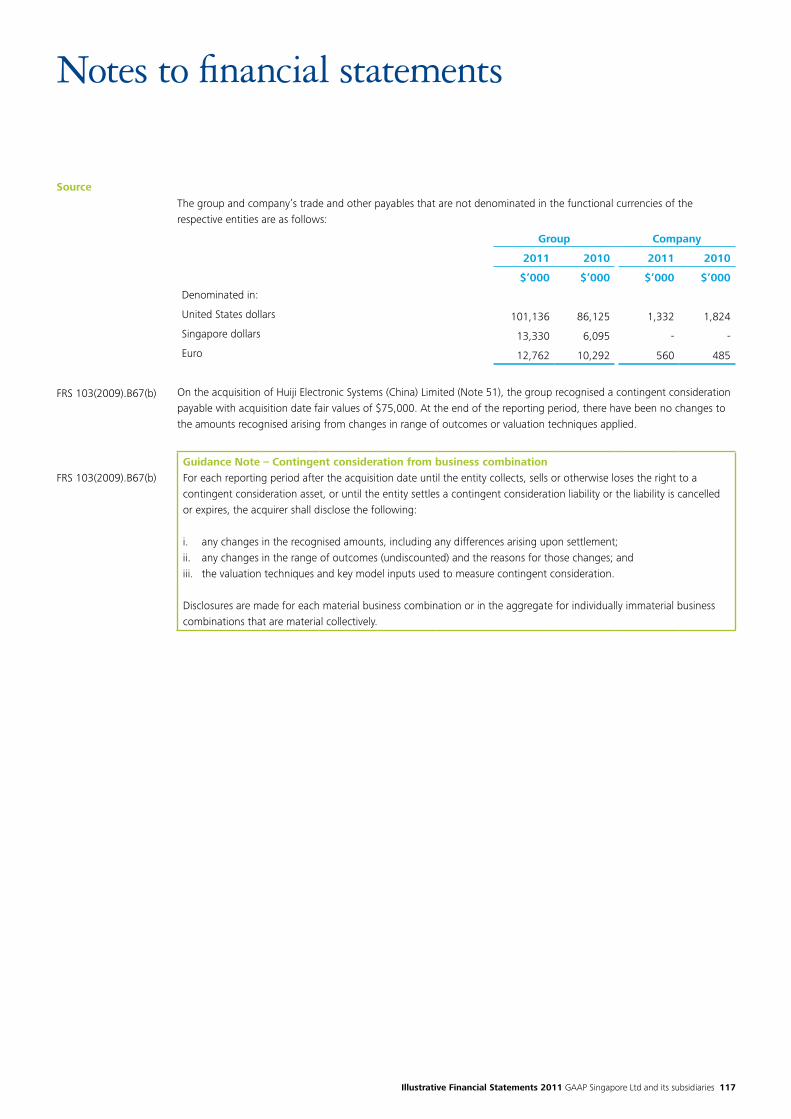
Illustrative Financial Statements 2011 GAAP Singapore Ltd and its subsidiaries 117
Source
Notes to financial statements
The group and company’s trade and other payables that are not denominated in the functional currencies of the respective entities are as follows:
Group Company
2011 2010 2011 2010
$’000 $’000 $’000 $’000
Denominated in:
United States dollars 101,136 86,125 1,332 1,824
Singapore dollars 13,330 6,095 - -
Euro 12,762 10,292 560 485
FRS 103(2009).B67(b) On the acquisition of Huiji Electronic Systems (China) Limited (Note 51), the group recognised a contingent consideration payable with acquisition date fair values of $75,000. At the end of the reporting period, there have been no changes to the amounts recognised arising from changes in range of outcomes or valuation techniques applied.
FRS 103(2009).B67(b)Guidance Note – Contingent consideration from business combinationFor each reporting period after the acquisition date until the entity collects, sells or otherwise loses the right to a contingent consideration asset, or until the entity settles a contingent consideration liability or the liability is cancelled or expires, the acquirer shall disclose the following:
i. any changes in the recognised amounts, including any differences arising upon settlement; ii. any changes in the range of outcomes (undiscounted) and the reasons for those changes; and iii. the valuation techniques and key model inputs used to measure contingent consideration.
Disclosures are made for each material business combination or in the aggregate for individually immaterial business combinations that are material collectively.
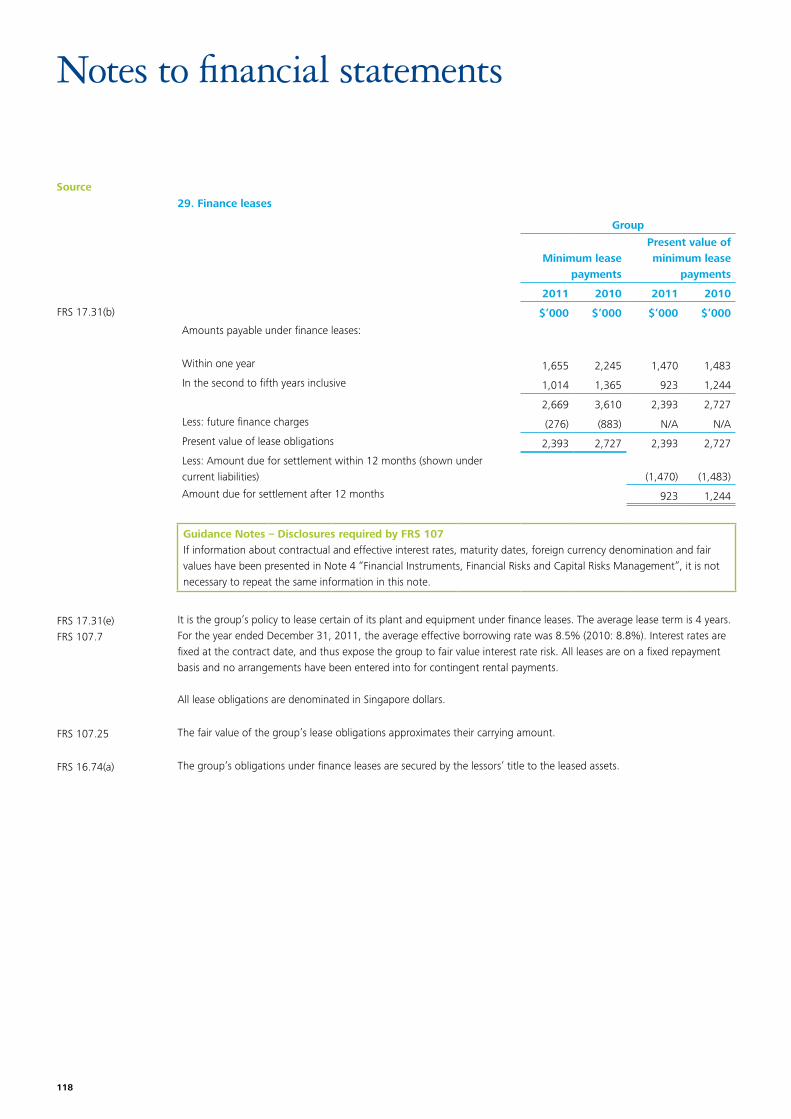
118
Source
Notes to financial statements
29. Finance leases
Group
Minimum lease payments
Present value of minimum lease
payments
2011 2010 2011 2010
FRS 17.31(b) $’000 $’000 $’000 $’000
Amounts payable under finance leases:
Within one year 1,655 2,245 1,470 1,483
In the second to fifth years inclusive 1,014 1,365 923 1,244
2,669 3,610 2,393 2,727
Less: future finance charges (276) (883) N/A N/A
Present value of lease obligations 2,393 2,727 2,393 2,727
Less: Amount due for settlement within 12 months (shown under current liabilities) (1,470) (1,483)
Amount due for settlement after 12 months 923 1,244
Guidance Notes – Disclosures required by FRS 107If information about contractual and effective interest rates, maturity dates, foreign currency denomination and fair values have been presented in Note 4 “Financial Instruments, Financial Risks and Capital Risks Management”, it is not necessary to repeat the same information in this note.
FRS 17.31(e)FRS 107.7
It is the group’s policy to lease certain of its plant and equipment under finance leases. The average lease term is 4 years. For the year ended December 31, 2011, the average effective borrowing rate was 8.5% (2010: 8.8%). Interest rates are fixed at the contract date, and thus expose the group to fair value interest rate risk. All leases are on a fixed repayment basis and no arrangements have been entered into for contingent rental payments.
All lease obligations are denominated in Singapore dollars.
FRS 107.25 The fair value of the group’s lease obligations approximates their carrying amount.
FRS 16.74(a) The group’s obligations under finance leases are secured by the lessors’ title to the leased assets.
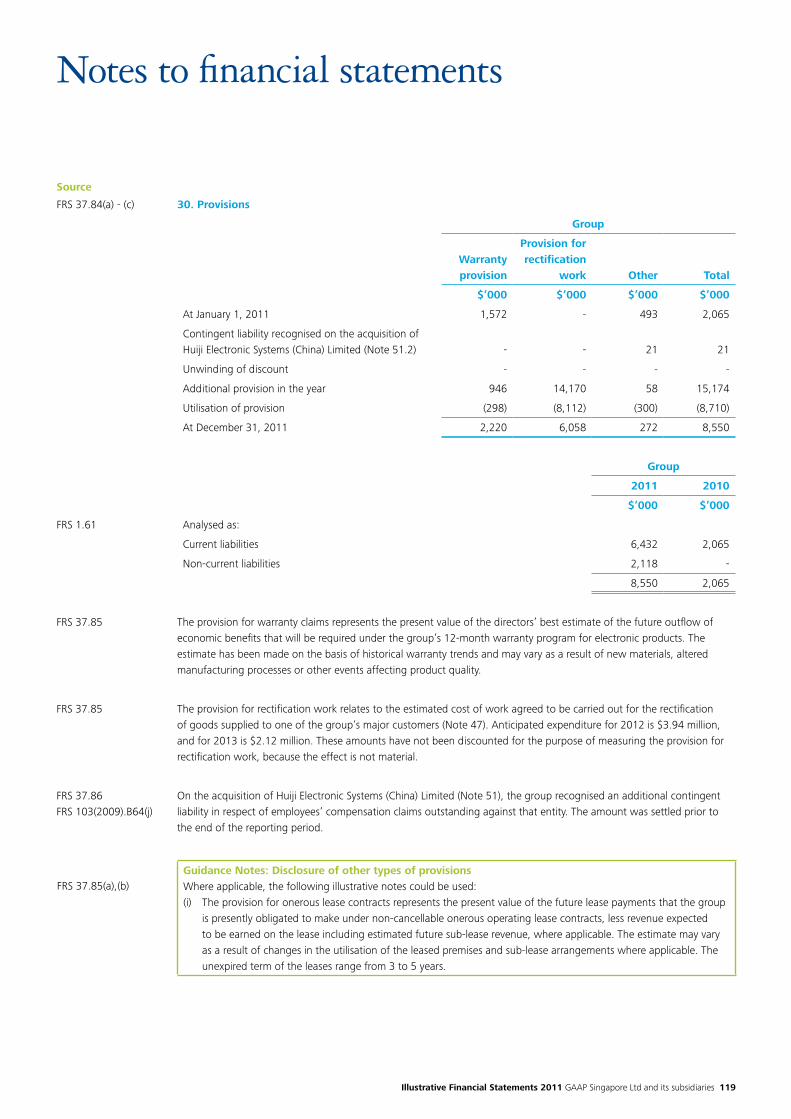
Illustrative Financial Statements 2011 GAAP Singapore Ltd and its subsidiaries 119
Source
Notes to financial statements
FRS 37.84(a) - (c) 30. Provisions
Group
Warranty provision
Provision for rectification
work Other Total
$’000 $’000 $’000 $’000
At January 1, 2011 1,572 - 493 2,065
Contingent liability recognised on the acquisition of Huiji Electronic Systems (China) Limited (Note 51.2) - - 21 21
Unwinding of discount - - - -
Additional provision in the year 946 14,170 58 15,174
Utilisation of provision (298) (8,112) (300) (8,710)
At December 31, 2011 2,220 6,058 272 8,550
Group
2011 2010
$’000 $’000
FRS 1.61 Analysed as:
Current liabilities 6,432 2,065
Non-current liabilities 2,118 -
8,550 2,065
FRS 37.85 The provision for warranty claims represents the present value of the directors’ best estimate of the future outflow of economic benefits that will be required under the group’s 12-month warranty program for electronic products. The estimate has been made on the basis of historical warranty trends and may vary as a result of new materials, altered manufacturing processes or other events affecting product quality.
FRS 37.85 The provision for rectification work relates to the estimated cost of work agreed to be carried out for the rectification of goods supplied to one of the group’s major customers (Note 47). Anticipated expenditure for 2012 is $3.94 million, and for 2013 is $2.12 million. These amounts have not been discounted for the purpose of measuring the provision for rectification work, because the effect is not material.
FRS 37.86FRS 103(2009).B64(j)
On the acquisition of Huiji Electronic Systems (China) Limited (Note 51), the group recognised an additional contingent liability in respect of employees’ compensation claims outstanding against that entity. The amount was settled prior to the end of the reporting period.
Guidance Notes: Disclosure of other types of provisionsWhere applicable, the following illustrative notes could be used:(i) The provision for onerous lease contracts represents the present value of the future lease payments that the group
is presently obligated to make under non-cancellable onerous operating lease contracts, less revenue expected to be earned on the lease including estimated future sub-lease revenue, where applicable. The estimate may vary as a result of changes in the utilisation of the leased premises and sub-lease arrangements where applicable. The unexpired term of the leases range from 3 to 5 years.
FRS 37.85(a),(b)
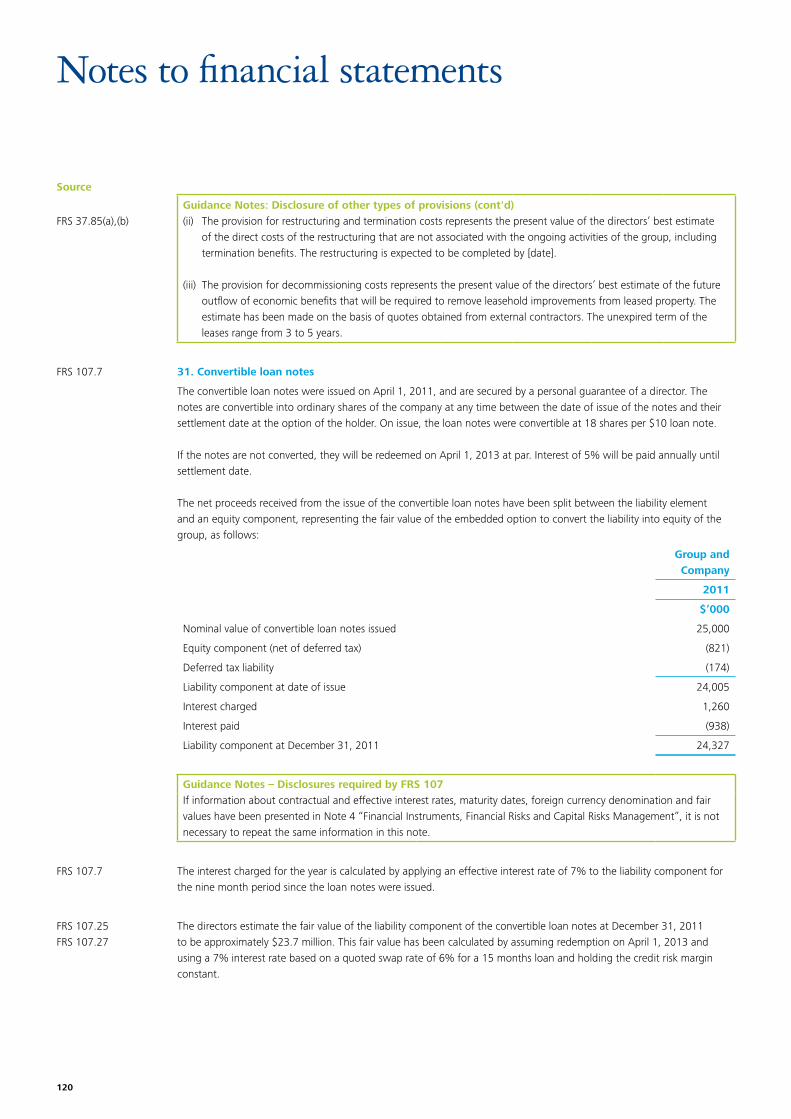
120
Source
Notes to financial statements
FRS 107.7 31. Convertible loan notes
The convertible loan notes were issued on April 1, 2011, and are secured by a personal guarantee of a director. The notes are convertible into ordinary shares of the company at any time between the date of issue of the notes and their settlement date at the option of the holder. On issue, the loan notes were convertible at 18 shares per $10 loan note.
If the notes are not converted, they will be redeemed on April 1, 2013 at par. Interest of 5% will be paid annually until settlement date.
The net proceeds received from the issue of the convertible loan notes have been split between the liability element and an equity component, representing the fair value of the embedded option to convert the liability into equity of the group, as follows:
Group andCompany
2011
$’000
Nominal value of convertible loan notes issued 25,000
Equity component (net of deferred tax) (821)
Deferred tax liability (174)
Liability component at date of issue 24,005
Interest charged 1,260
Interest paid (938)
Liability component at December 31, 2011 24,327
Guidance Notes – Disclosures required by FRS 107If information about contractual and effective interest rates, maturity dates, foreign currency denomination and fair values have been presented in Note 4 “Financial Instruments, Financial Risks and Capital Risks Management”, it is not necessary to repeat the same information in this note.
FRS 107.7 The interest charged for the year is calculated by applying an effective interest rate of 7% to the liability component for the nine month period since the loan notes were issued.
FRS 107.25FRS 107.27
The directors estimate the fair value of the liability component of the convertible loan notes at December 31, 2011 to be approximately $23.7 million. This fair value has been calculated by assuming redemption on April 1, 2013 and using a 7% interest rate based on a quoted swap rate of 6% for a 15 months loan and holding the credit risk margin constant.
FRS 37.85(a),(b)Guidance Notes: Disclosure of other types of provisions (cont'd)(ii) The provision for restructuring and termination costs represents the present value of the directors’ best estimate
of the direct costs of the restructuring that are not associated with the ongoing activities of the group, including termination benefits. The restructuring is expected to be completed by [date].
(iii) The provision for decommissioning costs represents the present value of the directors’ best estimate of the future outflow of economic benefits that will be required to remove leasehold improvements from leased property. The estimate has been made on the basis of quotes obtained from external contractors. The unexpired term of the leases range from 3 to 5 years.
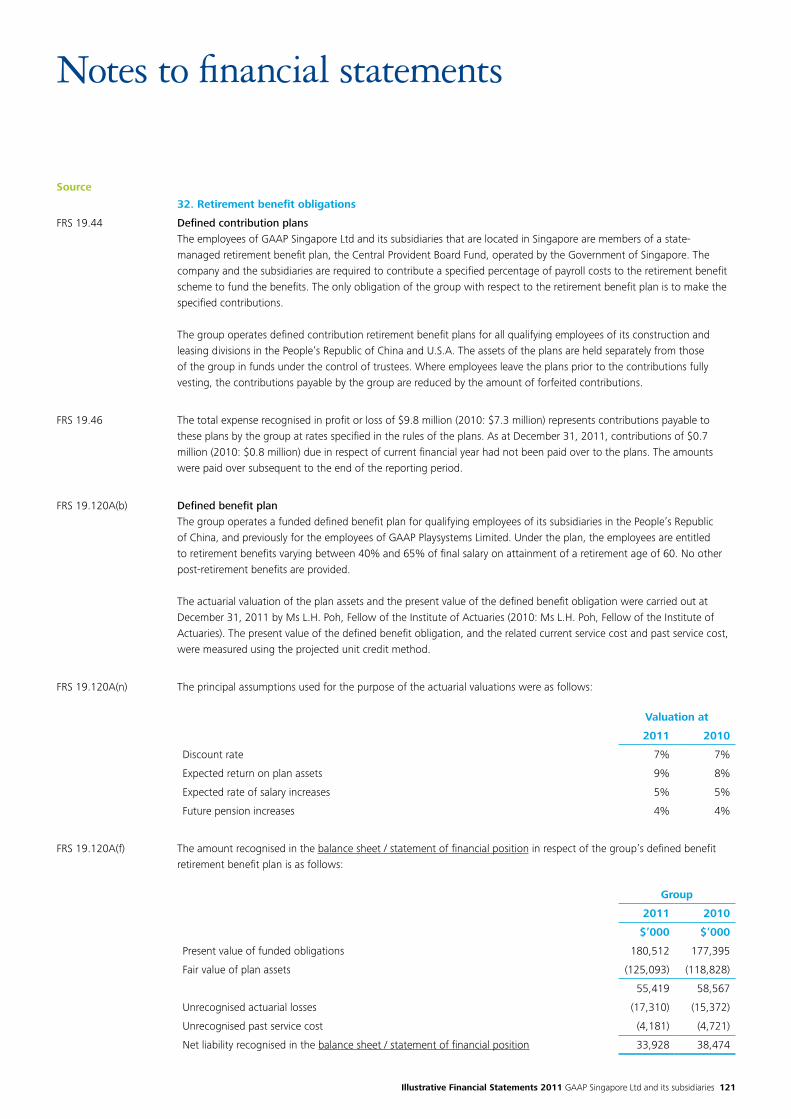
Illustrative Financial Statements 2011 GAAP Singapore Ltd and its subsidiaries 121
Source
Notes to financial statements
32. Retirement benefit obligations
FRS 19.44 Defined contribution plansThe employees of GAAP Singapore Ltd and its subsidiaries that are located in Singapore are members of a state-managed retirement benefit plan, the Central Provident Board Fund, operated by the Government of Singapore. The company and the subsidiaries are required to contribute a specified percentage of payroll costs to the retirement benefit scheme to fund the benefits. The only obligation of the group with respect to the retirement benefit plan is to make the specified contributions.
The group operates defined contribution retirement benefit plans for all qualifying employees of its construction and leasing divisions in the People’s Republic of China and U.S.A. The assets of the plans are held separately from those of the group in funds under the control of trustees. Where employees leave the plans prior to the contributions fully vesting, the contributions payable by the group are reduced by the amount of forfeited contributions.
FRS 19.46 The total expense recognised in profit or loss of $9.8 million (2010: $7.3 million) represents contributions payable to these plans by the group at rates specified in the rules of the plans. As at December 31, 2011, contributions of $0.7 million (2010: $0.8 million) due in respect of current financial year had not been paid over to the plans. The amounts were paid over subsequent to the end of the reporting period.
FRS 19.120A(b) Defined benefit planThe group operates a funded defined benefit plan for qualifying employees of its subsidiaries in the People’s Republic of China, and previously for the employees of GAAP Playsystems Limited. Under the plan, the employees are entitled to retirement benefits varying between 40% and 65% of final salary on attainment of a retirement age of 60. No other post-retirement benefits are provided.
The actuarial valuation of the plan assets and the present value of the defined benefit obligation were carried out at December 31, 2011 by Ms L.H. Poh, Fellow of the Institute of Actuaries (2010: Ms L.H. Poh, Fellow of the Institute of Actuaries). The present value of the defined benefit obligation, and the related current service cost and past service cost, were measured using the projected unit credit method.
FRS 19.120A(n) The principal assumptions used for the purpose of the actuarial valuations were as follows:
Valuation at
2011 2010
Discount rate 7% 7%
Expected return on plan assets 9% 8%
Expected rate of salary increases 5% 5%
Future pension increases 4% 4%
FRS 19.120A(f) The amount recognised in the balance sheet / statement of financial position in respect of the group’s defined benefit retirement benefit plan is as follows:
Group
2011 2010
$’000 $’000
Present value of funded obligations 180,512 177,395
Fair value of plan assets (125,093) (118,828)
55,419 58,567
Unrecognised actuarial losses (17,310) (15,372)
Unrecognised past service cost (4,181) (4,721)
Net liability recognised in the balance sheet / statement of financial position 33,928 38,474
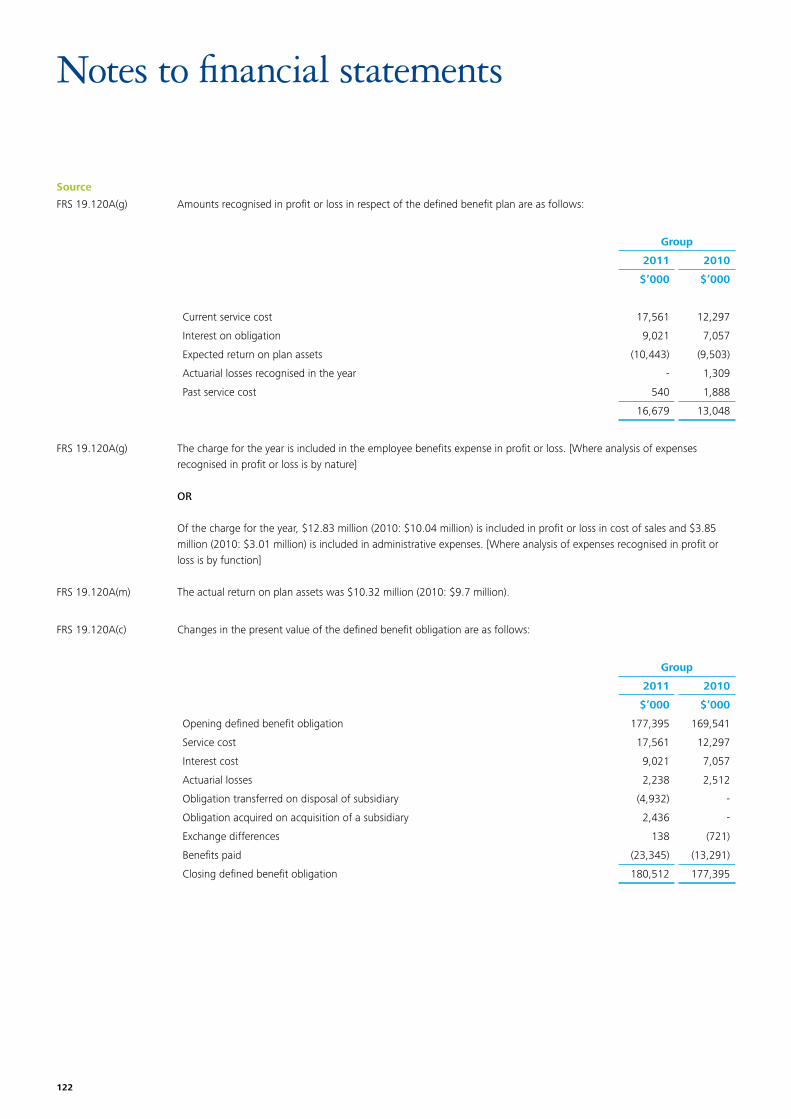
122
Source
Notes to financial statements
FRS 19.120A(g) Amounts recognised in profit or loss in respect of the defined benefit plan are as follows:
Group
2011 2010
$’000 $’000
Current service cost 17,561 12,297
Interest on obligation 9,021 7,057
Expected return on plan assets (10,443) (9,503)
Actuarial losses recognised in the year - 1,309
Past service cost 540 1,888
16,679 13,048
FRS 19.120A(g)
FRS 19.120A(m)
The charge for the year is included in the employee benefits expense in profit or loss. [Where analysis of expenses recognised in profit or loss is by nature]
OR
Of the charge for the year, $12.83 million (2010: $10.04 million) is included in profit or loss in cost of sales and $3.85 million (2010: $3.01 million) is included in administrative expenses. [Where analysis of expenses recognised in profit or loss is by function]
The actual return on plan assets was $10.32 million (2010: $9.7 million).
FRS 19.120A(c) Changes in the present value of the defined benefit obligation are as follows:
Group
2011 2010
$’000 $’000
Opening defined benefit obligation 177,395 169,541
Service cost 17,561 12,297
Interest cost 9,021 7,057
Actuarial losses 2,238 2,512
Obligation transferred on disposal of subsidiary (4,932) -
Obligation acquired on acquisition of a subsidiary 2,436 -
Exchange differences 138 (721)
Benefits paid (23,345) (13,291)
Closing defined benefit obligation 180,512 177,395
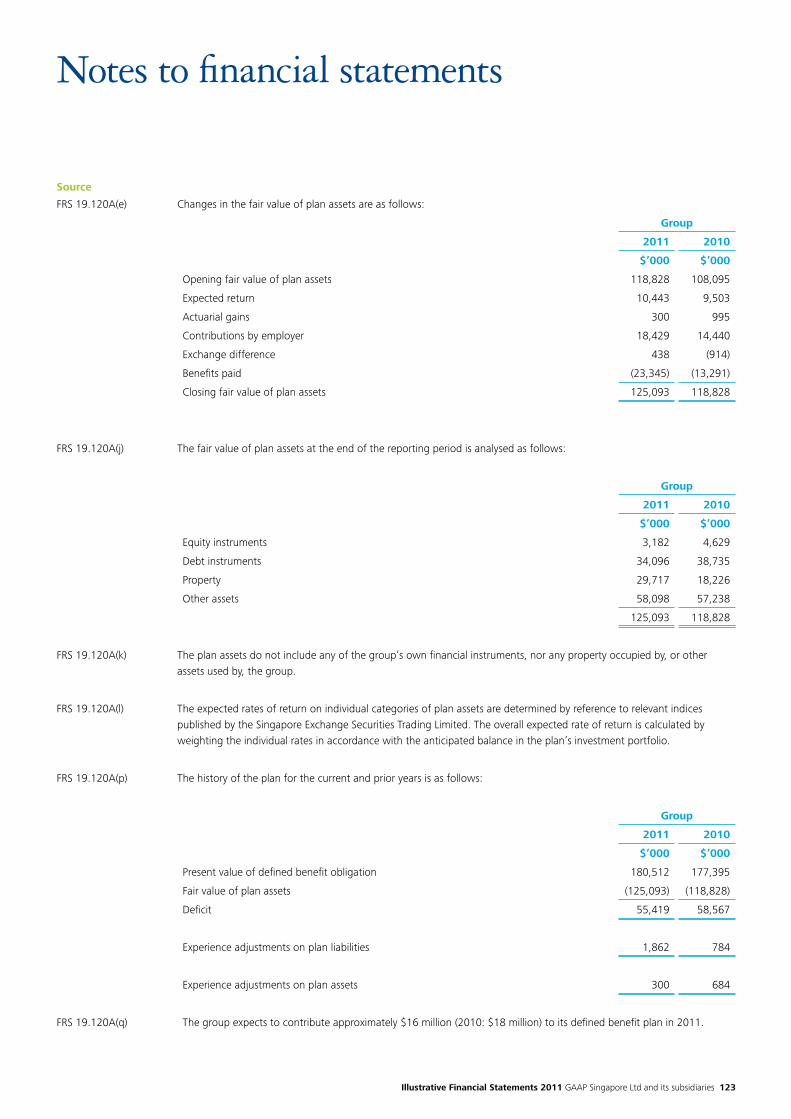
Illustrative Financial Statements 2011 GAAP Singapore Ltd and its subsidiaries 123
Source
Notes to financial statements
FRS 19.120A(e) Changes in the fair value of plan assets are as follows:
Group
2011 2010
$’000 $’000
Opening fair value of plan assets 118,828 108,095
Expected return 10,443 9,503
Actuarial gains 300 995
Contributions by employer 18,429 14,440
Exchange difference 438 (914)
Benefits paid (23,345) (13,291)
Closing fair value of plan assets 125,093 118,828
FRS 19.120A(j) The fair value of plan assets at the end of the reporting period is analysed as follows:
Group
2011 2010
$’000 $’000
Equity instruments 3,182 4,629
Debt instruments 34,096 38,735
Property 29,717 18,226
Other assets 58,098 57,238
125,093 118,828
FRS 19.120A(k) The plan assets do not include any of the group’s own financial instruments, nor any property occupied by, or other assets used by, the group.
FRS 19.120A(l) The expected rates of return on individual categories of plan assets are determined by reference to relevant indices published by the Singapore Exchange Securities Trading Limited. The overall expected rate of return is calculated by weighting the individual rates in accordance with the anticipated balance in the plan’s investment portfolio.
FRS 19.120A(p) The history of the plan for the current and prior years is as follows:
Group
2011 2010
$’000 $’000
Present value of defined benefit obligation 180,512 177,395
Fair value of plan assets (125,093) (118,828)
Deficit 55,419 58,567
Experience adjustments on plan liabilities 1,862 784
Experience adjustments on plan assets 300 684
FRS 19.120A(q) The group expects to contribute approximately $16 million (2010: $18 million) to its defined benefit plan in 2011.
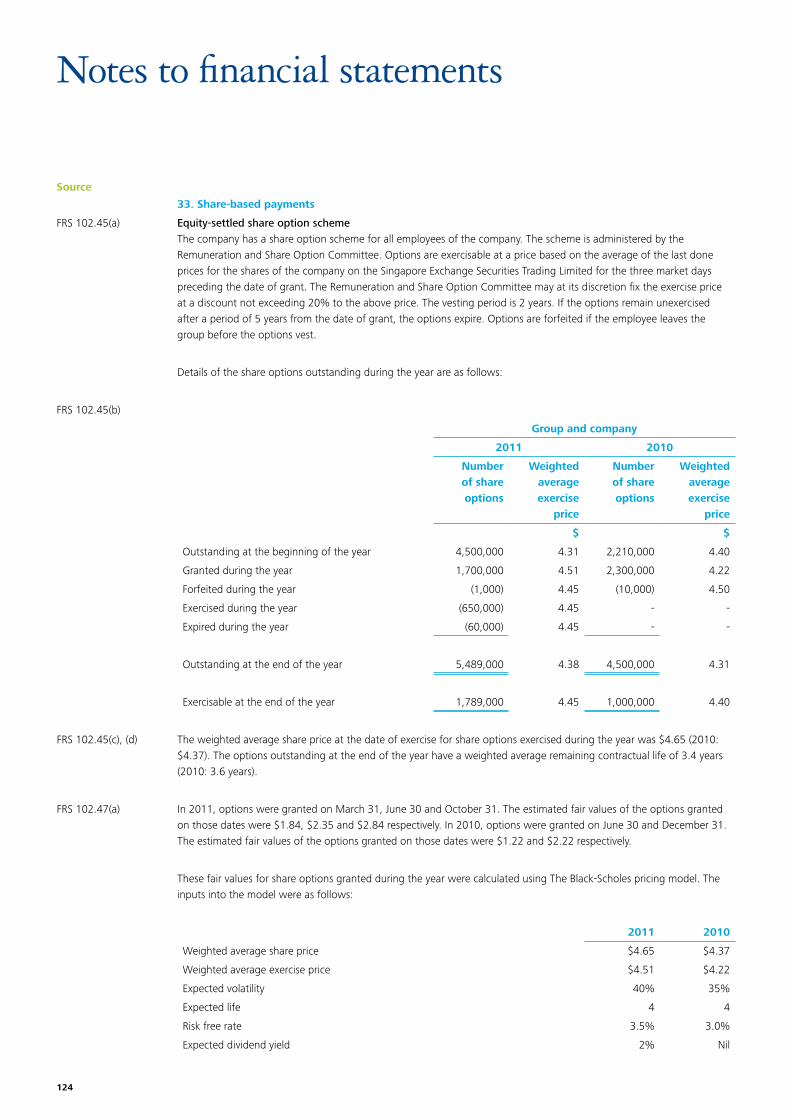
124
Source
Notes to financial statements
33. Share-based payments
FRS 102.45(a) Equity-settled share option schemeThe company has a share option scheme for all employees of the company. The scheme is administered by the Remuneration and Share Option Committee. Options are exercisable at a price based on the average of the last done prices for the shares of the company on the Singapore Exchange Securities Trading Limited for the three market days preceding the date of grant. The Remuneration and Share Option Committee may at its discretion fix the exercise price at a discount not exceeding 20% to the above price. The vesting period is 2 years. If the options remain unexercised after a period of 5 years from the date of grant, the options expire. Options are forfeited if the employee leaves the group before the options vest.
Details of the share options outstanding during the year are as follows:
FRS 102.45(b)
Group and company
2011 2010
Number of share options
Weighted average exercise
price
Number of share options
Weighted average exercise
price
$ $
Outstanding at the beginning of the year 4,500,000 4.31 2,210,000 4.40
Granted during the year 1,700,000 4.51 2,300,000 4.22
Forfeited during the year (1,000) 4.45 (10,000) 4.50
Exercised during the year (650,000) 4.45 - -
Expired during the year (60,000) 4.45 - -
Outstanding at the end of the year 5,489,000 4.38 4,500,000 4.31
Exercisable at the end of the year 1,789,000 4.45 1,000,000 4.40
FRS 102.45(c), (d) The weighted average share price at the date of exercise for share options exercised during the year was $4.65 (2010: $4.37). The options outstanding at the end of the year have a weighted average remaining contractual life of 3.4 years (2010: 3.6 years).
FRS 102.47(a) In 2011, options were granted on March 31, June 30 and October 31. The estimated fair values of the options granted on those dates were $1.84, $2.35 and $2.84 respectively. In 2010, options were granted on June 30 and December 31. The estimated fair values of the options granted on those dates were $1.22 and $2.22 respectively.
These fair values for share options granted during the year were calculated using The Black-Scholes pricing model. The inputs into the model were as follows:
2011 2010
Weighted average share price $4.65 $4.37
Weighted average exercise price $4.51 $4.22
Expected volatility 40% 35%
Expected life 4 4
Risk free rate 3.5% 3.0%
Expected dividend yield 2% Nil
Illustrative Financial Statements 2011 GAAP Singapore Ltd and its subsidiaries 125
Source
Notes to financial statements
FRS 102.47(a) Expected volatility was determined by calculating the historical volatility of the company’s share price over the previous 4 years. The expected life used in the model has been adjusted, based on management’s best estimate, for the effects of non transferability, exercise restrictions and behavioural considerations.
FRS 102.51(a) The group and the company recognised total expenses of $2.86 million (2010:$1.2 million) related to equity-settled share-based payment transactions during the year.
Guidance Notes – Share based payment modificationsFRS 102.47(c) requires that for share-based payment arrangements that were modified during the period, the entity is required to disclose:(i) an explanation of those modifications;(ii) the incremental fair value granted (as a result of those modifications); and(iii) information of how the incremental fair value granted was measured, consistently with the requirements set out in
FRS 102.47(a) & (b).
FRS 102.45(a) FRS 102.51(a), (b)
Cash-settled share-based paymentsThe group issued to certain employees share appreciation rights (“SARs”) that require the group to pay the intrinsic value of the SAR to the employee at the date of exercise. At December 31, 2011, the group and the company have recorded liabilities of $6.53 million (2010: $3.52 million). The fair value of the SARs is determined using the Black-Scholes pricing model using the assumptions noted above. The group and the company recorded total expenses of $3.01 million (2010: $3.52 million) during the year in respect of SARs. At December 31, 2011, the total intrinsic value of the vested SARs was Nil (2010: $Nil).
FRS 102.45(a) Other share-based payment planUnder the company’s employee share purchase plan, all employees may purchase the company’s shares at 85% of the closing market price on the date of grant during a two-week period each year. Employees may purchase shares having a value not exceeding 15% of their gross compensation during the offering period. The shares so purchased are generally placed in the employees share savings plan and will only be released to employees who remain in the company’s employment for a period of three years from the date of grant. Pursuant to the plan, the company issued 1,000,000 shares (2010: Nil) during the year, at an average share price of $4.65 (2010: $Nil). The discount of $0.7 million (2010: $Nil) will be expensed over the vesting period of 3 years.
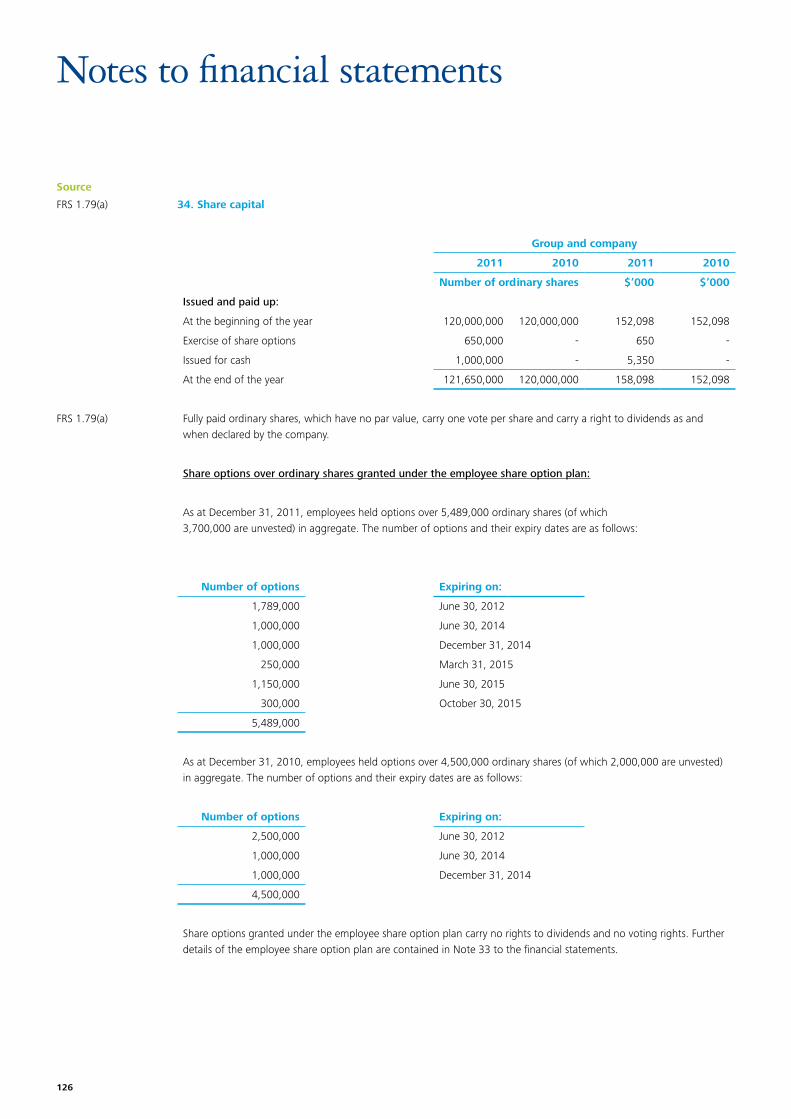
126
Source
Notes to financial statements
FRS 1.79(a) 34. Share capital
Group and company
2011 2010 2011 2010
Number of ordinary shares $’000 $’000
Issued and paid up:
At the beginning of the year 120,000,000 120,000,000 152,098 152,098
Exercise of share options 650,000 - 650 -
Issued for cash 1,000,000 - 5,350 -
At the end of the year 121,650,000 120,000,000 158,098 152,098
FRS 1.79(a) Fully paid ordinary shares, which have no par value, carry one vote per share and carry a right to dividends as and when declared by the company.
Share options over ordinary shares granted under the employee share option plan:
As at December 31, 2011, employees held options over 5,489,000 ordinary shares (of which 3,700,000 are unvested) in aggregate. The number of options and their expiry dates are as follows:
Number of options Expiring on:
1,789,000 June 30, 2012
1,000,000 June 30, 2014
1,000,000 December 31, 2014
250,000 March 31, 2015
1,150,000 June 30, 2015
300,000 October 30, 2015
5,489,000
As at December 31, 2010, employees held options over 4,500,000 ordinary shares (of which 2,000,000 are unvested) in aggregate. The number of options and their expiry dates are as follows:
Number of options Expiring on:
2,500,000 June 30, 2012
1,000,000 June 30, 2014
1,000,000 December 31, 2014
4,500,000
Share options granted under the employee share option plan carry no rights to dividends and no voting rights. Further details of the employee share option plan are contained in Note 33 to the financial statements.
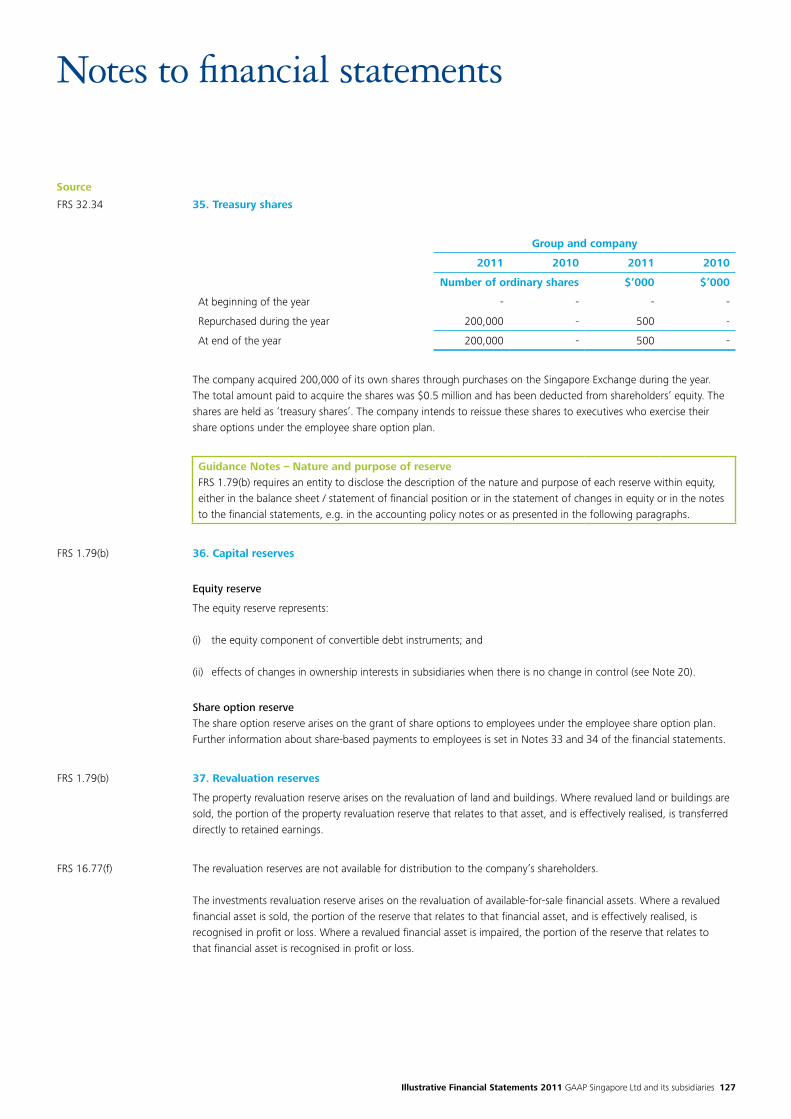
Illustrative Financial Statements 2011 GAAP Singapore Ltd and its subsidiaries 127
Source
Notes to financial statements
FRS 32.34 35. Treasury shares
Group and company
2011 2010 2011 2010
Number of ordinary shares $’000 $’000
At beginning of the year - - - -
Repurchased during the year 200,000 - 500 -
At end of the year 200,000 - 500 -
The company acquired 200,000 of its own shares through purchases on the Singapore Exchange during the year. The total amount paid to acquire the shares was $0.5 million and has been deducted from shareholders’ equity. The shares are held as ‘treasury shares’. The company intends to reissue these shares to executives who exercise their share options under the employee share option plan.
Guidance Notes – Nature and purpose of reserveFRS 1.79(b) requires an entity to disclose the description of the nature and purpose of each reserve within equity, either in the balance sheet / statement of financial position or in the statement of changes in equity or in the notes to the financial statements, e.g. in the accounting policy notes or as presented in the following paragraphs.
FRS 1.79(b) 36. Capital reserves
Equity reserve
The equity reserve represents:
(i) the equity component of convertible debt instruments; and
(ii) effects of changes in ownership interests in subsidiaries when there is no change in control (see Note 20).
Share option reserveThe share option reserve arises on the grant of share options to employees under the employee share option plan. Further information about share-based payments to employees is set in Notes 33 and 34 of the financial statements.
FRS 1.79(b) 37. Revaluation reserves
The property revaluation reserve arises on the revaluation of land and buildings. Where revalued land or buildings are sold, the portion of the property revaluation reserve that relates to that asset, and is effectively realised, is transferred directly to retained earnings.
FRS 16.77(f) The revaluation reserves are not available for distribution to the company’s shareholders.
The investments revaluation reserve arises on the revaluation of available-for-sale financial assets. Where a revalued financial asset is sold, the portion of the reserve that relates to that financial asset, and is effectively realised, is recognised in profit or loss. Where a revalued financial asset is impaired, the portion of the reserve that relates to that financial asset is recognised in profit or loss.

128
Source
Notes to financial statements
38. Hedging and translation reserves
FRS 1.79(b) The hedging reserve represents hedging gains and losses recognised on the effective potion of cash flow hedges. The cumulative deferred gain or loss on the hedge recognised in other comprehensive income and accumulated in hedging reserves is reclassified to profit or loss when the hedged transaction impacts the profit or loss, or is included as a basis adjustment to the non-financial hedged item, consistent with the applicable accounting policy.
Exchange differences relating to the translation from the functional currencies of the group’s foreign subsidiaries into Singapore dollars are brought to account by recognising those exchange differences in other comprehensive income and accumulating them in a separate component of equity under the header of foreign currency translation reserves. Gains and losses on hedging instruments that are designated as hedges of net investments in foreign operations are also recognised in other comprehensive income and accumulated in a separate component of equity under the header of foreign currency translation reserves.
FRS 1.92 39. Components of other comprehensive income
Group
2011 2010
$’000 $’000
Revaluation of property:
Gain (loss) on revaluation of property 64,709 (4,428)
(Deferred tax liability arising) reversal of deferred tax liability on revaluation of land and buildings
(3,692) 320
Cash flow hedges:
FRS 107.23(d) Gains arising during the year 1,723 1,623
FRS 107.23(e) Reclassification to profit or loss from equity on cash flow hedges (995) (895)
FRS 107.20(a) Transfer to initial carrying amount of non-financial hedged item on cash flow hedges (218) (118)
Available-for-sale investments:
Gains arising during the year 251 151
Reclassification to profit or loss from equity on disposal of available-for-sale investments (611) (511)
Exchange differences on translation of foreign operations (12,127) 2,706
Other comprehensive income for the year, net of tax 49,040 (1,152)
Guidance Notes – Reclassification adjustmentsFRS 1.94 allows an entity to present reclassification adjustments in the statement of comprehensive income or in the notes. An entity presenting reclassification adjustments in the notes presents the components of other comprehensive income after any related reclassification adjustments.
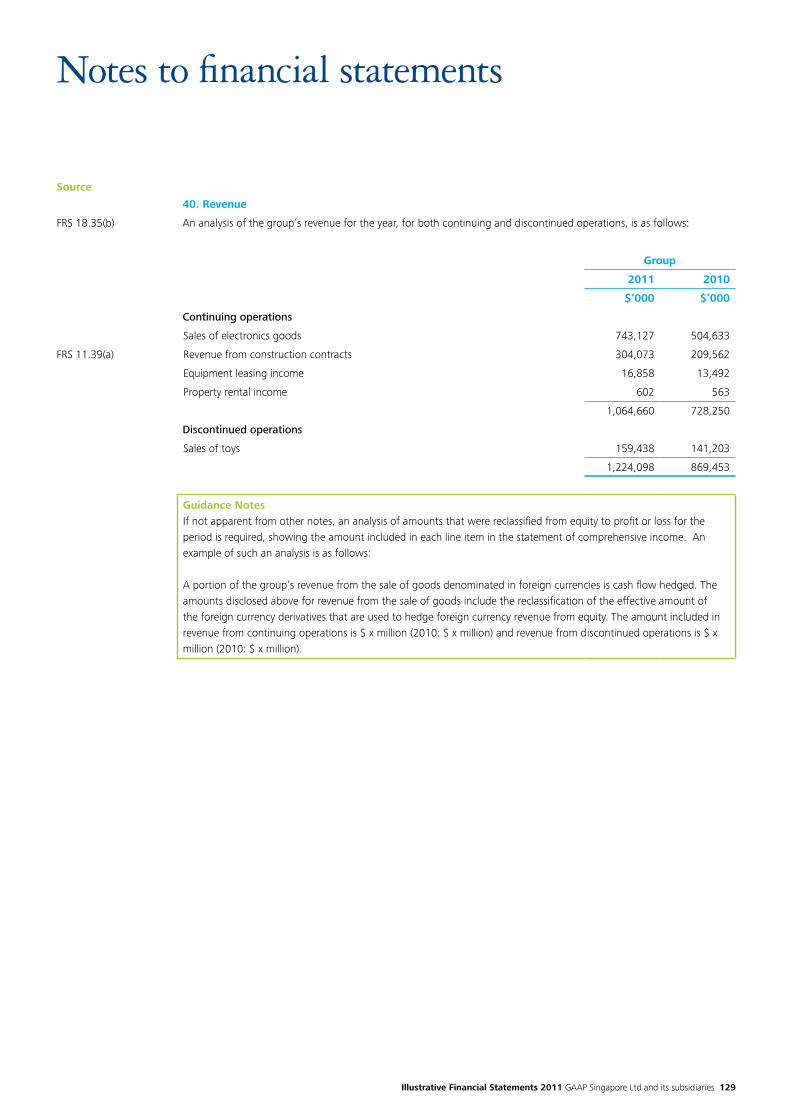
Illustrative Financial Statements 2011 GAAP Singapore Ltd and its subsidiaries 129
Source
Notes to financial statements
40. Revenue
FRS 18.35(b) An analysis of the group’s revenue for the year, for both continuing and discontinued operations, is as follows:
Group
2011 2010
$’000 $’000
Continuing operations
Sales of electronics goods 743,127 504,633
FRS 11.39(a) Revenue from construction contracts 304,073 209,562
Equipment leasing income 16,858 13,492
Property rental income 602 563
1,064,660 728,250
Discontinued operations
Sales of toys 159,438 141,203
1,224,098 869,453
Guidance NotesIf not apparent from other notes, an analysis of amounts that were reclassified from equity to profit or loss for the period is required, showing the amount included in each line item in the statement of comprehensive income. An example of such an analysis is as follows:
A portion of the group’s revenue from the sale of goods denominated in foreign currencies is cash flow hedged. The amounts disclosed above for revenue from the sale of goods include the reclassification of the effective amount of the foreign currency derivatives that are used to hedge foreign currency revenue from equity. The amount included in revenue from continuing operations is $ x million (2010: $ x million) and revenue from discontinued operations is $ x million (2010: $ x million).
130
Source
Notes to financial statements
41. Segment information
Guidance Notes:The following segment information is required by FRS 108 Operating Segments, to be presented in the consolidated financial statements of a group with a parent (and in the separate or individual financial statements of an entity):•whosedebtorequityinstrumentsaretradedinapublicmarket;or•thatfiles,orisintheprocessoffiling,its(consolidated)financialstatementswithasecuritiescommissionorother
regulatory organisation for the purpose of issuing any class of instruments in a public market.
Products and services from which reportable segments derive their revenues
FRS 108.22 In prior years, segment information reported externally was analysed on the basis of the types of goods supplied and services provided by the group’s operating divisions (i.e. electronic goods, construction services, and leasing services). However, information reported to the group’s chief operating decision maker for the purposes of resource allocation and assessment of segment performance is more specifically focused on the category of customer for each type of goods and services. The principal categories of customer for these goods and services are corporate customers, government customers, wholesale customers and retail customers. The group’s reportable segments under FRS 108 are therefore as follows:
Electronic equipment – corporate customers
– government customers
– wholesale customers
– retail customers
Construction services – corporate customers
– government customers
Leasing services – corporate customers
– government customers
– retail customers
FRS 108.16 The electronic equipment segment supply industrial electronic equipment to support the operations of heavy industrial machinery, military equipment and automotives, electronic security systems and office electronic equipment (calculators, computer peripherals etc). It also supplied electronic toys prior to discontinuation (see below).
In prior years, the group was involved in the manufacture and sale of electronic toys, which was reported under the electronic goods segment under FRS 14. That operation was discontinued with effect from November 30, 2011 (see note 46). For FRS 108 purposes, the electronic toy operation is included in the electronic equipment reportable segments.
Information regarding the group’s reportable segments is presented below. Amounts reported for the prior year have been restated to conform to the requirements of FRS 108.
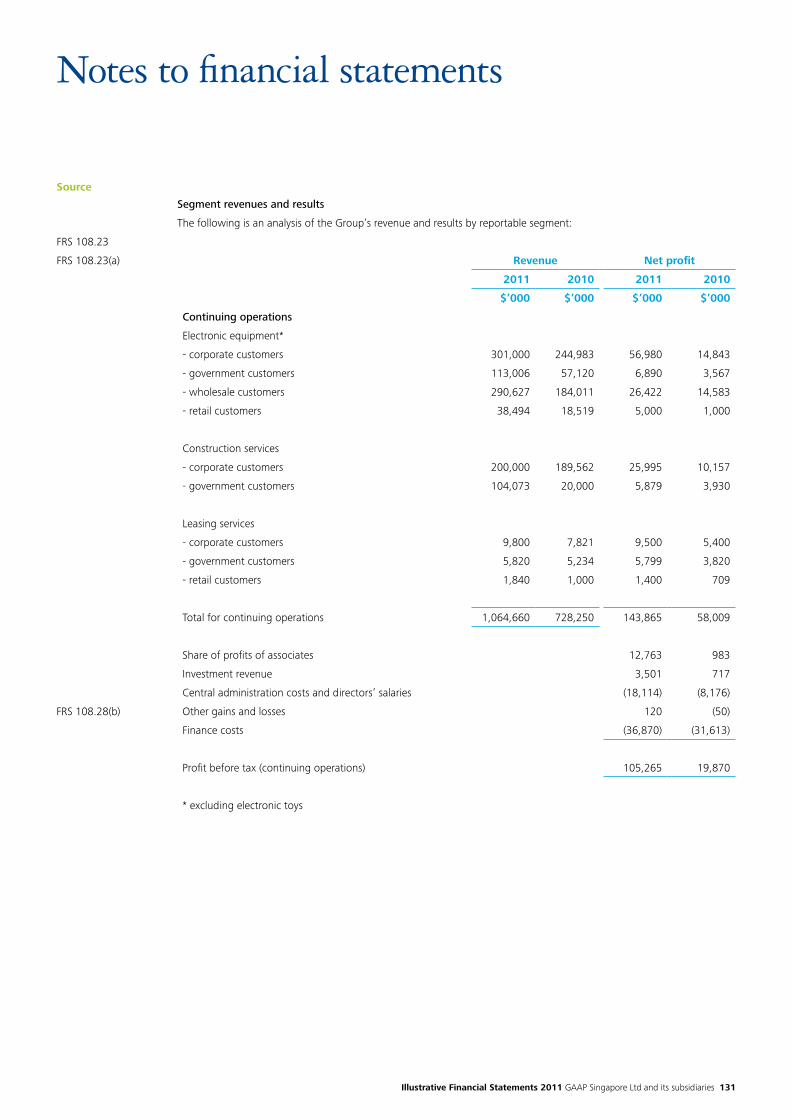
Illustrative Financial Statements 2011 GAAP Singapore Ltd and its subsidiaries 131
Source
Notes to financial statements
Segment revenues and results
The following is an analysis of the Group’s revenue and results by reportable segment:
FRS 108.23
FRS 108.23(a) Revenue Net profit
2011 2010 2011 2010
$’000 $’000 $’000 $’000
Continuing operations
Electronic equipment*
- corporate customers 301,000 244,983 56,980 14,843
- government customers 113,006 57,120 6,890 3,567
- wholesale customers 290,627 184,011 26,422 14,583
- retail customers 38,494 18,519 5,000 1,000
Construction services
- corporate customers 200,000 189,562 25,995 10,157
- government customers 104,073 20,000 5,879 3,930
Leasing services
- corporate customers 9,800 7,821 9,500 5,400
- government customers 5,820 5,234 5,799 3,820
- retail customers 1,840 1,000 1,400 709
Total for continuing operations 1,064,660 728,250 143,865 58,009
Share of profits of associates 12,763 983
Investment revenue 3,501 717
Central administration costs and directors’ salaries (18,114) (8,176)
FRS 108.28(b) Other gains and losses 120 (50)
Finance costs (36,870) (31,613)
Profit before tax (continuing operations) 105,265 19,870
* excluding electronic toys
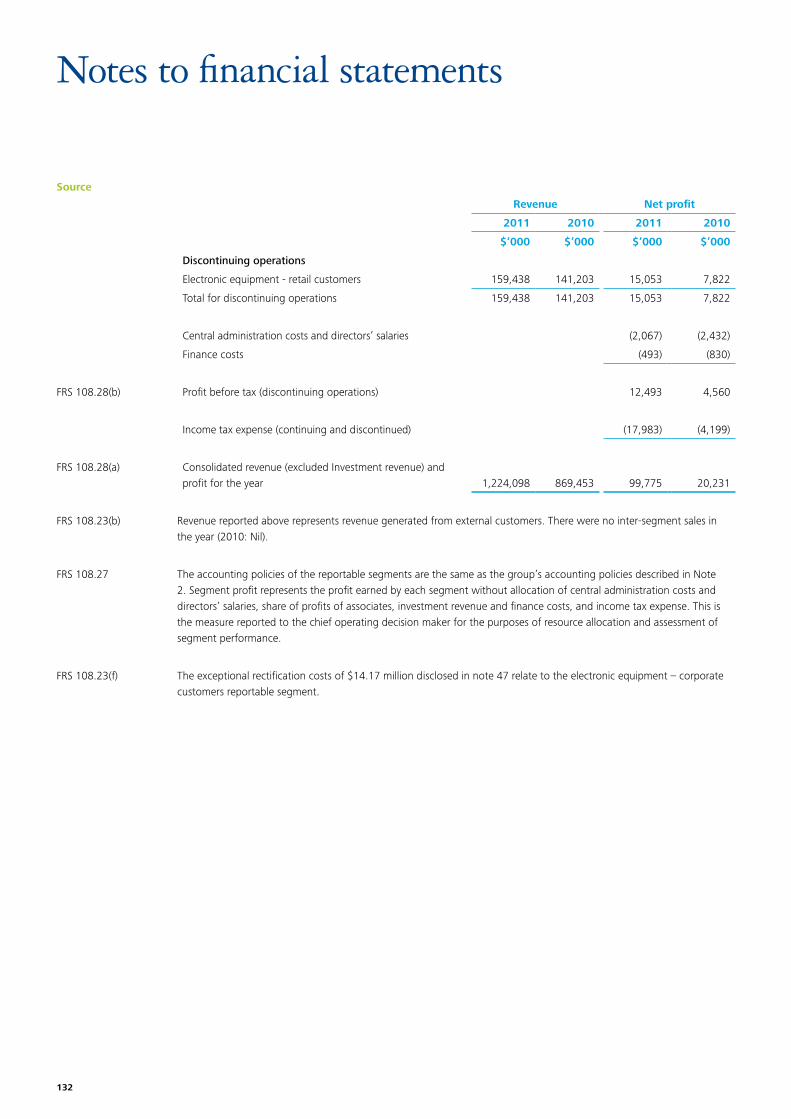
132
Source
Notes to financial statements
Revenue Net profit
2011 2010 2011 2010
$’000 $’000 $’000 $’000
Discontinuing operations
Electronic equipment - retail customers 159,438 141,203 15,053 7,822
Total for discontinuing operations 159,438 141,203 15,053 7,822
Central administration costs and directors’ salaries (2,067) (2,432)
Finance costs (493) (830)
FRS 108.28(b) Profit before tax (discontinuing operations) 12,493 4,560
Income tax expense (continuing and discontinued) (17,983) (4,199)
FRS 108.28(a) Consolidated revenue (excluded Investment revenue) and profit for the year 1,224,098 869,453 99,775 20,231
FRS 108.23(b) Revenue reported above represents revenue generated from external customers. There were no inter-segment sales in the year (2010: Nil).
FRS 108.27 The accounting policies of the reportable segments are the same as the group’s accounting policies described in Note 2. Segment profit represents the profit earned by each segment without allocation of central administration costs and directors’ salaries, share of profits of associates, investment revenue and finance costs, and income tax expense. This is the measure reported to the chief operating decision maker for the purposes of resource allocation and assessment of segment performance.
FRS 108.23(f) The exceptional rectification costs of $14.17 million disclosed in note 47 relate to the electronic equipment – corporate customers reportable segment.
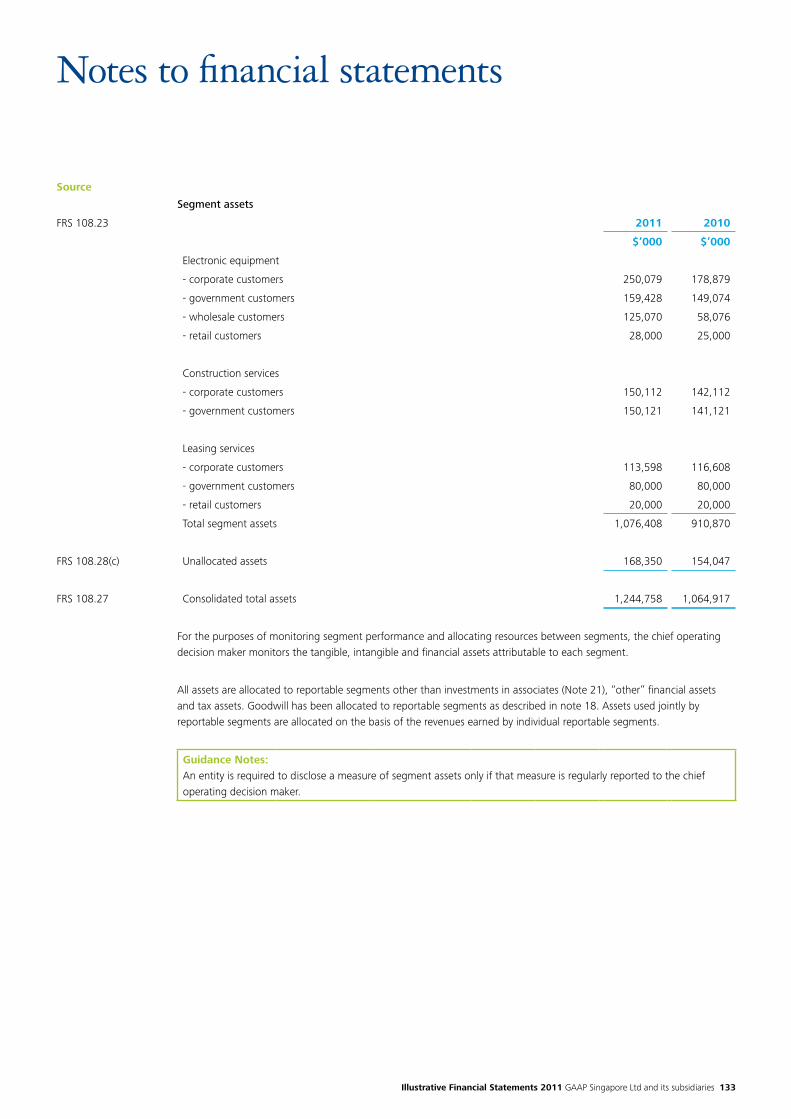
Illustrative Financial Statements 2011 GAAP Singapore Ltd and its subsidiaries 133
Source
Notes to financial statements
Segment assets
FRS 108.23 2011 2010
$’000 $’000
Electronic equipment
- corporate customers 250,079 178,879
- government customers 159,428 149,074
- wholesale customers 125,070 58,076
- retail customers 28,000 25,000
Construction services
- corporate customers 150,112 142,112
- government customers 150,121 141,121
Leasing services
- corporate customers 113,598 116,608
- government customers 80,000 80,000
- retail customers 20,000 20,000
Total segment assets 1,076,408 910,870
FRS 108.28(c) Unallocated assets 168,350 154,047
FRS 108.27 Consolidated total assets 1,244,758 1,064,917
For the purposes of monitoring segment performance and allocating resources between segments, the chief operating decision maker monitors the tangible, intangible and financial assets attributable to each segment.
All assets are allocated to reportable segments other than investments in associates (Note 21), “other” financial assets and tax assets. Goodwill has been allocated to reportable segments as described in note 18. Assets used jointly by reportable segments are allocated on the basis of the revenues earned by individual reportable segments.
Guidance Notes:An entity is required to disclose a measure of segment assets only if that measure is regularly reported to the chief operating decision maker.
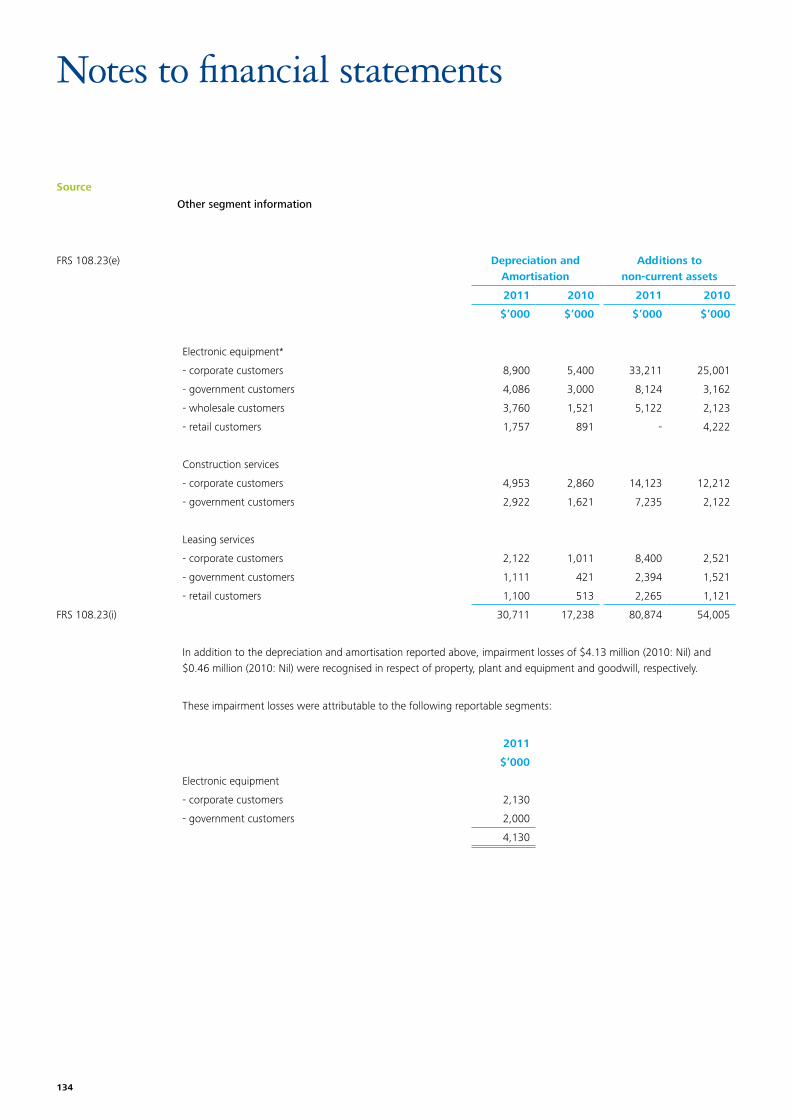
134
Source
Notes to financial statements
Other segment information
FRS 108.23(e) Depreciation and Amortisation
Additions tonon-current assets
2011 2010 2011 2010
$’000 $’000 $’000 $’000
Electronic equipment*
- corporate customers 8,900 5,400 33,211 25,001
- government customers 4,086 3,000 8,124 3,162
- wholesale customers 3,760 1,521 5,122 2,123
- retail customers 1,757 891 - 4,222
Construction services
- corporate customers 4,953 2,860 14,123 12,212
- government customers 2,922 1,621 7,235 2,122
Leasing services
- corporate customers 2,122 1,011 8,400 2,521
- government customers 1,111 421 2,394 1,521
- retail customers 1,100 513 2,265 1,121
FRS 108.23(i) 30,711 17,238 80,874 54,005
In addition to the depreciation and amortisation reported above, impairment losses of $4.13 million (2010: Nil) and $0.46 million (2010: Nil) were recognised in respect of property, plant and equipment and goodwill, respectively.
These impairment losses were attributable to the following reportable segments:
2011
$’000
Electronic equipment
- corporate customers 2,130
- government customers 2,000
4,130

Illustrative Financial Statements 2011 GAAP Singapore Ltd and its subsidiaries 135
Source
Notes to financial statements
FRS 108.32 Revenues from major products and services
The Group’s revenues from its major products and services were as follows:
2011 2010
$’000 $’000
Continuing operations
Industrial electronic equipment 377,088 234,069
Electronic security equipment 271,112 178,085
Office electronic equipment 94,927 92,479
Construction of residential properties 204,073 109,562
Construction of commercial properties 100,000 100,000
Leasing of storage equipment 17,460 14,055
1,064,660 728,250
Discontinuing operations
Electronic toys 159,438 141,203
Consolidated revenue (excluding investment revenue) 1,224,098 869,453
Geographical information
The group’s operates in four principal geographical areas – U.S.A., Singapore (country of domicile), Malaysia and South Korea.
FRS 108.33(a), (b) The group’s revenue from external customers and information about its segment assets (non-current assets excluding investments in associates, finance lease receivables and “other” financial assets) by geographical location are detailed below:
Revenue from external customers
Non-currentassets
Based on location of customer 2011 2010 2011 2010
$’000 $’000 $’000 $’000
U.S.A. 822,699 584,347 349,261 325,787
Singapore 171,486 121,803 218,551 118,446
Malaysia 52,701 37,432 101,501 127,850
SouthKorea 137,892 97,942 20,000 20,000
Others 39,320 27,929 10,000 10,000
1,224,098 869,453 699,313 602,083
Information about major customers
FRS 108.34 Included in revenues arising from sales of electronic equipment to government customers of $113 million (2010: $57.1 million) are revenues of approximately $110 million (2010: $57 million) which arose from sales to the group’s largest customer.
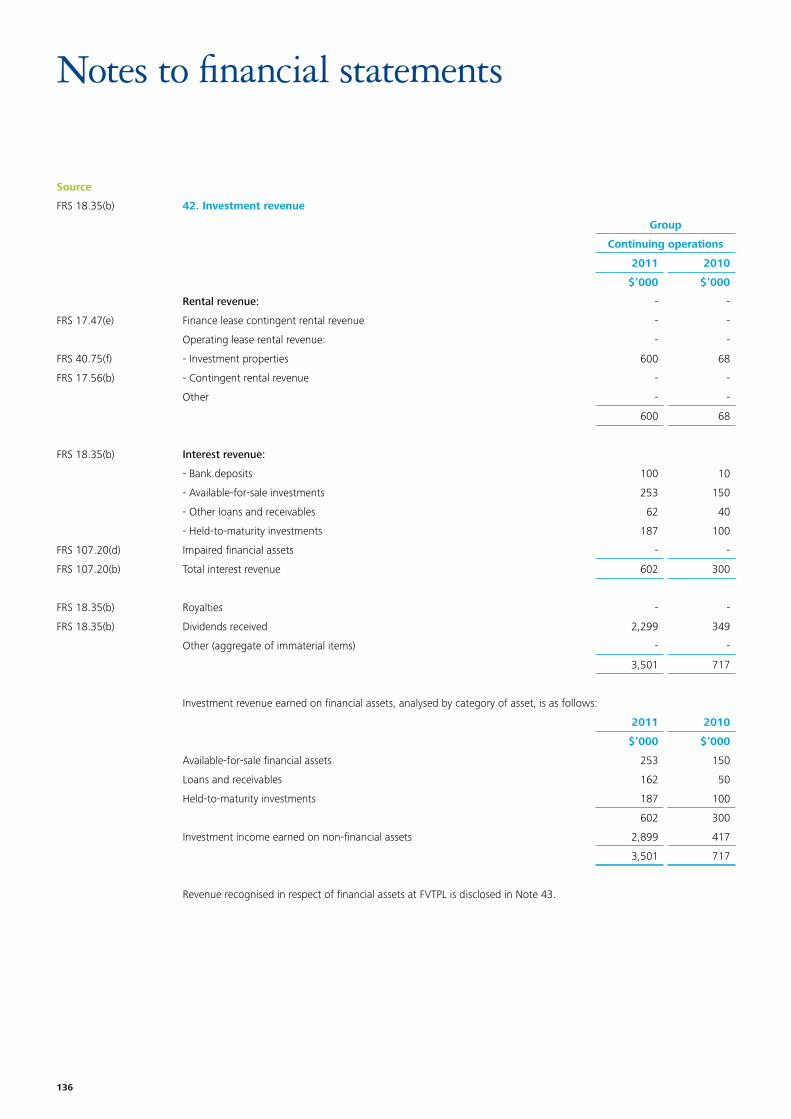
136
Source
Notes to financial statements
FRS 18.35(b) 42. Investment revenue
Group
Continuing operations
2011 2010
$’000 $’000
Rental revenue: - -
FRS 17.47(e) Finance lease contingent rental revenue - -
Operating lease rental revenue: - -
FRS 40.75(f) - Investment properties 600 68
FRS 17.56(b) - Contingent rental revenue - -
Other - -
600 68
FRS 18.35(b) Interest revenue:
- Bank deposits 100 10
- Available-for-sale investments 253 150
- Other loans and receivables 62 40
- Held-to-maturity investments 187 100
FRS 107.20(d) Impaired financial assets - -
FRS 107.20(b) Total interest revenue 602 300
FRS 18.35(b) Royalties - -
FRS 18.35(b) Dividends received 2,299 349
Other (aggregate of immaterial items) - -
3,501 717
Investment revenue earned on financial assets, analysed by category of asset, is as follows:
2011 2010
$’000 $’000
Available-for-sale financial assets 253 150
Loans and receivables 162 50
Held-to-maturity investments 187 100
602 300
Investment income earned on non-financial assets 2,899 417
3,501 717
Revenue recognised in respect of financial assets at FVTPL is disclosed in Note 43.
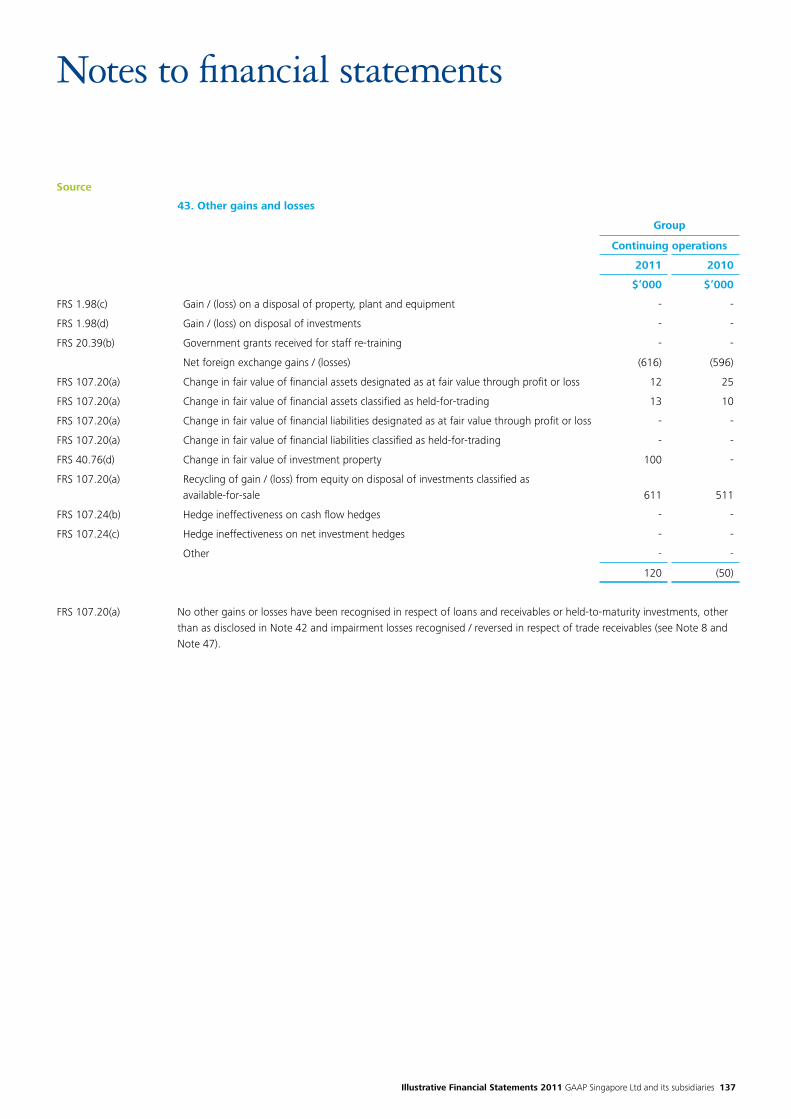
Illustrative Financial Statements 2011 GAAP Singapore Ltd and its subsidiaries 137
Source
Notes to financial statements
43. Other gains and losses
Group
Continuing operations
2011 2010
$’000 $’000
FRS 1.98(c) Gain / (loss) on a disposal of property, plant and equipment - -
FRS 1.98(d) Gain / (loss) on disposal of investments - -
FRS 20.39(b) Government grants received for staff re-training - -
Net foreign exchange gains / (losses) (616) (596)
FRS 107.20(a) Change in fair value of financial assets designated as at fair value through profit or loss 12 25
FRS 107.20(a) Change in fair value of financial assets classified as held-for-trading 13 10
FRS 107.20(a) Change in fair value of financial liabilities designated as at fair value through profit or loss - -
FRS 107.20(a) Change in fair value of financial liabilities classified as held-for-trading - -
FRS 40.76(d) Change in fair value of investment property 100 -
FRS 107.20(a) Recycling of gain / (loss) from equity on disposal of investments classified as available-for-sale 611 511
FRS 107.24(b) Hedge ineffectiveness on cash flow hedges - -
FRS 107.24(c) Hedge ineffectiveness on net investment hedges - -
Other - -
120 (50)
FRS 107.20(a) No other gains or losses have been recognised in respect of loans and receivables or held-to-maturity investments, other than as disclosed in Note 42 and impairment losses recognised / reversed in respect of trade receivables (see Note 8 and Note 47).
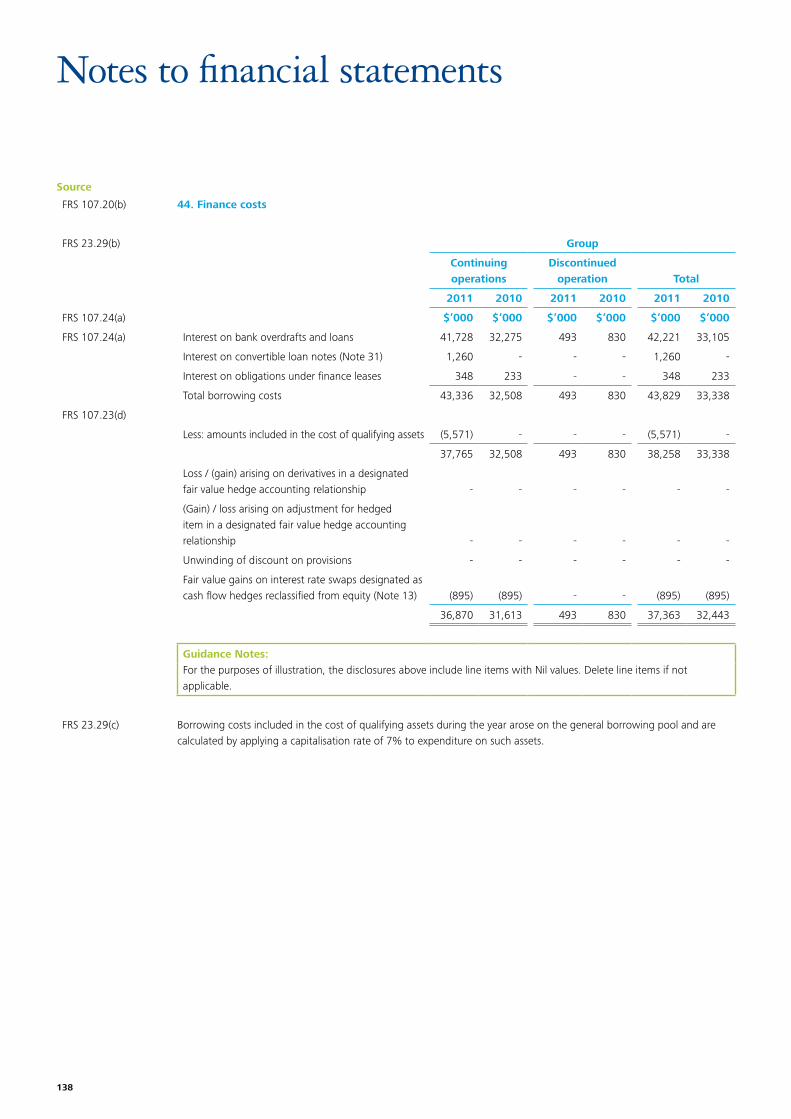
138
Source
Notes to financial statements
FRS 107.20(b) 44. Finance costs
FRS 23.29(b) Group
Continuing operations
Discontinued operation Total
2011 2010 2011 2010 2011 2010
FRS 107.24(a) $’000 $’000 $’000 $’000 $’000 $’000
FRS 107.24(a) Interest on bank overdrafts and loans 41,728 32,275 493 830 42,221 33,105
Interest on convertible loan notes (Note 31) 1,260 - - - 1,260 -
Interest on obligations under finance leases 348 233 - - 348 233
Total borrowing costs 43,336 32,508 493 830 43,829 33,338
FRS 107.23(d)
Less: amounts included in the cost of qualifying assets (5,571) - - - (5,571) -
37,765 32,508 493 830 38,258 33,338
Loss / (gain) arising on derivatives in a designated fair value hedge accounting relationship - - - - - -
(Gain) / loss arising on adjustment for hedged item in a designated fair value hedge accounting relationship - - - - - -
Unwinding of discount on provisions - - - - - -
Fair value gains on interest rate swaps designated as cash flow hedges reclassified from equity (Note 13) (895) (895) - - (895) (895)
36,870 31,613 493 830 37,363 32,443
Guidance Notes:For the purposes of illustration, the disclosures above include line items with Nil values. Delete line items if not applicable.
FRS 23.29(c) Borrowing costs included in the cost of qualifying assets during the year arose on the general borrowing pool and are calculated by applying a capitalisation rate of 7% to expenditure on such assets.
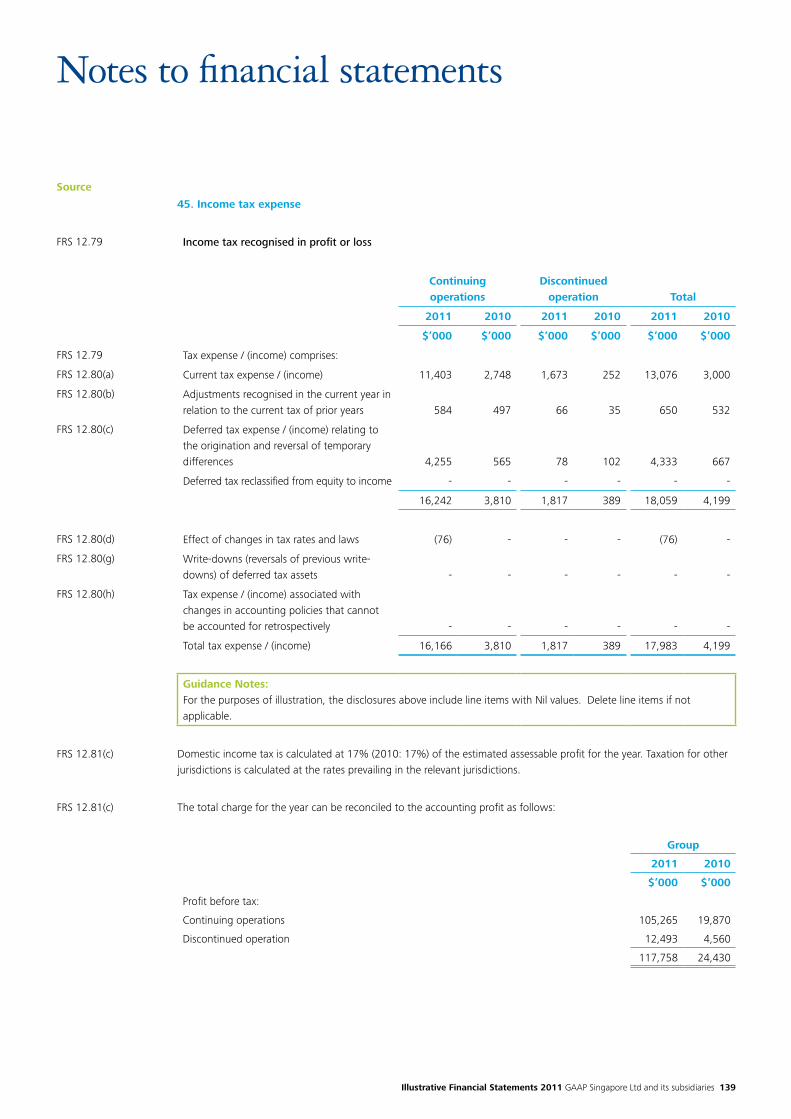
Illustrative Financial Statements 2011 GAAP Singapore Ltd and its subsidiaries 139
Source
Notes to financial statements
45. Income tax expense
FRS 12.79 Income tax recognised in profit or loss
Continuing operations
Discontinued operation Total
2011 2010 2011 2010 2011 2010
$’000 $’000 $’000 $’000 $’000 $’000
FRS 12.79 Tax expense / (income) comprises:
FRS 12.80(a) Current tax expense / (income) 11,403 2,748 1,673 252 13,076 3,000
FRS 12.80(b) Adjustments recognised in the current year in relation to the current tax of prior years 584 497 66 35 650 532
FRS 12.80(c) Deferred tax expense / (income) relating to the origination and reversal of temporary differences 4,255 565 78 102 4,333 667
Deferred tax reclassified from equity to income - - - - - -
16,242 3,810 1,817 389 18,059 4,199
FRS 12.80(d) Effect of changes in tax rates and laws (76) - - - (76) -
FRS 12.80(g) Write-downs (reversals of previous write-downs) of deferred tax assets - - - - - -
FRS 12.80(h) Tax expense / (income) associated with changes in accounting policies that cannot be accounted for retrospectively - - - - - -
Total tax expense / (income) 16,166 3,810 1,817 389 17,983 4,199
Guidance Notes:For the purposes of illustration, the disclosures above include line items with Nil values. Delete line items if not applicable.
FRS 12.81(c) Domestic income tax is calculated at 17% (2010: 17%) of the estimated assessable profit for the year. Taxation for other jurisdictions is calculated at the rates prevailing in the relevant jurisdictions.
FRS 12.81(c) The total charge for the year can be reconciled to the accounting profit as follows:
Group
2011 2010
$’000 $’000
Profit before tax:
Continuing operations 105,265 19,870
Discontinued operation 12,493 4,560
117,758 24,430
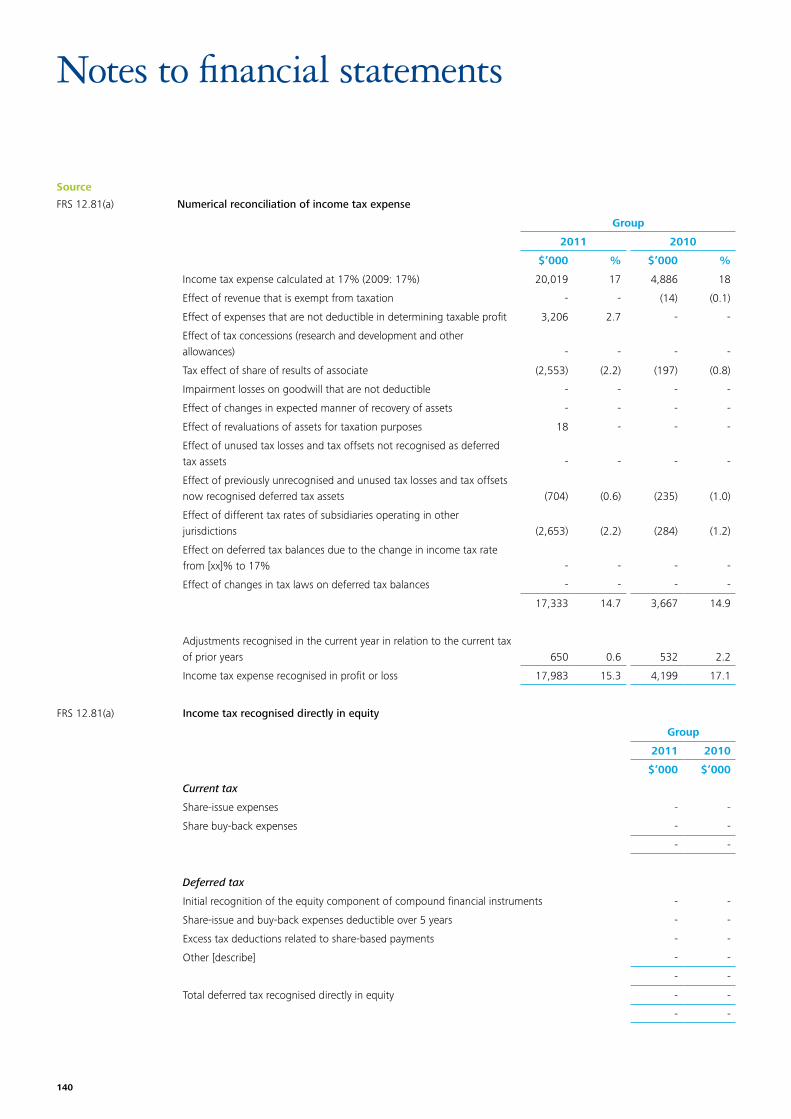
140
Source
Notes to financial statements
FRS 12.81(a) Numerical reconciliation of income tax expense
Group
2011 2010
$’000 % $’000 %
Income tax expense calculated at 17% (2009: 17%) 20,019 17 4,886 18
Effect of revenue that is exempt from taxation - - (14) (0.1)
Effect of expenses that are not deductible in determining taxable profit 3,206 2.7 - -
Effect of tax concessions (research and development and other allowances) - - - -
Tax effect of share of results of associate (2,553) (2.2) (197) (0.8)
Impairment losses on goodwill that are not deductible - - - -
Effect of changes in expected manner of recovery of assets - - - -
Effect of revaluations of assets for taxation purposes 18 - - -
Effect of unused tax losses and tax offsets not recognised as deferred tax assets - - - -
Effect of previously unrecognised and unused tax losses and tax offsets now recognised deferred tax assets (704) (0.6) (235) (1.0)
Effect of different tax rates of subsidiaries operating in other jurisdictions (2,653) (2.2) (284) (1.2)
Effect on deferred tax balances due to the change in income tax rate from [xx]% to 17% - - - -
Effect of changes in tax laws on deferred tax balances - - - -
17,333 14.7 3,667 14.9
Adjustments recognised in the current year in relation to the current tax of prior years 650 0.6 532 2.2
Income tax expense recognised in profit or loss 17,983 15.3 4,199 17.1
FRS 12.81(a) Income tax recognised directly in equity
Group
2011 2010
$’000 $’000
Current tax
Share-issue expenses - -
Share buy-back expenses - -
- -
Deferred tax
Initial recognition of the equity component of compound financial instruments - -
Share-issue and buy-back expenses deductible over 5 years - -
Excess tax deductions related to share-based payments - -
Other [describe] - -
- -
Total deferred tax recognised directly in equity - -
- -
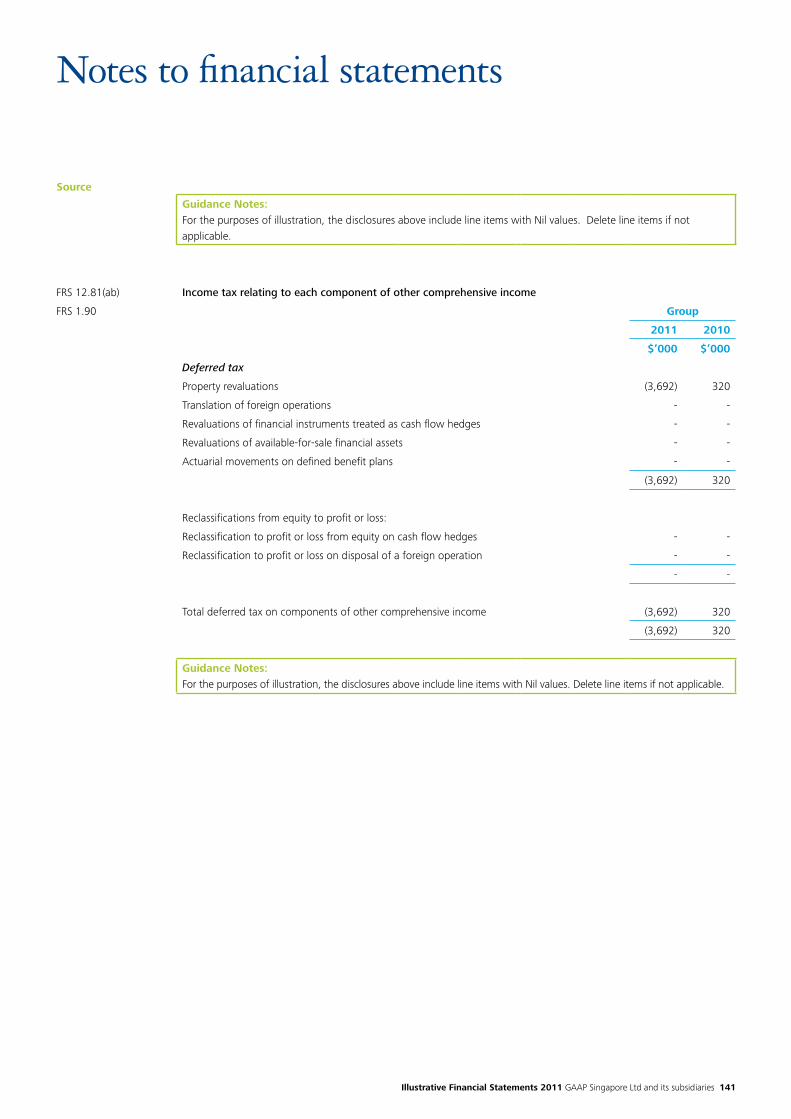
Illustrative Financial Statements 2011 GAAP Singapore Ltd and its subsidiaries 141
Source
Notes to financial statements
Guidance Notes:For the purposes of illustration, the disclosures above include line items with Nil values. Delete line items if not applicable.
FRS 12.81(ab) Income tax relating to each component of other comprehensive income
FRS 1.90 Group
2011 2010
$’000 $’000
Deferred tax
Property revaluations (3,692) 320
Translation of foreign operations - -
Revaluations of financial instruments treated as cash flow hedges - -
Revaluations of available-for-sale financial assets - -
Actuarial movements on defined benefit plans - -
(3,692) 320
Reclassifications from equity to profit or loss:
Reclassification to profit or loss from equity on cash flow hedges - -
Reclassification to profit or loss on disposal of a foreign operation - -
- -
Total deferred tax on components of other comprehensive income (3,692) 320
(3,692) 320
Guidance Notes:For the purposes of illustration, the disclosures above include line items with Nil values. Delete line items if not applicable.
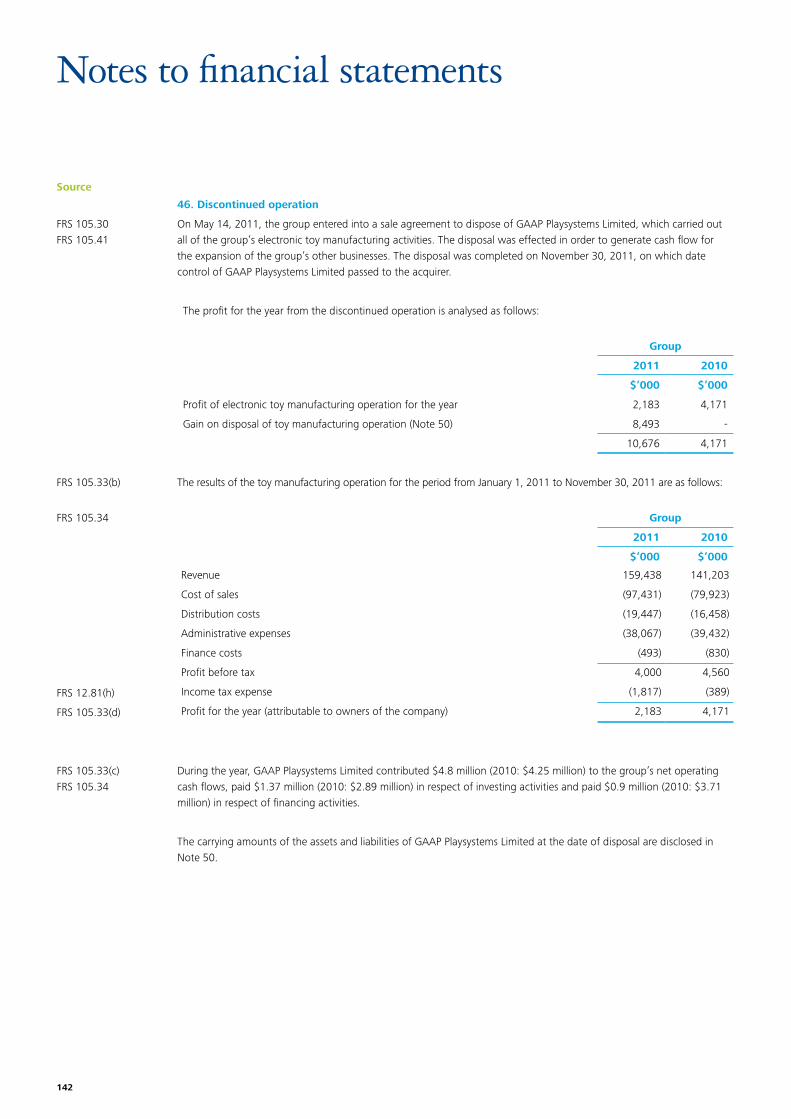
142
Source
Notes to financial statements
46. Discontinued operation
FRS 105.30FRS 105.41
On May 14, 2011, the group entered into a sale agreement to dispose of GAAP Playsystems Limited, which carried out all of the group’s electronic toy manufacturing activities. The disposal was effected in order to generate cash flow for the expansion of the group’s other businesses. The disposal was completed on November 30, 2011, on which date control of GAAP Playsystems Limited passed to the acquirer.
The profit for the year from the discontinued operation is analysed as follows:
Group
2011 2010
$’000 $’000
Profit of electronic toy manufacturing operation for the year 2,183 4,171
Gain on disposal of toy manufacturing operation (Note 50) 8,493 -
10,676 4,171
FRS 105.33(b) The results of the toy manufacturing operation for the period from January 1, 2011 to November 30, 2011 are as follows:
FRS 105.34 Group
2011 2010
$’000 $’000
Revenue 159,438 141,203
Cost of sales (97,431) (79,923)
Distribution costs (19,447) (16,458)
Administrative expenses (38,067) (39,432)
Finance costs (493) (830)
Profit before tax 4,000 4,560
FRS 12.81(h) Income tax expense (1,817) (389)
FRS 105.33(d) Profit for the year (attributable to owners of the company) 2,183 4,171
FRS 105.33(c)FRS 105.34
During the year, GAAP Playsystems Limited contributed $4.8 million (2010: $4.25 million) to the group’s net operating cash flows, paid $1.37 million (2010: $2.89 million) in respect of investing activities and paid $0.9 million (2010: $3.71 million) in respect of financing activities.
The carrying amounts of the assets and liabilities of GAAP Playsystems Limited at the date of disposal are disclosed in Note 50.
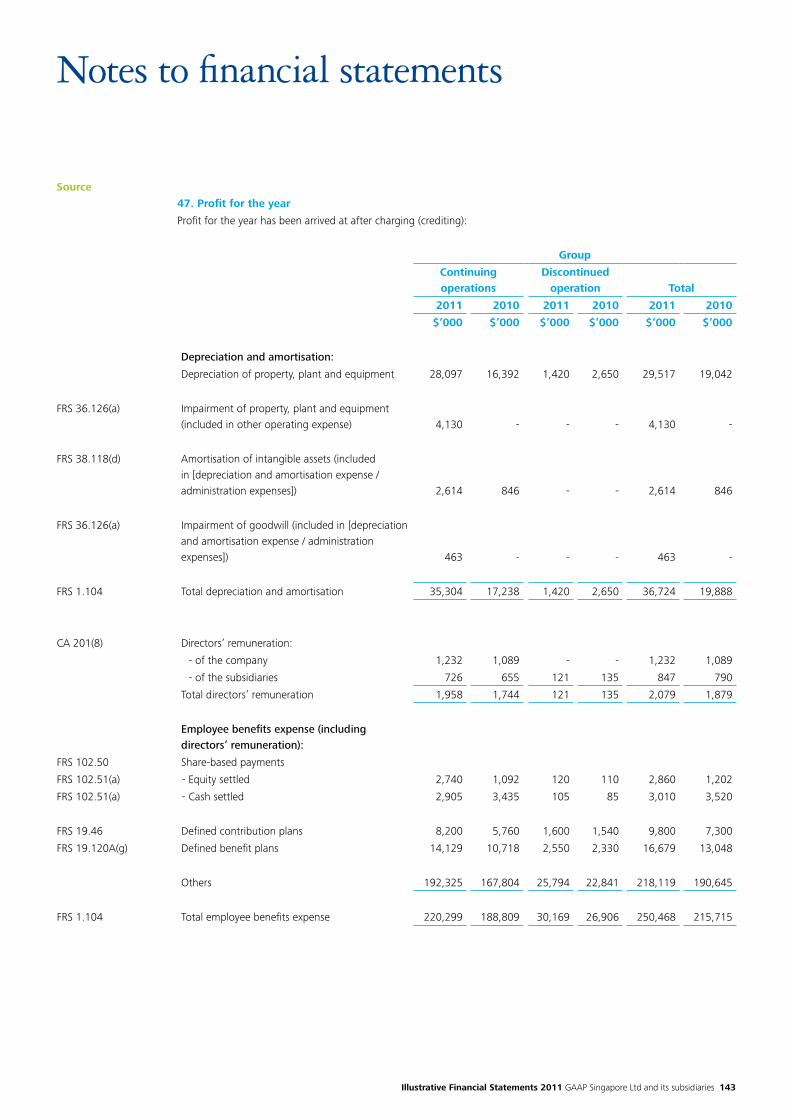
Illustrative Financial Statements 2011 GAAP Singapore Ltd and its subsidiaries 143
Source
Notes to financial statements
47. Profit for the year
Profit for the year has been arrived at after charging (crediting):
Group
Continuingoperations
Discontinued operation Total
2011 2010 2011 2010 2011 2010
$’000 $’000 $’000 $’000 $’000 $’000
Depreciation and amortisation:
Depreciation of property, plant and equipment 28,097 16,392 1,420 2,650 29,517 19,042
FRS 36.126(a) Impairment of property, plant and equipment (included in other operating expense) 4,130 - - - 4,130 -
FRS 38.118(d) Amortisation of intangible assets (included in [depreciation and amortisation expense / administration expenses]) 2,614 846 - - 2,614 846
FRS 36.126(a) Impairment of goodwill (included in [depreciation and amortisation expense / administration expenses]) 463 - - - 463 -
FRS 1.104 Total depreciation and amortisation 35,304 17,238 1,420 2,650 36,724 19,888
CA 201(8) Directors’ remuneration:
- of the company 1,232 1,089 - - 1,232 1,089
- of the subsidiaries 726 655 121 135 847 790
Total directors’ remuneration 1,958 1,744 121 135 2,079 1,879
Employee benefits expense (including directors’ remuneration):
FRS 102.50 Share-based payments
FRS 102.51(a) - Equity settled 2,740 1,092 120 110 2,860 1,202
FRS 102.51(a) - Cash settled 2,905 3,435 105 85 3,010 3,520
FRS 19.46 Defined contribution plans 8,200 5,760 1,600 1,540 9,800 7,300
FRS 19.120A(g) Defined benefit plans 14,129 10,718 2,550 2,330 16,679 13,048
Others 192,325 167,804 25,794 22,841 218,119 190,645
FRS 1.104 Total employee benefits expense 220,299 188,809 30,169 26,906 250,468 215,715
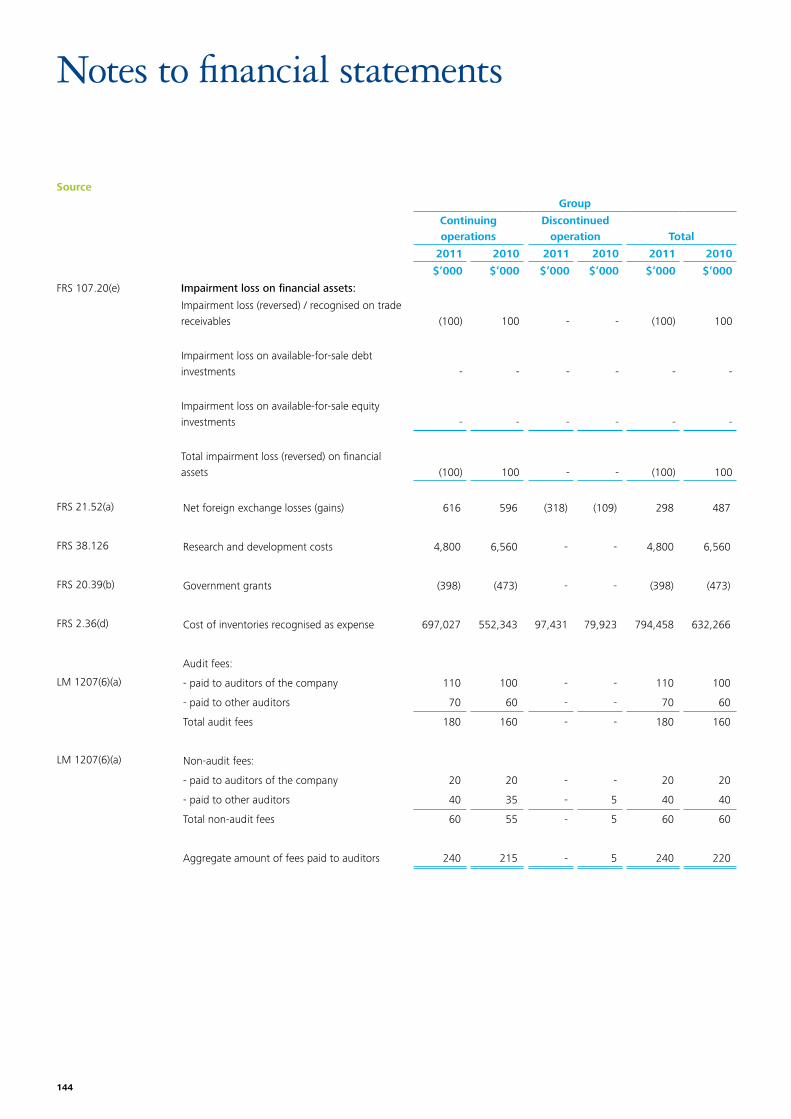
144
Source
Notes to financial statements
Group
Continuingoperations
Discontinued operation Total
2011 2010 2011 2010 2011 2010
$’000 $’000 $’000 $’000 $’000 $’000
FRS 107.20(e) Impairment loss on financial assets:
Impairment loss (reversed) / recognised on trade receivables (100) 100 - - (100) 100
Impairment loss on available-for-sale debt investments - - - - - -
Impairment loss on available-for-sale equity investments - - - - - -
Total impairment loss (reversed) on financial assets (100) 100 - - (100) 100
FRS 21.52(a) Net foreign exchange losses (gains) 616 596 (318) (109) 298 487
FRS 38.126 Research and development costs 4,800 6,560 - - 4,800 6,560
FRS 20.39(b) Government grants (398) (473) - - (398) (473)
FRS 2.36(d) Cost of inventories recognised as expense 697,027 552,343 97,431 79,923 794,458 632,266
Audit fees:
LM 1207(6)(a) - paid to auditors of the company 110 100 - - 110 100
- paid to other auditors 70 60 - - 70 60
Total audit fees 180 160 - - 180 160
LM 1207(6)(a) Non-audit fees:
- paid to auditors of the company 20 20 - - 20 20
- paid to other auditors 40 35 - 5 40 40
Total non-audit fees 60 55 - 5 60 60
Aggregate amount of fees paid to auditors 240 215 - 5 240 220
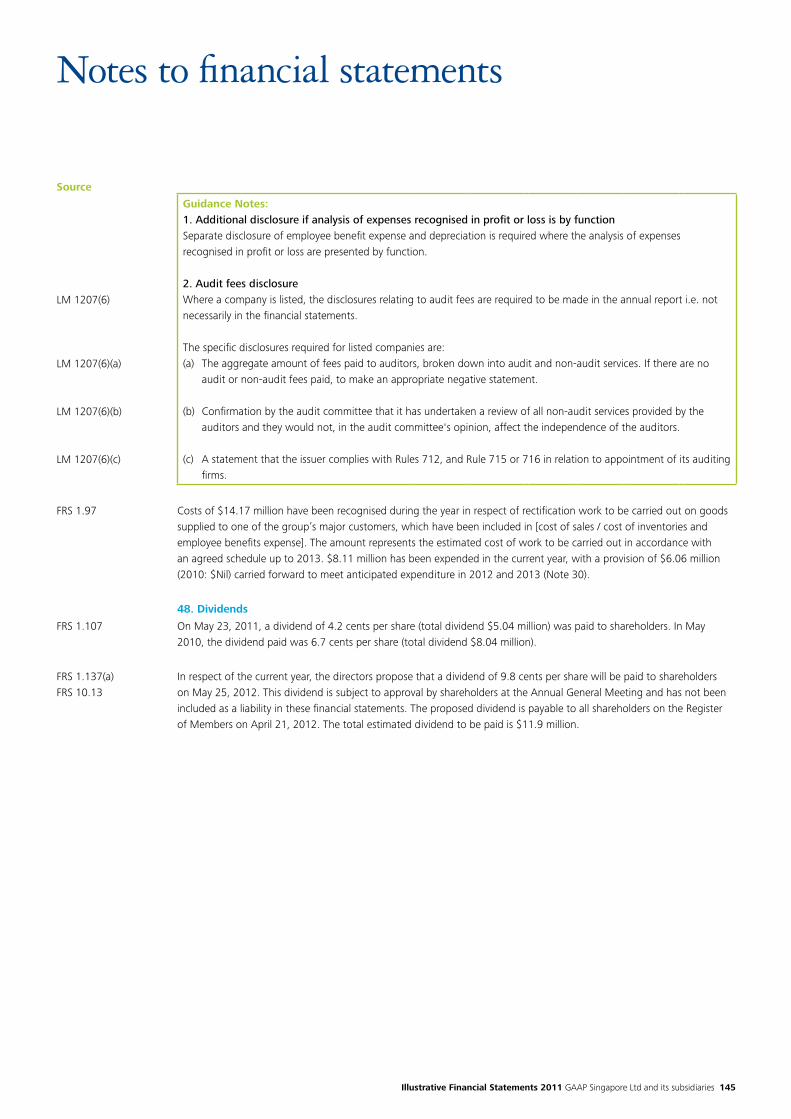
Illustrative Financial Statements 2011 GAAP Singapore Ltd and its subsidiaries 145
Source
Notes to financial statements
LM 1207(6)
LM 1207(6)(a)
LM 1207(6)(b)
LM 1207(6)(c)
Guidance Notes: 1. Additional disclosure if analysis of expenses recognised in profit or loss is by functionSeparate disclosure of employee benefit expense and depreciation is required where the analysis of expenses recognised in profit or loss are presented by function.
2. Audit fees disclosureWhere a company is listed, the disclosures relating to audit fees are required to be made in the annual report i.e. not necessarily in the financial statements.
The specific disclosures required for listed companies are:(a) The aggregate amount of fees paid to auditors, broken down into audit and non-audit services. If there are no
audit or non-audit fees paid, to make an appropriate negative statement.
(b) Confirmation by the audit committee that it has undertaken a review of all non-audit services provided by the auditors and they would not, in the audit committee's opinion, affect the independence of the auditors.
(c) A statement that the issuer complies with Rules 712, and Rule 715 or 716 in relation to appointment of its auditing firms.
FRS 1.97 Costs of $14.17 million have been recognised during the year in respect of rectification work to be carried out on goods supplied to one of the group’s major customers, which have been included in [cost of sales / cost of inventories and employee benefits expense]. The amount represents the estimated cost of work to be carried out in accordance with an agreed schedule up to 2013. $8.11 million has been expended in the current year, with a provision of $6.06 million (2010: $Nil) carried forward to meet anticipated expenditure in 2012 and 2013 (Note 30).
48. Dividends
FRS 1.107 On May 23, 2011, a dividend of 4.2 cents per share (total dividend $5.04 million) was paid to shareholders. In May 2010, the dividend paid was 6.7 cents per share (total dividend $8.04 million).
FRS 1.137(a)FRS 10.13
In respect of the current year, the directors propose that a dividend of 9.8 cents per share will be paid to shareholders on May 25, 2012. This dividend is subject to approval by shareholders at the Annual General Meeting and has not been included as a liability in these financial statements. The proposed dividend is payable to all shareholders on the Register of Members on April 21, 2012. The total estimated dividend to be paid is $11.9 million.
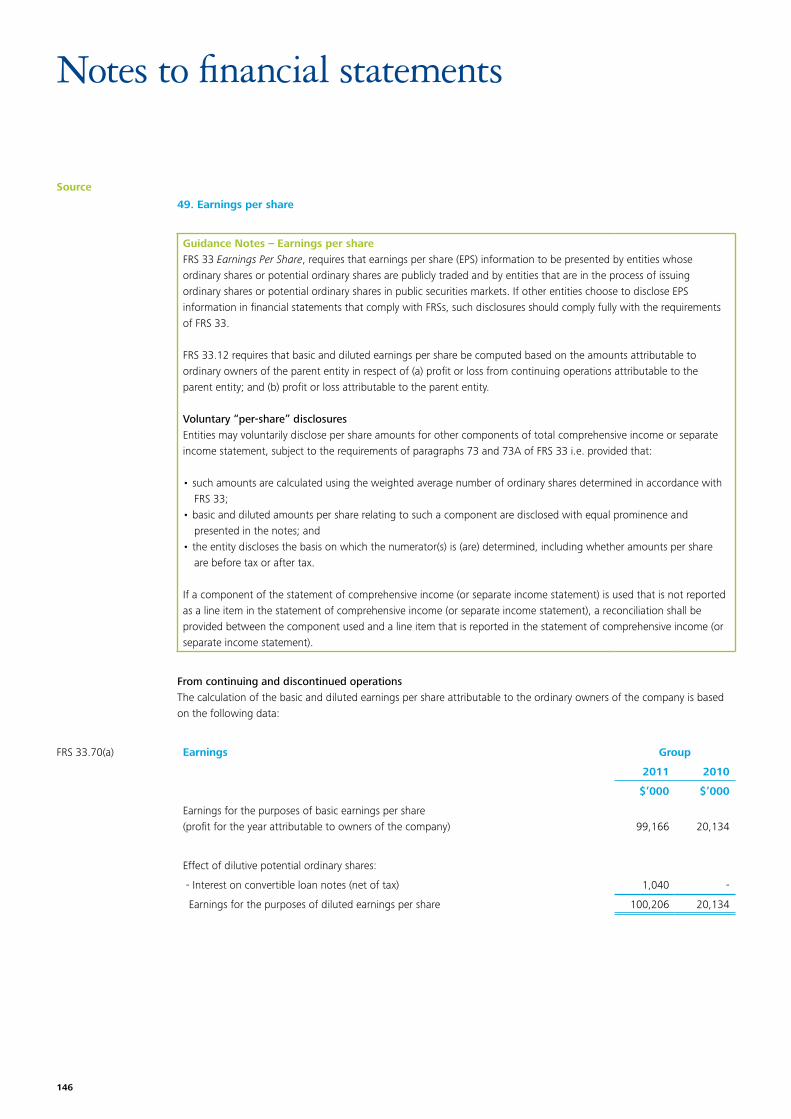
146
Source
Notes to financial statements
49. Earnings per share
Guidance Notes – Earnings per shareFRS 33 Earnings Per Share, requires that earnings per share (EPS) information to be presented by entities whose ordinary shares or potential ordinary shares are publicly traded and by entities that are in the process of issuing ordinary shares or potential ordinary shares in public securities markets. If other entities choose to disclose EPS information in financial statements that comply with FRSs, such disclosures should comply fully with the requirements of FRS 33.
FRS 33.12 requires that basic and diluted earnings per share be computed based on the amounts attributable to ordinary owners of the parent entity in respect of (a) profit or loss from continuing operations attributable to the parent entity; and (b) profit or loss attributable to the parent entity.
Voluntary “per-share” disclosures Entities may voluntarily disclose per share amounts for other components of total comprehensive income or separate income statement, subject to the requirements of paragraphs 73 and 73A of FRS 33 i.e. provided that:
•suchamountsarecalculatedusingtheweightedaveragenumberofordinarysharesdeterminedinaccordancewithFRS 33;
•basicanddilutedamountspersharerelatingtosuchacomponentaredisclosedwithequalprominenceandpresented in the notes; and
•theentitydisclosesthebasisonwhichthenumerator(s)is(are)determined,includingwhetheramountspershareare before tax or after tax.
If a component of the statement of comprehensive income (or separate income statement) is used that is not reported as a line item in the statement of comprehensive income (or separate income statement), a reconciliation shall be provided between the component used and a line item that is reported in the statement of comprehensive income (or separate income statement).
From continuing and discontinued operationsThe calculation of the basic and diluted earnings per share attributable to the ordinary owners of the company is based on the following data:
FRS 33.70(a) Earnings Group
2011 2010
$’000 $’000
Earnings for the purposes of basic earnings per share (profit for the year attributable to owners of the company) 99,166 20,134
Effect of dilutive potential ordinary shares:
- Interest on convertible loan notes (net of tax) 1,040 -
Earnings for the purposes of diluted earnings per share 100,206 20,134
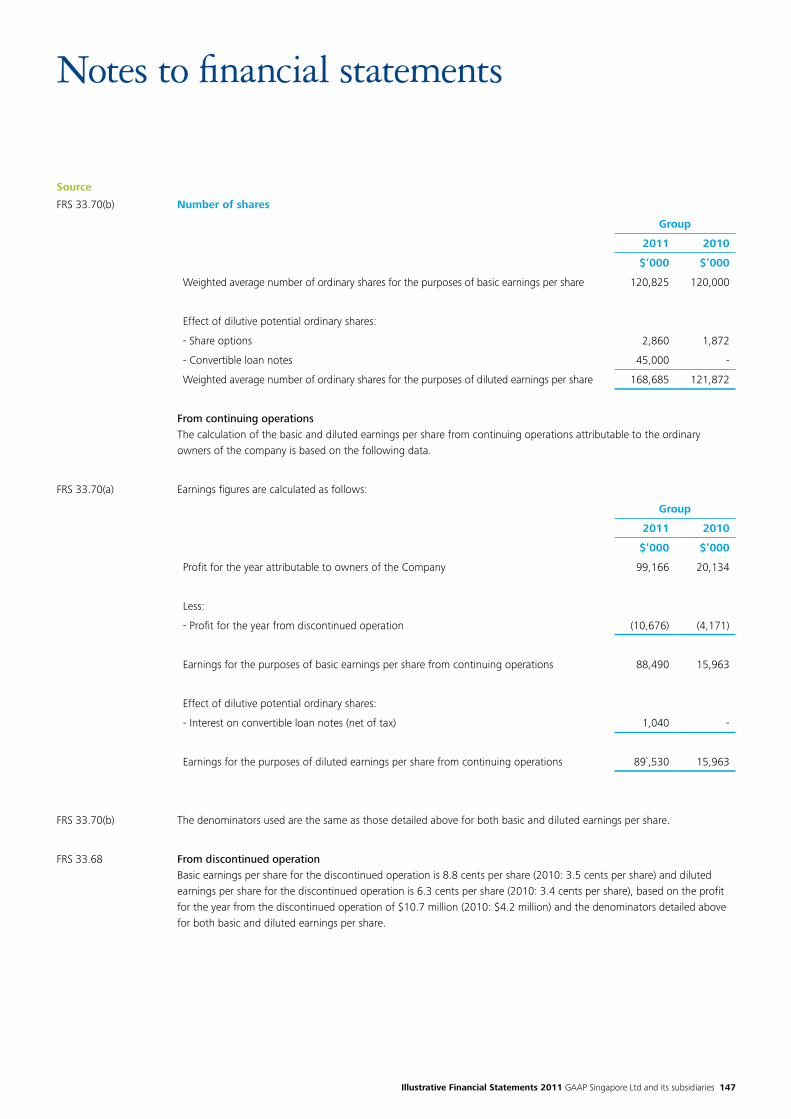
Illustrative Financial Statements 2011 GAAP Singapore Ltd and its subsidiaries 147
Source
Notes to financial statements
FRS 33.70(b) Number of shares
Group
2011 2010
$’000 $’000
Weighted average number of ordinary shares for the purposes of basic earnings per share 120,825 120,000
Effect of dilutive potential ordinary shares:
- Share options 2,860 1,872
- Convertible loan notes 45,000 -
Weighted average number of ordinary shares for the purposes of diluted earnings per share 168,685 121,872
From continuing operationsThe calculation of the basic and diluted earnings per share from continuing operations attributable to the ordinary owners of the company is based on the following data.
FRS 33.70(a) Earnings figures are calculated as follows:
Group
2011 2010
$’000 $’000
Profit for the year attributable to owners of the Company 99,166 20,134
Less:
- Profit for the year from discontinued operation (10,676) (4,171)
Earnings for the purposes of basic earnings per share from continuing operations 88,490 15,963
Effect of dilutive potential ordinary shares:
- Interest on convertible loan notes (net of tax) 1,040 -
Earnings for the purposes of diluted earnings per share from continuing operations 89`,530 15,963
FRS 33.70(b) The denominators used are the same as those detailed above for both basic and diluted earnings per share.
FRS 33.68 From discontinued operationBasic earnings per share for the discontinued operation is 8.8 cents per share (2010: 3.5 cents per share) and diluted earnings per share for the discontinued operation is 6.3 cents per share (2010: 3.4 cents per share), based on the profit for the year from the discontinued operation of $10.7 million (2010: $4.2 million) and the denominators detailed above for both basic and diluted earnings per share.
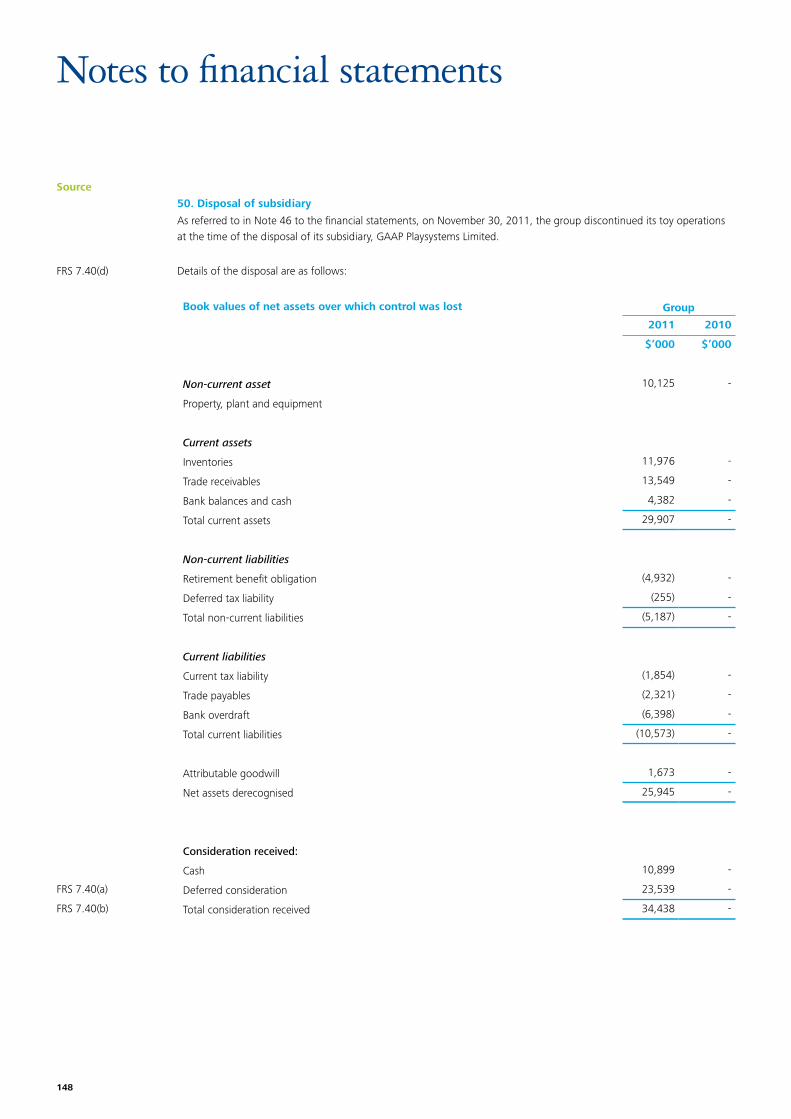
148
Source
Notes to financial statements
50. Disposal of subsidiary
As referred to in Note 46 to the financial statements, on November 30, 2011, the group discontinued its toy operations at the time of the disposal of its subsidiary, GAAP Playsystems Limited.
FRS 7.40(d) Details of the disposal are as follows:
Book values of net assets over which control was lost Group
2011 2010
$’000 $’000
Non-current asset 10,125 -
Property, plant and equipment
Current assets
Inventories 11,976 -
Trade receivables 13,549 -
Bank balances and cash 4,382 -
Total current assets 29,907 -
Non-current liabilities
Retirement benefit obligation (4,932) -
Deferred tax liability (255) -
Total non-current liabilities (5,187) -
Current liabilities
Current tax liability (1,854) -
Trade payables (2,321) -
Bank overdraft (6,398) -
Total current liabilities (10,573) -
Attributable goodwill 1,673 -
Net assets derecognised 25,945 -
Consideration received:
Cash 10,899 -
FRS 7.40(a) Deferred consideration 23,539 -
FRS 7.40(b) Total consideration received 34,438 -
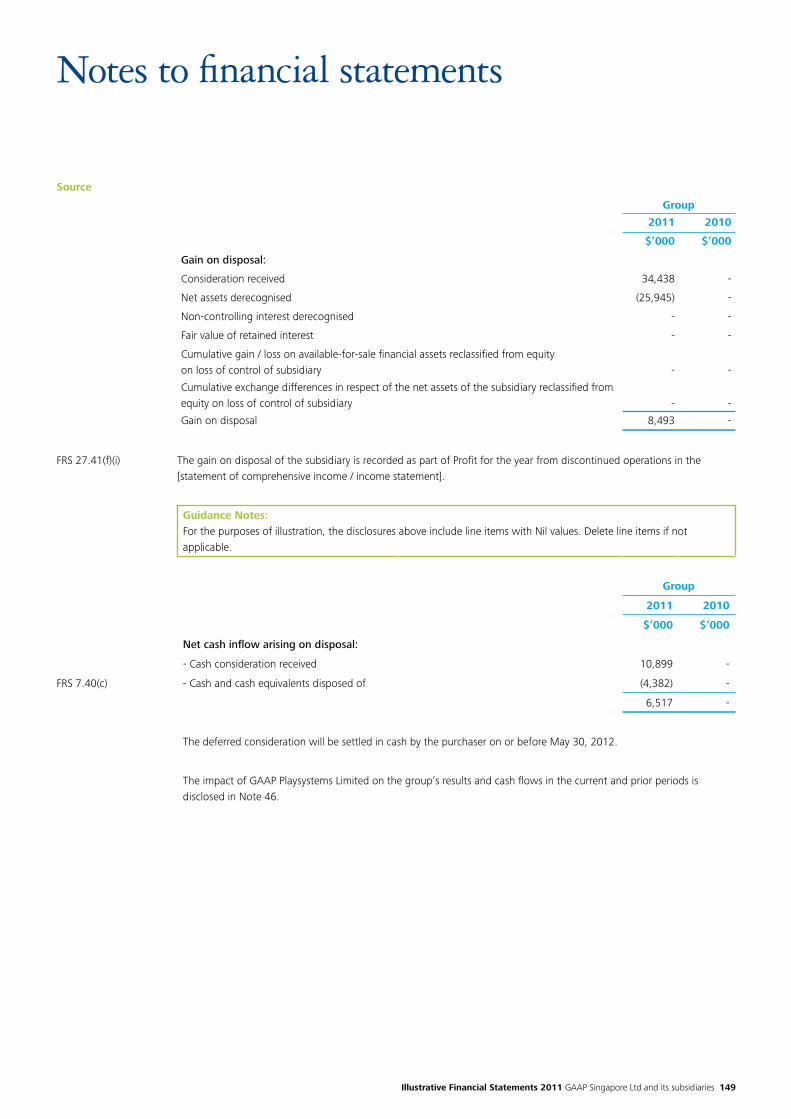
Illustrative Financial Statements 2011 GAAP Singapore Ltd and its subsidiaries 149
Source
Notes to financial statements
FRS 27.41(f)(i) The gain on disposal of the subsidiary is recorded as part of Profit for the year from discontinued operations in the [statement of comprehensive income / income statement].
Guidance Notes:For the purposes of illustration, the disclosures above include line items with Nil values. Delete line items if not applicable.
Group
2011 2010
$’000 $’000
Net cash inflow arising on disposal:
- Cash consideration received 10,899 -
FRS 7.40(c) - Cash and cash equivalents disposed of (4,382) -
6,517 -
The deferred consideration will be settled in cash by the purchaser on or before May 30, 2012.
The impact of GAAP Playsystems Limited on the group’s results and cash flows in the current and prior periods is disclosed in Note 46.
Group
2011 2010
$’000 $’000
Gain on disposal:
Consideration received 34,438 -
Net assets derecognised (25,945) -
Non-controlling interest derecognised - -
Fair value of retained interest - -
Cumulative gain / loss on available-for-sale financial assets reclassified from equityon loss of control of subsidiary - -
Cumulative exchange differences in respect of the net assets of the subsidiary reclassified from equity on loss of control of subsidiary - -
Gain on disposal 8,493 -
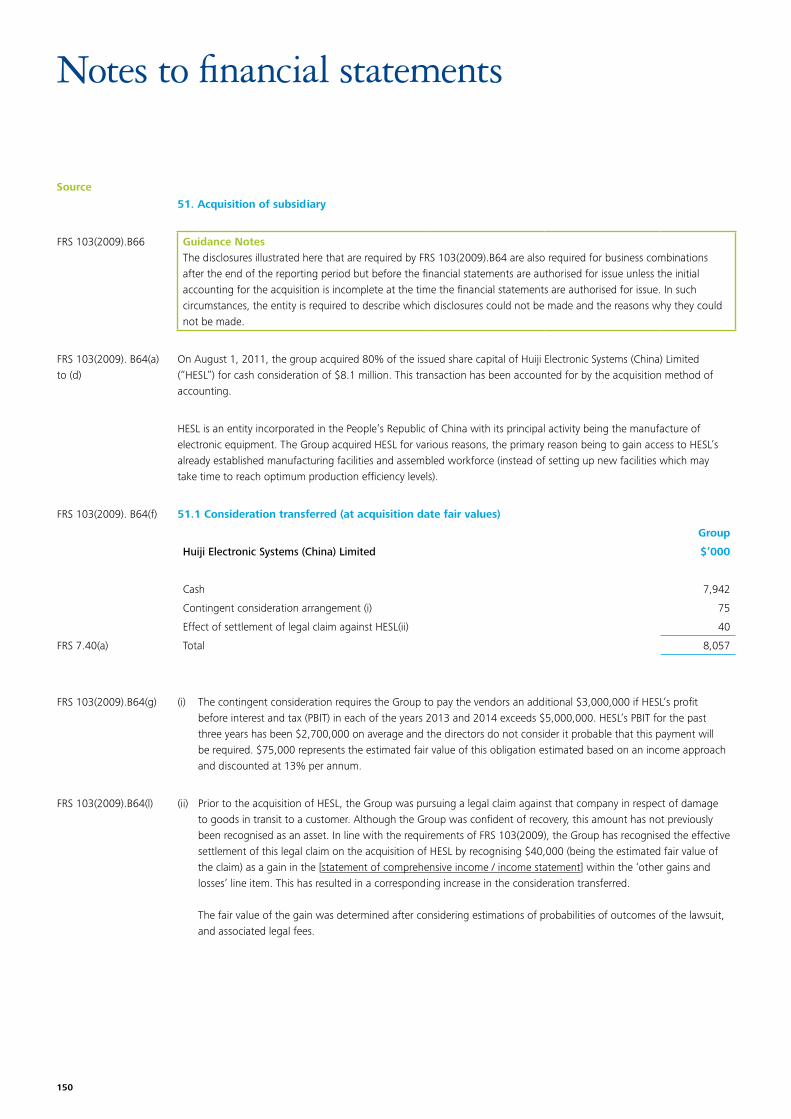
150
Source
Notes to financial statements
51. Acquisition of subsidiary
FRS 103(2009).B66 Guidance NotesThe disclosures illustrated here that are required by FRS 103(2009).B64 are also required for business combinations after the end of the reporting period but before the financial statements are authorised for issue unless the initial accounting for the acquisition is incomplete at the time the financial statements are authorised for issue. In such circumstances, the entity is required to describe which disclosures could not be made and the reasons why they could not be made.
FRS 103(2009). B64(a) to (d)
On August 1, 2011, the group acquired 80% of the issued share capital of Huiji Electronic Systems (China) Limited (“HESL”) for cash consideration of $8.1 million. This transaction has been accounted for by the acquisition method of accounting.
HESL is an entity incorporated in the People’s Republic of China with its principal activity being the manufacture of electronic equipment. The Group acquired HESL for various reasons, the primary reason being to gain access to HESL’s already established manufacturing facilities and assembled workforce (instead of setting up new facilities which may take time to reach optimum production efficiency levels).
FRS 103(2009). B64(f) 51.1 Consideration transferred (at acquisition date fair values)
Group
Huiji Electronic Systems (China) Limited $’000
Cash 7,942
Contingent consideration arrangement (i) 75
Effect of settlement of legal claim against HESL(ii) 40
FRS 7.40(a) Total 8,057
FRS 103(2009).B64(g) (i) The contingent consideration requires the Group to pay the vendors an additional $3,000,000 if HESL’s profit before interest and tax (PBIT) in each of the years 2013 and 2014 exceeds $5,000,000. HESL’s PBIT for the past three years has been $2,700,000 on average and the directors do not consider it probable that this payment will be required. $75,000 represents the estimated fair value of this obligation estimated based on an income approach and discounted at 13% per annum.
FRS 103(2009).B64(l) (ii) Prior to the acquisition of HESL, the Group was pursuing a legal claim against that company in respect of damage to goods in transit to a customer. Although the Group was confident of recovery, this amount has not previously been recognised as an asset. In line with the requirements of FRS 103(2009), the Group has recognised the effective settlement of this legal claim on the acquisition of HESL by recognising $40,000 (being the estimated fair value of the claim) as a gain in the [statement of comprehensive income / income statement] within the ‘other gains and losses’ line item. This has resulted in a corresponding increase in the consideration transferred.
The fair value of the gain was determined after considering estimations of probabilities of outcomes of the lawsuit, and associated legal fees.
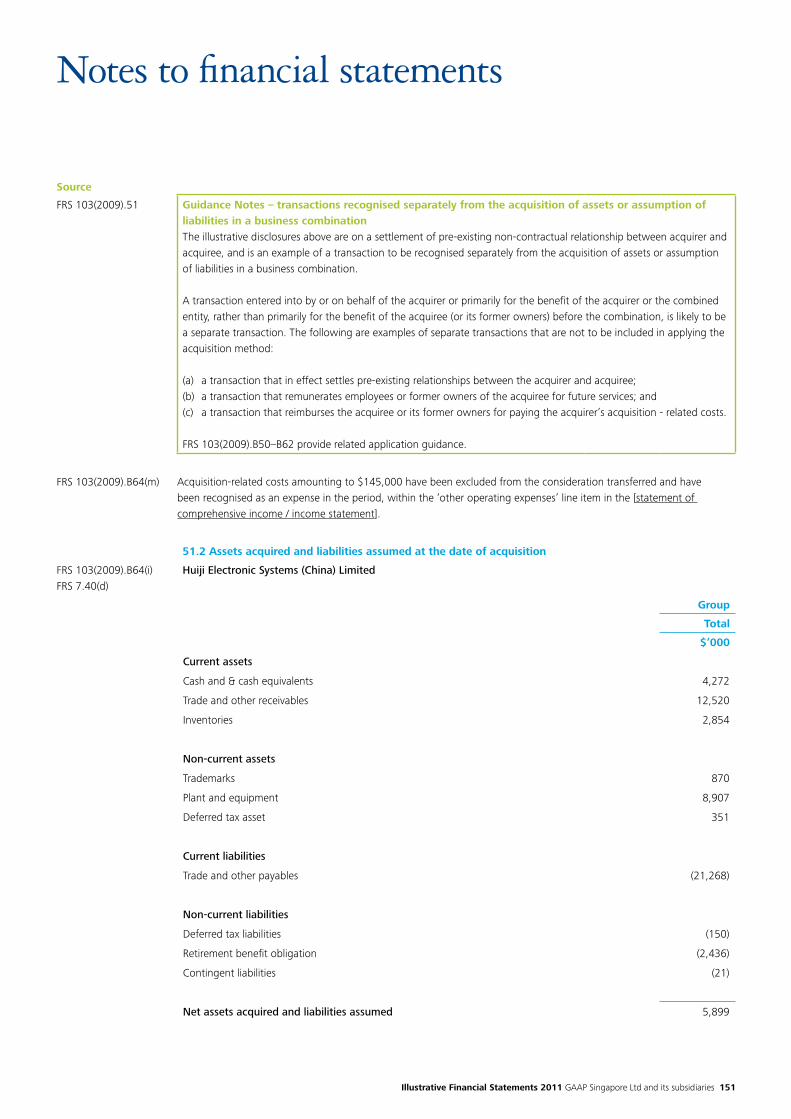
Illustrative Financial Statements 2011 GAAP Singapore Ltd and its subsidiaries 151
Source
Notes to financial statements
FRS 103(2009).51 Guidance Notes – transactions recognised separately from the acquisition of assets or assumption of liabilities in a business combinationThe illustrative disclosures above are on a settlement of pre-existing non-contractual relationship between acquirer and acquiree, and is an example of a transaction to be recognised separately from the acquisition of assets or assumption of liabilities in a business combination.
A transaction entered into by or on behalf of the acquirer or primarily for the benefit of the acquirer or the combined entity, rather than primarily for the benefit of the acquiree (or its former owners) before the combination, is likely to be a separate transaction. The following are examples of separate transactions that are not to be included in applying the acquisition method:
(a) a transaction that in effect settles pre-existing relationships between the acquirer and acquiree;(b) a transaction that remunerates employees or former owners of the acquiree for future services; and(c) a transaction that reimburses the acquiree or its former owners for paying the acquirer’s acquisition - related costs.
FRS 103(2009).B50–B62 provide related application guidance.
FRS 103(2009).B64(m) Acquisition-related costs amounting to $145,000 have been excluded from the consideration transferred and have been recognised as an expense in the period, within the ‘other operating expenses’ line item in the [statement of comprehensive income / income statement].
51.2 Assets acquired and liabilities assumed at the date of acquisition
FRS 103(2009).B64(i)FRS 7.40(d)
Huiji Electronic Systems (China) Limited
Group
Total
$’000
Current assets
Cash and & cash equivalents 4,272
Trade and other receivables 12,520
Inventories 2,854
Non-current assets
Trademarks 870
Plant and equipment 8,907
Deferred tax asset 351
Current liabilities
Trade and other payables (21,268)
Non-current liabilities
Deferred tax liabilities (150)
Retirement benefit obligation (2,436)
Contingent liabilities (21)
Net assets acquired and liabilities assumed 5,899
152
Source
Notes to financial statements
FRS 103(2009).B64(j) Guidance Notes: Contingent liability assumed in a business combination1. If a contingent liability is not recognised because its fair value cannot be measured reliably, the acquirer shall
disclose the information required by FRS 37.86 (See Note 53 of the illustrative financial statements), and the reasons why the liability cannot be measured reliably.
FRS 37.86 requires a brief description of the nature of the contingent liability and, where practicable:
(a) an estimate of its financial effect;
(b) an indication of the uncertainties relating to the amount or timing of any outflow; and
(c) the possibility of any reimbursement.
FRS 103(2009).B64(h) The receivables acquired (which principally comprised trade receivables) in these transactions with a fair value of $12,520,000 had gross contractual amounts of $13,000,000. The best estimate at acquisition date of the contractual cash flows not expected to be collected is $480,000.
FRS 103(2009).B64(h) Guidance Notes: Acquired receivablesThe disclosures above in relation to acquired receivables should be provided by major class of receivables e.g. loans, direct finance leases and any other class of receivables.
51.3 Non-controlling interest
FRS 103(2009).B64(o) The non-controlling interest (20%) in HESL recognised at the acquisition date was measured by reference to the fair value of the non-controlling interest and amounted to $1,500,000. This fair value was estimated by applying an income approach. The following were the key model inputs used in determining the fair value:
•assumeddiscountraterangeof18%to22%;
•assumedlong-termsustainablegrowthratesof3%to5%;and
•assumedadjustmentsbecauseofthelackofcontrolorlackofmarketabilitythatmarketparticipantswouldconsiderwhen estimating the fair value of the non-controlling interests in HESL.
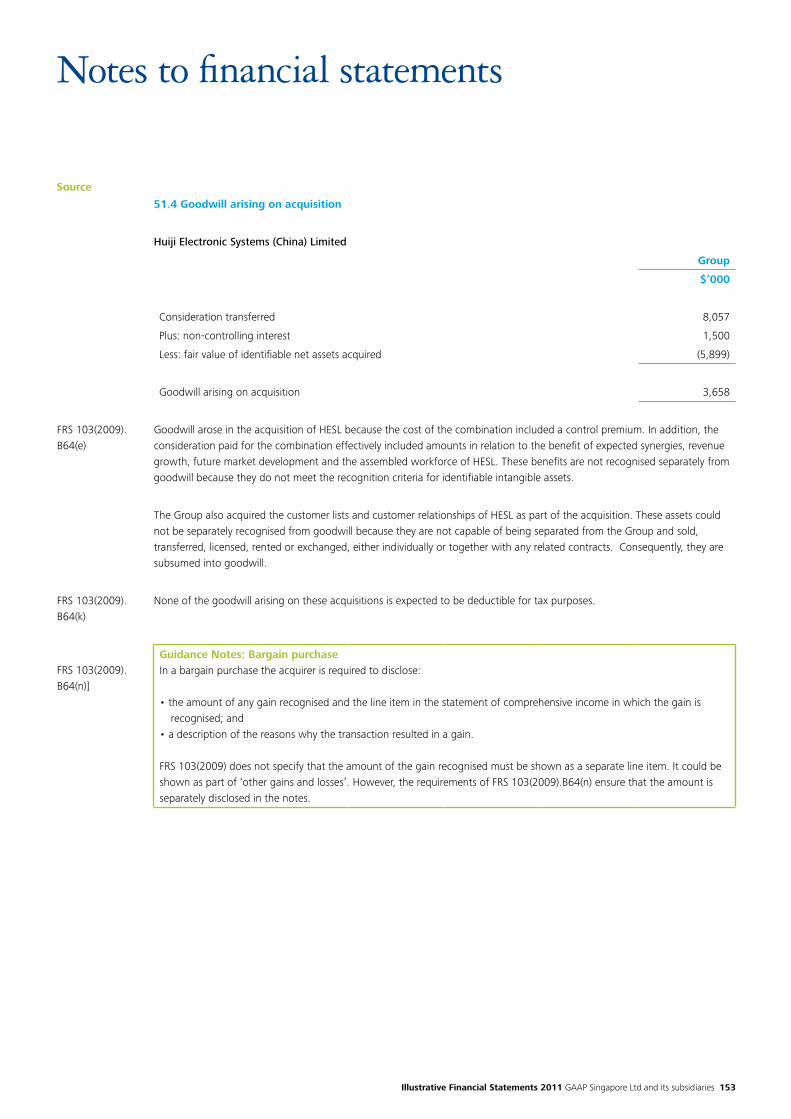
Illustrative Financial Statements 2011 GAAP Singapore Ltd and its subsidiaries 153
Source
Notes to financial statements
51.4 Goodwill arising on acquisition
Huiji Electronic Systems (China) Limited
Group
$’000
Consideration transferred 8,057
Plus: non-controlling interest 1,500
Less: fair value of identifiable net assets acquired (5,899)
Goodwill arising on acquisition 3,658
FRS 103(2009).B64(e)
Goodwill arose in the acquisition of HESL because the cost of the combination included a control premium. In addition, the consideration paid for the combination effectively included amounts in relation to the benefit of expected synergies, revenue growth, future market development and the assembled workforce of HESL. These benefits are not recognised separately from goodwill because they do not meet the recognition criteria for identifiable intangible assets.
The Group also acquired the customer lists and customer relationships of HESL as part of the acquisition. These assets could not be separately recognised from goodwill because they are not capable of being separated from the Group and sold, transferred, licensed, rented or exchanged, either individually or together with any related contracts. Consequently, they are subsumed into goodwill.
FRS 103(2009).B64(k)
None of the goodwill arising on these acquisitions is expected to be deductible for tax purposes.
FRS 103(2009).B64(n)]
Guidance Notes: Bargain purchaseIn a bargain purchase the acquirer is required to disclose:
•theamountofanygainrecognisedandthelineiteminthestatementofcomprehensiveincomeinwhichthegainisrecognised; and
•adescriptionofthereasonswhythetransactionresultedinagain.
FRS 103(2009) does not specify that the amount of the gain recognised must be shown as a separate line item. It could be shown as part of ‘other gains and losses’. However, the requirements of FRS 103(2009).B64(n) ensure that the amount is separately disclosed in the notes.

154
Source
Notes to financial statements
51.5 Net cash outflow on acquisition of subsidiaries
Group
2011 2010
$’000 $’000
Consideration paid in cash 7,942 -
Less: cash and cash equivalent balances acquired (4,272) -
3,670 -
51.6 Impact of acquisitions on the results of the Group
FRS 103(2009).B64(q) Included in the profit for the year is $1.2 million attributable to the additional business generated by HESL. Revenue for the period from HESL amounted $15.3 million.
Had the business combination during the year been effected at January 1, 2011, the revenue of the Group from continuing operations would have been $1.1 billion, and the profit for the year from continuing operations would have been $102.5 million.
Guidance Note - Impact of acquisitions on the results of the GroupIf disclosure of any of the information required by FRS 103(2009).B64(q) above is impracticable, the acquirer should disclose that fact and explain why the disclosure is impracticable.
Illustrative Financial Statements 2011 GAAP Singapore Ltd and its subsidiaries 155
Source
Notes to financial statements
FRS 103(2009).61 The management of the Group considers these 'pro-forma' numbers to represent an approximate measure of the performance of the combined group on an annualised basis and to provide a reference point for comparison in future periods.
In determining the ‘pro-forma’ revenue and profit of the Group had HESL been acquired at the beginning of the current reporting period, the management has:
•calculateddepreciationofplantandequipmentacquiredonthebasisofthefairvaluesarisingintheinitialaccountingfor the business combination rather than the carrying amounts recognised in the pre-acquisition financial statements;
•basedborrowingcostsonthefundinglevels,creditratingsanddebt/equitypositionoftheGroupafterthebusinesscombination; and
•excludedtakeoverdefencecostsoftheacquireeasaone-offpre-acquisitiontransaction.
FRS 103(2009).B64(p)Guidance Note – Other disclosures1. Acquisitions achieved in stagesIn a business combination achieved in stages, the acquirer is required to disclose:
•theacquisition-datefairvalueoftheequityinterestintheacquireeheldbytheacquirerimmediatelybeforetheacquisition date; and
•theamountofanygainorlossrecognisedasaresultofremeasuringtofairvaluetheequityinterestintheacquireeheld by the acquirer before the business combination and the line item in the statement of comprehensive income in which that gain or loss is recognised.
The intended scope of the second bullet point is not completely clear. It will certainly capture gains or losses that arise where the previous equity interest was not recognised at fair value, e.g. an interest in an associate to which equity accounting has been applied. But it would appear appropriate also to disclose any gain or loss in respect of the previous equity interest that is reclassified from other comprehensive income to the statement of comprehensive income, e.g. because the investment was classified as available-for-sale.
2. Initial accounting for a business combination determined provisionallyIf the initial accounting for a business combination is incomplete for particular assets, liabilities, non-controlling interests or items of consideration and the amounts recognised in the financial statements for the business combination thus have been determined only provisionally, the acquirer shall disclose the following information:
(i) the reasons why the initial accounting for the business combination is incomplete; (ii) the assets, liabilities, equity interests or items of consideration for which the initial accounting is incomplete; and (iii) the nature and amount of any measurement period adjustments recognised during the reporting period.
An example of such a disclosure may be as follows:
“The initial accounting for the acquisition of Huiji Electronic Systems (China) Limited has only been provisionally determined as the acquisition occurred close to the end of the reporting period. At the date of finalisation of these financial statements, the necessary market valuations and other calculations for the items listed below had not been finalised and they have therefore only been provisionally determined based on the management’s best estimate of the likely values.
[List out assets, liabilities, non-controlling interests or items of consideration where fair values are provisionally determined]
Disclosures are made for each material business combination or in the aggregate for individually immaterial business combinations that are material collectively.
FRS 103(2009).B67(a)
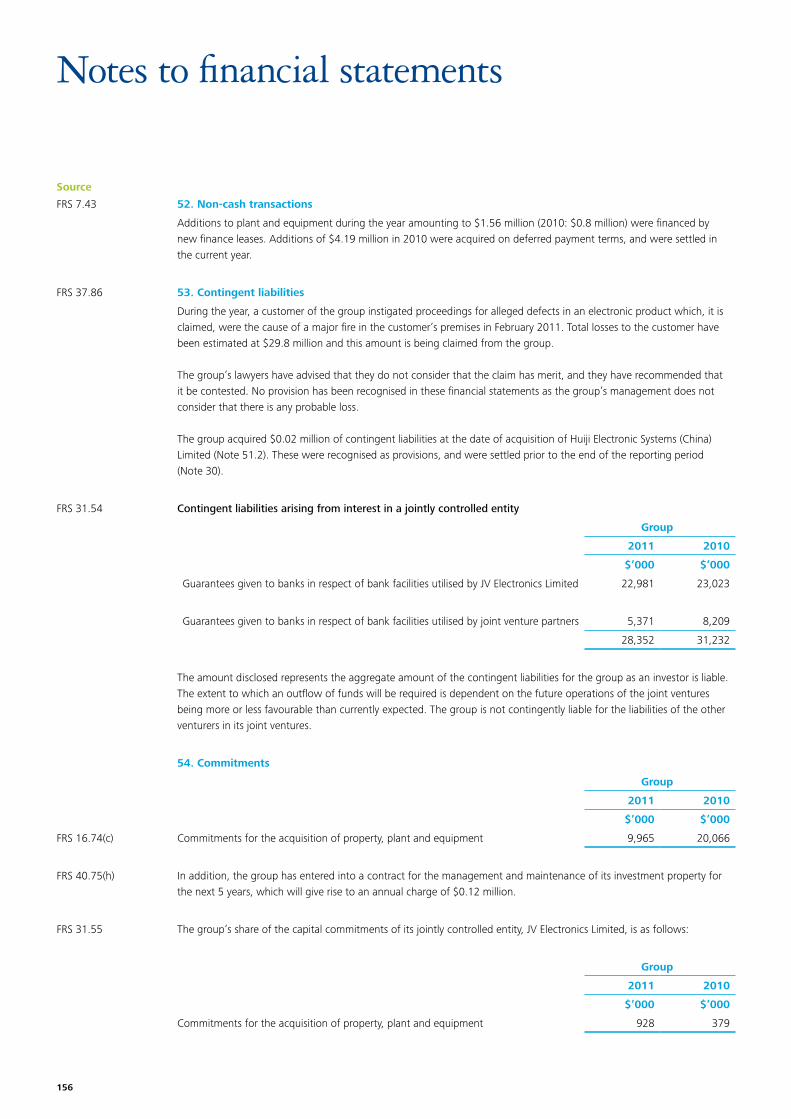
156
Source
Notes to financial statements
FRS 7.43 52. Non-cash transactions
Additions to plant and equipment during the year amounting to $1.56 million (2010: $0.8 million) were financed by new finance leases. Additions of $4.19 million in 2010 were acquired on deferred payment terms, and were settled in the current year.
FRS 37.86 53. Contingent liabilities
During the year, a customer of the group instigated proceedings for alleged defects in an electronic product which, it is claimed, were the cause of a major fire in the customer’s premises in February 2011. Total losses to the customer have been estimated at $29.8 million and this amount is being claimed from the group.
The group’s lawyers have advised that they do not consider that the claim has merit, and they have recommended that it be contested. No provision has been recognised in these financial statements as the group’s management does not consider that there is any probable loss.
The group acquired $0.02 million of contingent liabilities at the date of acquisition of Huiji Electronic Systems (China) Limited (Note 51.2). These were recognised as provisions, and were settled prior to the end of the reporting period (Note 30).
FRS 31.54 Contingent liabilities arising from interest in a jointly controlled entity
Group
2011 2010
$’000 $’000
Guarantees given to banks in respect of bank facilities utilised by JV Electronics Limited 22,981 23,023
Guarantees given to banks in respect of bank facilities utilised by joint venture partners 5,371 8,209
28,352 31,232
The amount disclosed represents the aggregate amount of the contingent liabilities for the group as an investor is liable. The extent to which an outflow of funds will be required is dependent on the future operations of the joint ventures being more or less favourable than currently expected. The group is not contingently liable for the liabilities of the other venturers in its joint ventures.
54. Commitments
Group
2011 2010
$’000 $’000
FRS 16.74(c) Commitments for the acquisition of property, plant and equipment 9,965 20,066
FRS 40.75(h) In addition, the group has entered into a contract for the management and maintenance of its investment property for the next 5 years, which will give rise to an annual charge of $0.12 million.
FRS 31.55 The group’s share of the capital commitments of its jointly controlled entity, JV Electronics Limited, is as follows:
Group
2011 2010
$’000 $’000
Commitments for the acquisition of property, plant and equipment 928 379
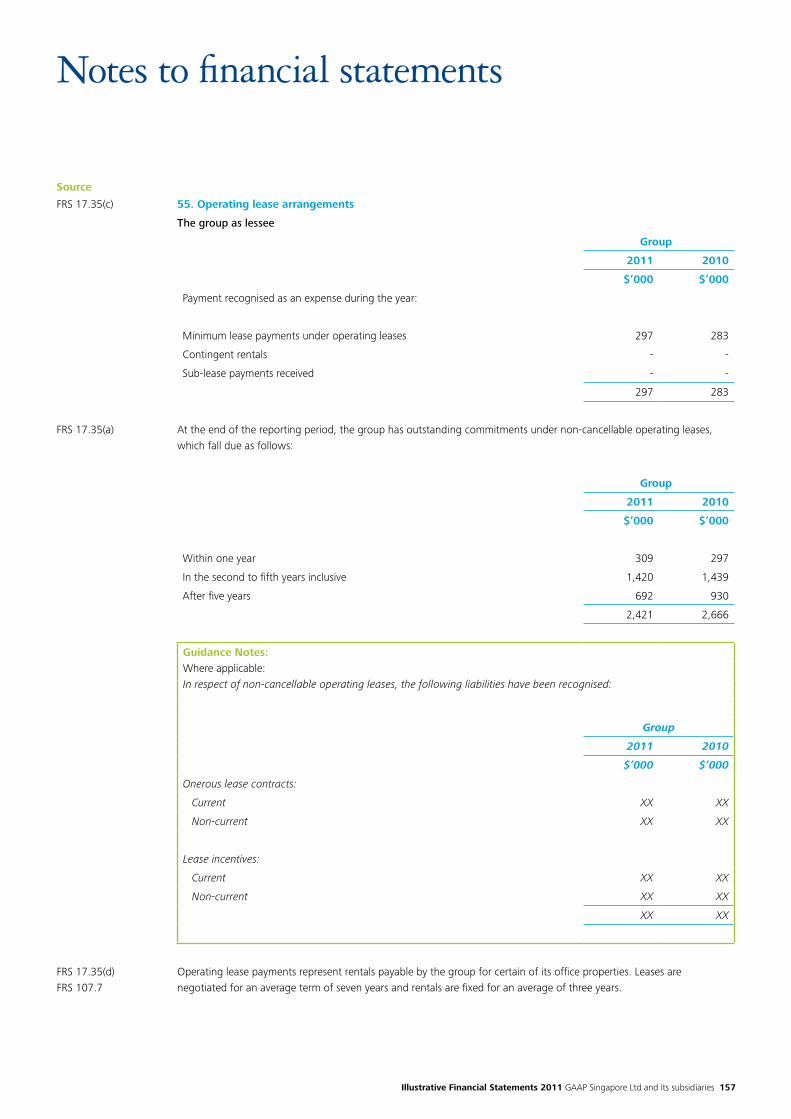
Illustrative Financial Statements 2011 GAAP Singapore Ltd and its subsidiaries 157
Source
Notes to financial statements
FRS 17.35(c) 55. Operating lease arrangements
The group as lessee
Group
2011 2010
$’000 $’000
Payment recognised as an expense during the year:
Minimum lease payments under operating leases 297 283
Contingent rentals - -
Sub-lease payments received - -
297 283
FRS 17.35(a) At the end of the reporting period, the group has outstanding commitments under non-cancellable operating leases, which fall due as follows:
Group
2011 2010
$’000 $’000
Within one year 309 297
In the second to fifth years inclusive 1,420 1,439
After five years 692 930
2,421 2,666
Guidance Notes:Where applicable:In respect of non-cancellable operating leases, the following liabilities have been recognised:
Group
2011 2010
$’000 $’000
Onerous lease contracts:
Current XX XX
Non-current XX XX
Lease incentives:
Current XX XX
Non-current XX XX
XX XX
FRS 17.35(d) FRS 107.7
Operating lease payments represent rentals payable by the group for certain of its office properties. Leases are negotiated for an average term of seven years and rentals are fixed for an average of three years.
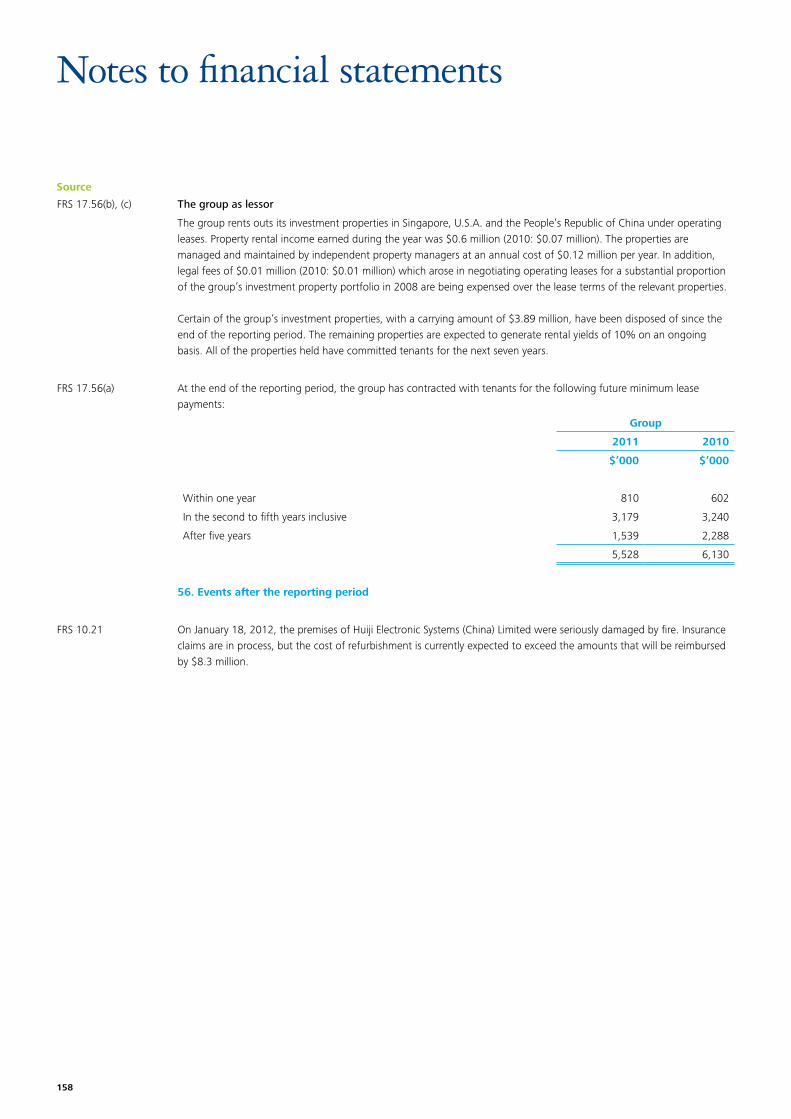
158
Source
Notes to financial statements
FRS 17.56(b), (c) The group as lessor
The group rents outs its investment properties in Singapore, U.S.A. and the People’s Republic of China under operating leases. Property rental income earned during the year was $0.6 million (2010: $0.07 million). The properties are managed and maintained by independent property managers at an annual cost of $0.12 million per year. In addition, legal fees of $0.01 million (2010: $0.01 million) which arose in negotiating operating leases for a substantial proportion of the group’s investment property portfolio in 2008 are being expensed over the lease terms of the relevant properties.
Certain of the group’s investment properties, with a carrying amount of $3.89 million, have been disposed of since the end of the reporting period. The remaining properties are expected to generate rental yields of 10% on an ongoing basis. All of the properties held have committed tenants for the next seven years.
FRS 17.56(a) At the end of the reporting period, the group has contracted with tenants for the following future minimum lease payments:
Group
2011 2010
$’000 $’000
Within one year 810 602
In the second to fifth years inclusive 3,179 3,240
After five years 1,539 2,288
5,528 6,130
56. Events after the reporting period
FRS 10.21 On January 18, 2012, the premises of Huiji Electronic Systems (China) Limited were seriously damaged by fire. Insurance claims are in process, but the cost of refurbishment is currently expected to exceed the amounts that will be reimbursed by $8.3 million.
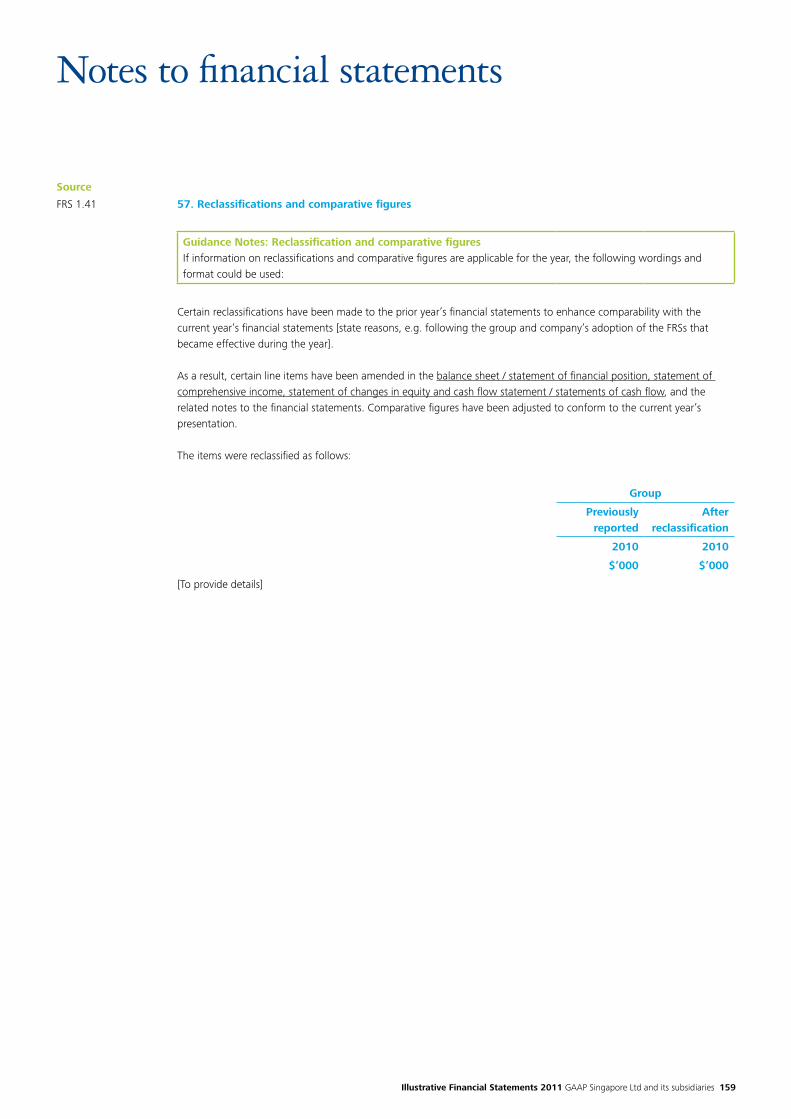
Illustrative Financial Statements 2011 GAAP Singapore Ltd and its subsidiaries 159
Source
Notes to financial statements
FRS 1.41 57. Reclassifications and comparative figures
Guidance Notes: Reclassification and comparative figuresIf information on reclassifications and comparative figures are applicable for the year, the following wordings and format could be used:
Certain reclassifications have been made to the prior year’s financial statements to enhance comparability with the current year’s financial statements [state reasons, e.g. following the group and company’s adoption of the FRSs that became effective during the year].
As a result, certain line items have been amended in the balance sheet / statement of financial position, statement of comprehensive income, statement of changes in equity and cash flow statement / statements of cash flow, and the related notes to the financial statements. Comparative figures have been adjusted to conform to the current year’s presentation.
The items were reclassified as follows:
Group
Previously reported
After reclassification
2010 2010
$’000 $’000
[To provide details]
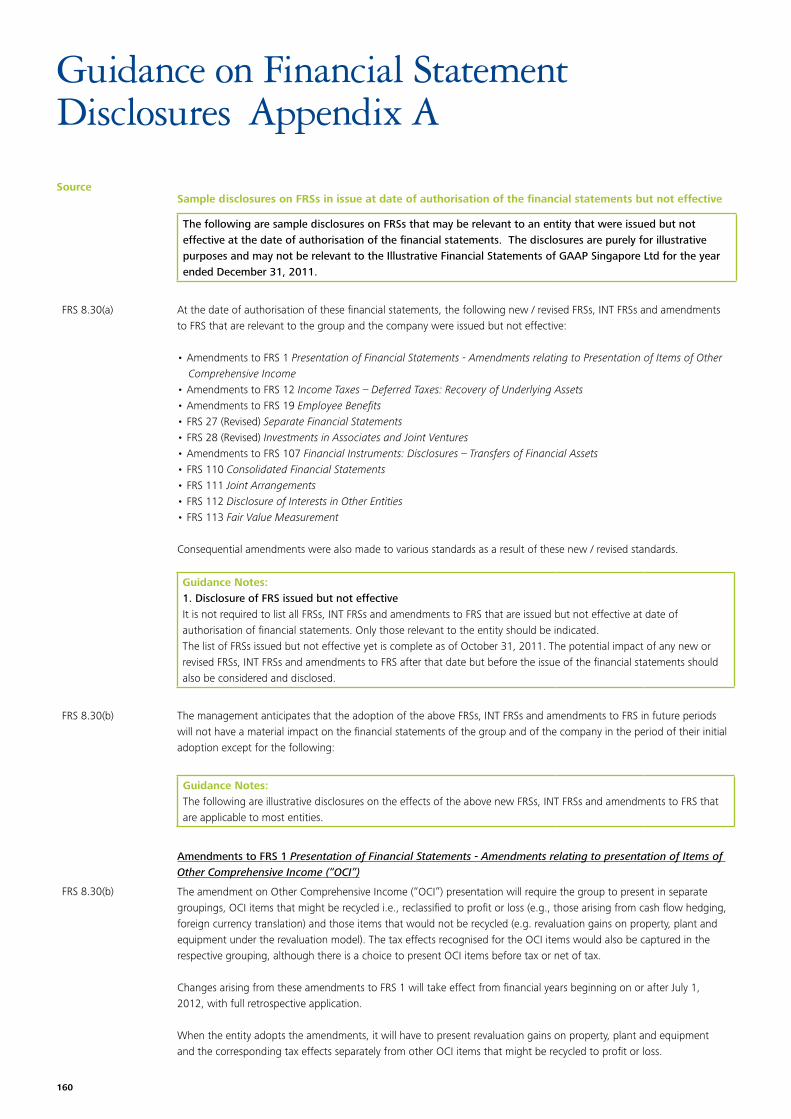
160
Source
Guidance Notes:1. Disclosure of FRS issued but not effectiveIt is not required to list all FRSs, INT FRSs and amendments to FRS that are issued but not effective at date of authorisation of financial statements. Only those relevant to the entity should be indicated.The list of FRSs issued but not effective yet is complete as of October 31, 2011. The potential impact of any new or revised FRSs, INT FRSs and amendments to FRS after that date but before the issue of the financial statements should also be considered and disclosed.
FRS 8.30(b) The management anticipates that the adoption of the above FRSs, INT FRSs and amendments to FRS in future periods will not have a material impact on the financial statements of the group and of the company in the period of their initial adoption except for the following:
Guidance Notes:The following are illustrative disclosures on the effects of the above new FRSs, INT FRSs and amendments to FRS that are applicable to most entities.
Amendments to FRS 1 Presentation of Financial Statements - Amendments relating to presentation of Items of Other Comprehensive Income (“OCI”)
FRS 8.30(b) The amendment on Other Comprehensive Income (“OCI”) presentation will require the group to present in separate groupings, OCI items that might be recycled i.e., reclassified to profit or loss (e.g., those arising from cash flow hedging, foreign currency translation) and those items that would not be recycled (e.g. revaluation gains on property, plant and equipment under the revaluation model). The tax effects recognised for the OCI items would also be captured in the respective grouping, although there is a choice to present OCI items before tax or net of tax.
Changes arising from these amendments to FRS 1 will take effect from financial years beginning on or after July 1, 2012, with full retrospective application.
When the entity adopts the amendments, it will have to present revaluation gains on property, plant and equipment and the corresponding tax effects separately from other OCI items that might be recycled to profit or loss.
The following are sample disclosures on FRSs that may be relevant to an entity that were issued but not effective at the date of authorisation of the financial statements. The disclosures are purely for illustrative purposes and may not be relevant to the Illustrative Financial Statements of GAAP Singapore Ltd for the year ended December 31, 2011.
FRS 8.30(a) At the date of authorisation of these financial statements, the following new / revised FRSs, INT FRSs and amendments to FRS that are relevant to the group and the company were issued but not effective:
•AmendmentstoFRS1Presentation of Financial Statements - Amendments relating to Presentation of Items of Other Comprehensive Income
•AmendmentstoFRS12Income Taxes – Deferred Taxes: Recovery of Underlying Assets•AmendmentstoFRS19Employee Benefits•FRS27(Revised)Separate Financial Statements•FRS28(Revised)Investments in Associates and Joint Ventures•AmendmentstoFRS107Financial Instruments: Disclosures – Transfers of Financial Assets •FRS110Consolidated Financial Statements•FRS111Joint Arrangements•FRS112Disclosure of Interests in Other Entities•FRS113Fair Value Measurement
Consequential amendments were also made to various standards as a result of these new / revised standards.
Sample disclosures on FRSs in issue at date of authorisation of the financial statements but not effective
Guidance on Financial Statement Disclosures Appendix A
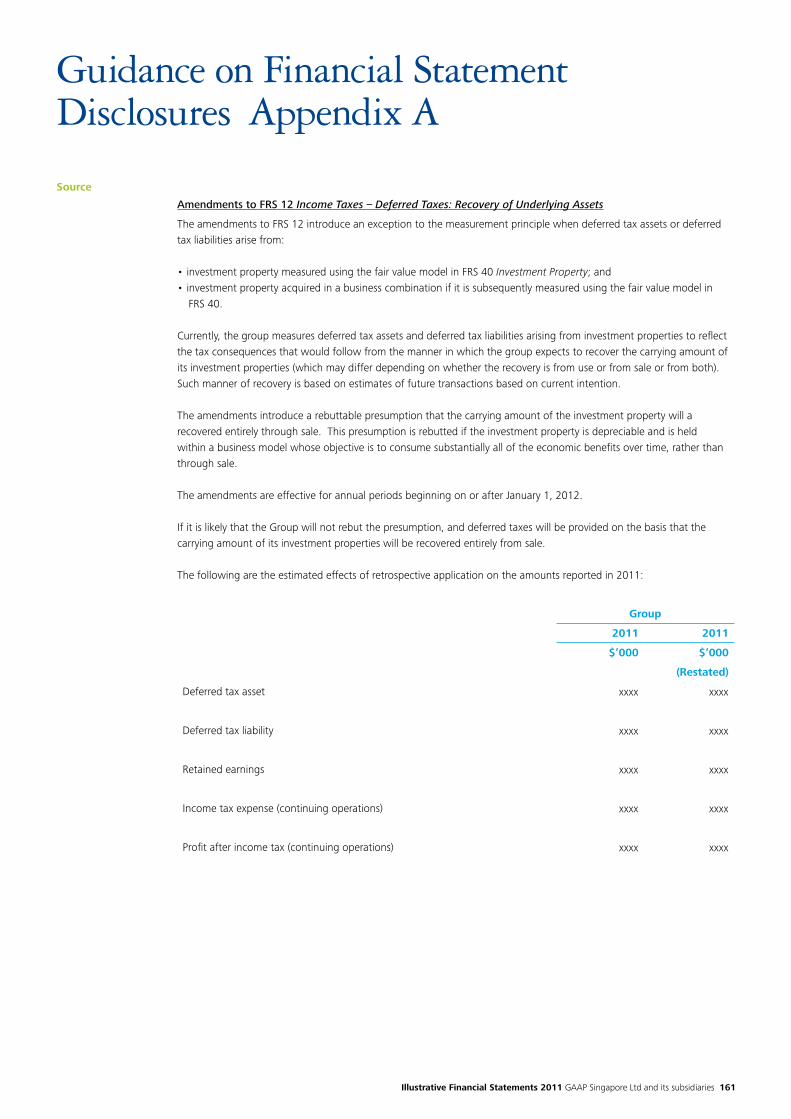
Illustrative Financial Statements 2011 GAAP Singapore Ltd and its subsidiaries 161
Source
Amendments to FRS 12 Income Taxes – Deferred Taxes: Recovery of Underlying Assets
The amendments to FRS 12 introduce an exception to the measurement principle when deferred tax assets or deferred tax liabilities arise from:
•investmentpropertymeasuredusingthefairvaluemodelinFRS40Investment Property; and •investmentpropertyacquiredinabusinesscombinationifitissubsequentlymeasuredusingthefairvaluemodelin
FRS 40.
Currently, the group measures deferred tax assets and deferred tax liabilities arising from investment properties to reflect the tax consequences that would follow from the manner in which the group expects to recover the carrying amount of its investment properties (which may differ depending on whether the recovery is from use or from sale or from both). Such manner of recovery is based on estimates of future transactions based on current intention.
The amendments introduce a rebuttable presumption that the carrying amount of the investment property will a recovered entirely through sale. This presumption is rebutted if the investment property is depreciable and is held within a business model whose objective is to consume substantially all of the economic benefits over time, rather than through sale.
The amendments are effective for annual periods beginning on or after January 1, 2012.
If it is likely that the Group will not rebut the presumption, and deferred taxes will be provided on the basis that the carrying amount of its investment properties will be recovered entirely from sale.
The following are the estimated effects of retrospective application on the amounts reported in 2011:
Group
2011 2011
$’000 $’000
(Restated)
Deferred tax asset xxxx xxxx
Deferred tax liability xxxx xxxx
Retained earnings xxxx xxxx
Income tax expense (continuing operations) xxxx xxxx
Profit after income tax (continuing operations) xxxx xxxx
Guidance on Financial Statement Disclosures Appendix A
162
Source
Amendments to FRS 19 Employee Benefits
FRS 8.30(b) The amendments to FRS 19 change the accounting for defined benefit plans and termination benefits. The most significant change relates to the accounting for changes in defined benefit obligations and plan assets. The amendments require the recognition of changes in defined benefit obligations and in fair value of plan assets when they occur, and hence eliminate the 'corridor approach' permitted under the previous version of FRS 19 and accelerate the recognition of past service costs. The amendments require all actuarial gains and losses to be recognised immediately through other comprehensive income in order for the net pension asset or liability recognised in the consolidated statement of financial position to reflect the full value of the plan deficit or surplus.
The amendments to FRS 19 are effective for annual periods beginning on or after January 1, 2013 and require retrospective application with certain exceptions. The group anticipates that the application of the amendments to FRS 19 may have impact on amounts reported in respect of the groups’ defined benefit plans. However, the group has not yet performed a detailed analysis of the impact of the application of the amendments, and hence have not yet quantified the extent of the impact.
Amendments to FRS 107 Financial Instruments: Disclosures – Transfers of Financial Assets
FRS 8.30(b) The amendments to FRS 107 increase the disclosure requirements for transactions involving transfers of financial assets. These amendments are intended to provide greater transparency around risk exposures when a financial asset is transferred but the transferor retains some level of continuing exposure in the asset. The amendments also require disclosures where transfers of financial assets are not evenly distributed throughout the period.
The group does not anticipate that these amendments to FRS 107 will have a significant effect on the group’s disclosures regarding its existing arrangements for transfers of trade receivables. However, if the group enters into other types of transfers of financial assets in the future, disclosures regarding those transfers may be affected.
FRS 110 Consolidated Financial Statements and FRS 27 Separate Financial Statements
FRS 8.30(b) FRS 110 replaces the control assessment criteria and consolidation requirements currently in FRS 27 and INT FRS 12 Consolidation -Special Purpose Entities.
FRS 110 defines the principle of control and establishes control as the basis for determining which entities are consolidated in the consolidated financial statements. It also provides more extensive application guidance on assessing control based on voting rights or other contractual rights. Under FRS 110, control assessment will be based on whether an investor has (i) power over the investee; (ii) exposure, or rights, to variable returns from its involvement with the investee; and (iii) the ability to use its power over the investee to affect the amount of the returns. FRS 27 remains as a standard applicable only to separate financial statements.
FRS 110 will take effect from financial years beginning on or after January 1, 2013, with full retrospective application.
When the group adopts FRS 110, entities it currently consolidates may not qualify for consolidation, and entities it currently does not consolidate may qualify for consolidation. The group is currently estimating the effects of FRS 110 on its investments in the period of initial adoption.
Guidance on Financial Statement Disclosures Appendix A
Illustrative Financial Statements 2011 GAAP Singapore Ltd and its subsidiaries 163
Source
FRS 111 Joint Arrangements and FRS 28 Investments in Associates and Joint Ventures
FRS 8.30(b) FRS 111 supersedes FRS 31 Interests in Joint Ventures and INT FRS 13 Jointly Controlled Entities – Non-Monetary Contributions by Venturers.
FRS 111 classifies a joint arrangement as either a joint operation or a joint venture based on the parties’ rights and obligations under the arrangement. The existence of a separate legal vehicle is no longer the key factor. A joint operation is a joint arrangement whereby the parties that have joint control have rights to the assets and obligations for the liabilities. A joint venture is a joint arrangement whereby the parties that have joint control have rights to the net assets.
The joint venturer should use the equity method under the revised FRS 28 Investments in Associates and Joint Ventures to account for a joint venture. The option to use proportionate consolidation method has been removed. For joint operations, the group directly recognises its rights to the assets, liabilities, revenues and expenses of the investee in accordance with applicable FRSs.
FRS 111 will take effect from financial years beginning on or after January 1, 2013, with full retrospective application.
When the group adopts FRS 111, arrangements currently accounted for as jointly controlled operations and jointly controlled assets may have to be equity accounted for as joint ventures; and arrangements currently accounted for as jointly controlled entities may have to be accounted for as joint operation. For arrangements that are joint ventures and were previously proportionately consolidated, the group will have to adopt equity accounting.
The group is currently estimating the effects of FRS 111 on its joint arrangements in the period of initial adoption.
FRS 112 Disclosure of Interests in Other Entities
FRS 8.30(b) FRS 112 requires an entity to provide more extensive disclosures regarding the nature of and risks associated with its interest in subsidiaries, associates, joint arrangements and unconsolidated structured entities.
FRS 112 will take effect from financial years beginning on or after 1 January 2013, and the group is currently estimating extent of additional disclosures needed.
FRS 113 Fair Value Measurement
FRS 8.30(b) FRS 113 is a single new Standard that applies to both financial and non-financial items. It replaces the guidance on fair value measurement and related disclosures in other Standards, with the exception of measurement dealt with under FRS 102 Share-based Payment, FRS 17 Leases, net realisable value in FRS 2 Inventories and value-in-use in FRS 36 Impairment of Assets.
FRS 113 provides a common fair value definition and hierarchy applicable to the fair value measurement of assets, liabilities, and an entity’s own equity instruments within its scope, but does not change the requirements in other Standards regarding which items should be measured or disclosed at fair value.
FRS 113 will be effective prospectively from annual periods beginning on or after January 1, 2013. Comparative information is not required for periods before initial application.
The group is currently estimating the effects of FRS 113 in the period of initial adoption.
Guidance on Financial Statement Disclosures Appendix A
DeloittereferstooneormoreofDeloitteToucheTohmatsuLimited,aUKprivatecompanylimitedbyguarantee,anditsnetworkofmemberfirms, each of which is a legally separate and independent entity. Please see www.deloitte.com/sg/about for a detailed description of the legal structure of Deloitte Touche Tohmatsu Limited and its member firms.
Deloitte provides audit, tax, consulting, and financial advisory services to public and private clients spanning multiple industries. With a globally connected network of member firms in more than 150 countries, Deloitte brings world-class capabilities and high-quality service to clients, delivering the insights they need to address their most complex business challenges. Deloitte’s approximately 182,000 professionals are committed to becoming the standard of excellence.
About Deloitte Southeast AsiaDeloitte Southeast Asia Ltd—a member firm of Deloitte Touche Tohmatsu Limited comprising Deloitte practices operating in Brunei, Guam, Indonesia, Malaysia, Philippines, Singapore, Thailand and Vietnam—was established to deliver measurable value to the particular demands of increasingly intra-regional and fast growing companies and enterprises.
Comprising over 230 partners and 5,300 professionals in 22 office locations, the subsidiaries and affiliates of Deloitte Southeast Asia Ltd combine their technical expertise and deep industry knowledge to deliver consistent high quality services to companies in the region.
All services are provided through the individual country practices, their subsidiaries and affiliates which are separate and independent legal entities.
About Deloitte SingaporeIn Singapore, services are provided by Deloitte & Touche LLP and its subsidiaries and affiliates.
Deloitte & Touche LLP (Unique entity number: T08LL0721A) is an accounting limited liability partnership registered in Singapore under the Limited Liability Partnerships Act (Chapter 163A).
DisclaimerThis publication contains general information only, and none of Deloitte Touche Tohmatsu Limited, its member firms, or their related entities (collectively, the “Deloitte Network”) is, by means of this publication, rendering professional advice or services. Before making any decision or taking any action that may affect your finances or your business, you should consult a qualified professional adviser. No entity in the Deloitte Network shall be responsible for any loss whatsoever sustained by any person who relies on this publication.
© 2011 Deloitte & Touche LLP