ill 1 'i! pagem appro01ed i (-weq cu' %end com. enms ~et fti · 2011-05-14 · ad-a239...
TRANSCRIPT

AD-A239 274 ICUMENTATION PAGEM Fo.m Appro01ed
I Ill 1 'I! esn~ateoto . " Cu' u oer resPr-'. -1,' .. :'9 thCne ,m o rv,ew,n9~ ihtruCItCn%, .stnI Iii~IIIihIil;ompt n and res (-weq the collection of iorm~ation %end COM. enms re arling this burden 04188t rnwihf ~et fti)r redUceg this buroec to Washington Hea0Q.&rtes SersCei. L:recorate fo nfl-ration ove'al',ond kroc,1s 1115 ;efler
SH.9h~.J . .. . 302. a nd to the Of I Ie )f Ma~nagement and Budget. Paperwork Aeounion Project (0704-0188Y.WAsh, ,on. DC 10503
1f. AGENCY USE ONLY (Leave ba) 2.RPORT DATE 3. REPORT TYPE AND DATES COVERED1 THESISn4. TITLE AND SUBTITLE 5. FUNDING NUMBERS
Retrofit Strengthening of a seismically
Inadequate Reinforced Concrete Frame Using Pre-stressed Cable Bracing Systems and Beam Alteratihn
6. AUTHOR(S)
James E. Welter, Captain
7. PERFORMING ORGANIZATION NAME(S) AND ADDRESS(ES) 8. PERFORMING ORGANIZATIONREPORT NUM8ER
AFIT Student Attending: University of Oklahoma AFIT/GI/GIA-' 91-020
9. SPONSORING/I MONITORING AGENCY NAME(S) AND ADDRESS(ES) 10. SPONSORING / MONITORING
AGENCY REPORT NUMBER
AFIT/CIWright-Patterson AFB OH 45433-6583
11. SUPPLEMENTARY NOTES
12a. DISTRIBUTION /AVAILABILITY STATEMENT 12b. DISTRIBUTION CODEApproved for Public Release IAW 190-1Distributed UnlimitedERNEST A. HAYGOOD, 1st Lit, USAFExecutive Officer
13. ABSTRACT (Maximum 200 words)
DTICS 'CL ECTE0
91-07318 AUo 19
14. SUBJECT TERMS 15. NUMBER OF PAGES190
6. PRICE CODE
17. SECURITY CLASSIFICATION 18. SECURITY CLASSIFICATION 19. SECURITY CLASSiFICATION 20. LIMITATION OF ABSTRACTOF REPORT OF THIS PAGE OF ABSTRACT1 __________
%.SN 751-01-21t30-5500J 3:',!rdo!c.' t ,, : -rv Z-9

THE UNIVERSITY OF OKLAHOMA
GRADUATE COLLEGE
RETROFIT STRENGTHENING OF A SEISMICALLY INADEQUATE REINFORCED CONCRETE
FRAME USING PRESTRESSED CABLE BRACING SYSTEMS AND BEAM ALTERATION
A THESIS
SUBMITTED TO THE GRADUATE FACULTY
in partial fulfillment of the requirements for the
degree of
MASTER OF SCIENCE
By
JAMES E. WELTER
Norman, Oklahoma
1991

RETROFIT STRENGTHENING OF A SEISMICALLY INADEQUATE REINFORCED CONCRETE
FRAME USING PRESTRESSED CABLE BRACING SYSTEMS AND BEAM ALTERATION
A THESIS
APPROVED FOR THE SCHOOL OF
CIVIL ENGINEERING AND ENVIRONMENTAL SCIENCE
if - -
r.ak k rim ,'.'[
Di:t g ; ,:
7 1,'
Di A
BY

Dedicated to My Three Girls
Leslie, Amber, and Ashleigh

ACKNOWLEDGXMENTS
The author expresses his heartfelt gratitude to Dr. Thomas D. Bushfor his instruction, ideas, guidance, insight, and advise during thecourse of this research effort. Sincere appreciation is expressed to mycommittee members, Dr. Benjamin J. Wallace, and Dr. M. R. Tahari as wellas Dr. A. Kukreti and Dr. M. Harajali who all offered advise andsuggestions when they were needed most.
Special thanks goes to the United States Air Force and the AirForce Institute of Technology for making this experience possible byselecting the author to pursue a M.S. in Civil Engineering. The AirForce provided the time and financial support required to complete thiswork. Equally important to the author was the support of his wife,Leslie. Written words cannot adequately convey how much her hard work,understanding, companionship, and love contributed to the authorthroughout the pursuit of this degree as well as every day of his life.
Finally, the author wishes to thank the Lord God for sitting in thechair beside him and never getting up until it was all finished.
iv

TABLE OF CONTENTS
Page
LIST OF TABLES .......... .......................... ix
LIST OF FIGURES ............. .......................... x
ABSTRACT ............ ............................. .. xv
Chapter
1. INTRODUCTION ............. ......................... 1
1.1 GENERAL ............. ......................... 1
1.2 OBJECTIVE ............ ........................ 7
1.3 SCOPE ............ ........................ 8
2. BACKGROUND AND LITERATURE REVIEW ..... ............... .. 10
2.1 NEED FOR RETROFIT BRACING IN EXISTING STRUCTURES (STRONG
BEAM - WEAK COLUMN DESIGNS) ....... ............... 10
2.2 BEHAVIOR OF REINFORCED CONCRETE SHORT COLUMNS SUBJECTED
TO CYCLIC LATERAL LOADS ...... ................. . 13
2.3 EXPERIMENTAL AND ANALYTICAL STUDIES FOCUSING ON RETROFIT
STRENGTHENING OF REINFORCED CONCRETE FRAME STRUCTURES 16
2.4 SUMMARY OF PRESTRESSED CABLE BRACING SYSTEMS RESEARCH 22
2.4.1 Analytical Model Of A Frame Subassemblage . . .. 22
2.4.2 Parameters Examined In Previous Study On
Prestressed Cable Bracing Systems . ........ .. 26
2.4.3 Conclusions From Previous Study On Prestressed
Cable Bracing Systems .... .............. . 31
v

3. MODELING THE PROTOTYPE FRAME AND BRACING SYSTEM USING DRAIN-2D 36
3.1 SELECTION AND GENERAL DESCRIPTION OF THE COMPUTER PROGRAM 36
3.2 DESCRIPTION OF FRAME ANALYZED ..... .............. . 38
3.3 MODELING REINFORCED CONCRETE FRAME MEMBERS WITH ELEMENT
EL7 ........... ........................... .. 42
3.4 MODELING PRESTRESSED CABLE BRACES WITH ELEMENT ELl(m) . 45
3.5 MEMBER PROPERTIES USED IN THE ANALYTICAL MODEL ..... . 48
3.6 STATIC INCREMENTAL LOADING ..... ............... . 60
3.6.1 Monotonic Loading ..... ................ . 60
3.6.2 Cyclic Loading ....... .................. . 61
3.7 RESPONSE OF THE UNBRACED AND BRACED SUBASSEMBLAGE . . .. 61
3.7.1 Failure Sequence Of The Unbraced Subassemblage . 63
3.7.2 Response Of The Braced Subassemblage ....... ... 63
4. EFFECTIVENESS OF BEAM ALTERATION IN CONJUNCTION WITH
PRESTRESSED CABLE BRACES ....... ................... . 67
4.1 BEAM ALTERATION IN FRAMES WITH WEAK COLUMNS-STRONG BEAMS. 67
4.2 INTRODUCTION OF BEAM ALTERATION PARAMETERS . ....... .. 70
4.2.1 The r And q Ratios .... ............... . 70
4.2.2 Beam Weakening Parameters ... ............ .. 74
4.3 EVALUATION OF BEAM ALTERATION SCHEMES ... .......... .. 77
4.4 EFFECT OF BEAM ALTERATION ON CYCLIC RESPONSE . ...... .. 81
4.5 RESPONSE OF THE BRACED SUBASSEMBLAGE WITH BEAM ALTERATION 85
4.5.1 Monotonic Behavior ...... ................ . 85
4.5.2 Cyclic Behavior ...... ................. . 89
vi

4.5.3 Variation Of Prestressed Cable Brace Area To
Attain Desired Strength .... ............. .. 91
5. PRESTRESSED CABLE BRACES APPLIED TO A SIX STORY VERSION OF THE
PROTOTYPE FRAME ........ ....................... . 97
5.1 MODELING THE SIX STORY PROTOTYPE FRAME .. ......... .. 98
5.1.1 Design Of The Prototype Frame .. .......... .. 98
5.1.2 Selection Of A Typical Six Story Subassemblage Of
The Prototype Frame ...... ............... . 104
5.1.3 Prestressed Cable Brace And Beam Alteration
Schemes Used In The Study .... ............ 106
5.2 RESPONSE OF THE SIX STORY FRAME USING UNIQUE SINGLE
SUBASSEMBLAGE ANALYSIS ...... ................. .. 111
5.2.1 Monotonic Response Of The Unstrengthened Frame . . 111
5.2.2 Monotonic Response Of The Braced-Unaltered Frame . 116
5.2.3 Monotonic Response Of The Braced-Altered Frame 119
5.3 EVALUATION OF THE SINGLE STORY GENERIC SUBASSEMBLAGE
HYPOTHESIS BY CONTRAST WITH RESULTS OF A SIX STORY
SUBASSEMBLAGE ANALYSIS ...... ................. . 121
5.4 DISCUSSION OF PRACTICAL DESIGN STRENGTH RATIO SCHEMES FOR
THE PROTOTYPE FRAME ....... ................... . 128
6. INSTALLATION OF PRESTRESSED CABLE BRACING SYSTEMS AND
CONNECTION DESIGN ........ ...................... . 131
6.1 PRACTICAL CONSIDERATIONS FOR APPLICATION OF PRESTRESSED
CABLE BRACING SYSTEMS ....... .................. . 131
6.2 CONCEPTS FOR POST-TENSIONING CONNECTOR DESIGNS ...... .. 141
vii

7. SUMMARY AND CONCLUSIONS ................... 148
7.1 SUMMARY . . . . . . . . . . . . . . . . . . . . . . . . . 148
7.2 CONCLUSIONS ......... ....................... .. 150
7.3 RECOMMENDATIONS FOR FUTURE RESEARCH ... .......... 154
REFERENCES ............ ............................ 157
APPENDIX A - REVISED USER'S GUIDE FOR DRAIN-2D MAIN PROGRAM WITH
ELEMENTS EL7 AND ELI(m) ..... ............... . 159
APPENDIX B - WORKED EXAMPLE WITH DRAIN-2D (BRACED SUBASSEMBLAGE). . 187
viii

LIST OF TABLES
TABLE NO. PAGE
4.1 Beam Alteration Schemes ...... ................. . 77
5.1 Comparison Of 1955 and 1988 Of Total Story Shear Forces
For A Six Story Prototype Frame .... ............. .. 99
5.2 Prestressed Cable Brace Area Schemes ... .......... 109
5.3 Beam Alteration Scheme A For The Six Story Subassemblage. 112
5.4 Ultimate lateral Capacity Of The Unstrengthenened Frame
By Story ......... ........................ . 116
5.5 Ultimate Load Ratios Attained By Various Bracing Schemes. 129
6.1 Standard Seven Wire Prestressing Cable Sizes, Grade 270 132
ix

LIST OF FIGURES
FIGURE NO. PAGE
1.1 Seismic retrofitting techniques ...... ............. 4
2.1 Seismic damage to short columns, Japan .. ......... . 11
2.2 "Captive" columns ....... .................... . 12
2.3 Experimental load-deformation curves for short columns 12
2.4 Typical load-deformation curve for reinforced concrete
Column ......... ......................... . 15
2.5 Axial failure of a short column deformed laterally . . 15
2.6 Typical load-displacement relationships for different
retrofitting techniques ...... ................. . 18
2.7 Plan and elevation of prototype building . ........ . 20
2.8 Frame model, boundary conditions of the test set up . 21
2.9 Braced column of the prototype frame .. .......... . 23
2.10 Analytical model of the subassemblage . ......... . 24
2.11 Braced frame under monotonic loading, n-2, and 0.25Py and
0.5Py prestressing forces .... ............... . 32
2.12 Unbraced frame, bracing system and braced frame under
monotonic loading, n-2, and 0.5Py prestressing force . 34
3.1 Example building ....... .................... . 39
3.2 Cross section of beam and column of prototype frame . . 41
3.3 Idealization of element EL7 .... .............. 43
3.4 Quadrilinear moment-rotation relationship for inelastic
spring ......... ......................... . 43
x

3.5 Hysteretic rules for beam column element EL7 . ...... .. 46
3.6 Modified truss element ...... ................. . 47
3.7 Short column with strength equation .. ........... ... 50
3.8 Experimental load-deformation curve for a short column
similar to subassemblage column .... ............. .. 52
3.9 Load deformation curve for the subassemblage column . . 53
3.10 Moment-rotation relationship for the beam .......... ... 57
3.11 Moment-rotation curve for a typical rigid element . . .. 57
3.12 Loading history for cyclic case .... ............. .. 62
3.13 Response of unbraced subassemblage to monotonic loading 64
3.14 Response of unbraced subassemblage and braced
subassemblage under monotonic loading, n-2, and 0.5Py
prestressing force ...... ................... . 65
4.1 Frame lateral failure mechanisms ... ............ .. 68
4.2 Ratio q for a member in double curvature . ........ .. 72
4.3 Ratio r for a beam column joint .... ............. .. 72
4.4 Weakening parameters u, v, and w ... ............ .. 75
4.5 Beam weakening schemes for prototype building ........ .. 78
4.6 Response of subassemblage to beam alteration schemes,
monotonic loading ........ .................... . 80
4.7 Response of the unbraced subassemblage to cyclic loading. 83
4.8 Cyclic response of the subassemblage with beam alteration
scheme 2 ......... ........................ 84
xi

4.9 Response of the subassemblage with prestressed cable
bracing and beam alteration scheme 2. Ultimate design
approach with cable area - 0.88 in2 and 0.5Py prestress
force, n-2 ........ ....................... . 87
4.10 Response of the subassemblage with prestressed cable
bracing and beam alteration scheme 2. Serviceability
design approach with brace area - 0.98 in2 and 0.5Py
prestress force, n-2 ...... .................. . 88
4.11 Cyclic response of the subassemblage with prestressed
cable braces only. Ultimate design approach with n-2,
brace area - 0.88 in2 and 0.5 Py prestress force ..... .. 90
4.12 Cyclic response of the subassemblage with prestressed
cable braces and beam alteration scheme 2. Ultimate
design approach with brace area - 0.88 in2 and 0.5Py
prestress force ....... ..................... . 92
4.13 Cyclic response of the subassemblage with prestressed
cable braces and beam alteration scheme 2. Serviceability
design approach with brace area - 0.98 in2 and 0.SPy
prestress force ....... ..................... . 93
4.14 Matching response of the altered subassemblage with
response of the braced only subassemblage at a specified
drift. Serviceability design approach, 0.5Py prestress
force, n-2, cable area - 1.4 in2. . . . . . . . . . . . . 96
5.1 Plan and profile of the six story prototype frame . . .. 101
5.2 Spandrel reinforcement for the six story prototype frame. 102
xii

5.3 Column reinforcement for the six story prototype frame. 103
5.4 Analytical model for a six story subassemblage of the
prototype frame ........ ..................... . 105
5.5 Response of unaltered and altered single story
subassemblages for story 6, monotonic loading, u - 16 in,
v - 16 in .......... ........................ . 108
5.6 Response curves for unstrengthened single story
subassemblages to monotonic loading ... ........... ... 114
5.7 Response curves for braced-unaltered single story
subassemblages to monotonic loading, prestressed cable
brace scheme A ........ ..................... . 118
5.8 Response curves for braced-altered single story
subassemblages to monotonic loading, prestressed cable
brace scheme Al ........ ..................... . 120
5.9 Monotonic response of unbraced and braced versions of the
generic single story subassemblage, n - 2, Ac - 1.05 in2 . 1 2 3
5.10 Relative monotonic response of unbraced and braced
versions of the six story subassemblage changing size of
cable braces every story, scheme A ... ........... . 124
5.11 Relative monotonic response of unbraced and braced
versions of the six story subassemblage changing size of
cable braces every other story, scheme B .. ........ . 126
5.12 Relative monotonic response of unbraced and braced
versions of the six story subassemblage holding size of
cable braces constant, scheme B .... ............. .. 127
xiii

6.1 Freyssinet K-Range post tensioning system .. ........ .. 134
6.2 VSL multi-strand post tensioning system .. ......... ... 136
6.3 Prestressed cable bracing patterns ... ........... .. 137
6.4 Frame section showing a profile view of Pattern 2 Type B
post-tensioning connectors ..... ............... . 139
6.5 Prestressed cable bracing detail I ... ........... .. 142
6.6 Conceptual sketch of Pattern 1 Type A and B connectors 143
6.7 Prestressed cable bracing detail 2 ... ........... .. 146
6.8 Conceptual sketch of Pattern 2 Type A and B connectors 147
B.1 DRAIN-2D input data for the subassemblage ......... ... 190
xiv

ABSTRACT
-The primary objective of this thesis is to study analytically the
effectiveness of prestressed cable bracing systems in conjunction with
beam alteration / as a viable retrofit strengthening scheme for
seismically inadequate reinforced concrete structures. The prototype
//building- studied- features a strong,/beam-weak column lateral force
resisting frames. The failure mechanism is non-ductile and dominated by
shear failure of the reinforced concrete short columns. The analytical
study is carried out using DRAIN-2D, a general purpose computer program
for dynamic or static incremental/ analysis of inelastic plane frame
structures.
In the first part of the study 2 the effectiveness of prestressed
cable bracing on the response of a single story subassemblage of the
prototype frame is re-examined . The concept of beam alteration is then
introduced. A parametric study is conducted to examine how
systematically weakening the spandrel beams affects the frame's failure
mechanism. The response of unstrengthened, braced-unaltered and braced-
altered subassemblages are studied under both monotonic and cyclic
incremental displacements.
The focus of the second part of the research is on the behavior of
a six story subassemblage of the prototype frame to retrofit
strengthening. The response of unstrengthened, braced-unaltered, and
xv

braced-altered unique single story subassemblages are studied and
compared to the response predicted by a six story subassemblage. The
retrofit -schemes are evaluated with respect to their adequacy for
meeting current building code seismic strength requirements.
In the third part of the thesis sor- practical aspects of designing
and installing prestressed cable bracing systems are discussed. Several
connection details are presented which illustrate conceptually how
prestressed cable braces might be attached to a structure in a
retrofitting operation.
It was concluded analytically that prestressed cable bracing and
beam alteration used in combination can be an effective retrofit .
strengthening scheme. For the prototype frame studied significant
improvements in strength, ductility, and failure mechanism were achieved,.
in the retrofitted frame over that of the original frame.
xvi

RETROFIT STRENGTHENING OF A SEISMICALLY INADEQUATE REINFORCED CONCRETE
FRAME USING PRESTRESSED CABLE BRACING SYSTEMS AND BEAM ALTERATION
CHAPTER 1
INTRODUCTION
1.1 GENERAL
A tremendous outpouring of knowledge has been gained in the last
twenty years concerning the behavior of structures to seismic loads.
This increased understanding of seismic behavior has lead to a
significant improvement in our ability to design and build new
structures which are adequately equipped to resist significant seismic
loads. Extensive investigation of failed structures in the aftermath of
recent earthquakes, as well as knowledge derived from numerous
experimental laboratory investigations, have led to new seismic design
codes which guide engineers in designing new structures. However,
surprisingly little attention has thus far been directed toward
improving the seismic performance of existing structures to future
earthquakes.
Studies made following some recent major earthquakes suggest that a
large number of existing structures may not perform satisfactorily in an
earthquake and therefore are probably not safe. Many reinforced
concrete frame structures built in seismically active areas are likely
to fail in future earthquakes. For safety sake, such structures should
be replaced, demolished, or modified. In many cases it is not
economically feasible or desirable to replace or demolish such
1

structures. It then becomes important to look at methods of modifying
or retrofitting these structures to resist seismic loads. Much new
research is needed to devise effective, practical, economical and
aesthetically pleasing methods of seismic retrofitting.
The goal of any retrofitting scheme is to improve the structure's
performance in future earthquakes. This can be done by improving the
structure's strength, stiffness, ductility, or some combinatior of the
three. More often than not, it is the structure's lack of ductility
which is the primary concern. Ductility is the ability to maintain
strength under large deformations in the inelastic range. The
structure's failure mechanism is also of prime concern. The structure
may be able to resist quite large lateral displacements; however, when
its ultimate capacity is reached, the failure could be very sudden and
catastrophic. It is thus apparent that strength, ductility and failure
mechanism must be considered in the development of any viable
retrofitting scheme.
The most likely candidate for seismic retrofitting is a building
which is adequate to carry its intended gravity loads but is inadequate
to carry the lateral seismic design loads. Such structures may be
deficient in lateral capacity for several reasons, such as:
1. The seismic code design loads may have been increased since
the building was constructed.
2. The building may have undergone damage in a previous
earthquake.
2

3. Design or construction errors have been discovered or
suspected.
4. Changes in the building's original intended use have
occurred.
There are generally four major retrofitting techniques available
today to improve the seismic performance of existing reinforced concrete
structures. They are steel bracing systems, shear walls, wing walls,
and column strengthening. Each of these techniques is discussed briefly
below.
1. Steel bracing systems. A simple steel bracing application
is shown in Fig. lla. A steel bracing system is most
feasible if it is attached to the exterior of a building's
exterior frames. Column strengthening, wing walls, and
shear walls often require significant alteration to the
interior of the building. This is typically not true for
steel bracing systems. The fact that steel bracing
systems can be installed with minimal disruption to the
building's current function and its occupants is a major
advantage over other retrofitting techniques.
2. Shear walls. Application of shear walls is illustrated in
Fig. l.lb. Shear walls are created by infilling certain
bays, usually the bays of interior frames. Shear walls
are an efficient method of strengthening and stiffening a
building.
3

LIZI N Steel bracing
(A)
___ ___ ___ ___ ___ ___ Shear walls
(B)
Wing walls
(C)
Column jacket(D)
Fig. 1.1 Seismic retrofittin techniques [3]

3. Wing walls. A simple application of wing walls to an
existing frame is shown Fig. l.lc. In this technique one
strives to strengthen the columns and improve overall
ductility. Improvement in structural ductility can be
achieved by ensuring the beams yield before the columns.
Cast-in-place or precast walls are added to each side of
the columns. This in essence adds cross sectional area to
the columns thus increasing column strength and stiffness.
4. Column strengthening. The concept of column strengthening
is indicated in Fig. l.ld. In this technique, the columns
are strengthened by encasing the columns with steel or
reinforced concrete. As with wing walls, a designer may
be successful in not only improving the lateral strength
of the columns but in improving the failure mechanism of
the entire structure as well. This is done by increasing
the lateral capacity of the columns to such a level that
the beams yield before the columns. The end effect is
that overall structural ductility of the frame is
improved.
The focus of this study is prestressed cable bracing systems which
can be classified as a special case of traditional steel bracing. One
significant disadvantage of traditional steel compression braces under
cyclic loading is the problem of destructive inelastic buckling. Once a
steel brace buckles in the "compression" portion of a loading cycle, the
capability of the brace to dissipate energy in subsequent cycles is
5

greatly reduced. The shape of the hysteresis curves become narrow or
pinched. Even if the structure survives large inelastic deformations
during an earthquake, che steel bracing system may 'e permanently
damaged. Inelastic buckling of the steel bracing can be reduced or
eliminated entirely by designing the braces with either very low or very
high slenderness ratios.
Braces with low slenderness ratios yield in compression before
buckling. They maintain good hysteretic behavior; however, such
sections can become very stocky, expensive, and unsightly.
Cables, on the other hand, have very high slenderness ratios (kl/r
approaching infinity). Cables have the advantage of eliminating
destructive inelastic buckling altogether. Cables simply go slack under
compressive loading and then pick up load again when subjected to
tension. Because the buckling load of the cables is nil only the
tension members resist load. However, if a pretension force is applied
to the cables, all cables will resist load within a given loading cycle
even under "compression". This is true up to some critical drift at
which the prestressing force in the cables subjected to "compressive"
load is relieved and the cables finally go slack.
Relatively little research has been conducted concerning
prestressed cable bracing systems. In this study, previous research
efforts using prestressed cable braces will be re-evaluated and
extended. In particular, application of prestressed cable braces to a
specific class of reinforced concrete frame structure commonly
constructed in California in the 1950's and 1960's will be examined.
The prototype frame to be studied features reinforced concrete short
6

columns. Thus, the frame contains a weak column-strong beam
configuration. Such a frame is likely to fail in a very undesirable
mode. The weak columns may fail in shear before the beams yield in
flexure. Such a failure can be sudden and catastrophic.
Bracing a weak column-strong beam frame with prestressed cable
braces cannot in itself guarantee satisfactory behavior under large
inelastic lateral deflection. Although the lateral capacity of the
frame is improved, the ultimate failu.e mode of the frame may remain
unchanged.
Beam alteration is a technique aimed at moving failure away from
the columns and into the beams. This can be accomplished by weakening
the beam just enough to guarantee that the beam will yield in flexure
before the columns fail in shear. Complementing a prestressed cable
bracing system with beam alteration on a subassemblage of the prototype
frame is studied in chapter 4. The focus of chapter 5 is the behavior
of single story and multi-story subassemblages of the prototype frame to
various prestressed cable bracing schemes with and without beam
alteration.
1.2 OBJECTIVE
The objectives of this research are threefold:
1) To study analytically the combined effects of prestressed
cable bracing and beam alteration to the response of a
reinforced concrete frame subassemblage. Can beam
alteration improve the failure mechanism of the structure?
7

What is the effect of combining prestressed cable bracing
and beam alteration to the monotonic and cyclic response
of a single story subassemblage of the prototype frame?
How are strength, stiffness, ductility, and failure
mechanism effected?
2) To compare the response curves of unique single story
subassemblages to a multi-story subassemblage of the
prototype frame retrofitted with prestressed cable bracing
and beam alteration. Is similar response predicted by
both models? Can the retrofit strengthening scheme of an
entire frame be engineered by considering the response of
a single generic single story subassemblage?
3) To consider some practical aspects of retrofitting
existing structures with prestressed cable bracing
systems. Is it practical to attach prestressed cable
bracing systems to the exterior frames of buildings? What
are some of the design considerations? Conceptually, how
might some typical connections look?
1.3 SCOPE
This research is limited in scope to the reinforced concrete
structural frame studied experimentally and analytically by researchers
at the University of Texas at Austin, and the University of Oklahoma [7,
2, 3]. For the purpose of studying the combined effects of a
prestressed cable bracing system and beam alteration, a subassemblage of
8

the structure's exterior frame will be utilized. The subassemblage
consists of a column and two beams, braced with two prestressed cable
braces. It will be assumed that the subassemblage column will maintain
its capacity to carry gravity loads up to large drifts despite potential
shear failure of the column.
For the purpose of studying the response of an entire frame, it
will be necessary to design the remainder of the prototype frame making
use of design details available of the prototype experimental frame [3],
and appropriate code provisions available at the time such structures
were originally designed [10, 11, 12]. A multi-story subassemblage of
the prototype frame will be developed and used to represent the response
of the complete frame. The behavior of the unbraced and braced frame to
static lateral monotonic and cyclic loadings will be examined by using
DRAIN-2D, a Fortran program developed previously for the dynamic
inelastic analysis of plane frame structures [1].
9

CHAPTER 2
BACKGROUND AND LITERATURE REVIEW
2.1 NEED FOR RETROFIT BRACING IN EXISTING STRUCTURES (STRONG BEAM-WEAK
COLUMN DESIGNS)
The aim of any retrofitting scheme is to modify a structure in such
a way that the overall performance of the building in an earthquake is
improved to an acceptable level. This should be accomplished for the
least cost and the least disruption to the existing function of the
facility. In many cases it is the deficiency in ductility that can be
expected to result in excessive structural damage. Post earthquake
observations have indicated that severe damage to reinforced concrete
structures has been due primarily to the instability of columns under
large lateral deformation, and she.,: oiqtress of short columns. Columns
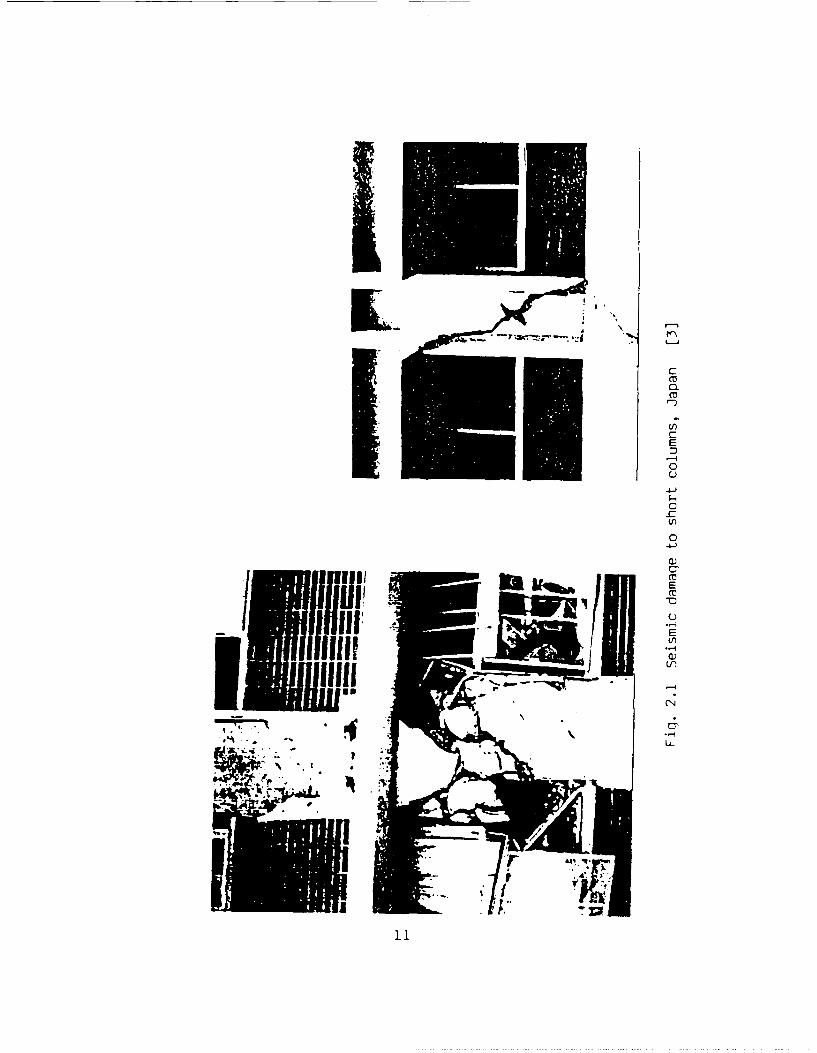
failing in shear must L avoided if possible. Two examples of short
column failure u-der seismic loading are shown in Fig. 2.1. Such
failures are non-ductile, sudden, and can be catastrophic. As will be
discussed, short columns exhibit unstable hysteretic behavior as well as
degrading stiffness and strength when subjected to cyclic loading. For
the purpose of this discussion, a short reinforced concrete column is
defined as one whose clear height to depth ratio is less than 3.
Short columns are many times unintentionally designed into a
structure. Often their existence results from the placement of
nonstructural exterior walls as shown in Fig 2.2. Masonry or other
infill walls effectively reduce the clear height of the column from Lc.
to L'c' Columns of this type, are called "captive" columns and
10
cu
LLOEn0
4-)
0cE
u-
I Elong
- I C
I

C,.LOTHER INFILLED
WALLS
BARE FRAME *CAPTIVCE COLUMN
Fig. 2.2 "Captive columns" [21
10o 0. C.09- 32
V 0--- C- 8- 21,/." '" O-O\ O
S x •x .. X C - D a - 9AcA "o \ . , -.- , C..
S / \ \o
/ ". - + 1.13 In.
\ \0 1.75 . TIE
o In. TI
Defledllon
0 0.2 0.4 0.6 O.s 1.0 1.2 (i I
Fig. 2.3 Experimental load-deformation curves for short columns[2]
12

generally fail in shear. Failures of captive columns have been reported
following several earthquakes such as the 1985 Mexico City earthquake
[3].
If a beam-column frame is subjected to lateral loads, the columns
will bend in double curvature. It is reasonable to assume that the
columns will develop a point of inflection at or near mid height. The
shear in the column is proportional to the magnitude of the end moments.
In fact the shear is equal to the sum of the end moments divided by the
clear length of the column. For joint equilibrium, the sum of the beam
moments must equal the sum of the column moments. If the capacities of
the beams are very large as compared to the capacities of the columns,
such that the beams will not fail in flexure or shear (strong beam-weak
column configuration), it is possible that relatively large end moments
will be transferred to the columns. Short columns will develop
tremendous shear stresses under these conditions. Typically the short
columns will reach their maximum capacity before the beams and then fail
in shear. As mentioned earlier, shear failure of short columns is non-
ductile and occurs without much warning. In the interest of public
safety, such weak column-strong beam situations should be corrected
where possible. Therefore, strong beam-weak column structures are prime
candidates for retrofit strengthening.
2.2 BEHAVIOR OF REINFORCED CONCRETE SHORT COLUMNS SUBJECTED TO CYCLIC
LATERAL LOADS
Extensive experimental work has been undertaken concerning the
behavior of short columns under lateral loads. The most notable work
13

was carried out by Jirsa, Woodward, and Umehara at the University of
Texas at Austin [5, 6]. Experimental load-deformation curves for short
columns are shown in Fig 2.3. Researchers were able to draw several
important conclusions from such experimental results. They are as
follows:
1. After the short column reaches its maximum shear capacity,
the lateral load carrying capacity of the column is
reduced with increasing lateral deflection as idealized in
Fig. 2.4. As indicated in the figure, the ultimate shear
capacity of the column, Vu, is reached at a relatively low
lateral deflection.
2. The short column exhibits negative stiffness for drift
levels exceeding that corresponding to the column's
ultimate shear capacity. This negative stiffness can be
observed as the negative slope region in Fig. 2.4.
3. The behavior of the column is dependent on the span to
depth ratio, 2a/d, the magnitude of axial compression, N,
and the amount of confinement provided by the transverse
reinforcement.
4. Under cyclic lateral loading, Umehara concluded a
compressive load on a short column increases the shear
strength of a column; however, it also accelerates the
strength degradation of the column after shear failure.
In short, an axially loaded column is stronger in shear
but less ductile than the same column without axial load.
14

LLateral load H
a uv, Lateral dritft a~ Oun n
V- 4...
Fig. 2.4 Typical load-deformation curve for a reinforced concrete
short column [3]
Axial load PAxial capacity N
PU
Axial capacit''-.
p Axial loadAxialfailure
Laterai drift a aun
Fig. 2.5 Axial failure of a short column deformed laterally [3]
15
As a result, the hysteretic behavior of the short column
is very poor and the column dissipates very little energy.
In an unbraced frame subjected to lateral loads, the columns may
fail in shear for low values of drift. Even though it is possible that
the columns could carry additional vertical load, the frame is
considered to have failed. In a braced frame, however, the bracing
system can be designed to carry most, if not all, of the lateral force,
thus allowing the braced frame to carry the vertical gravity loads up to
a much greater drift. It can be expected, however, that at some unknown
lateral drift, the columns will be incapable of carrying their intended
axial load. This concept is illustrated in Fig. 2.5. Very little
research has been conducted to date which would enable prediction of the
lateral drift at which the axial load carrying capacity of the column is
affected. Tests on axially loaded short columns submitted to lateral
drift have focused on the shear strength and were stopped when the
lateral capacity deteriorated to a given level. For the purposes of
this research, it is assumed that the columns will maintain their axial
load carrying capacity up to very large drifts. With this assumption
the focus of the study will be concentrated on the task of improving the
frames lateral strength through retrofit bracing.
2.3 EXPERIMENTAL AND ANALYTICAL STUDIES FOCUSING ON RETROFIT
STRENGTHENING OF REINFORCED CONCRETE FRAME STRUCTURES
Much of the original research on seismic retrofitting was conducted
in Japan following several destructive earthquakes [3]. Many reinforced
concrete buildings were retrofitted to repair damage suffered by
16
earthquakes while others were retrofitted to guard against damage in
future seismic events. Most applications involved the use of cast in
place infill walls for low rise structures. Wing walls and column
strengthening were used in most other applications. Very few
applications of steel bracing systems were undertaken primarily because
of lack of confidence and design data available for such systems.
Research programs were undertaken to evaluate the various retrofitting
applications in place.
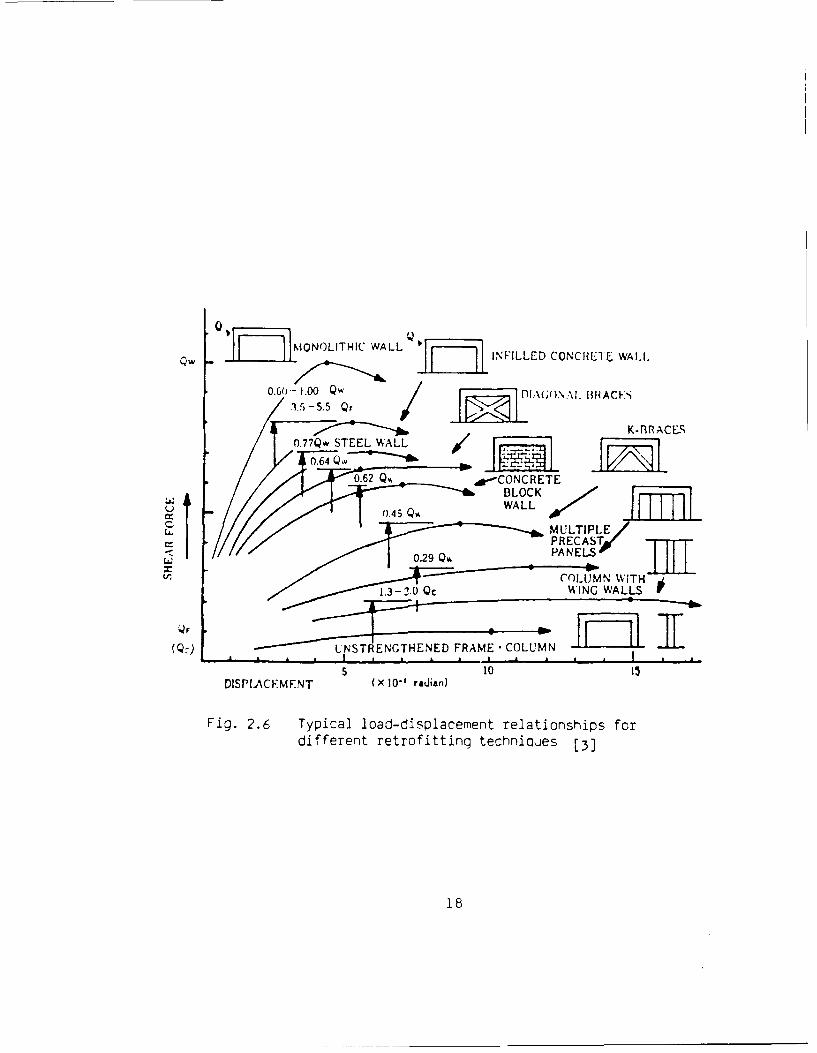
Of particular interest to this study is a series of tests conducted
by Sugano and Fujimura [8]. Tests were conducted on third scale, one
story single bay frames retrofitted with several strengthening schemes.
The frames were subjected to static cyclic lateral loading and the load
deformation response curves plotted. The test results are summarized in
Fig. 2.6. Examination of this figure reveals that the frame infilled
with concrete proved to be the strongest and stiffest scheme; however,
it provided the least ductility. The steel diagonally braced frames
performed very well providing significant increases in both strength and
ductility. The "X" pattern braces were observed to perform superior to
"K" or "Diamond" bracing patterns. Also of note was that a retrofitting
scheme making use of tension braces displayed the largest energy
dissipation capacity (not shown in the figure).
Recent experimental and analytical studies conducted at the
University of Texas at Austin have focused attention on methods of
retrofit strengthening of reinforced concrete frames for seismic loading
on structures featuring short columns [3, 7]. Bush conducted
experimental tests on a prototype building typical of a class of
17
JJ i OOLTHIC WALL INILLED CONCHI C WALL.
0.6o- 1.00 Qw/ L P[AGONAI. [HAC S
1.5"5.5 Q--
0.77Qw STEEL WALL
0. -CONCRETE
I / " {0.45 Q% AL
MULTIPLE PNLPRECAST'
< PANELS'
1.3 2.0QC "ING WALLS
(Q:)L --. . LNSTRENGTHENED FRAME • COLUMN
s 10DISPI.ACEMENT (x 10- radian)
Fig. 2.6 Typical load-displacement relationships for
different retrofitting technioues [3]
18

buildings commonly constructed in California about 30 years ago for
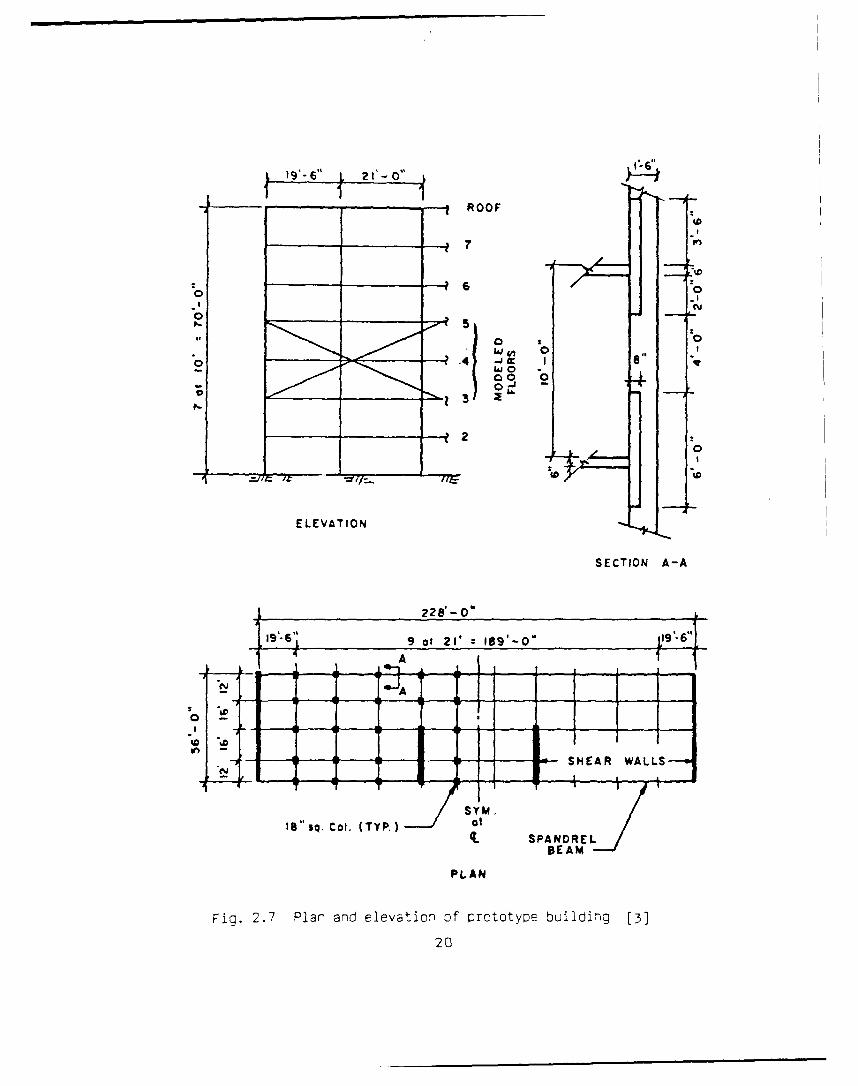
commercial and residential use. A plan and elevation of the prototype
structure are shown in Fig. 2.7. In this type of structure, almost the
entire lateral load resisting capacity of the building in the long
direction is provided by the exterior frames. The exterior frames are
characterized by deep spandral beams and short columns. Tests were
conducted on a two-thirds scale frame which represented a portion of the
prototype building's exterior frame. The test frame modeled two bays of
the prototype frame between the third and fifth levels. Sketches of the
test set up and the applicable boundary conditions are shown in Fig.
2.8. The model frame was subjected to monotonic and cyclic loads before
strengthening, and after strengthening with two different retrofitting
schemes.
A related analytical study was performed by Badoux making use of
the same prototype frame. The experimental test results were duplicated
in the analytical study. Badoux also examined complementing the steel
bracing system studied with application of beam alteration techniques.
DRAIN-2D was utilized to model a subassemblage of the prototype frame
and to analyze the response of the subassemblage to monotonic and cyclic
loading. A complete description of the subassemblage is presented in
Sec. 2.4.1 and a description of the program and its current capabilities
is found in Sec. 3.1.
Two important conclusions were drawn from this research as it
applies to the present study:
First, Badoux suggested that further research should be conducted
to study the effectiveness of cable bracing systems. Bracing with
19
2 1- 0" -
-iROOF
0 -. 6
WN
00 0
0
2
ELEVATION
SECTION A-A
4 228- 0
- 6 1 ~ 9 of 21' IS9- 0
1 A
N - U SHEAR WALLS
SYM,18" sq. Col. (TYP.) at
(L SPANDRELBEAM
PLAN
Fig. 2.7 Plan and elevation of prototype buildino [3]
20

- LOADS
L J
REAC ION a __I 0
REAREACTSONS
211

cables eliminates the deteriorating effects of inelastic buckling of
braces. He suggested that energy dissipation and level of prestressing
of cable braces should be studied.
Secondly, his research showed that beam alteration was effective in
altering the failure mechanism of the prototype frame. Additionally,
when beam alteration was applied in conjunction with a steel bracing
system, the result was a braced frame with greatly improved lateral
strength and ductility.
2.4 SUMMARY OF PRESTRESSED CABLE BRACING SYSTEMS RESEARCH
Masroor [2] studied the application of prestressed cables as a
viable retrofitting scheme for reinforced concrete frame structures with
short columns. His work comprised a first extension of Badoux's
research with application of prestressed cable braces. Masroor's
analytical research revolved around the same prototype frame introduced
in previous research at the University of Texas at Austin. Masroor
limited his investigation to the behavior of the subassemblage studied
previously by Badoux.
2.4.1 Analytical Model Of The Frame Subassemblage
The subassemblage consisted of a column, two beams and two
prestressed cable braces. The subassemblage was chosen so as to
represent a typical braced interior column of the prototype building as
shown in Fig. 2.9. The subassemblage geometry and members were modeled
from the prototype frame. The analytical model of the subassemblage is
depicted in Fig. 2.10. The spandral beams of the subassemblage were
22

L19--121 1 11 l'76543
2
21'
Fig. 2.9 Braced column of the prctctv De frame [3123

Fig. 2.10 Analytical model of the subassemblage [3]
24
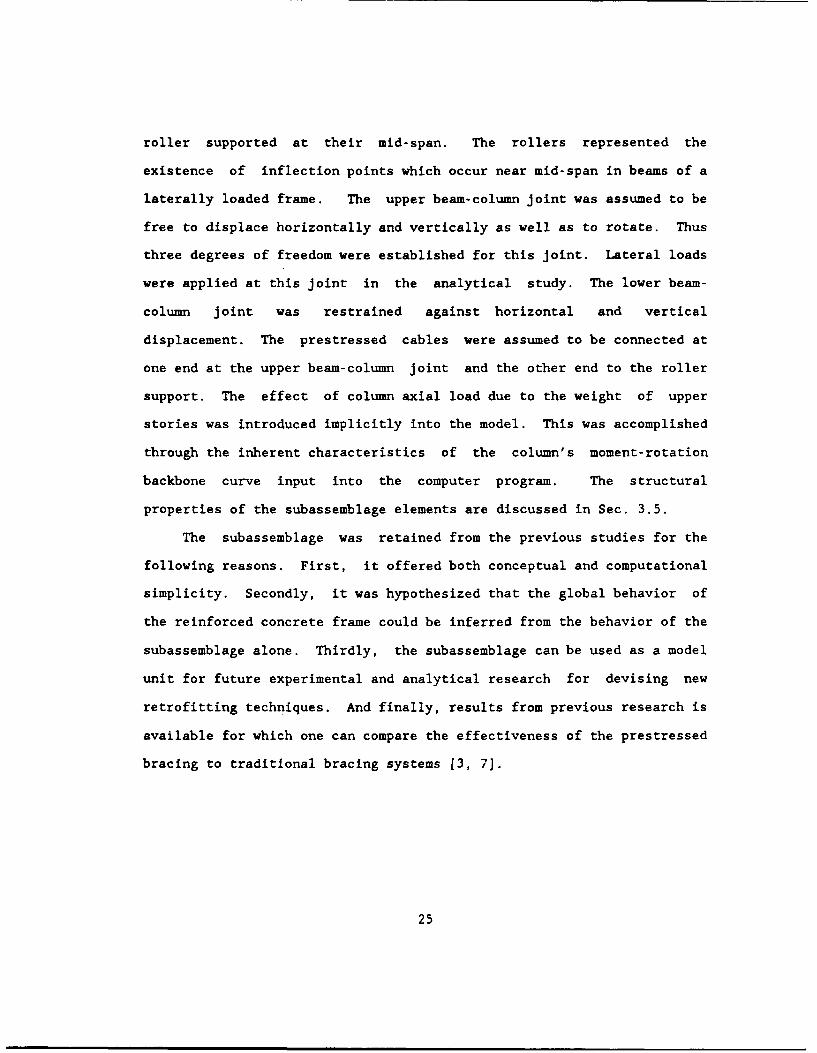
roller supported at their mid-span. The rollers represented the
existence of inflection points which occur near mid-span in beams of a
laterally loaded frame. The upper beam-column joint was assumed to be
free to displace horizontally and vertically as well as to rotate. Thus
three degrees of freedom were established for this joint. Lateral loads
were applied at this joint in the analytical study. The lower beam-
column joint was restrained against horizontal and vertical
displacement. The prestressed cables were assumed to be connected at
one end at the upper beam-column joint and the other end to the roller
support. The effect of column axial load due to the weight of upper
stories was introduced implicitly into the model. This was accomplished
through the inherent characteristics of the column's moment-rotation
backbone curve input into the computer program. The structural
properties of the subassemblage elements are discussed in Sec. 3.5.
The subassemblage was retained from the previous studies for the
following reasons. First, it offered both conceptual and computational
simplicity. Secondly, it was hypothesized that the global behavior of
the reinforced concrete frame could be inferred from the behavior of the
subassemblage alone. Thirdly, the subassemblage can be used as a model
unit for future experimental and analytical research for devising new
retrofitting techniques. And finally, results from previous research is
available for which one can compare the effectiveness of the prestressed
bracing to traditional bracing systems [3, 71.
25

2.4.2 Parameters Examined in Previous Study on Prestressed Cable
Bracing Systems
Hasroor studied the behavior of the subassemblage under two types
of static incremental displacements, monotonic, and cyclic. The
monotonic loading condition was undertaken to help in understanding the
basic behavior of the unstrengthened frame, the bracing system, and the
braced frame. The failure sequence of the members of the subassemblage
was derived from the response of the subassemblage to the monotonic
loading. The monotonic response formed a basis for the incremental
cyclic loading. The monotonic response provided a basic envelope for
the subassemblage within which cyclic loading behavior was expected to
occur. The purpose of applying the cyclic loading is to reproduce the
main character of an earthquake.
The monotonic and cyclic load cycles were held constant while the
following parameters were varied and studied for their overall effect on
the response curves for the subassemblage:
1) Optimum level of prestressing (0.25Py, 0.50Py, and 0.75Py).
2) Area of the cable braces.
3) Inclination of the cable braces.
1) Optimum level of prestressing. One of the most important
benefits of using high strength cables for braces is that a prestressing
force can be applied. It is not effective to prestress conventional
mild steel braces. The behavior of the cable bracing system, and in
turn the overall response of the braced frame is dependent on the level
26

of initial prestressing force applied to the cables. The amount of
prestress force, P, applied to a cable was specified as some percentage
of the cable yield force, Py'
In order to determine the prestress force which optimized the
response of the cable bracing system, Masroor studied three levels of
prestress force: 0.25Py, 0.50Py, and 0.75Py. With the application of
the initial prestressing force, the braces have an apparent bucklingstrength of 0.25Py, 0.50Py, and 0.75Py respectively. Similarly the
cables can carry tension forces of (Py-0.2 5Py),(Py-0.50Py), and (Py-
0.75Py) respectively. Cables are not normally capable of carrying any
load in compression; however, it is interesting to note that such is not
the case with prestressed cables. The prestressed cables in
"compression" participate in resisting the lateral displacement of the
structure through a reduction in their initial tensile force as the
deformation of the frame occurs.
2) Area of the cable braces. Two non-dimensional design
parameters, n, and m, were introduced which are dependent on bracing
cross-sectional area. Design parameters n and m were used to facilitate
the comparison of the design strength of the bracing system and the
effective lateral strength of the retrofitted structure. Design ratio n
is a measure of the increase in strength desired in the design of the
bracing system. The definition of n varies slightly depending on the
design approach used. The two design approaches examined were ultimate
design and serviceability design.
The ultimate design approach is applicable when the main objective.
of the retrofitting is to simply increase the lateral strength of the
27

frame to some desired level. Limiting interstory drift is not a primary
concern. In the ultimate approach, the retrofitted frame may reach its
ultimate lateral capacity at a drift at which the columns have
previously failed in shear. It is assumed that the vertical capacity of
the columns is maintained up to a high drift even though the columns may
have failed in shear. For the ultimate approach, the design parameter n
is defined as the ratio of the design lateral strength for a given story
of the retrofitted structure, Hr, to the ultimate lateral strength for a
given story of the unstrengthened structure, Vu,
n - Hr/Vu (2.1)
The design lateral strength of the retrofitted structure is specified at
the drift at which the isolated prestressed cable bracing system reaches
its maximum strength.
A bracing system designed under the serviceability design approach
will reach its desired lateral design strength at a specified drift
level. The specified drift, for example, might correspond to shear
failure of the columns in the prototype structure introduced in Sec.
2.3. The design ratio n is defined in the same way as for the ultimate
design approach; however, the design strength of the retrofitted
structure, Hr, is specified at the drift level desired rather than the
drift at which the bracing system attains its maximum strength.
A value of n equal to 1 means that no strengthening of the frame is
required. The original frame has sufficient strength to carry all the
lateral load. A value of n between 1 and 2 indicates some light
28

strengthening is required. If n is between 2 and 3, the structure
requires significant strengthening. More specifically, an n ratio of 2
means that the lateral strength of the retrofitted structure is twice
that of the unstrengthened structure.
The n values are controlled by varying the cable cross-sectional
area, Ac . The relationship between cross sectional area, Act and design
ratio n for this study are given below for the two design approaches and
0.5Py prestress force:
For the ultimate design approach:
Ac - [(n-.05)Vu]/[(fy)(Cos@)] (2.2)
where Ac - area of each cable brace
n - design strength ratio
Vu - the ultimate shear capacity of the story being
braced in the unstrengthened structure
fy - the yield stress of the prestressed cable braces
(230 ksi in this study)
e - inclination of the braces to horizontal
Equation 2.2 is not a general equation. Equation 2.2 applies only to
the prototype structure introduced in Sec. 2.3.
For the serviceability design approach:
Ac - [(n-l)(Vu)(L)]/[(C)(E)(hfu)(Cos2 )] (2.3)
29

where L - the length of the cable braces
C - the number of braces per story
E - modulus of elasticity of the cable braces (taken
as 26,000 ksi for this study)
fu - drift at which the unstrengthened story reaches
its ultimate strength
Equation 2.3 is general and is derived from the stiffness method. An
increase in the cable brace cross-sectional area brings about a
corresponding increase in the strength of the retrofitted frame and
design ratio n. Design ratios of 2 and 3 were studied by Masroor.
Load ratio m for any story of the frame, is the ratio of the
lateral capacity at any drift to the ultimate strength of the
unstrengthened structure. Therefore, the maximum value of m for the
unstrengthened structure is 1. The m ratio is simply a way of
normalizing the lateral strengths of the unstrengthened and braced
structures for simplified comparison.
3) Inclination of the cable braces. Two cable inclination
patterns were studied for their effect on the response of the
subassemblage. In the first type, the braces were considered to extend
from the beam-column joint centroid of one story to the centroid of the
beams of the story below. In the second configuration the braces were
attached to the beam-column joint at every story level. The
inclinations of the cable braces for the two types were calculated as
43.60 and 25.40, respectively.
30

2.4.3 Conclusions From Previous Study On Prestressed Cable Bracing
Systems
Four main conclusions were derived from Masroor's research [2]:
1. Optimum cable pretension force is 0.50Py.
2. Peak strength of the braced subassemblage is independent
of the strength of the original unstrengthened structure.
3. The responses of the braced system and the original
frame are not well matched in attaining maximum strength
at specific drifts.
4. Prestressed cable bracing alone does not effect the
overall failure mode of the subassemblage.
The optimum level of initial prestressing force for the cables is
equal to half the yield strength of the cable brace. For the
subassemblage of Fig. 2.10, the 0.50Py level of prestressing leads to
simultaneous yielding and slackening of cable braces Bl and B2. The
response of the braced subassemblage to 0.25Py and 0.50Py prestressing
forces respectively is illustrated in Fig. 2.11. It should be noted
that the response curve for the 0.75Py prestress case is identical in
shape to the 0.25Py prestress curve, and therefore is not plotted on
this figure. From Fig. 2.11 the following observations are made:
a) The braced system prestressed to 0.50Py maintains its
elastic stiffness up to a much higher drift level
(approximately 0.88% interstory drift at point a) over the
31

COMPARISION OF PRESTRESSING SCHEMESO.25Py AND 0.5Py ON THE PROTOTYPE FRAME
monotonic loading
200-
190. ULTIMA~TE DESIGN APPROPACH
180.170-
160.b -- - -
150- ~
140
'1,30
0.
N:2120-c
*110.
e100
0
-70-
60-
50-
40-
.30-
20-
10.
0i0.0 0.2 0.4 0.6 0.8 1.0 1.2 1.4 1.6
Interstory Drift (%)STMOOL - O.5PT --- O.25PY
Fig. 2.11 Braced frame under monotonic loading, n=2, and O.25Pyand O.5Py prestressing forces
32

system prestressed to 0.25Py or 0.75Py (.44% interstory
drift at point a').
b) The braced frame prestressed to 0.50Py reaches its maximum
capacity at a lower drift level (point b verses point b')
which helps in matching the strength of the unbraced frame
to the bracing system. This feature is particularly
important if using the serviceability design approach.
c) The system prestressed to 0.50Py reaches and maintains its
strength in a more desirable manner. The capacity of the
0.50?y prestressed frame gradually increases with drift up
to its ultimate capacity at point b. If prestressing of
0.25Py and 0.75Py are used, the capacity of the braced
frame reaches an initial peak at point a' then decreases
over a large interval of drift due to the negative
stiffness of the column. The system finally regains
positive stiffness again at point c'. Strength increases
up to its ultimate capacity at b'.
The effectiveness of the prestressed cable bracing system becomes
clear in Fig. 2.12. The response curves for the unbraced subassemblage,
the bracing system by itself, and the braced subassemblage are shown in
Fig. 2.12. The ultimate design approach was used with n-2. The peak
additional strength brought about by the bracing system is independent
of the unbraced frame. Study of the figure reveals that lateral
capacity of the subassemblage is reduced to essentially zero at drift
1'' corresponding to the peak strength of the braced subassemblage.
33

3.5-
ULTIMA.TE DESIGN APPROACH
3.0.
2.5
2.0 - -------
1.0
0.
-0.5-
0.0 0.2 0.4 0.6 0.8 1.0 1.2 1.4 1.6Interstory Drift (%)
- BRACEO FRAME ---- CABLE EPRC1ND UN9BPP.CE0
Fig. 2.12 Unbraced frame, bracing system, and braced frame undermonotonic loading, n=2, and O.5Py prestressing force
34

Nearly all the lateral strength of the frame at this drift is provided
by the cable bracing system alone. Therefore, the desired design
strength of the braced frame can be achieved by choosing an appropriate
design ratio, n, for the bracing system. The strength and stiffness of
the bracing system can be designed according to the ultimate design
approach (i.e. so as to prevent collapse), or the serviceability design
approach (i.e. to limit drift and to prevent excessive damage to the
structure).
Also observable from Fig. 2.12 is that the response of the unbraced
subassemblage and the bracing system are not well matched. The unbraced
frame reaches its maximum strength at drift 0'' while the bracing system
does not develop maximum capacity until drift '. This situation can
only be remedied by using the same cable area as a conventional mild
steel bracing system. If the ultimate strength approach is used, the
lateral strength of the unbraced frame is negligible at the drift
corresponding to the maximum strength of the bracing system. For this
situation the bracing system must be designed to carry the entire design
lateral loads.
Finally, although the strength and ductility of the braced
subassemblage is greatly improved over that of the unbraced
subassemblage, the basic mode of failure remains unaltered. Failure is
still initiated by shear failure of the short column at drift 0. A
complete discussion of the failure mechanism will be discussed in detail
in Sec. 3.7.
35

CHAPTER 3
MODELING THE PROTOTYPE FRAME AND BRACING SYSTEM USING DRAIN-2D
3.1 SELECTION AND GENERAL DESCRIPTION OF THE COMPUTER PROGRAM
DRAIN-2D is a general purpose computer program for dynamic analysis
of inelastic plane frame structures. The original program was developed
at the University of California at Berkeley in 1973 [1]. The principal
authors of the program are Amin E. Kanaan and Graham H. Powell. The
program is written in Fortran IV programming language and is generally
intended for use with a mainframe computer. The popularity and
flexibility of the program have lead to many revisions over the years.
The version of the program used in this research project has been
altered from the original program by researchers at the University of
California at Berkeley [1], the University of Michigan at Ann Arbor [4],
the University of Texas at Austin, [3], and the University of Oklahoma,
[2]. The Appendix of this report is a revised user's guide complete for
the main program and the two elements used in this research study,
Elements EL7 and ELl(m). The revised user's guide incorporates all
previous revisions and does not require the user to refer to previous
outdated user's guides for portions of the input data requirements.
The popularity of the program is due in part to its structure. The
main program and the element library are so connected that new element
subroutines can be added or old ones modified without any significant
changes being required in the main program. The program consists of a
number of base subroutines making up the main program. The main program
subroutines read and print the structural geometry and loading data,
36

carry out a variety of bookkeeping operations, asser{1] tt 2:tLructural
stiffness and loading matrices, and determine the displacement histor-
of the structure. All data reading and printing operations as well as
stiffness calculations are carried out within the element subroutines
and returned to the main program. Elements EL7 and ELl(m) used in this
research study are examples of new and revised subroutines respectively
which have been added to the original program.
The program is generally intended for the dynamic analysis of
structures. The current version of the main program has been modified,
however, to allow for control of the structure's response history
through the application of incremental lateral displacements rather than
forces. This feature is necessary for the current research because the
negative stiffness behavior exhibited by the reinforced concrete short
columns at large drifts makes application of unique static incremental
forces impossible (see discussion in Sec. 2.2). Additionally, the
behavior of the structure will be easier to discuss in terms of
specified drifts rater than specified loads.
The structure to be analyzed is idealized as a planar assemblage of
discrete elements. Analysis is by the direct stiffness method, with
nodal displacements as unknowns. Each node possesses up to three
degrees of freedom, as in a typical plane frame analysis.
DRAIN-2D is not well suited for commercial application. The
program requires an extensive formatted data input. Phenomenological
models are used for the columns, beams and braces. Much of this data is
not readily available when designing or analyzing a structure.
Phenomenological models are based on simplified hysteretic rules that
37

mimic observed behavior. These hysteresis rules must be derived from
test data available on test specimens which possess similar geometries,
material properties and loading histories. New commercial software
packages are available for the analysis of structures subject to dynamic
loading. Such packages require less data input, are far more user
friendly, and can be operated on personal computers. DRAIN-2D is still
a very complete program, however, useful for conducting analytical
research and aiding the researcher in und,.rstanding nonlinear behavior
of structures subjected to complex dynamic or static incremental
loading.
3.2 DESCRIPTION OF THE FRAME ANALYZED
The reinforced concrete frame used in this analytical study is
modeled after the prototype building analyzed experimentally and
analytically in previous research studies conducted at the University of
Texas at Austin, [3, 7], and at the University of Oklahoma, [2]. These
research studies were summarized in Sections 2.3 and 2.4. The prototype
building was originally chosen because it represents a classic example
of a building in need of seismic retrofitting. The prototype building
is typical of a class of reinforced concrete structure built in
California in the 1950's and 1960's. An example of a building similar
to the prototype building is shown in Fig. 3.1. The perimeter frames of
such a building provide the primary lateral strength of the structure in
the long direction. The perimeter frames are characterized by deep
spandrel beams and short columns. A plan and elevatioLi of the prototype
building was given in Fig. 2.7. The original prototype frame is seven
38
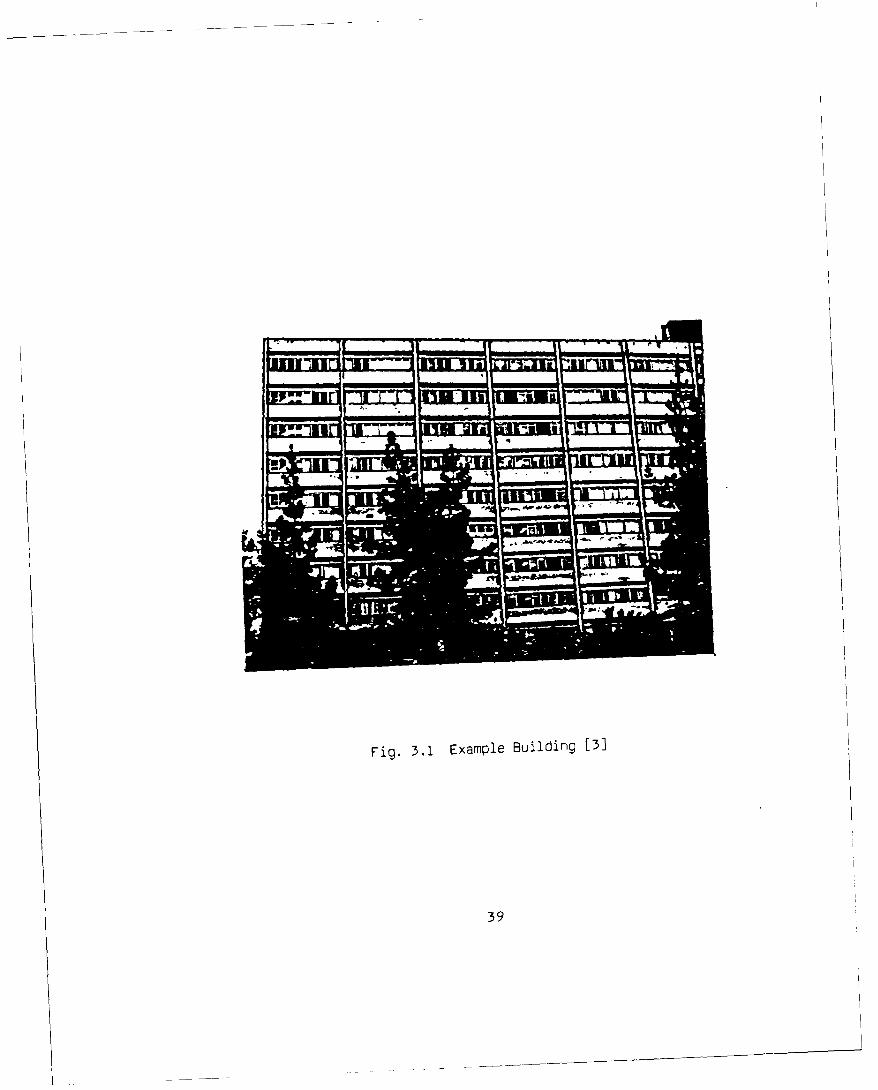
Fig. 3.1 Example Building [33
39

stories high and eleven bays long [3]. Each of the two perimeter frames
of the prototype building provide half the total lateral strength and
stiffness of the entire structure. Reinforcement details typical for
the third, fourth, and fifth levels of the prototype frame modeled in
the experimental study [7] are given in Fig. 3.2.
The prototype building is seismically inadequate for two main
reasons. First, the prototype frame was designed using the 1955 edition
of the Uniform Bui]ding Code for seismic design loads, and Building
Requirements for Reinforced Concrete (ACI 318-51), 1951 edition, for
seismic reinforcement and detailing requirements. Seismic design loads
have more than doubled in more recent design codes and seismic detailing
requirements have become more stringent as well. Second, the lateral
failure mechanism of the perimeter frames is undesirable. As discussed
in Sec. 2.1, the prototype frame contains a weak column-strong beam
configuration and is thus likely to exhibit shear dominated failure in
the columns. Such a failure is sudden and brittle. The energy
dissipation capacity is likely to be very small. The prototype frame is
thus deficient in both strength and ductility and is a prime candidate
for seismic retrofitting.
The following assumptions will be made with respect to the
prototype building for the purposes of modeling the structure with
DRAIN-2D:
1. Lateral loads will be considered parallel to the
longitudinal axis of the building only. Since there are
no shear walls providing resistance in this direction, it
40

2 ot 6 At 6 of 41h otd 151h Level.,20 8 Of 3vo Level
(Not cofltirnt.ows
It 4 at 18 :1.
2 16
-L "i t rCeO
2141

is assumed that all lateral resistance is provided by the
perimeter frames.
2. The prestressed cable bracing system will be applied to
the exterior frames only.
3. Axial inextensibility of the beams and columns will be
assumed. This assumption will reduce the computer time
required to solve the equilibrium equations as well as
reduce the number of degrees of freedom. Therefore, there
will be one horizontal degree of freedom per story and no
vertical degrees of freedom.
4. A six story subassemblage will be modeled along a typical
interior column line of the exterior frame. Because of
the assumption of only one horizontal degree of freedom
per story, it is reasonable to assume that the six story
subassemblage will adequately represent the global
behavior of the complete frame.
3.3 MODELING REINFORCED CONCRETE MEMBERS WITH ELEMENT EL7
For simplicity, the ibraced prototype frame will be modeled
entirely with element EL7. Element EL7 is a reinforced concrete beam
element with degrading stiffness. Element EL7 consists of a linear
elastic beam element in series with two inelastic rotational springs,
one at each end of the element as shown in Fig. 3.3. All nonlinear
behavior and effects of stiffness degradation in the element are
introduced into the system by means of the moment-rotation relationships
of the inelastic springs. Since the inelastic behavior is reproduced by
42

InelasticspringElastic beam
Fig. 3.3 Idealization of element EL7 [3]
AMoment
A
0 Rotation
Fig. 3.4 Quadrilinear moment-rotation relationship for theinelastic sprinQ [3]
43

the end rotational springs, the element's behavior is controlled through
end moments rather than the shear. However, for a beam-column element
bending in double curvature with the inflection point located at
midspan, the end moments are proportional to the shear. As long as this
assumption is true, the inelastic springs are satisfactory for modeling
shear dominated behavior as in the case of a short column. EL7 also
possesses flexural and axial stiffness; however, the moment-axial force
interaction is not reproduced.
The element EL7 subroutine is capable of reproducing the stiffness
degradation associated with cyclic loading [2]. As discussed in Sec.
2.2, a typical characteristic of reinforced concrete short columns is
that once the column's maximum shear capacity is reached, the member
exhibits negative stiffness with increasing drift (see Fig. 2.4). The
shape of the moment-rotation relationship for the short column is
assumed to be basically the same as the force-displacement curve shown
in Fig. 2.4. For this reason, EL7 features a quadrilinear moment-
rotation relationship as shown in Fig. 3.4. The length and slopes of
segments OA, AB, and BC can be defined freely by the user. Thus the
negative stiffness characteristic of a reinforced concrete short column
can be reproduced by inputing a negative slope in segment BC. EL7 is
very versatile in that the spring "backbone curve" can be tailored to
match closely the experimental backbone curve of any test specimen with
similar structural and material characteristics to that of the model
element.
A phenomenological approach has been used to develop element EL7.
A phenomenological model makes use of simplified hysteresis rules to
44

mimic experimental results. This modeling approach thus makes use of
existing experimental data to define the hysteretic behavior of an
element. Experimental work is often carried out on a component basis
(i.e. columns, beams, joints, etc.) which produces the type of data
needed for phenomenological models. The nonlinear hysteretic behavior
of deep spandrel beams and short columns, similar in geometry,
reinforcement, and material properties to the prototype frame, have been
investigated experimentally.
The hysteretic behavior of the EL7 spring is based on the Takada
model [14] and reflects observed experimental behavior for reinforced
concrete components. The hysteretic rules are shown in Fig. 3.5. The
relationships plotted in Fig 3.5a define the hysteresis rules for a
flexure dominated element such as a beam. Note the slope of segments AB
an BC are positive (i.e. positive stiffness throughout the loading
cycle). The relationships plotted in Fig. 3.5b define the hysteresis
rules for a shear dominated element such as the short column. Note the
slope of segment BC is negative (i.e. negative stiffness in this portion
of the load cycle). A reinforced concrete element submitted to
inelastic cyclic loading loses stiffness. The hysteretic model
reproduces this stiffness degradation as can be seen in subsequent
cycles of Fig. 3.5a and b.
3.4 MODELING PRESTRESSED CABLE BRACES WITH ELEMENT ELl(m)
The original truss element, ELI, has been modified to model the
behavior of prestressed cable braces (2]. The inelastic behavior of the
modified truss element is shown in Fig. 3.6. As seen in the figure, the
45

B 14
S 3 H17"m e s Moment
46
16 a) Flexure dominated5 behavior
,Rotation
12 CO 14
,'2------
2 b j Moment-
14b) Shear dominated
behavior5 Rotation
Fig. 3.5 Hysteretic rules for beam column element EL7 [3]
46

UL0
Defor.>
Fig. 3.6 Modified truss element [23
47

cable brace yields during the tensile portion of the load cycle;
however, it buckles with zero stiffness once the compressive force
equals the initial pretension force in the cable. The prestressing
force in the cables can be applied by specifying the initial tension
force in the member.
3.5 MEMBER PROPERTIES USED IN THE ANALYTICAL MODEL
The member properties used in this analytical study are based on
the structural properties of the prototype frame itself. Critical frame
dimensions are contained in Fig. 2.7. Cross sections of the spandrel
beam and short column reinforcement, in the third, fourth, and fifth
levels of the prototype frame were given in Fig. 3.2. The beams and
columns are modeled with element EL7 while the prestressed cable braces
are modeled with element ELl(m). The structural properties of the
columns, beams, rigid zones and braces of the prototype frame are
described below.
COLUMNS. The dimensions of the column cross section shown in Fig.
3.2 are 18" by 18". The effective column width perpendicular to the
plane of the frame is reduced from 18" to 10". This stems from the fact
that the width of the column (18") is so much larger than the width of
the spandrel beams (8") that moment is transferred to the column over a
reduced column width. A column width of 10" gives good results with the
experimental data [3].
Some curvature develops within the depth of the spandrel beam when
the frame is subjected to lateral loading and was observed during the
experimental study of the prototype frame [7]. This observation
48
significantly influences the length of the rigid zone, ec, of the column
which is input for the computer program. A rigid zone equal to two-
thirds the spandrel depth was found to give close agreement between the
analytical and experimental results. Each column is thus divided into
three elements, a 72" column and two 24" rigid beam-column elements
attached to the column ends. The interstory height remains 120". The
column and the two rigid zones are illustrated in Fig. 2.10.
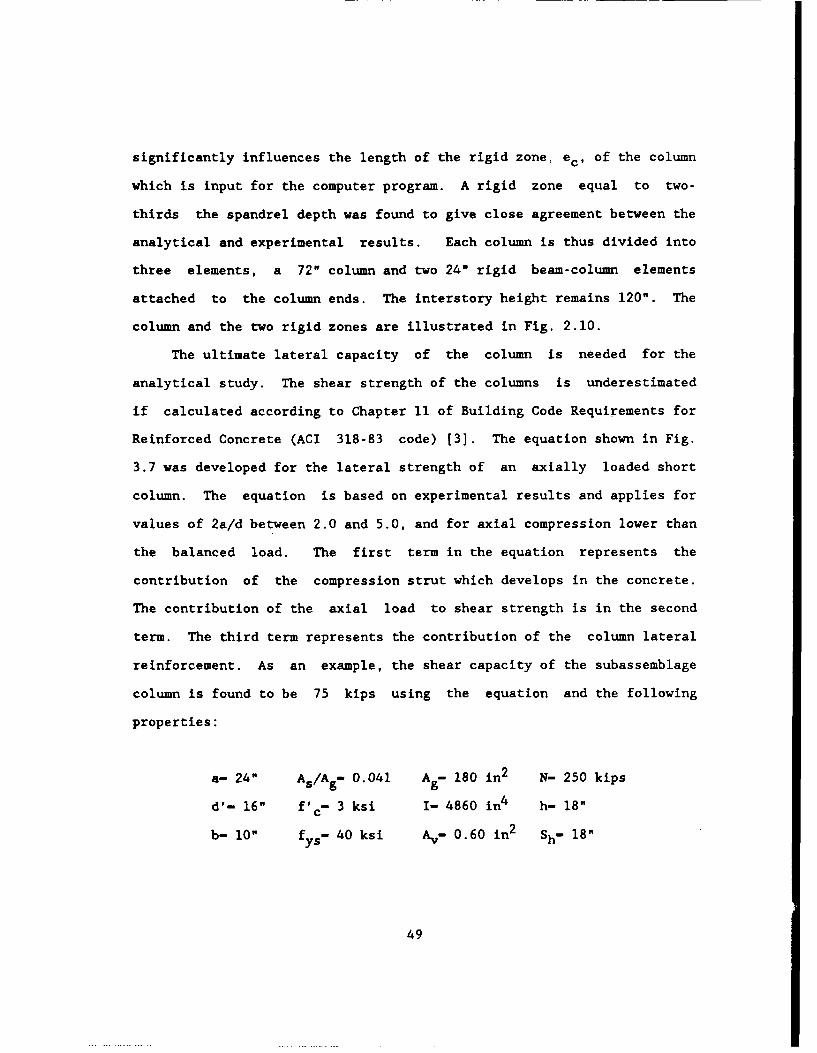
The ultimate lateral capacity of the column is needed for the
analytical study. The shear strength of the columns is underestimated
if calculated according to Chapter 11 of Building Code Requirements for
Reinforced Concrete (ACI 318-83 code) [3]. The equation shown in Fig.
3.7 was developed for the lateral strength of an axially loaded short
column. The equation is based on experimental results and applies for
values of 2a/d between 2.0 and 5.0, and for axial compression lower than
the balanced load. The first term in the equation represents the
contribution of the compression strut which develops in the concrete.
The contribution of the axial load to shear strength is in the second
term. The third term represents the contribution of the column lateral
reinforcement. As an example, the shear capacity of the subassemblage
column is found to be 75 kips using the equation and the following
properties:
a- 24" As/Ag- 0.041 A - 180 in2 N- 250 kips
d'- 16" f'c- 3 ksi I- 4860 in4 h- 18"
b- 10" fys- 40 ksi Av- 0.60 in2 Sh- 18"
49

HN
Ih
2a
As
I' Id
Vu = (7.3 -2.6 a/d' + 1.7 TAS/-"A bd''f'"
+ 2 NI/(aAgh) + 0.61 A f d'/shv ys
Fig. 3.7 Short column with strenoth eouation [3]
50

As described in Section 3.3, the column will be modeled using
element EL7. The phenomenological model used in EL7 will be based on
experimental load-deformation curves. The load deformation curves used
in this study are based on experimental work done by Woodward and Jirsa
[6). An experimental load-deformation curve similar to the
subassemblage column in terms of reinforcement, depth to span ratio and
level of axial load is shown in Fig. 3.8. It is thus reasonable to use
this experimental backbone curve for the phenomenological model required
for the subassemblage column. Fig. 3.8 is scaled for a column with 48
inch free height in Fig. 3.9. The assumption is made that the response
of the subassemblage column will follow the behavior defined by the load
deformation relationship shown in Fig. 3.9.
As mentioned in Section 3.3, element EL7 makes use of a
quadrilinear backbone curve to define the moment-rotation relationship
of the inelastic springs. In Fig. 3.9 it is shown how element EL7's
quadrilinear backbone curve is "fitted" to the experimental load
deformation curve. The moment-rotation relationship at a section at the
end of the column is used to represent the overall flexural stiffness of
the column in the computer model for element EL7. The moment rotation
relation of the column is derived from the quadrilinear load deformation
backbone curve of Fig. 3.9. Assuming an inflection point at mid height
of the column, the end moment was obtained by multiplying the end shear
by 1/2 - 72"/2. The corresponding rotation at the end of the column was
taken to be the rigid body rotation of the chord connecting the end
points of the column, e - '/l.
51

0.0 Vm/Ac T
s: stirrup spacingP: column ultimate
compression5.0
I I, I
0.2 0.4 0.6 08 1.0
Laterol Deflection6 [in.]
20/d d/s P/Pu140
Woodword 36'012' 3 12"/12"=:1.0 8- : .1Test _80 /6_2
Subossemrlege 48"'18"2.7 18"/18": 1.0 250.1/Column 130I I 152
Fig. 3.8 Experimental loac-ceformation curvefor a short column similar
to the subassemblace column [2]
52

SHEAR
/ --- ANALYTICAL/ MODEL
50-
A
0.75 \225 DRI T%)
I C D
Fig. 3.9 Load deformation curve for the subassemnblage column [2]
5 3

Recall from Sec. 3.3 that the column modeled by EL7 consists of a
linear elastic beam element in series with two inelastic rotational
springs, one on each end. The elastic beam has constant stiffness at
all stages of loading. The stiffness of the rotational springs,
however, is derived from the moment-rotational relationship of the
overall column. Thus, all inelastic yielding in the element model is
assumed to take place in the rotational springs.
Stiffness degradation is exhibited in short columns subjected to
cyclic lateral loads. This phenomenon, discussed in Sec. 2.2., is
modeled by altering the stiffness of the inelastic rotational spring.
The rotational spring is given a very large initial stiffness by the
program, (EcIc x 108), where EcIc is the stiffness of the linear elastic
beam element computed from
EcIc - (V)(L)3/(l2(a))
Recall that the overall stiffness of two springs in series is taken as
the inverse of the summation of the springs' reciprocal stiffnesses.
Thus, a large initial spring stiffness guarantees the initial stiffness
of the column element will be essentially the same as that of the
elastic beam element, EcIc.
The initial column stiffness extends up to about 50% of the
ultimate shear strength of the column element in the phenomenological
model. This corresponds to segment OA in Fig. 3.9. The overall
stiffness of the column reduces to about 15% of its initial stiffness
once the ultimate shear strength is reached (refer to the slope of
54

segment AB in Fig. 3.9). The stiffness of the inelastic spring at point
A is calculated internally by the program and correspondingly reduces to
about 1.5 x 10- 9 times the initial spring stiffness. The degrading
segment of the load-deformation curve, segment BC, has a negative slope
equal to -13.8% of the initial column stiffness. The stiffness of the
inelastic spring in this part of the curve is internally calculated as-
1.38 x 10⁻⁹ times the initial spring stiffness. Segment CD represents
the portion of the curve where the lateral capacity of the column
becomes less than the P-delta effects. The column has to "borrow"
strength to carry the axial load, hence the capacity of the column
becomes negative. The overall stiffness of the column in segment CD is
-0.33% of the initial column stiffness while the spring stiffness is
internally calculated as -3.3 x 10⁻¹¹ times the initial stiffness of the
rotational spring.
BEAMS. The critical dimensions and reinforcement detailing of the
third, fourth, and fifth level beams of the prototype frame are shown in
Figs. 2.5 and 3.2. The beams of the prototype frame deform in double
curvature when subjected to lateral loading. The beam's capacity to
resist positive and negative moment is, however, not symmetric. In
calculating the moment curvature relationship for the spandrel beam, a
48 inch width of floor slab near the bottom of the beam is considered to
carry moment along with the spandrel. The positive cracking moment is
thus larger than the negative cracking moment. The negative yield
moment and ultimate moment of the beams, however, are greater than the
corresponding positive moment values because of the unsymmetrical
reinforcement. The detail in Fig. 3.2 indicates twice as much negative
55
moment top steel than positive moment bottom steel. Different positive
and negative moment-rotation relationships must therefore be derived for
the spandrel beams.
Calculation of the moment-curvature relation for positive moment at
the end of the beam produces a yield moment less than the cracking
moment. Upon investigation, it was found that this phenomenon results
partly from the fact that the spandrel beam is severely under
reinforced. The percentage of steel provided is less than that required
as a minimum in the 1951 version of the ACI Building Code [10]. For
simplification Mcr was taken as Mu for schemes where Mcr > . In those
cases, the beam was assumed to transition directly from the elastic
range to strain hardening. The moment-rotation relationship thus
reduced to a bi-linear curve.
The Element EL7 subroutine allows the user to input different yield
moment values for positive and negative moment. The user is
constrained, however, to one set of stiffness ratios as input (refer to
the user's guide in Appendix A). The same stiffness ratios must be
applicable for both positive and negative moment. The stiffness ratios
are used in the program along with the input yield moment values to
define the moment-rotation relationship for the inelastic springs. This
constraint becomes significant for sections such as the prototype
spandrel beam which have different negative and positive moment-
curvature relationships. The user is therefore not able to input the
hand calculated positive and negative moment rotation relationships
directly. A compromise moment-rotation relationship must be developed
which contains one set of stiffness ratios applicable for both positive
56

MOMENT M/Mu
1.0-STRAIN HARDENING(. 005E 1)
0.1 1.0
ROTATION *'*u
Fig. 3.10 Moment-rotation relationship for the beam
MOMENT Ckip-in)
0
(1.0 El)
C
C1.OE0)
10,000, A,.B
IE1:999,999,999 Kip- int
IE-05
ROTATION( radians/ in)
Fig. 3.11 Moment-rotation curve for a typical rigidelement
57

and negative moment. Fig. 3.10 was developed by "averaging" the slopes
of the positive and negative moment-rotation curves for the prototype
spandrel. The resulting tri-linear moment curvature relationship is
thus applicable for both positive and negative moment. Fig. 3.10
represents a compromise and was developed in an attempt to live within
the constraints of the existing program. The resulting monotonic
response obtained using this model compares well with experimental tests
conducted on the prototype frame [3]. The moment-curvature relationship
is first hand calculated at ultimate for both positive and negative
moment at a section taken at the ends of the spandrel beam. The
cracking moment is taken simply as 55% of the calculated ultimate
moment. The yield moment is taken as the average of the ultimate and
assumed cracking moment. Finally the resulting moment-curvature curves
are converted to moment-rotation curves by multiplying the curvatures by
J/2 (assuming the plastic hinge develops along a length d/2). It is
assumed that the spandrel beam will behave in a ductile manner and that
reduction of the cracking moment to a value below that obtained by
nand calculation will not significantly affect overall frame response.
Similar to the approach used for the column, the initial stiffness
of the inelastic spring is set very high at EcIb x 108. EcIb is the
flexural stiffness of the beam element calculated from the section
?roperties of the uncracked transformed section. For the beam section
shown in Fig. 3.2, the uncracked stiffness was calculated to be
928,339,200 kip-in 2 . The high initial spring stiffness ensures the
initial stiffness of the beam element is the same as the elastic beam
element in segment OA of Fig. 3.10.
58

The positive and negative ultimate moments for the section shown in
Fig. 3.2 are 4030 and 6370 kip-inches respectively. Using the model in
Fig. 3.10, the positive and negative cracking moments are 2215, and 3500
kip-inches respectively. At point A of Fig. 3.10 the concrete is
assumed to have cracked and the stiffness of the spandrel beam reduces
to 9.1% of the initial uncracked beam stiffness. Correspondingly, the
stiffness of the inelastic rotational spring will reduce to 9.1 x 10⁻¹ 0
times the initial spring stiffness. The stiffness of the beam at point
C corresponds to strain hardening in the beam, segment CD. The slope of
segment CD reduces to 0.5% of the initial beam stiffness. The
corresponding stiffness of the inelastic springs drops to 5 x 10- 1 1
times the initial spring stiffness. The stiffness of the beam in the
strain hardening region is taken as constant until failure.
RIGID ZONES. The 24" rigid zones at the beam-column joints shown
in Fig. 2.10, are also modeled using element EL7. This element must
behave elastically throughout the loading cycles. This is done by
keeping the stiffness of the rotational springs constant for all
segments of the quadrilinear moment-rotation curve. The idealized
moment-rotation relationship for a typical rigid element is shown in
Fig. 3.11. A very high value of flexural stiffness has been used, about
twenty times the initial stiffness of the column.
BRACES. The prestressed cable braces are modeled using the
modified truss element described in Sec. 3.4. The cable braces of the
bracing system consist of individual steel strands wound together in
such a way so as to form a complete cable. The number of strands in the
cable depend, of course, on the magnitude of the lateral force to be
59

resisted. The cable material used in this study is assumed to be stress
relieved ASTM A416, grade 270. The ultimate tensile strength is rated
at 270 ksi and the yield strength is approximately 230 ksi. The modulus
of elasticity used is E- 26,000 ksi. The prestressing force applied to
the cables in the computer model is assumed to be the effective
prestressing force, that is, the initial prestressing force minus
losses. The cross sectional areas of the cable braces are calculated
with either Eqn. 2.2 or Eqn. 2.3 depending on whether the ultimate or
serviceability design approach is taken.
3.6 STATIC INCREMENTAL LOADING
During an earthquake, ground motion occurs in random fashion in
countless directions. It is the horizontal component of these motions,
however, which produces the most damage to structures. It is for this
reason that most research is limited to lateral loads only. The
response of the prototype frame is studied under two types of static
incremental lateral loads, monotonic and cyclic.
3.6.1 Monotonic Loading
The prototype frame was subjected to monotonically increasing
horizontal displacements. The purpose of examining the behavior of the
frame under monotonic loading is to produce simplified response curves
from which the basic failure mechanism of the unstrengthened, braced-
unaltered, and braced-altered frames can be derived. The behavior of
the frame to monotonic loading provides a response envelope within which
the cyclic loading response is expected to occur.
60
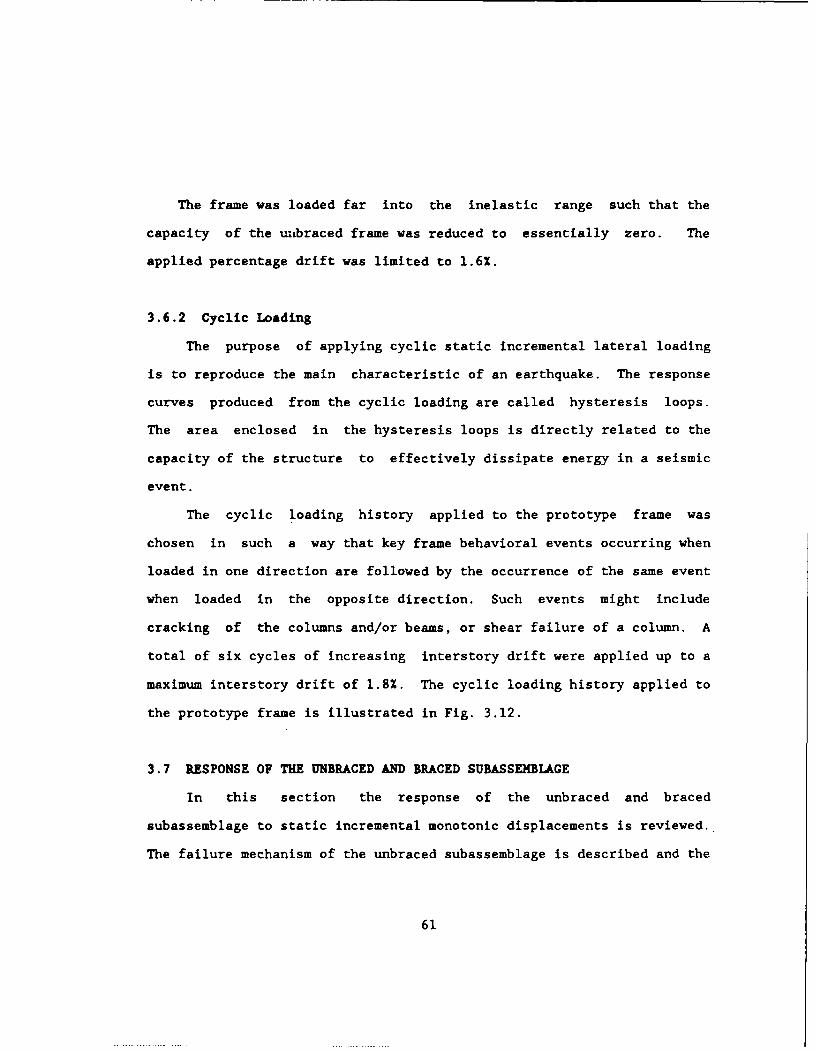
The frame was loaded far into the inelastic range such that the
capacity of the unbraced frame was reduced to essentially zero. The
applied percentage drift was limited to 1.6%.
3.6.2 Cyclic Loading
The purpose of applying cyclic static incremental lateral loading
is to reproduce the main characteristic of an earthquake. The response
curves produced from the cyclic loading are called hysteresis loops.
The area enclosed in the hysteresis loops is directly related to the
capacity of the structure to effectively dissipate energy in a seismic
event.
The cyclic loading history applied to the prototype frame was
chosen in such a way that key frame behavioral events occurring when
loaded in one direction are followed by the occurrence of the same event
when loaded in the opposite direction. Such events might include
cracking of the columns and/or beams, or shear failure of a column. A
total of six cycles of increasing interstory drift were applied up to a
maximum interstory drift of 1.8%. The cyclic loading history applied to
the prototype frame is illustrated in Fig. 3.12.
3.7 RESPONSE OF THE UNBRACED AND BRACED SUBASSEMBLAGE
In this section the response of the unbraced and braced
subassemblage to static incremental monotonic displacements is reviewed.
The failure mechanism of the unbraced subassemblage is described and the
61
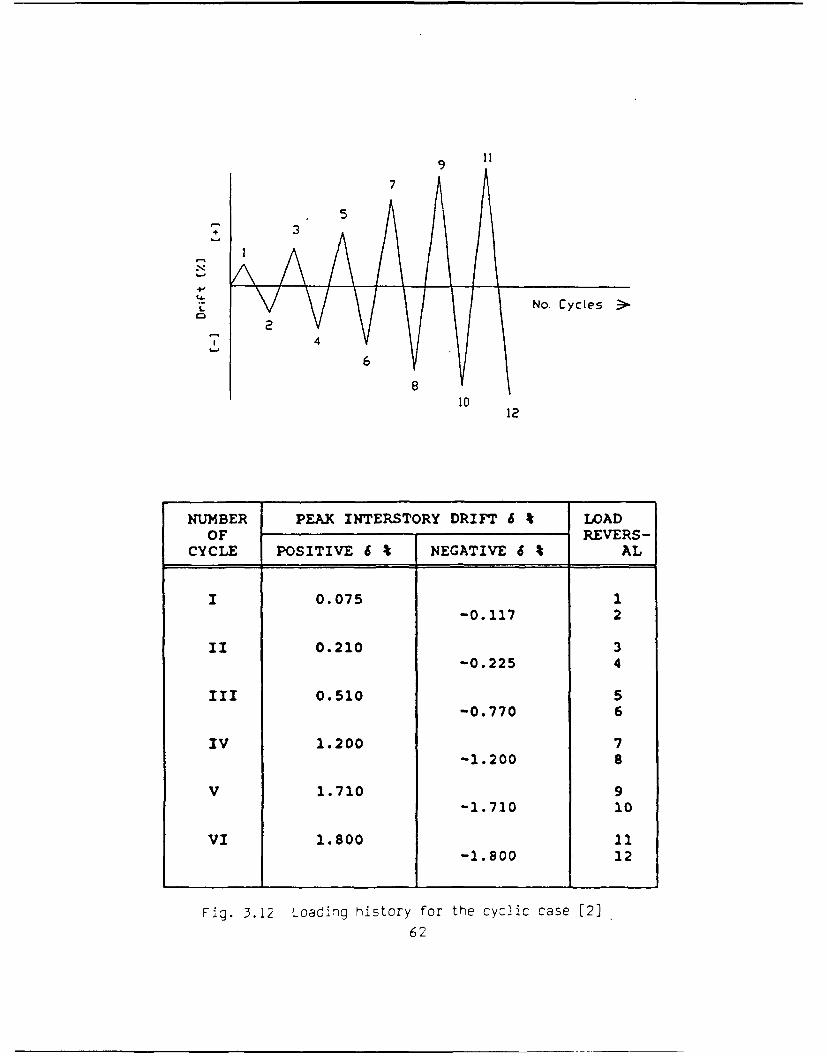
9 119
7
N5
L v No. Cycles >
4
6
12
NUMBER PEAK INTERSTORY DRIFT S % LOADOF REVERS-
CYCLE POSITIVE 6 % NEGATIVE 6 AL
1 0.075 1-0.117 2
II 0.210 3-0.225 4
III 0.510 5-0.770 6
IV 1.200 7-1.200 8
V 1.710 9-1.710 10
VI 1.800 11-1.800 12
Fig. 3.12 Loading history for the cyclic case [2]
62

effect of the prestressed cable bracing system on the total response is
discussed.
3.7.1 Failure Sequence Of The Unbraced Subassemblage
The response of the unbraced subassemblage to monotonic loading is
shown in Fig. 3.13. The failure sequence of the unbraced subassemblage
is described below. Reference numbers are those of Fig. 3.13.
1-2 The subassemblage behaves elastically.
2 Columns crack in shear. Initial stiffness decreases.
Interstory drift - 0.06%, H - 38k.
3 Spandrels crack in flexure. Interstory drift - 0.15%,
H-50.0k.
4 : Column fails in shear. Stiffness becomes negative for
increasing interstory drift. Interstory drift - 0.39%, H-75k.
5 : Column lateral capacity drops to zero. Interstory drift -
0.90%.
5-6 : Column lateral capacity becomes negative. The column lateral
capacity becomes less than the P-delta effects.
3.7.2 Response Of The Braced Subassemblage
The response of the braced subassemblage when subjected to
monotonic loading is shown in Fig. 3.14. For this bracing scheme, the
ultimate design approach was taken with a design strength ratio of n-2
(see discussion in Sec. 2.4.2 for the definition of n). The cable
braces are considered to extend from the beam-column joint of one story
to the center of the beams of the story below as shown in the figure.
63

RESPONSE OF UNBRACED SUBASSEMBLAGEmonotonic loading
100
95 H
85
757065605
45
S40.
S35.303
25 2
20.
15-
10501 6
-5-6-10-15- 20 1 r
0.0 0.1 0.2 0.3 0.4 0.5 0.6 0.7 0.8 0.9 1.0 I'. 112 113 114
!nterstory Drift (s)
Fig. 3.13 Response of the unbraced subassemblageto monotonic loading
64
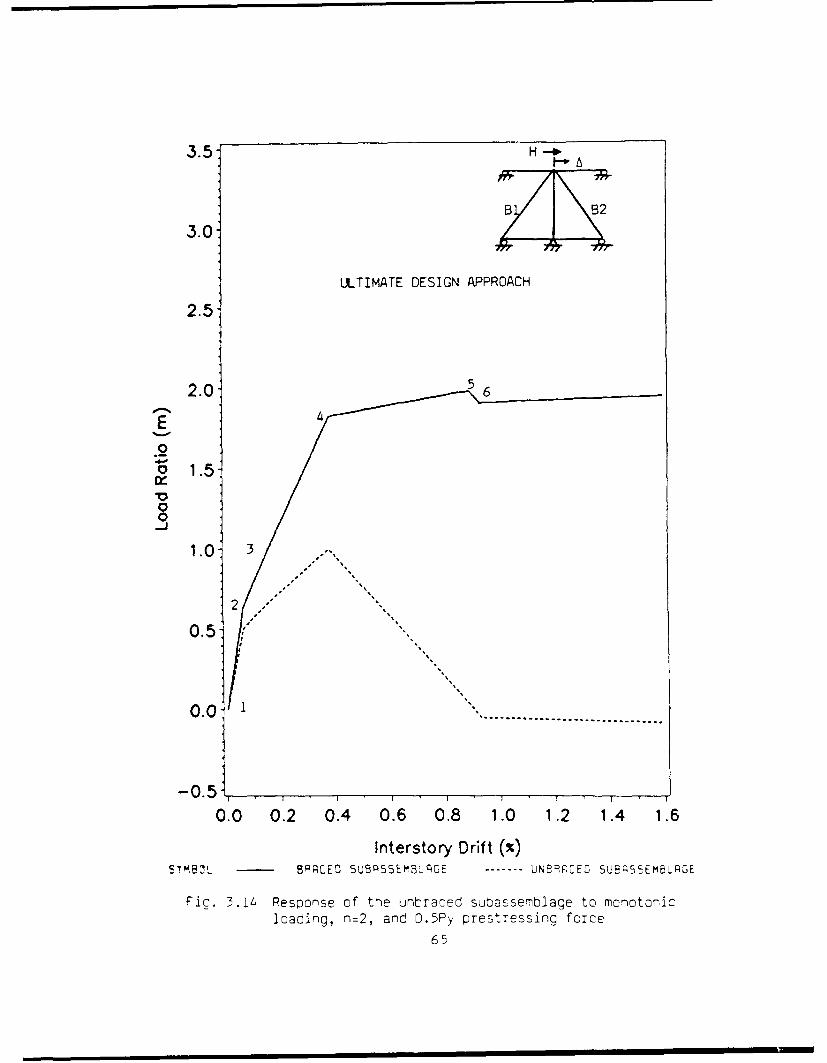
3.0'
ULTIMATE DESIGN APPROACH
2.5.
2.0-
010
0-5
0.0 0.2 0.4 0.6 0.8 1.0 1.2 1.4 1.6
Interstory Drift (%)S'rMBIL - BPCEO SUBPS5EM~qGE ---- UNE9PCEC 5UE955EMBLAGE
Fio. 3.1 Response of the unbraced subassemblage to monotonicloading, n=2, and 0.5Py prestressing force
65

An initial prestressing force of 0.5Py is applied to the ASTM A416 grade
270 stress relieved cables. For comparison, the response of the braced
subassemblage is superimposed over the response of the unbraced
subassemblage. The failure sequence for the braced subassemblage is
discussed below. Reference numbers are those of Fig. 3.14.
1-2 The subassemblage behaves elastically.
2 Columns crack in shear. Initial stiffness decreases.
Interstory drift - 0.06%, H-47.3k, m-0.63.
3 Spandrels crack in flexure. Interstory drift - 0.15%, H-75k,
m-l.0.
4 Column fails in shear. Interstory drift - 0.39%, H-138.8k,
m-l.85.
5 Simultaneous buckling and yielding of brace B1 and B2.
Ultimate capacity of the braced subassemblage is reached.
Interstory drift - 0.88% , H-150k, m-2.0. Stiffness becomes
negative for increasing interstory drift.
6 Lateral capacity of the unstrengthened subassemblage drops to
zero Stiffness regains positive slope as th' frame stiffness
is now less negative.
From Fig. 3.14 it can be seen that although the response of the
subassemblage has been substantially improved over that of the unbraced
subassemblage, the overall failure mechanism has not been altered. The
frame behavior is still dominated by shear failure in the short columns
occurring at point 4. The overall effectiveness of the bracing system
still depends on the response of the unbraced frame.
66

CHAPTER 4
EFFECTIVENESS OF BEAM ALTERATION
IN CONJUNCTION WITH PRESTRESSED CABLE BRACES
4.1 BEAM ALTERATION IN FRAMES WITH WEAK COLUMNS-STRONG BEANS
The overall effectiveness of any seismic design is measured not
only in terms of the magnitude of the ultimate seismic resistance but on
the nature of the failure mechanism which develops at this ultimate
resistance as well. The unstrengthened prototype frame studied in this
research project contains a weak column-strong beam configuration. As
will be discussed in detail in Sec. 4.2, the failure mechanism of this
frame is undesirable. The failure of the frame is controlled by shear
failure in the short columns at relatively low horizontal drift. Beyond
the drift at which the shear failure occurs, the frame rapidly loses
lateral capacity and significant damage to the columns also degrades the
frame's ability to carry vertical loads. Even if the frame is braced to
carry current design lateral loads, the ultimate failure mechanism will
remain unchanged. In the event of an earthquake which induces lateral
loads on the frame exceeding the design loads, the failure will follow a
brittle collapse type mechanism. The key to a favorable failure
mechanism in a multi-story building is to move failure away from the
columns and into the beams.
The difference between the lateral failure mechanisms of a strong
column-weak beam frame and a weak column-strong beam frame is
illustrated in Fig. 4.1. As is evident from the figure, the strong
67

d!
r
Strong column - weak beam Weak column - strong beam
Fig. 4.1 Frame lateral failure mechanisms [3]
68

column-weak beam frame fails through the development of plastic hinges
at the ends of the beams. Such a failure mechanism is very ductile and
energy dissipation is quite significant. Since the inelastic behavior
is limited to the beams, the columns are able to carry the vertical
loads even under large lateral drifts. Most importantly, this mechanism
does not typically result in collapse of the structure. A weak column-
strong beam frame, however, can fail either through the development of
plastic hinges at the ends of the columns or failure of the columns in
shear. Such failure mechanisms are somewhat less ductile and typically
dissipate less energy than beam hinge type mechanisms. Tragically, such
mechanisms can result in collapse of one or more stories.
Beam alteration is a technique by which strong beams are physically
altered in some manner so as to move failure away from the columns and
into the beams. The aim of such techniques is to alter the ultimate
failure mechanism of the structure to one that is more favorable.
Applications of beam alteration are already in use countries such as
Mexico and Japan. Beam alteration can be combined with some other type
of seismic retrofitting technique such as steel bracing in order to
improve the overall seismic performance of a structure [3].
In this study, the aim is to convert the weak column-strong beam
frame to a strong beam-weak beam frame. This can be achieved by either
strengthening the columns or by weakening the beams. The former has the
advantage of simultaneously altering the failure mechanism and improving
the lateral strength of the frame. It does not, however, make practical
sense in this study because the prestressed cable bracing system can be
69

designed to provide all the lateral strength required. Weakening the
beams may be easier and less expensive than column strengthening.
The concept of beam weakening involves reducing the flexural
capacity of the beam just enough so that plastic hinges will form at the
ends of the beams before column failure occurs. One way of achieving
this result is to core or cut into the beam ends and sever some
longitudinal reinforcement. The altered beam must still, of course, be
able to develop sufficient moment to carry the gravity loads to the
columns. Loss in the frame's lateral strength and stiffness, however,
can be easily made up by the prestressed cable bracing system.
Badoux performed a parametric study on the prototype frame
subassemblage introduced in Sec. 2.4.1 to investigate the effectiveness
of combining beam alteration with a steel bracing system [3]. The
objective in this chapter is to extend Badoux's parametric study to
prestressed cable bracing systems. The idea of combining beam
alteration with prestressed cable bracing systems to examine the overall
improvement in seismic response of the prototype frame will be
investigated. The scope of the investigation will be limited to the one
degree of freedom subassemblage of the prototype frame introduced in
Sec. 2.4.1.
4.2 INTRODUCTION OF BEAM ALTERATION PARAMETERS
4.2.1 The q And r Ratios
When altering a structure with the aim of achieving a more
desirable failure mechanism, it is necessary to keep two strength
70

concepts in mind. First, the "brittleness" of individual members making
up the frame, and secondly, the relative strength of the columns and
beams at the joints under lateral loading. In this section these two
strength concepts are defined as ratios q and r. These two ratios will
aid in the discussion and facilitate the quantitative study of the beam
alteration-prestressed cable brace retrofit scheme.
Ratio q. The first concept or ratio that should be kept in mind is
the brittleness of the individual members in the frame. For a frame
member submitted to double curvature as shown in Fig. 4.2, q is defined
as
q - Vus/Vuf (4.1)
where Vus is the shear leading to shear failure and Vuf is the shear
leading to flexural failure. Thus q can be thought of as a measure of
the member's brittleness. If q is less than 1.0, the failure in the
member is shear dominated and will occur in a brittle fashion. The
column in the subassemblage of the prototype frame has a q value of
qc - 75k/133k - 0.56
This indicates brittle behavior and is expected in a frame with short
columns. By contrast the q value for the spandrel beam is calculated as
qb - 123k/44.4k - 2.77
71

q=V /VUf
Fic. 4~.2 Ratio q for a member in double curvature [31
VV
beam d
Vbu
Fin.4.13Ratolrfrumemcounjonn3
...... 7colmn 72

Ratio r. The second ratio is a measure of the relative strength of
the beam and column at the frame's joints. A typical beam-column joint
subjected to lateral loading is illustrated in Fig. 4.3. The ratio r is
defined as
r - (Vcu)h/(Vbu)S (4.2)
where (Vcu)h is the ultimate moment which will cause column failure and
(Vbu)s is the ultimate moment which will cause beam failure. As shown
in Fig. 4.3, if q for the beam is greater than 1.0, then Vbu - (Mbu+ +
Mbu.)/(s - b), where Mbu+ and Mbu" are the beam positive and negative
moment capacities at the face of the Joint. Vu is equal to Vus if q is
smaller than one.
A value of r less than 1.0 indicates the columns framing into the
joint are weaker than the beams. As discussed previously, favorable
failure mechanisms will have beams failing in flexure before the columns
fail in shear. In such mechanisms, the columns are stronger than the
beams and thus r is greater than 1.0. The joints of the prototype frame
yield:
r - (Vcu)h/(Vbu)S - (75k x 120 in)/(44.4k x 252 in) - 0.80.
The aim of the beam alteration-prestressed cable brace retrofit scheme
is to raise column q values above 1.0 and r values of the joints well
above 1.0. Section 21.4.2.2 of ACI 318-89 [9] requires the ratio of the
73

flexural strength of the columns framing into a joint to the flexural
strength of the girders framing into that same joint shall not be less
than 6/5 - 1.2. Expressed in terms of the r ratio (taking nominal
rather than factored beam and column strength) the requirement becomes;
r > [(l.2)(.9)]I/(.7) - 1.54
This requirement in part takes into account the contribution of slab
reinforcement and strain hardening to beam strength.
4.2.2 Beam Weakening Parameters
The concept of beam alteration is illustrated in Fig. 4.4. As
the frame reaches its ultimate capacity, the aim is for plastic hinges
to develop in the beams rather than at the column ends. The plastic
hinges will develop at the beam's ends where the magnitude of the
moments induced by gravity loads and lateral displacements will be the
greatest. To ensure such a mechanism, the flexural capacity of the beam
at the ends must be reduced. This can be accomplished by cutting or
coring into the beam. Typically, at least two cuts are made into the
beam. The primary reduction in flexural capacity comes from severing
the longitudinal reinforcement, but there is also a reduction in
strength due to the change in effective section depth from d to (d - u -
v) as shown in the figure.
The depth of the cut into the top of the beam is defined as
parameter u. Similarly the depth of the cut into the bottom of the beam
is defined as parameter v. The effective length of the cut along the
74

W
-- 71 u-
1 I
d-u-v
Fig. 4.4 weakening parameters u, v, and w [31]
75

beam is defined as parameter w. The effective length of the cut, w, is
greater than simply the distance between the two extreme cuts. This is
due to the anchorage lengths which must develop as a result of severing
the reinforcement. The length w is important in the development of the
plastic hinge and the subsequent dissipation of energy. Plastic hinges
at the ends of fixed beams are generally thought to form over a length
of roughly 0.5 x the effective depth of the beam. If w is too small to
allow the hinge to fully develop, yielding and cracking cannot spread
and the rotation capacity of the hinge is limited. For this reason, w
should be larger than the effective depth of the section, (d - u - v).
Cutting into the beam increases the effective free height of the
columns. If the effective free height of the column is defined as 2a
before beam alteration, weakening the beam in this manner will increase
the effective free height of the column to (2a + u + v). As a direct
benefit of this, the ratio q for the column is increased by a factor of
(2a + u + v)/2a. Thus beam alteration appears to reduce the brittleness
of the column. The strength of the column, however, is not reduced as
Vus is not affected.
The designer must be careful in choosing weakening parameters u, v,
and w. One must ensure foremost that the weakened beam is still
adequate to perform its primary function which is to transfer the
gravity loads to the columns. In the prototype frame, the capacity of
the deep spandrel beams is more than enough to carry the gravity loads.
In fact, there is sufficient positive moment steel in the section to
allow the beam to carry the gravity loads as a simply supported beam.
Theoretically, then, the moment capacity of the beam ends could be
4
76
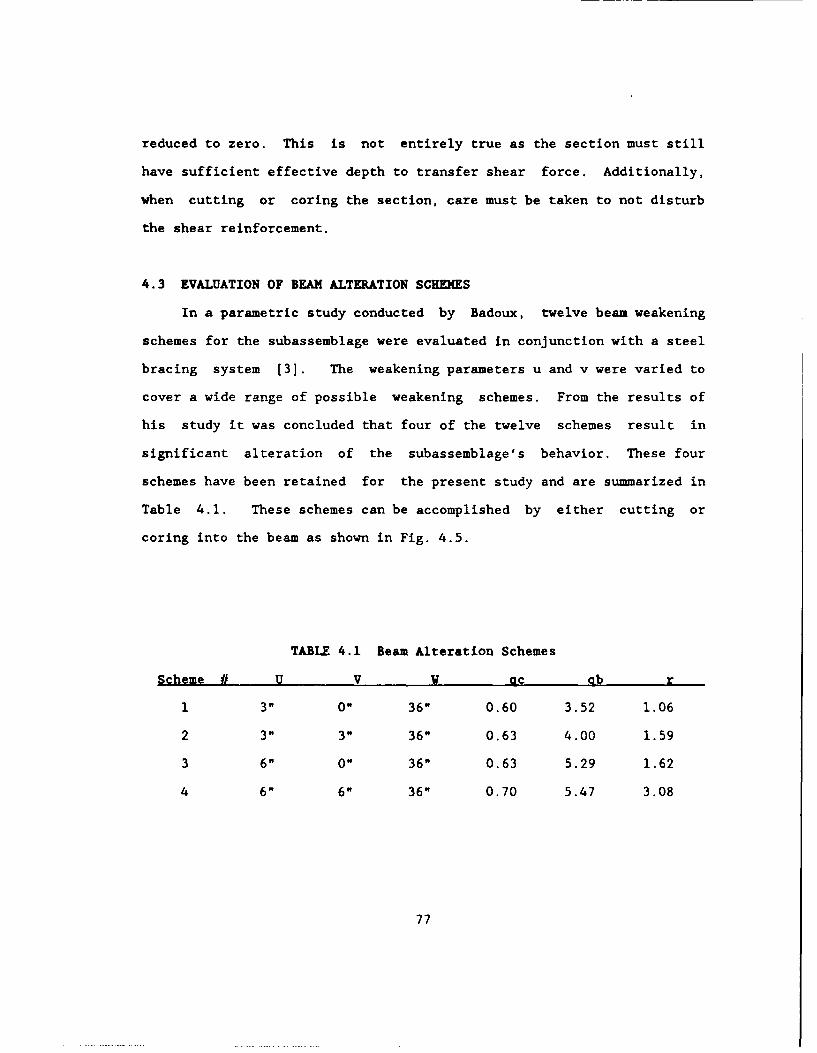
reduced to zero. This is not entirely true as the section must still
have sufficient effective depth to transfer shear force. Additionally,
when cutting or coring the section, care must be taken to not disturb
the shear reinforcement.
4.3 EVALUATION OF BEAM ALTERATION SCHEMES
In a parametric study conducted by Badoux, twelve beam weakening
schemes for the subassemblage were evaluated in conjunction with a steel
bracing system [3]. The weakening parameters u and v were varied to
cover a wide range of possible weakening schemes. From the results of
his study it was concluded that four of the twelve schemes result in
significant alteration of the subassemblage's behavior. These four
schemes have been retained for the present study and are summarized in
Table 4.1. These schemes can be accomplished by either cutting or
coring into the beam as shown in Fig. 4.5.
TABLE 4.1 Beam Alteration Schemes
Scheme # U V W ac qb r
1 3" 0" 36" 0.60 3.52 1.06
2 3" 3" 36" 0.63 4.00 1.59
3 6" 0" 36" 0.63 5.29 1.62
4 6" 6" 36" 0.70 5.47 3.08
77

n A-fn- p ,A
OD -4
C6 -0
ED aja
E
-c
-
Qr)
78

The effect of the four beam alteration schemes on the response of
the unbraced subassemblage is shown in Fig. 4.6. In scheme 1 the top
layer of negative reinforcement is cut (two #6 bars). The beam moment
capacity is reduced by 24% and the factor of safety against column
failure r is increased from 0.8 to 1.06. The overall lateral capacity
of the unbraced subassemblage has been reduced from m - 1.0 to m - 0.87.
The failure mechanism, however, has successfully been altered. At point
0 the weakened beam fails in flexure at a drift of about 0.3%. The
brittleness of the column is improved as well from q - 0.56 to 0.60.
In scheme 2 the first layer of negative reinforcement (two #6 top
bars) is cut as well as the firs, 1 Ryer of positive moment reinforcement
(two #6 bottom bars). The moment capacity of the beam is reduced by 49%
and r is increased to 1.59. The failure mechanism of the altered
subassemblage is as follows:
1-2 : Subassemblage behaves elastically
2 : Column cracks in shear. Interstory drift - 0.06%, m - 0.35.
3 : Beams crack in flexure. Interstory drift - 0.1%, m - 0.5.
4 : Plastic hinges develop in beam. Interstory drift - 0.175%,
m - 0.59.
In scheme 3 the top two layers of negative moment steel are cut
(four #6 top bars). For this scheme the moment capacity of the beam is
reduced by 50.5% and the r ratio is further increased to 1.62. Finally,
in scheme 4 both primary positive and negative reinforcement has been
removed from the beam section. The moment capacity is reduced to 26% of
79

1.2'
1.0- Unbraced Subassemblage
Shm---------------------
0.8/
I Scheme 2
Scheme 3
0
Scheme 4---------------------- -----------------
0.2-
- 2 1 . Ii lI I I I i
0.0 0.2 0.4 0.6 0.8 1.0 1.2 1.4 1.6
Interstory Drift (%)SrMBIL - UNPL'ERED ---- SHm -- SCHEME 2
SCHEME 3 --- SCHEME 4
Fig. 4.6 Response of subassemblage to beam alteration schemes,monotonic loading

the beam's initial flexural capacity. The factor of safety against
column failure is increased to 3.08.
The choice of beam alteration schemes depends upon the desired
level of safety against column damage. In all four schemes examined,
the r ratio was raised above 1. In scheme 1, however, the factor of
safety, r - 1.06, is very slim. The contribution of the slab
reinforcement and strain hardening in the beam reinforcement could
increase the flexural capacity of the columns by as much as 10 - 15%.
Scheme 1 does not provide a factor of safety of 1.54 as required by ACI
318-89 Sec. 21.4.2.2. Schemes 2, 3, and 4 all provide adequate factors
of safety against column failure. The high safety levels provided by
Schemes 2, 3, and 4 are particularly desirable because of the frame's
short brittle columns (maximum q ratio achieved was only 0.7). Scheme 4
achieves an r - 3.08 which is unnecessarily high.
4.4 EFFECT OF BEAM ALTERATION ON CYCLIC RESPONSE
Cyclic Response of the Unbraced Subassemblage. The cyclic response
of the unbraced subassemblage is charted in Fig. 4.7. The failure
sequence is described below:
1 : Column cracks in the positive direction
2 : Column cracks in the negative direction
3 : Spandrel beams crack in positive direction
4 : Spandrel beams crack in the negative direction
5 : Column fails in shear in positive direction
6 : Column fails in shear in negative direction
7 : Column loses all lateral capacity in positive direction
81
8 : Column loses all lateral capacity in negative direction
9, 11 : Same as 7
10, 12 : Same as 8
The hysteretic behavior of the unbraced subassemblage is quite
poor. Once the column's ultimate capacity is reached at points 5 and 6
respectively, the loss in stiffness and strength is very rapid.
Pinching of the hysteresis loops become more severe until the area
enclosed within the loops becomes zero at point 7 in the fourth loading
cycle.
Cyclic Response of the Altered Subassemblage. The cyclic response
of the subassemblage with beam alteration scheme 2 is shown in Fig. 4.8.
The failure mechanism is as follows:
I : Column cracks in the positive direction
2 : Column and spandrel beams crack in the negative direction
3 : Plastic hinge develops in the spandrel in the positive
direction
4 : Plastic hinge develops in the spandrel in the negative
direction
5,7,9,11: Same as 3
6,8,10 : Same as 4
The improvement in hysteretic behavior of the subassemblage due to
the beam weakening is quite apparent from Fig. 4.8. The shape of the
hysteresis loops are fat and open indicating an improved energy
dissipating capacity in the subassemblage. Pinching of the loops
82

H
2-,
02 121181
-21
-2.0 -1.5 -1.0 -0.5 0.0 0.5 1.0 1.5 2.0
Interstory Drif t (%)S T m ------- MONOP3NIC ENVELOPE - CILIC RESPCNSE
Fig. 4.7 Response of the unbraced subassemblage to cyclic loading
83

41
H Hl
Alteration Scheme 2
2
-1
.2 Load Reversal
0
10 8 ------ 2
-2
-4 ... ... '''.'*''I*.'~I
-2.0 -1.5 -1.0 -0.5 0.0 0.5 1.0 1.5 2.0
Interstory Drift ()51MBL ---------- MONOTONIC ENVELOPE C'-r']C RESPON5E
Fig. 4.8 Cyclic response of the subassemblage 6ith beam alteration
scheme 2
84

experienced in the later loading cycles of Fig. 4.7 is all but
eliminated in the analytical model; however, some slight pinching can be
expected in the actual structure due to the opening and closing of
flexural cracks.
4.5 RESPONSE OF THE BRACED SUBASSEMBLAGE WITH BEAM ALTERATION
The influence of beam alteration in concert with prestressed cable
braces on the response of the subassemblage is discussed in this
section. Both the ultimate and serviceability design approaches for the
prestressed cable bracing schemes will be investigated with n-2. Using
equations 2.2 and 2.3, the cable brace areas used are 0.88 in2 and 0.98
in2 for the ultimate and serviceability design approaches respectively.
The prestressed cable bracing is combined with beam alteration scheme 2
from Sec. 4.3. The subassemblage is subjected to both monotonic and
cyclic incremental static displacements as presented in Sec. 3.6.
4.5.1 Monotonic Behavior
The monotonic response of the subassemblage with prestress cable
bracing and beam alteration scheme 2 to monotonic loading are shown in
Figs. 4.9 and 4.10 for the ultimate and serviceability design approaches
respectively. The cable brace area used to obtain the braced-unaltered
and braced-altered response curves of Fig. 4.9 was 0.88 in2 . The cable
brace area used to obtain the braced-unaltered and braced-altered
response curves of Fig. 4.10 was 0.98 in2 . The failure mechanisms of
the unbraced-unaltered subassemblage and the braced-unaltered
subassemblage are dominated by shear failure of the column at points 0"
85

and 0' respectively. Failure of the column does not occur in the
braced-altered subassemblage. Failure has been shifted from the column
and into the beams. The failure mechanism for the braced-altered
subassemblage in Fig. 4.9 is presented below:
1-2 : Subassenblage behaves elastically
2 : Column cracks, m - 0.63, interstory drift - 0.06%
3 : Spandrel beams crack, m - 0.71, interstory drift - 0.1%
4 : Plastic hinge develops in the spandrel beam, m - 0.98,
interstory drift - 0.175%
5 : Cable brace B1 yields and brace B2 goes slack, m - 2.56,
interstory drift - 0.88%
A much higher ultimate strength is attained for the subassemblage
if both prestressed cable braces and beam weakening are utilized. In
Fig. 4.9, a 28% higher lateral strength is attained at an interstory
drift of 0.9% over that provided by the cable bracing only. At this
same drift the unbraced-unaltered subassemblage exhibits no lateral
force resisting capacity at all. At lower drift levels, however, the
results are somewhat mixed. The strength of the braced-altered
subassemblage at 0.39% interstory drift is about 38% higher than the
unbraced-unaltered subassemblage, but 24% less than the capacity of the
braced-unaltered subassemblage at the same drift. Similar conclusions
can be drawn using the serviceability design approach of Fig. 4.10.
86

3.5-
ULTIMATE DESIGN APPROACH
3.0-
2.55
2.0 -5 ----------------------------- -- --E Cable braces onunaltered.. esubassembl1age
.0*~1.5-
0
'.Unbraced subassemblage
00 0.2 0.4 016 0.8 1.0 1.2 1.4 116
Interstory Drift (%)
Fig. 4.9 Response of the subassemblage with prestressed cable bracing andbeam alteration scheme 2, ultimate design approach with cablearea =0.88 in' and O.5Py prestress force, n=2
87

3.51iSERVICEABILITY DESIGN APPROACH
2.55
2.0' - Cable braces on ualteredsubassemblage
2 .5
0
1.Ubacdsbssmla
-------------------------
Fig. 4.10 Response of thece subassemblage wt rsrse al rcn
and beam alteration scheme 2. Serviceability design approachwith brace area = 0.98 in2 and O.5Py prestress force, n=2
88

4.5.2 Cyclic Behavior
The cyclic response of the subassemblage retrofitted with
prestressed cable braces only is shown in Fig. 4.11. The ultimate
design approach for the cable braces is used with n-2 and 0.5Py
prestress force in the cables. The area of the cable braces is 0.88
in2 . The numbered points on the figure indicate the load reversal
points defined in Fig. 3.12. The primed numbers on the figure indicate
significant points on a particular loading cycle prior to the load
reversal for that cycle. The failure sequence is as follows:
1 : Column cracks in shear in the positive direction
2 : Column cracks in shear in the negative direction
3 : Spandrels crack in flexure in positive direction
4 : Spandrels crack in flexure in negative direction
5 : Column fails in positive direction, effectiveness of the cable
braces still intact
6 : Column fails in negative direction, effectiveness of the cable
braces still intact
7 : Brace Bl yields and B2 goes slack, strength is now entirely
dependent on the bracing system
8 : Brace Bl goes slack and B2 yields
9, 11 : Same as 7
10, 12 Same as 8
The effect of beam alteration scheme 2 on the braced subassemblage
using the ultimate and serviceability design approaches are shown in
89

22B
33 B
E0
o..
-2 12 10Z 81
-2.0 -1.5 -1.0 -0.5 0.0 0.5 1.0 1.5 2.0
Interstory Drift (%)SYMBOL----------MCNCTONIC ENVELOPE - CYCLIC RESPONSE
Fig. 4.1i Cyclic response of the subassemblaoce with prestressed cablebraces only. Ultimate desion approach with, n=2, brace area=0.88 in , and 0.5Py prestress force.
90

Figs. 4.12 and 4.13 respectivr-ly. The failure sequence for Fig. 4.12 is
given below:
1 : Column cracks in the positive direction
2 : Column and spandrels crack in the negative direction
3 : Plastic hinge develops in the spandrels in the positive
direction
4 : Plastic hinge develops in the spandrels in the negative
direction
5, 7 : Same as 3
6, 8 : Same as 4
9, 11 : Same as 3
10, 12 : Same as 4
Improvement in the hysteretic performance of the braced-altered
subassemblage is evident in Figs. 4.12 and 4.13 over the braced-
unaltered subassemblage of Fig. 4.11. Responses of all the systems are
dominated by the behavior of the prestressed cable braces in the later
loading cycles. The hysteresis loops of the braced-altered
subassemblages exhibit less pinching because of the development of the
plastic hinges in the spandrel beams.
4.5.3 Variation Of Prestressed Cable Brace Area To Attain Desired
Strength
As pointed out in Sec. 4.5.1, combining beam alteration with
prestressed cable braces significantly increases the ultimate strength
of the retrofitted subassemblage. Referring to Figs. 4.9 and 4.10, the
91

4J H
3
ALTERATION SCHEME 2 9
2/i
.2
3"oE
0
-d
-'10#
-22
- 4
.'
-2.0 -1.5 -1.0 -0.5 0.0 0.5 1.0 1.5 2.0
Interstory Drift (%)I-5= - -.... -mZ2N:C ENVE2APE C.:C RESPONSE
Fig. 4.12 Cyclic response of the subassemblage with prestressed cable
braces and beam alteration scheme 2. Ultimate design approachwith brace area = 0.88 in2 , and 0.5Py prestress force.
92

4
3 _..----..7119
ALTERATION SCHEME 2 11
2
01
0
0
O2
12 2 1
01 ..........
-2.0 -1.5 -1.0 -0.5 0.0 0.5 1.0 1.5 2.0
Interstory Drift (%)SYMBOL ------- MONOTONIC ENVELOPE CYCLIC RESPONSE
Fig. 4.13 Cyclic response of the subassemblage with prestressedcable braces and beam alteration scheme 2. Serviceabilitydesign approach with bTace area = 0.98 in2 and 0.5Pyprestress force. 93

ultimate strength, however, is not reached until the structure reaches
an interstory drift in excess of .9%. Possibly more significant to the
designer might be the fact that the braced-unaltered subassemblage
provides higher strength at low drifts than does the braced-altered
subassemblage with the same cable brace area. Weakening the spandrel
beams does, however, favorably alter the frame's failure mechanism.
This important benefit of beam alteration cannot be overlooked. But is
an improved failure mechanism worth sacrificing stiffness and strength
at low drift levels ?
As discussed in Sec. 2.4.2, using the serviceability design
approach, the designer strives to limit drift in the structure by
designing the retrofitted frame to attain a desired strength at a
specified drift level. In Fig. 4.10, the cable brace area was
calculated using equation 2.3. The aim is to achieve a retrofitted
strength of twice that of the original unstrengthened frame at a drift
of 0.39%. This point is labeled 0' in Fig. 4.10. The cable brace area
used is 0.98 in2 . At this drift, the braced-altered subassemblage
attains a strength of only 1.5 times that of the original frame.
It is still possible to achieve twice the strength of the original
structure in the braced-altered frame at 0.39% drift by simply
increasing the area of the cable braces. Assuming beam alteration
scheme 2, Eqn 2.3 can be modified to predict the brace area required,
Ac - [(n-0.6)(Vu)(L)]/[(C)(E)(deltafu)(Cos2 )I (4.3)
94

Similar expressions can be derived for beam alteration schemes 1, 3, and
4. The variables Vu and deltafu refer to the lateral strength and
drift, respectively, of the original frame at ultimate. Expressions can
be developed similarly to predict brace area required at any specified
drift level.
Using Eqn 4.3 and n-2, the cable brace area required is 1.4 in2 .
The response of the braced-altered subassemblage with brace cross
sectional areas of 1.4 in2 is plotted in Fig. 4.14. For comparison, the
response of the braced-unaltered subassemblage of Fig. 4.10 is repeated
in Fig. 4.14. At a drift of 0.39%, both the braced-altered and braced-
unaltered curves reach the desired strength of twice that of the
original unaltered subassemblage. To achieve the desired stiffness and
strengt- at 0.39% drift, the area of the cable braces was increased by
nearly 43%. The additional brace area in effect increases the stiffness
of the braced-altered frame by nearly 25%. The ultimate strength of the
braced-altered subassemblage increases to nearly four times the strength
of the original structure at drifts in excess of 0.9%. The overall
objective of the retrofitting project as well as specific design
criteria given by the user and governing building codes will weigh
heavily on the designer when deciding whether increased cable brace area
is a just trade off for increased frame stiffness.
95

SERVICEABILITY DESIGN APPROACH
4.0- Cable braces on altered]subasse mbl1a ge3.0-
2.5 Cable braces on unaltered
NI subassemblage
S2.0- (Ac= 0.98 in')00
0-
0-5- Unbraced-unalteredsubassemblage
A fu
0 .0 1 T
00 02 0.4 0.6 0.8 1.0 1.2 1.4 1.6
t Interstory Drift (%)
Fig. 4~.14 matching response of the altered subassemblace withresponse of the braced only subassemblage at aspecified drift. Serviceability design approach,O.5Py prestress force, n=2, cable area = .4~ in'
96

CHAPTER 5
PRESTRESSED CABLE BRACES APPLIED TO A SIX STORY SUBASSEMBLAGE OF THE
PROTOTYPE FRAME
In this chapter the focus of the study is expanded to examine the
global behavior of a six story version of the prototype frame to
retrofit strengthening. The investigation is limited to the response of
the frame along a typical column line. The design of the prototype
frame introduced in Sec. 2.3 was first completed. The frame design was
conducted in such a way as to represent common design practice in effect
when such structures were originally designed. Applicable design codes
as well as typical hand calculation techniques of the time were
utilized.
Once the prototype frame was designed, unique single story
subassemblages were developed for each level of the frame. A typical
six story subassemblage was also introduced to model the global behavior
of the frame along a typical interior column line of the perimeter
frame.
The single story subassemblages were useful in studying the
response of the six story prototype frame on a story by story basis.
The purpose of studying the six story subassemblage is as follows. The
hypothesis was developed in references 2 and 3 that for geometrically
uniform frames, the global behavior of the retrofitted frame can be
predicted by analysis of a generic single story subassemblage. To
evaluate this hypothesis the response curves obtained from the six story
subassemblage under several bracing schemes were compared to those
97

obtained from analysis of a generic single-story subassemblage. The
advantages and limitations of the hypothesis are discussed. Finally a
discussion is presented on how one might develop a practical design
strength ratio scheme for the prototype frame based on the requirements
of current building codes.
5.1 MODELING THE SIX STORY SUBASSEMBLAGE
5.1.1 Design Of The Prototype Frame
The prototype frame was introduced in Sec. 3.2 as being seven
stories high and eleven bays long. For the purpose of conducting the
experimental tests discussed in Sec. 2.3 [7], only the third, fourth,
and fifth levels of the frame were fully designed (see Fig. 2.8). In
order to examine the behavior of a multi-story version of the prototype
frame to retrofit strengthening, the frame design for the remaining
floors had to be completed.
Gravity and seismic loads for the design were obtained from the
1955 edition of the Uniform Building Code [12]. The portal method was
used for frame analysis, and design was carried out using working stress
design in accordance with the 1951 edition of the ACI Building Code
[10]. Gravity and seismic loads were the same as those utilized by the
designers of the original prototype frame shown in Figs. 2.7 and 3.2.
Design values of total story shear force for a six story prototype
frame were calculated using the 1955 Uniform Building Code and are
summarized in Table 5.1. Also shown in the table are the nominal
98

(unfactored) story shear forces obtained using the 1988 edition of the
Uniform Building Code [15].
TABLE 5.1
Comparison Of 1955 and 1988 Total Story Shear Forces For A Six Story
Prototype Frame
(values shown in kips)
Story V(1955) V(1988) % Increase
1 956 2188 129
2 837 2076 148
3 703 1852 163
4 552 1517 175
5 397 1069 169
6 191 509 166
Average 158
In the initial design calculations performed for the experimental
study [7], the prototype frame was assumed to be seven stories tall.
Grade Fy - 60 ksi steel was assumed for the spandrel reinforcement and
Fy - 50 ksi steel was assumed for the column longitudinal reinforcement.
The grades of steel ultimately used in the experimental and analytical
analybis of the prototype frame were Fv - 60 ksi for the column
99

longitudinal reinforcement and Fy - 40 ksi for all other reinforcement.
Using these revised steel grades and assuming a seven story frame,
initial calculations revealed that the spandrel reinforcement shown in
Fig. 3.2 for levels two and four were inadequate. Revision of building
height downward from seven stories to six stories reduces the spandrel
moments at levels 2 and 4 sufficiently that resizing of reinforcement at
those levels is not necessary. This action was taken so as to not
change the structural characteristics of the original prototype frame at
levels three, four, and five which correspond to the region of the frame
tested experimentally [7].
Frame design was completed assuming the prototype frame to be a six
story structure. A plan and profile of the revised six story prototype
frame is shown in Fig. 5.1. Spandrel reinforcement for the complete
frame is summarized in Fig. 5.2. The sections shown depict longitudinal
reinforcement typical at the spandrel ends. For simplicity, spandrel
reinforcement in the exterior bays was assumed the same as that provided
for the interior bays. The reduction of frame height from seven to six
stories necessitated a revision downward in column axial loads due to
gravity forces at each story. As a result, column lateral strength for
any given story was also reduced (see lateral shear strength equation
for short columns in Fig. 3.7). Nevertheless, longitudinal
reinforcement for the third and fourth floor columns (those modeled for
the experimental study) remained unchanged (see Fig. 2.7). A summary of
column reinforcement details is shown in Fig. 5.3. Minimum tie spacing
provisions governed for all six stories, therefore a constant tie
spacing of 18 inches was used over the full height of the building.
100

9-6 -9 at 21 189'
A6
S5
o -4
03
AIsymnat
4t fir subassemblage S
ELEVATION
228'
~19,-6' 8'W6
PLA N
Fig. 5.1 Plan and profile of the six story prototype frame
101

ROOF LEVELS 4,5,6 LEVELS 2, 3
n00 6farlo. C2 no. 6** n.6b~ *eno. b *@no.8
.Z no. 4bars Ns no. 4 go no. 4
0.no. 4 bars 0 * no. 4 0 0 no. 4
no. 6bars 9T n o.460 no.46
Fig. 5.2 Spandrel reinforcement for the six story prototype frame
102

STORIES 5&6
no. 7 no7 no.4 ties at I a
18
STORIES 3&4
no.10 no.1s
no.10a no.10
no1O no.1 0 no is atiB8
STORIES 1&2
no.14 no.1
no.' - no.11
o.?1 no11 -- flo.4ties at 19"
no.14 no.14
Fiq. 5.3 Column reinforcement for the six story prototype frame

Longitudinal column reinforcement was assumed to be the same for all
frame columns in a given story.
5.1.2 Selection Of Typical Six Story Subassemblage Of The Prototype
Frame
The six story subassemblage chosen for this study is located along
column line A-A in Fig. 5.1. The subassemblage represents a typical
interior column line in the prototype frame. The analytical model of
the six story subassemblage is shown in Fig. 5.4. The assumptions made
in modeling the prototype frame were discussed previously in Sec. 3.2
and are applicable to the six-story subassemblage. As discussed in Sec.
3.2 axial inextensibility of the columns and beams has been assumed. As
a result, one horizontal degree of freedom is established per story.
Roller supports are assumed for the boundary conditions at midspan of
the spandrel beams as shown in the figure. Displacements are applied at
the beam column joint at each story.
Single-story subassemblages for each story have also been
established along column line A-A. The location of a typical single-
story subassemblage established for the fourth floor is shown in Fig.
5.1. The fourth floor subassemblage has been designated as the generic
single story subassemblage used in the discussion of Sec. 5.3. The
choice of generic subassemblage was made for several reasons. First,
the fourth floor subassemblage most closely resembles the subassemblage
studied in previous studies [2, 3] as well as chapters 3 and 4.
Reinforcement, strength, stiffness, axial force, location in the frame,
104

FLOOR LEVEL
2S2
ROOF
6
120
5 120
5
4
3 ~120"
3
2
120
1 ~120"
Fig. 5.4 Anialytical model for the six story subassemblage of theprototype frame

and response history most closely match the original subassemblage of
the seven story frame. Secondly, the subassemblage is located near the
center of the frame away from the frame boundaries.
5.1.3 Prestressed Cable Brace And Beam Alteration Schemes Used In The
Study
It was shown in chapter 4 that there are advantages to using beam
alteration in conjunction with prestressed cable bracing systems. As a
result, the designer of a retrofit strengthening scheme may wish to
utilize both prestressed cable braces and beam alteration. In Sections
5.2 and 5.3 several prestressed cable bracing schemes are examined as
well as a beam alteration scheme to support the study. These retrofit
strengthening schemes are presented next.
In Sec. 4.5.3 it was demonstrated how an engineer can utilize the
serviceability design approach and Eqn. 2.3 to design a retrofitted
structure which will achieve a desired strength at a specified drift.
Once the response of the unstrengthened frame is determined, the
designer can derive equations similar to Eqn. 4.3 for selected beam
weakening schemes. This approach was followed in determining required
cable brace areas.
A design strength ratio of n-2 was arbitrarily chosen for each
story. Further, n-2 strength was to be attained at a drift
corresponding to shear failure of the columns in each story of the
unstrengthened frame. For example, the ultimate lateral strength of
story 6 was determined to be 52.4 kips at a relative interstory drift of
0.34% (0.407 in.) from single story subassemblage analysis. The
106

response of the unstrengthened subassemblage is normalized with respect
to 52.4 kips and plotted as the solid line in Fig. 5.5. With n-2, the
desired retrofitted strength is 2(52.4) - 104.8 kips. From Eqn. 2.3 the
required cable area was found as:
Ac - [(2-1)(52.4k)(174in)]/[(1)(26,000ksi)(.407in)Cos 2 (43.6)] - 0.82 in2
If beam alteration is also part of the retrofitting scheme, a
larger cable brace area is required to achieve n-2 strength at 0.34%
drift (see discussion in Sec. 4.5.3). The response of the story six
subassemblage to beam alteration (u - 16 in., v - 16 in.) is normalized
to 52.4 kips and plotted as the dashed curve in Fig. 5.5. Observe that
at a drift of 0.34%, the strength of the altered subassemblage is 50%
that of the unaltered subassemblage. The cable brace area required to
reach n-2 strength in a braced-altered subassemblage is calculated as:
Ac-[( 2 -0.5)(5 2 .4k)(174in)]/[(1)(26,000ksi)(0.407in)Cos2(43.6)]- 1.23in 2
Cable brace areas were similarly calculated for each story of the
six story prototype building. The cable brace area schemes utilized in
this chapter are summarized in Table 5.2. Bracing schemes A, B, and C
were developed for application without beam alteration. Scheme Al was
developed in conjunction with beam alteration.
107

UNALTERED AND ALTERED SUBASSEMBLAGESTORY 6
monotonic looding
2.0-1.9.1.81.71.61.51.4
1.31.21.1
1.0%- 0.90S0.80.7
0 0.6 U:16" V=16".a 0.5 o o,0.4
0.3-
0.20.1.0.0
-0.1-0.2-0.3-0.4-0.54,
" I I I'' lTI'! '
0.0 0.2 0.4 0.6 0.8 1.0 1.2 1.4 1.6
Interstory Drift (%)STMBOL - UNALTEREO ALTERED
Fig. 5.5 Response of unaltered and altered sinale story subassemblacesfor story 6, monotonic loading, u=16 in., v=16 in.
108

TABLE 5.2
Prestressed Cable Brace Area Schemes
(areas in square inches)
Floor Scheme A Scheme Al Scheme B Scheme C
1 1.49 2.07 1.49 1.49
2 1.21 1.84 1.49 1.49
3 1.09 1.39 1.09 1.49
4 1.05 1.44 1.09 1.49
5 0.93 1.50 0.93 1.49
6 0.82 1.23 0.93 1.49
Notes:Scheme A : Bracing area changes every story on unaltered frameScheme Al: Bracing area changes every story on altered frameScheme B : Bracing area changes every other story on unaltered frameScheme C : Bracing area held constant for all stories on unaltered frame
There are many factors which affect a designer's choice of cable
brace area schemes for a structure. Among the most influential factors
are: 1) the importance of achieving specified lateral strengths at each
story level, 2) minimization of labor and material costs, and 3) frame
geometry. Careful consideration of the relative importance of these
factors may lead a designer to any number of prestressed cable brace
area schemes.
Suppose the designer's overriding objective is to double the
lateral capacity of each story at a drift level corresponding to the
ultimate strength of that story in the unstrengthened frame. The
designer would choose a design ratio of n-2 and calculate the cable
109

brace area required for each story as shown above. If this was the only
concern, either prestressed cable brace area scheme A or Al shown in
Table 5.2 would be arrived at. In designing prestressed cable brace
scheme A and Al, the designer assumes it is practical to specify
different cable brace areas for each story. The number of connections
and prestressing points as well as the manhours required to install and
prestress each cable is assumed to be of secondary concern. The
advantage of such a scheme is that the designer can closely control the
design strength of each story as desired.
The designer might be primarily concerned with controlling
installation costs, thus desiring to minimize the number of connections,
prestressing points and cable sizes utilized. A bracing area scheme
similar to scheme C shown in Table 5.2 might then be specified. In
scheme C the assumption is that only one cable size is to be used for
the entire structure. The cable brace areas shown represent the largest
area required by any story in the structure to reach twice its
unstrengthened capacity, or n-2.
Scheme B represents a compromise between schemes A, and C. In
designing scheme B costs are limited by changing cable sizes every other
story. The number of connections and prestressing points, as well as
installation manhours, are greatly reduced over those required by
schemes A and Al. Meanwhile greater control over frame response is
achieved over that provided by scheme C.
In chapter 4, four beam alteration schemes were evaluated for the
fourth story subassemblage of the original seven story prototype frame.
It was shown that beam alteration scheme 2 provided optimum results.
110

Recall that in scheme 2 the first layer of negative and positive
reinforcement was cut (refer to Fig. 3.2 and Table 4.1). The conclusion
was drawn that scheme 2 provides optimum results for the fourth story
subassemblage analyzed. Alteration scheme 2 might not necessarily be
optimal if, for example, one evaluates the response of a two story
subassemblage consisting of floors three and four. For such a case,
scheme 1 might be appropriate for level 4 spandrels and scheme 2
appropriate for level 3.
For a six story structure, it becomes apparent that a great number
of beam weakening schemes can be developed. In an effort to limit the
scope of this study, only one beam alteration scheme for the six story
subassemblage was considered. Using the identical approach utilized in
chapter 4, the optimum beam alteration scheme for each level of the six
story frame was determined by single-story subassemblage analysis. The
optimum beam weakening scheme for each level is summarized in Table 5.3.
The combination of all six beam weakening schemes shown will be used in
the discussion of Sec. 5.2 in conjunction with prestressed cable brace
scheme Al.
5.2 RESPONSE OF THE SIX STORY FRAME USING UNIQUE SINGLE STORY
SUBASSEMBIAGE ANALYSES
5.2.1 Response Of The Unstrengthened Frame
As discussed in Sec. 5.1.2, unique single story subassemblages were
developed for each story of the prototype frame. A monotonic static
incremental displacement analysis was conducted on unstrengthened
111

TABLE 5.3
Beam Alteration For The Six Story Subassemblage
Level U V V r Reinforcement Cutne2ative Positive
2 6" 0" 36" 2.06 2-#6 none2-#8
3 6" 0" 36" 1.93 2-#6 none2-#8
4 3" 3" 36" 1.64 2-#6 2-#6
5 6" 6" 36" 2.84 4-#6 2-#6
6 6" 6" 36" 2.50 4-#6 2-#6
Roof 16" 16" 36" 1.65 2-#6 2-#6
versions of each subassemblage. The incremental displacements were
applied in such a manner that for any load step the prescribed relative
story displacements at each level were identical. The applied
displacements varied linearly with the height of the frame. The maximum
applied interstory drift was 1.6%.
The response curves for each story are plotted in Fig. 5.6. All
six response curves are dominated by shear failure of the reinforced
concrete short columns. The lateral capacity of each subassemblage is
shown in kips force. This value represents the lateral capacity each
subassemblage contributes to total story strength. The total story
strength at any level is attained by multiplying the strength of the
corresponding subassemblage by the number of bays (11) times 2, or 22.
112

An identical analysis was conducted on the six story subassemblage of
Fig. 5.4. A plot of the relative story response curves for the six
story subassemblage provides very close agreement to the curves obtained
from the individual subassemblages and therefore is not repeated.
When interpreting the curves of Fig. 5.6, it is important to
recognize how the shear dominated column behavior is reproduced by the
analytical model. Recall that nonlinear rotational springs at the
column ends are used to produce the overall nonlinear lateral load-
displacement curve of the column element (refer to Sec. 3.3). The
moments at the ends of the column element establish behavioral states of
each spring. As long as the column end moments are equal, the
rotational springs exhibit simultaneous behavior, and the desired
overall column load-displacement curve is represented exactly as seen in
the curves for stories 2, 4, and 5.
If, however, the column end moments are not equal, different
nonlinear behavior is exhibited by the two rotational springs.
Behavioral changes occur for each spring independently at various column
drifts. This causes a deviation in behavior from the desired column
load-displacement curve. One end of the column may "fail" earlier than
the other. This behavior is seen in the curves for stories 1, 3 and 6.
Such behavior is an anomaly unique to the analytical model since the
actual column displays a global shear failure at a unique drift.
The general shape of the response curves for stories 2, 4, and 5,
as well as their failure mechanisms, are identical to the subassemblage
discussed in detail in Sec. 3.7.1. The stiffness and strength of the
spandrel beams framing into the bottom of the column is the same as for
113

5O0
450
400
350
""3000.
2500
0.00200
0
Q- 150
100 A B
story --
-5010.0 0.2 0.4 0.6 0.8 1.0 1.2 1.4 1.6
Interstory Drift (%)S'rMBOL - STORY6 ------ 5 -
3 -- 2
Fig. 5.6 Respcnse curves for unstrengthened single story subassemblagesto mrtorlic loading
114

the top of the column in the cases of stories 2, 4, and 5. Since the
member properties of these subassemblages are symmetrical, an inflection
point is located at mid-height of the column. This results in equal end
moments for the column. When the column reaches its ultimate shear
capacity, simultaneous behavior of the nonlinear springs (due to the
equal end moments) causes both ends of the column to "fail" at the same
time.
Failure mechanisms for stories 1, 3, and 6 are slightly different.
The member properties for the spandrel framing in at the bottom of the
subassemblage column are not the same as they are at the top of the
column. Since the subassemblage no longer has symmetrical member
properties, the inflection point in the column moves away from the
center. A larger moment develops at the bottom of the column where the
beam-column joint is stiffer. As a result, the lower column spring
"fails" first. The upper column spring "fails" at a slightly higher
drift. This condition is of little significance in stories 3 and 6;
however, it is quite prevalent in story 1. The bottom of the first
story column is assumed fixed in the computer model. This is equivalent
to framing the column into infinitely stiff spandrel beams at the column
base. A larger end moment therefore develops in the bottom of the
column than at the top. It follows that the ultimate capacity of the
inelastic spring is reached first at the base. This occurs at a drift
of 0.35% and is labeled as point A in the figure. Ultimate capacity of
the inelastic spring at the top of the column is reached at a drift of
0.40% shown as point B. Actual shear failure of the column should occur
at approximately 0.4% drift with a lateral load of 99 kips.
115

The observed ultimate lateral strengths of each story and their
corresponding ultimate drifts are summarized in Table 5.4. Observe that
the lower stories achieve a higher ultimate lateral capacity than the
upper stories. This is attributable to increased axial load on the
lower story columns as well as increased transverse shear reinforcement
in stories 1 and 2.
TABLE 5.4
Ultimate Lateral Capacity Of The Unstrengthened Frame By Story
Story Lateral Capacity % Drift at Ultimate(kips)
1 95.0 0.35
2 89.2 0.40
3 77.3 0.36
4 69.3 0.36
5 60.9 0.34
6 52.4 0.32
5.2.2 Response Of the Braced-Unaltered Frame
Bracing scheme A was next applied to the single story
subassemblages and the six story subassemblage. Monotonic incremental
displacements were applied to both the single story and multi-story
models. The resulting curves for the single story subassemblages are
116

presented in Fig. 5.7. The corresponding response curves obtained from
analysis of the six story subassemblage are identical to those in Fig.
5.7 and are therefore not repeated.
Recall that for bracing scheme A the size of cable bracing was
changed at every story level. Further, the objective was to double the
lateral strength for any story at a drift corresponding to shear failure
of the columns in the original unstrengthened frame. Comparison of the
unstrengthened and braced curves confirm that this objective was met.
Note that the failure mechanism of each story is still dominated by
shear failure of the columns. Further, column shear failure occurs at
the same drift in both the unstrengthened and braced versions of the
frame.
At drifts beyond those causing shear failure of the columns,
response is dominated by characteristics of the cable braces as
described in detail in Sec. 3.7.2. The reader is reminded here that
these results rely on the validity of the assumption that the columns
maintain their ability to carry the gravity loads even though the column
has failed in shear. Ultimate story strength at each floor is reached
at a common drift of 0.88%. This drift corresponds to simultaneous
yielding and slackening of cable braces in each story.
5.2.3 Response Of The Braced-Altered Frame
Prestressed cable bracing scheme Al and the beam alteration scheme
shown in Table 5.3 were applied to the single story subassemblages and
the six story subassemblage. Monotonic incremental displacements were
again applied as in the previous unstrengthened and braced-unaltered
117

500-
450-
400-
350-
300- braces 51 11B2 yield/slacken
columns fail n shear Vstory I-
~ 250 A'------------------
00
0.
-50 AU: 0.88%
0.0 0.2 0.4 0.6 0.8 1.0 1.2 1.4 1.6
Interstory Drift()SYMBOL - SrORT6 ------- --- 3
- - ~2 - --
Fig. 5.7 Response curves for braced-unaltered single storysutassemblages to monotonic loading, prestressed cat1ebrace scheme A
118

runs. The resulting curves obtained from the single story
subassemblages are presented in Fig. 5.8. The response curves obtained
from the six story subassemblage analysis once again confirm good
agreement with analysis using single story subassemblages.
In bracing scheme Al the size of cable bracing was again changed at
every story level. As with scheme A, the objective was to double the
lateral strength at each story at a drift corresponding to shear failure
of the columns in the unstrengthened frame. To n-hieve this objective
the larger cable brace sizes indicated in Table 5.2 were required as
explained in the discussion of Sec. 4.5.3. Comparison of the
unstrengthened braced-altered curves of Fig. 5.8 at the appropriate
drift confirms that this objective was met.
With the exception of story 1, the failure mechanisms of each story
is no longer dominated by shear failure of the columns. Beam weakening
at level 2 spandrels was successful in moving failure away from the top
of the first story column and into the beams. Beam weakening may not,
however, prevent shear failure from eventually occurring in the story 1
column. The "failure" of the inelastic spring at the base of the story
1 column is delayed from occurring until a drift of 0.48%. Even with a
reduced end moment transferred to the top of the column in an altered
frame, the story 1 column may still fail in shear because of the large
end moment at the base of the column. A design engineer may in this
case elect to utilize one of the more traditional seismic retrofitting
techniques discussed in chapter 1 to strengthen the first floor columns.
Plastic hinges formed in the weakened spandrel beams at drifts
shown in the figure. Beyond these drifts, response was again dominated
119
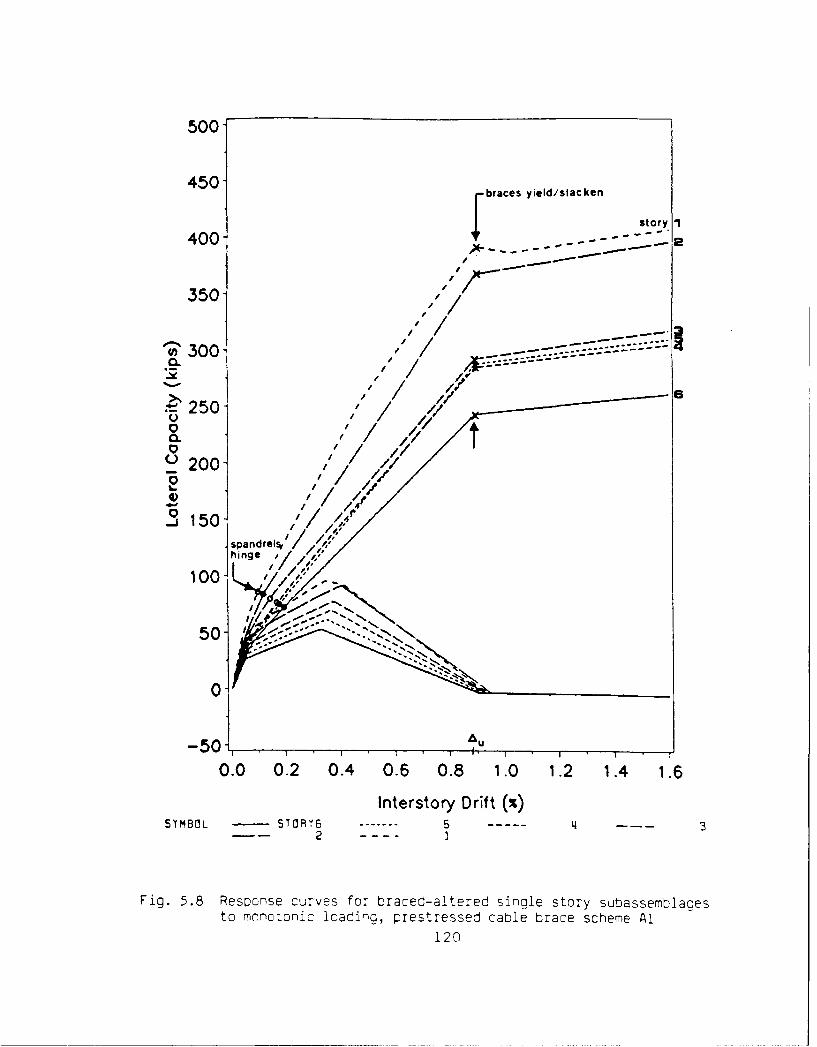
500-
450 r braces yield/slacken
400 -- - - -story 1
350 '/
n300 - ----CL-
250 1
00
050
00
50-
0-
50
0.0 0.2 0.4 0.6 0.8 1.0 1.2 1.4 1.6
Interstory Drift (%)SYMBOL - STORYG ---- 4 3
- -2 1
Fig. 5.8 Response curves for braced-altered single story subassemblagesto mnnotonic loading, prestressed cable brace scheme Al
120
by behavior of the prestressed cable bracing system. Ultimate story
strength at each floor was again reached at a common drift of 0.88%.
5.3 EVALUATION OF THE SINGLE STORY GENERIC SUBASSEMBLAGE HYPOTHESIS BY
CONTRAST WITH RESULTS OF A SIX STORY SUBASSEMBLAGE ANALYSIS
In the previous prestressed cable brace study [2], it was
hypothesized that global behavior of the retrofitted frame could be
adequately represented by modeling and analyzing Lne generic single
story subassemblage. In this section the hypothesis is evaluated. The
six story subassemblage was fitted and analyzed with bracing schemes A,
B, and C of Table 5.3. The resulting normalized response curves for
each scheme were compared and contrasted to the normalized response
curve obtained from a generic single story subassemblage.
The location of the generic single story subassemblage is shown in
Fig. 5.1. The generic subassemblage is identical to the unique single
story subassemblage developed for story 4 in Sec. 5.2. The choice of
generic subassemblage was made for the following reasons. First, the
fourth floor subassemblage most closely resembles the subassemblage
studied in previous studies [2, 3] as well as chapters 3 and 4.
Reinforcement, strength, stiffness, axial force, location in the frame,
and response history most closely match the original subassemblage of
the seven story frame. Secondly, the subassemblage is located near the
center of the frame away from the frame boundaries.
The cable brace area used was 1.05 in2 which is the same cable
brace area specified for story 4 in bracing scheme A. The monotonic
response of unstrengthened and braced-unaltered versions of the
121

subassemblage are plotted in Fig. 5.9. The generic subassemblage
hypothesis is based on the premise that the normalized response curve of
Fig. 5.9 adequately represents the global behavior expected of the
complete frame. The critical unstated assumption was that every bay of
the frame is braced uniformly and that cable brace areas are selected
based on a common design ratio n throughout the structure.
Relative response curves for the unstrengthened six story
subassemblage and a braced-unaltered version with bracing scheme A are
presented in Fig 5.10. The relative response curves have been
normalized with respect to the ultimate strength of the unstrengthened
frame at each story (load ratio m as defined in Sec. 2.4.2).
The monotonic response curves for the unstrengthened frame shown in
Fig. 5.10 fall within a fairly tight band as expected. The response of
the generic subassemblage is the same as that for story 4 and falls in
the center of the family of curves.
Recall that in bracing scheme A the size of the cable braces was
changed at every level of the frame. The family of curves representing
response of the braced frame with bracing scheme A falls within a
relatively tight band. The curves have a range of 0.31 at 0.88% drift
and a deviation of 0.13 using the generic subassemblage response as the
basis. The response of the braced generic subassemblage is identical to
the response of story 4 and falls near the center of the family of
curves. The generic subassemblage model underestimates the ultimate
strength of story i by 4.8% and overestimates the ultimate strength of
story 2 by 8.8%. For bracing scheme A the generic subassemblage
hypothesis seems reasonable.
122
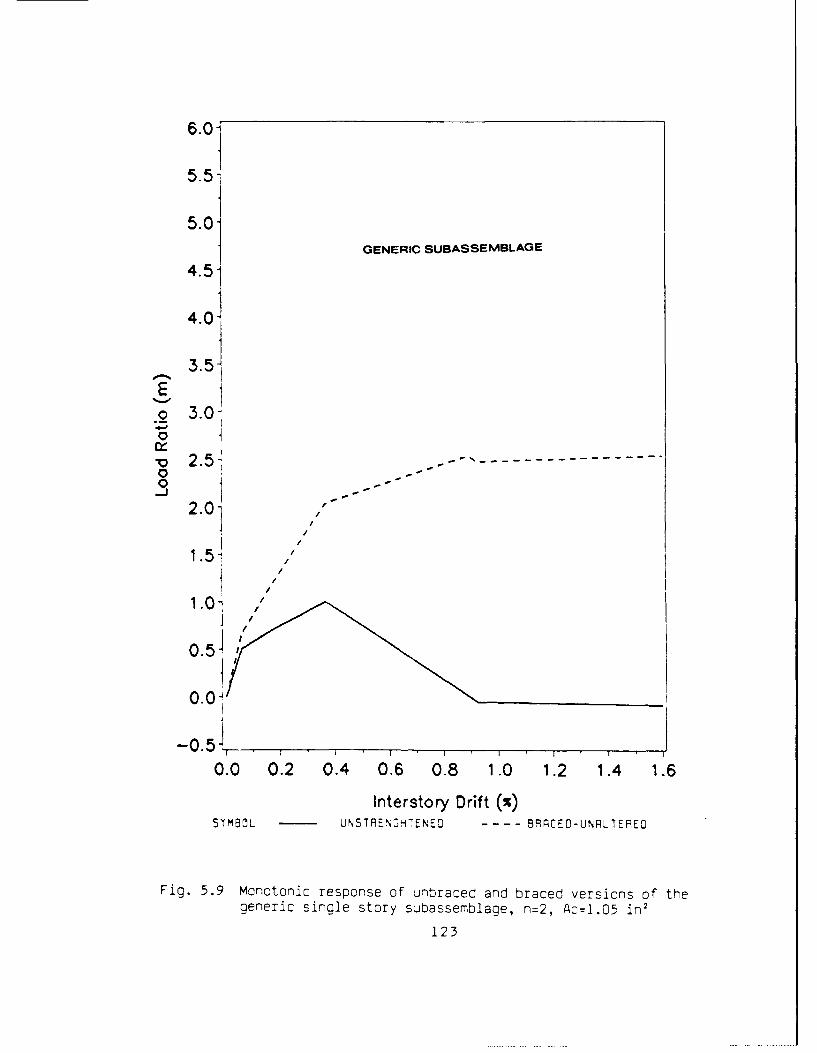
6.0~
5.5-
5.0-GENERIC SUBASSEMBLAGE
.5413.0-
3 .51 1
2.0
1.5-
0.0 0.2 0.4 0.6 0.8 1.0 1.2 1.4 1.6
Interstory Drift (%)SYMBOL - UNSTRENSH7ENED -- -- B9ACEO-UNRLTERED
Fig. 5.9 Monotonic response of unbraced and braced versions of thegeneric single story subassemblage, n=2, Ac=l.0)5 in2
123

6.0- SCHEME A
5.5-
5.0-
4.5-
4.0-
3.5-
.0 3.0-BRACED FRAME S~y
0
2.0-
1.5-
1 .0- UNSTRENOTHENED FRAME
0.5-
0.0-
-0 .A. II
0.0 0.2 0.4 0.6 0.8 1.0 1.2 1.4 1.6
Interstory Drift (%)SYMBOL - STORY6 --- 5 '4 3
- -2 - -- - I
Fig. 5.10 Relative monotonic response of unbraced and braced versionsof the six story subassemblage changing size of cable bracesevery story, scheme A
124

Using bracing scheme B the cable brace size was changed every other
story (at levels 3, and 5). The relative response curves for bracing
scheme B are plotted in Fig. 5.11. The response of the generic
subassemblage is presented as well and plots on top of the story 5
curve. The dispersion of the response curves is more apparent in this
bracing scheme and falls into roughly two distinct bands as expected
since the cable brace size was changed every other story. One band
contains the curves for the odd numbered stories 1, 3, and 5. The
second band contains curves for the even numbered stories 2, 4, and 6.
The range of the curves is 0.52 at 0.88% drift. The deviation from that
of the generic subassemblage response increases to 0.23. The generic
subassemblage model underestimates the ultimate strength of story 6 by
14.7% and overestimates the ultimate strength of story 3 by 6.0%.
In bracing scheme C the cable brace size is held constant for the
entire height for the structure. The response of the six story
subassemblage with bracing scheme C is plotted in Fig. 5.12. The
response of the generic subassemblage is presented in the figure as well
for comparison. The family of braced response curves are dispersed to
the maximum extent under this bracing scheme. The range of the curves
is 2.06 and the deviation from the generic subassemblage model is 1.33.
The generic subassemblage model underestimates the ultimate strength of
story 6 by 86.9%.
The generic subassemblage model becomes progressively less accurate
in representing the global response of the frame as the bracing scheme
employed deviates from one in which the cable brace area is changed at
every story level. In a practical bracing scheme, cable brace area
125

6.0- SCHEME 8
5.5-
5.0-
4.5-
4.0-
BRACED FRAME
.2 3.00
2.5~ geric subassemblage --
2.0-
1.0 UNSTRENGTHENED FRAME
0.5-
0.0
0.0 0.2 0.4 0.6 0.8 1.0 1.2 1.4 1.6
Interstory Drift (%)SYMBOL - S~TOP16 ---- L-- 3
- - ~2 -
Fig. 5.11 Relative monotonic response of untbraced and braced versic-sof the six story subassemblace chard nq size of cable bracesevery other story, scheme 8
126

6.0- SCHEME C
5.0-
4.5-
4.0 BRACED FRAME
3.5-
.0 3.0 1
- -- -, -
2.5geei uasmle0
2.0-
RNTENGTHENED FRAME
0.5.
0.0-
0.0 0.2 0.4 0.6 0.8 1.0 1.2 1.4 1.6
Interstory Drift (%)SYMBOL - STOPTE ---- 5 4 - - 3
- -2 1
F q. 5.12 Relati,/e rcnotcnjc response of unbraced and braced versions oftre six stc:ry surcasserrblaqe holding size of cable braces constantscheme C
127

might change every other story or at some other feasible interval. The
generic subassemblage model is therefore of little practical value in
designing bracing schemes of this type. In Sec. 5.2 it was shown that
unique single story subassemblages and the six story subassemblage
produce nearly identical results. As a minimum, one should employ
either a combination of unique single story subassemblages or a multi-
story subassemblage if one wants to accurately represent global behavior
of a frame under practical bracing schemes.
5.4 DISCUSSION OF PRACTICAL DESIGN STRENGTH RATIO SCHEMES FOR THE
PROTOTYPE FRAME
In the previous two sections, the response curves for the six story
subassemblage were studied under the four bracing schemes of Table 5.2.
To put the results into practical perspective, it is of interest to
evaluate the adequacy of these bracing schemes for bringing the
prototype frame up to current building code standards.
In Sec. 5.1 the prototype frame was designed using seismic design
loads recommended by the 1955 edition of the Uniform Building Code. In
order to examine the level of retrofit strengthening which would
actually be required for the prototype frame, the recommended design
story shears were recalculated using the method specified in the 1988
edition of the Uniform Building Code. From these results the ultimate
load ratio m required for each story in order to meet present code
standards was calculated and presented in column 2 of Table 5.5.
128
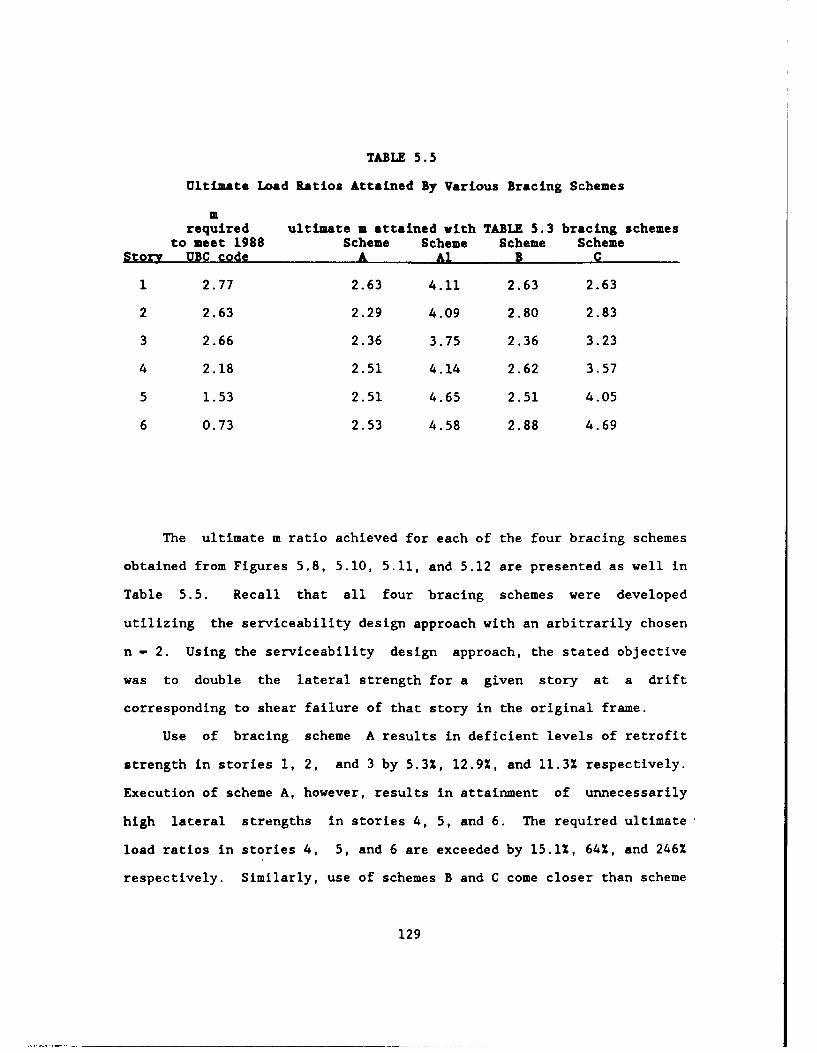
TABLE 5.5
Ultimate Load Ratios Attained By Various Bracing Schemes
arequired ultimate a attained vith TABLE 5.3 bracing schemes
to meet 1988 Scheme Scheme Scheme SchemeStory UBC code A Al B
1 2.77 2.63 4.11 2.63 2.63
2 2.63 2.29 4.09 2.80 2.83
3 2.66 2.36 3.75 2.36 3.23
4 2.18 2.51 4.14 2.62 3.57
5 1.53 2.51 4.65 2.51 4.05
6 0.73 2.53 4.58 2.88 4.69
The ultimate m ratio achieved for each of the four bracing schemes
obtained from Figures 5.8, 5.10, 5.11, and 5.12 are presented as well in
Table 5.5. Recall that all four bracing schemes were developed
utilizing the serviceability design approach with an arbitrarily chosen
n - 2. Using the serviceability design approach, the stated objective
was to double the lateral strength for a given story at a drift
corresponding to shear failure of that story in the original frame.
Use of bracing scheme A results in deficient levels of retrofit
strength in stories 1, 2, and 3 by 5.3%, 12.9%, and 11.3% respectively.
Execution of scheme A, however, results in attainment of unnecessarily
high lateral strengths in stories 4, 5, and 6. The required ultimate
load ratios in stories 4, 5, and 6 are exceeded by 15.1%, 64%, and 246%
respectively. Similarly, use of schemes B and C come closer than scheme
129
A to matching required strengths in the first three stories, however
retrofit strengths achieved by both schemes remain deficient by 5.3% in
story 1. Scheme Al bracing was applied in conjunction with the beam
alteration scheme of Table 5.3. As seen in Table 5.5, the required
ultimate load ratio provided is far exceeded in all six stories.
From these results it is evident that any practical bracing scheme
will most likely make use of a unique design strength ratio n estimated
for each story based on current seismic design loads. Additionally,
because considerably higher ultimate m ratios are obtained by using beam
alteration in conjunction with the cable bracing, lower design ratio n
values for each story may be selected.
130
CHAPTER 6
INSTALLATION OF PRESTRESSED CABLE BRACING SYSTEMS AND CONNECTION DESIGN
6.1 PRACTICAL CONSIDERATIONS FOR APPLICATION OF PRESTRESSED CABLE
BRACING SYSTEMS
In chapters 4 and 5 the benefits of retrofit strengthening with
prestressed cable bracing and beam alteration were analytically
demonstrated. Practical implementation of beam alteration may be
accomplished by simply cutting or coring into the beam. Although the
operation is labor intensive, material costs are small and execution
difficulty is manageable. The greatest concerns in beam alteration
involve accurately determining the placement of reinforcing steel prior
to cutting, and obtaining adequate operating clearance for concrete saws
and/or drills. Care must be taken to cut only the desired layers of
longitudinal steel while preserving the integrity of the shear
reinforcement. Applications of beam weakening techniques have already
been successfully implemented in conjunction with traditional steel
bracing systems. Installation of prestressed cable bracing systems,
however, are not so straight forward. To the knowledge of this author,
no practical applications of prestressed cable bracing systems have been
implemented or tested to date.
Modeling a prestressed cable bracing system analytically has been
discussed extensively in this study. Actual installation of prestressed
cable braces to a structure such as the prototype building introduces
many additional problems not considered in the present study. In this
section some of these considerations are identified and discussed in
131

light of how they may affect practical application of prestressed cable
braces.
Types And Sizes Of Standard Prestressing Tendons. There are four
common types of tendon systems: monostrand, single bar, multi-wire, and
multi-strand tendons. The most widely used type of prestressed tendon
used for post-tensioning applications is the seven wire strand [13]. In
this study grade 270 seven wire strand tendons were assumed for the
cable brace model. Standard nominal diameters and cross-sectional areas
available for grade 270 tendons are given in Table 6.1.
TABLE 6.1 Standard Seven Wire Prestressing Cable Sizes, Grade 270
Nominal NominalDiameter Cross-Secti~nal Area(in.) (in.-)
3/8 0.085
7/16 0.115
1/2 0.153
0.6 0.216
Any number of seven wire strands can be combined into a multi-
strand tendon as needed to achieve larger cross-sectional areas. For
the purpose of this study the assumption was made that any size multi-
strand cable required would be available. In practical applications the
132

exact theoretical cable brace area required would in general not be
available. It is not practical to mix strand sizes within a cable to
reach a certain cross-sectional area. Cross-sectional areas can be
obtained reasonably close to the theoretical area reqiired, however, by
choosing an appropriate number of seven wire strands shown in Table 6.1.
Post-Tensioning Techniques. Throughout this thesis the generic
term "prestressed cable braces" has been used to describe the bracing
system. In the prestressed concrete industry, prestressing operations
are generally divided into two classifications: pretensioning and post-
tensioning. In pretensioning the tendon is stressed prior to casting
the concrete, while in post-tensioning the tendon is tensioned after the
concrete has been cast. For application to cable bracing, standard
techniques developed for post-tensioning tendons would most likely be
appropriate.
Various proprietary post tensioning systems are available. These
systems differ in the type of tendon that they employ, in the manner in
which the tendons are tensioned, and in the anchorage devices which are
used. The Freyssinet K-Range and the VSL multi-strand post tensioning
systems are discussed below.
The Freyssinet K-Range System is illustrated in Fig. 6.1. The
Freyssinet K-Range System is a multi-strand system in which each strand
is individually gripped by three conical jaws that seat into tapered
holes inside an anchorage block. The stressing is performed by a
center-hole Jack which simultaneously tensions all strands in a tendon.
Upon release of the Jack, pull in of the strands engages the wedge like
jaws that anchor the strands. There is a certain loss of cable
133

(a aknga nhorage corvneA
0 Idiom
(an jacmin ann (mmhrag an mm)i mm)in m
Ml4/1 US61140) 4.6 Il0) 441(100)0 A 7/6 4/6 686 (loI) 46 (l001 Go(,**) '3(111) to (430)
c12/.S /. 71. 16 (010) 4.I(N0) 1.0 (1 II(3*) Is1(630)5.1216 GAO(3ON) 46 (126) &60(200) 16,13001 26 (160)
I19/NO6aE14)90as)(O
BMb JaCkCQ detaft
WWI rang. i 4 sagh tendon foce 11111 long* In ohealh ionlon *,or.no Of insdeO. s 10 (kN) no of W06 d1- it' (kIN)stra/de in. (mmn) 0.7 Am,, strad on. (M-) 0 r~l
1/4. S I a0(Us) to0 ('36) I 14(36) 41,0(182)
71. 6 1. (64) SIPA (267 4/46 a 1.1 (66) 11111(N111)004 (lON) 41040(730)
12/.S a RAM(6) 2313 (1026) 7/6 4 1.6 (70) P0010(912)Is 3404 (1641 MV 0618M1
I916 is 13 (64). 376 a ($Sri) 124.6 a 3.21(60) 3160 (1416)it 649 3(2.4*) (2 4600O (I %N)
M7.6 t0 3., (64) 160 1(11672) 19/.6 2t 4.s (l00w 6336 037Y)87 76"A (3473) Is 77A. (34)
M7.6 20 44 (113) s06 4 (3600) 27/46 20 4 ? (I30) 630 (44)60 too.6 (47?4) a7 I IIOT (4924)
$0/ to6. ((36) l0s66 (4066) 37/46 to &1(130) 114610 (6107)66 16900 0(7012) 37 lei? 0 (6146)
Wc 1/2 in. (13rmfI-270K series Wd 0.6 in. (l5rfvn)-270K wsere
Fig. 6.1 The Freyssinet K-Range post tensioning system [133
134

elongation that takes place before the conical jaws engage the cable
strands. This loss of cable pretension must be accounted for in design.
Detailers of post-tensioning anchor blocks must ensure that there is
sufficient clearance for erectors to thread cables as well as maneuver
and operate the center hole Jack.
The VSL multi-strand post tensioning system is illustrated in Fig.
6.2. Jacking and anchoring devices for the VSL multi-strand system are
similar to those developed previously for the Freyssinet System. Multi-
strand tendons can be jacked from both ends to reduce frictional losses
or can be jacked from one end with the other end of the tendon
terminating in a dead end anchor. Both the Freyssinet and the VSL
systems utilize 1/2 or 0.6 in. seven wire strand tendons and have jacks
available which can prestress up to 55 strands simultaneously. Either
system can probably be adapted to post-tension cable braces.
Location Of Post-Tensioning Anchors. Drawing from conclusions
developed in Ref. 2, there are two general X bracing patterns practical
enough to be considered for use with prestressed cable braces. These
two patterns are shown in Fig. 6.3. In the subassemblage models studied
in chapters 4 and 5 only Pattern 1 braces were analyzed. Similar
conclusions are drawn if the study is conducted using Pattern 2 braces.
If Pattern 2 bracing is used, additional braces and post-tensioning
connectors are needed over that required by use of Pattern 1 bracing;
however, the area required for each cable is less.
In Pattern I the prestressed cable braces are assumed to extend
from the beam column joint of the upper story to the center of the
135

Sheathd
estrand
(a) Stressang anchorage detais
A a C 0 Elick Iype in (mM) in (rm) in (m) In. (mM) in. (Mm)
, S-3 ,4 13"*) 6 (127) 1 (t,) it (130) 1 (tis]ES-7 E6-3 of (404) a (It?) 0 (180) is (40) &1 (,ill)
F.5-12 E6-7 to (46?) a (12) 10454 t (46?) 61 (1 21)
ES- 1 E- 12 22 (569) 7 (17) t0 (64) is (as?) $a 11237)
ES'31 ES- 19 27(0) ?(1?:) 11 (111) S011) 67(144838E5-55 E6-3 1 36 (914) 1 0 (2664) Is (467) 30o (its) IO To (frs
(b) Jacking detais
unit rang. in $heih lehon force. uri rangs In Sheath 1~n( force,no of mtsde dse kips (kN) no of Inside die kips (N)
strands in (mm) 0.7 Amf04 Strand. in. (rm) 0.7 A%.),
E5-3 1 1.26 (31) ? 7 (Us?) ES-3 I, Ie (30) 0to (240)
a I " (30) i(3e0) 140 (30) 1321 (641)
ES-4 a 103 (41) 110 (114) 10-4 4 200 (0) ia 1 (730)
ES-? 6 1 71 (44) 14405 (043) E6-7 & * *0 (6?) so 1(li)S 2.00 (60) 204 (000) 7 Its (1r) as7 1112")
E -12 1" (c6o) 23' 3 (026) E- 12 a I &(I1) 2I320 tIO1)M1 ISO (03) 3400 (1046) It 300 (70) 401.1 (ties)
ES- I S 12 3 (0) 700a (1071) EI- lB 13 226 (as) 42S (17 f)If 2 it (1) 6492 (2442) Is 2.1 t") 177.4 (240)
E5-22 32 26 (a1) spt (267) E6-22 Is 400(too) 804 (3446)2 2 0 36 8) 641 a (21) I2 400(100) 01 A (40 i)
E5-31 i2 3 " (00) 44 6 (266?) E-31 I s 4 " (1t4) 1042 (1I)8I 4 g I0) I a 2"IW at $00(lt*) 12710 51664)
if&-&& as 6490 (I) 1600 4 (7070) E-5S of 4 6(106) I0"4 11" $0)
(C) VSL 1/2 e.(13mniJ-270K I seres' (d VSL 0.6 m. (15nin)-270K E wes"
Fig. 6.2 The VSL multi-strand post tensioninq system [13]
136

A
PATR I PATR 2
SEE BRACING DETAIL I
SEE BRACING DETAIL 2
Fig. 6.3 Prestressed cable bracing patterns
137

spandrel beam of the lower story. This assumption carries with it
several design considerations which affect the feasibility of installing
cable braces using Pattern 1. A cross section of the prototype frame is
shown in Fig. 6.4. For the prototype frame shown, notice that the
spandrel beams are not flush with the face of the column. Any post-
tensioning connector attached to the center of the spandrel beam must
project a distance Z as shown in Fig. 6.4. Z is the distance from the
face of the spandrel beam to the plane of action for the prestressed
cables. Z is a measure of the eccentricity the spandrel beam-cable
brace connection would have to be designed for. In the case of the
prototype frame, this eccentricity will be in the neighborhood of 15 to
17 inches. Such a connection block would most likely be very bulky in
order to accommodate post-tensioning and terminating of tendons at this
location.
A more practical approach would be to limit post-tensioning points
to the beam-column joints as shown in Fig. 6.4. The post-tensioning
connectors shown are bolted to the face of the column and centered over
the centroid of the beam-column joint. All initial post-tensioning of
cables can take place at such post-tensioning connectors. Connectors
placed at the spandrel beam-cable brace Jo~rts could be of a sleeve type
that simply pass the tendons through to thL aext beam-column connector
prior to post-tensioning. After post-tensioning, such connections might
be clamped or grouted. Because of the impracticality of post-tensioning
tendons at the spandrel beam-cable brace joint for Pattern 1, it is
consequently not possible to specify different cable brace areas for
every story as in bracing schemes A and Al of Table 5.2.
138

COLUMN
POST TENSIONING
CONNECTOR
kz-
SPANDREL BEAM
FLOOR SLAB
FRAME SECTION
Fig. 6.4 Frame section showing a profile view of Pattern 2 Type B
post-tensioning connectors
139

Post-Tensioning Sequence. The analytical research presented thus
far begins with the post-tensioned cables already in place. Static
analysis of the braced frame with DRAIN-2D confirms that the additional
forces imposed by the prestressed cable braces do not yield any of the
members or joints of the original unstrengthened frame. However, this
may not be true during the installation and initial post-tensioning of
the cable brace system. Careful attention must be given to the post-
tensioning sequence for the bracing system. Simultaneous and or
incremental post-tensioning of several cables may be necessary in order
to avoid overstressing the structure during the retrofitting operation.
Out-Of-Plane Forces. Significant out-of-plane forces are imposed on
the frame with the installation of a prestressed cable brace system.
For the purpose of the present analytical study the assumption was made
that all forces associated with the retrofitted frame are in-plane. The
distances Zl and Z2 in Fig. 6.4 illustrate the incorrectness of this
assumption. Zl and Z2 are the distances between the planes of action
for the beam forces and the bracing system. The maximum distance Z2 can
be as high as 21 inches for the prototype frame. Such eccentricities
will impose torque on the frame columns. This problem will be
predominate during the post-tensioning operation on all bays; however,
it will persist on columns adjacent to unbraced bays even after post-
tensioning is completed. The magnitude of such out-of-plane forces must
be evaluated and considered with respect to the capacity of the frame to
carry these forces.
140

6.2 CCNCEPTS FOR POST-TENSIONING CONNECTOR DESIGNS
In this section some concepts for post-tensioning connector blocks
and their installation are discussed. The sketches presented are to be
taken as conceptual and not final designs. Number, location, size, and
spacing of bolts as well as need for stiffeners has not been considered.
Connection blocks for Patterns 1 and 2 of Fig. 6.3 were considered.
Bracing Detail 1 for bracing Pattern 1 is shown in Fig. 6.5. In
general three distinct connector types will be required for this bracing
scheme. Types A and B connectors are located at the slab level of the
beam column joints. These connectors must be capable of anchoring two
or more tendons stressed to 0.5P The type A connector is for use ony.
columns adjacent to unbraced bays. Type B connectors are used on
columns with two or more adjacent bays braced. Type C connectors are
located at spandrel beam-cable brace joints. As discussed in Sec. 6.1,
type C connectors are used to clamp the cable braces in place after the
completion of post-tensioning operations.
Details for both type A and B connectors are conceptually
illustrated in Fig. 6.6. The steel base plate is located over the
centroid of the beam column joint. The plate would probably be bolted
to the column. It may be possible to drill completely through the
column, fix a base plate on the inside face of the beam-column joint as
well and prestress the bolts to ensure a good connection. The cable
anchor blocks are fixed to the steel base plate either by bolting or
welding. The cable terminations must be secured or epoxied in some
manner to prevent possible unseating during cyclic loading.
141

BRACING DETAIL IPATTERN I A
level
I TYPEABCONNECTION
A i
Fiq. 6.5 PEtrse cal bracingIO deai7
f loor sla

Of Column
TYPE A
CONNECTION
PATTERN I
83 d2 8
TYPE S
F\ /F4 CONNECTION
Fic. 6.6 Conceptual sketch of Pattern 1 Tyne A and B connectors
143

In the type A connection, the prestressed cable force passes
concentrically through the beam column joint as assumed in the computer
model of the analytical study. Since both Fl and F2 are tensile forces,
there is a net horizontal force (horizontal component of Fl + F2) which
must be resisted by the beam-column joint. As pointed out in the
previous section, the eccentricity of this force may be as high as 21
inches for the prototype frame. The designer must look at whether or
not the frame can handle the combined torque and bending. If the torque
is too high, it may be feasible to attach prestressed cable braces to
both the inside and outside faces of the frame, thus eliminating the
torque and reducing the problem to one of pure bending. Attaching cable
braces to the inside face of the frame will require cutting cable
troughs in the floor slabs. This is necessary to pass the cables from
one story to the other. With modern concrete cutting and coring
equipment, placing cable braces on both sides of the frame is quite
feasible. The labor involved, inconvenience to building occupants, and
aesthetics, however, may eliminate cable braces as a desirable
retrofitting scheme.
In a type B connection, forces do not pass exactly through the
centroid of the beam-column joint as shown. If braces Bl, B2, B3, and
B4 are all the same size and carry the same prestress force, the joint
will be in equilibrium under static load. If Bl, B2, B3, and B4 are not
the same, the unbalanced force will have to be carried by the frame.
The cable termination points are located such that the moment FI*F4*dl/2
should be roughly canceled by the moment F2*F3*d2/2. The type B
connection does not experience the same combined torque and bending
144

forces at rest that the type A connection does, except possibly duriig
post-tensioning operations and cyclic loading. The possibility of
overstressing during post-tensioning can be reduced or eliminated by
carefully considering the post-tensioning sequence.
Sizing type A and type B anchor blocks will be fairly straight
forward. Under static load the anchor blocks for both type A and B
connections experience primarily shear force; however, the height of the
blocks may be great enough that bending may become a concern. The cable
spacings, dl and d2, are dependent on the clearance requirements of the
center hole jacks used to post-tension the cables as well as minimum
spacing and edge distance requirements.
The effect cable brace orientation has on design of type A and type
B connectors is shown in Figs. 6.7 and 6.8. The cable brace areas
required by Pattern 2 bracing schemes are significantly less than those
required by Pattern I bracing schemes. As a consequence, the forces
seen by the connectors in Fig. 6.8 are correspondingly less than the
connectors of Fig. 6.6. This fact may significantly influence the
decision of which bracing pattern is ultimately chosen for the
retrofitting scheme.
145

BRACING DETAIL 2
PATTERN 2 Blevel
5
Fi. 6.7 rocote cab
146
I TTYPEAB
I I 3
I , JB
Fig 6. Prsrseal baigdtiI146
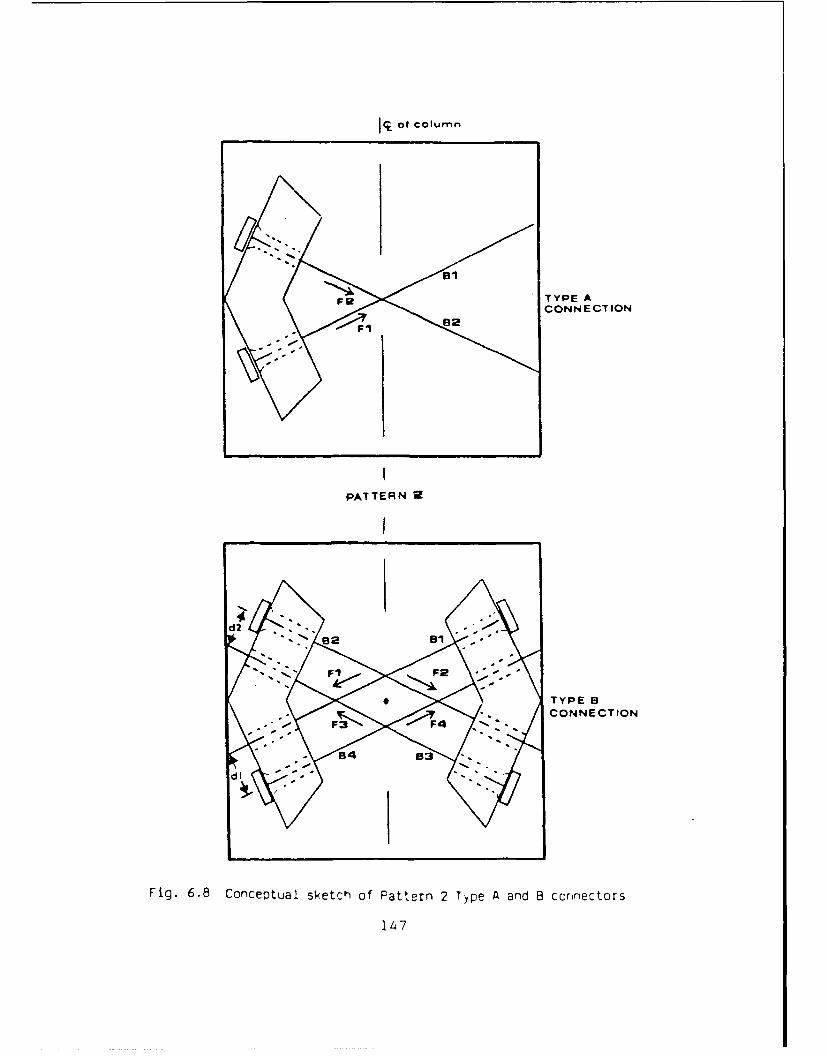
of column
FIR TYPE A
CONNECTION
PATTERN 2
TYPE B
CONNECTION
Fig. 6.8 Conceptual sketch Of Pattern 2 Type A and B connectors
147

CHAPTER 7
SUMMARY AND CONCLUSIONS
7.1 SUMMARY
The objective of this thesis is to study analytically the
effectiveness of prestressed cable bracing systems in conjunction with
beam alteration as a viable retrofit strengthening scheme for
seismically inadequate structures. Structures which are likely
candidates for seismic retrofitting are inadequate for two primary
reasons: 1) their lateral load carrying capacity is insufficient to
sustain seismic loading specified in current building codes and/or,
2) the unstrengthened structures feature an undesirable failure
mechanism such as failure of the columns in shear.
The prototype frame studied in this thesis is typical a class of
building commonly constructed during the 50's and 60's in California and
elsewhere. !he reinforced concrete prototype frame features deep
spandrel beams and short columns. The structure is six stories high and
eleven bays long. The external frames are adequate to carry gravity
loads but are deficient in lateral capacity. The prototype frame's
failure mechanism is non-ductile and is dominated by shear failure of
the reinforced concrete short columns.
The analytical study was carried out using DRAIN-2D. DRAIN-2D is a
general purpose computer program for the dynamic analysis of inelastic
plane frame structures. The current version of the program features
element EL7, a reinforced concrete element with degrading stiffness.
With EL7 one is able to model the negative lateral stiffness exhibited
148
by a reinforced concrete short column once its shear capacity has been
reached. An option has been added to the program which utilizes the
program's existing dynamic analysis algorithm to perform static
incremental displacement analysis.
In the first part of the study the effectiveness of prestressed
cable braces applied to a single story subassemblage of the prototype
frame was re-examined. The concept of beam alteration or beam weakening
was then introduced. A single story subassemblage was studied under
several beam alteration schemes. The affect of systematically weakening
the spandrel beams on the frame's failure mechanism was determined. An
optimum beam alteration scheme was selected for the subassemblage. The
response of unstrengthened, braced-unaltered and braced-altered
subassemblages were studied under both monotonic and cyclic loading.
The second part of this research expanded on the first part by
focusing on the behavior of a six story subassemblage of the prototype
frame to retrofit strengthening. The remaining four levels of the
prototype frame were designed in accordance with building codes and
design procedures in common use when such structures were originally
constructed.
The response of unstrengthened, braced-unaltered, and braced-
altered unique single story subassemblages were studied and compared to
the response predicted by a six story subassemblage. The influence of
changing brace areas at various elevations of the frame was evaluated by
contrasting the response of a generic subassemblage to the response
obtained from analyzing a six story subassemblage retrofitted with
different brace area schemes (with and without beam alteration). The
149

retrofit schemes studied were also evaluated with respect to their
adequacy for meeting current building code seismic strength
requirements.
The third part of this thesis focused on examination of some
practical aspects of designing and installing prestressed cable bracing
systems. Several design considerations were introduced which must be
addressed to practically implement prestressed cable bracing. Finally,
conceptual connection details were presented which illustrated how
prestressed cable braces might be attached to a structure in a
retrofitting operation.
7.2 CONCLUSIONS
The following conclusions can be drawn from this study of
retrofitting seismically deficient reinforced concrete frames with
prestressed cable bracing systems and beam alteration:
1) A prestressed cable bracing system applied to the weak column-
strong beam frame studied is effective in increasing lateral strength.
Following either the ultimate strength or serviceability design
approach, any reasonable desired strength can be attained by choosing an
appropriate design ratio n for use in determining cable areas required.
2) The use of prestressed cable bracing alone on the prototype
frame improves the ductility of the strengthened system (assuming the
columns can maintain gravity load capacity). The additional ductility
is solely attributable to the bracing, as the frame's failure mechanism
is unaltered.
150

3) Beam alteration is an effective means of altering the failure
mechanism of the original frame studied. Failure can be shifted from
the columns to the beams by selectively reducing the strength and
stiffness of the beams. It was determined that the moment capacity of
the prototype spandrel beams at midspan, as well as shear capacity at
the spandrel ends, were sufficient to carry gravity loads even if all
primary positive and negative reinforcement is severed. As a result, it
is possible to weaken the beams sufficiently to ensure that plastic
hinges form in the beams prior to the columns reaching their ultimate
shear capacity. Ultimate strength of the original frame is greatly
reduced by weakening the beams. The improvement in frame ductility,
however, is dramatically improved.
4) The cyclic behavior of the prototype frame is dramatically
improved with use of beam weakening. Evaluation of the hysteretic
behavior of the original and altered frames indicates the altered frame
will dissipate significantly more energy during a seismic event.
5) The consequential reduction in frame lateral strength resulting
from beam weakening can be restored by supplemental use of prestressed
cable braces. Combination of prestressed cable bracing and beam
alteration results in dramatic improvements in strength, ductility, and
failure mechanism.
6) For a given cable brace area, ultimate lateral strength
attained by the retrofitted prototype frame is significantly increased
if beam weakening is part of the retrofitting scheme. The trade off is
that the increased ultimate strength is achieved at a much greater
drift. The strength attained with the prestressed cable brace/beam
151
alteration scheme can be made to equal that attained by the bracing only
scheme at lower drift levels by increasing the cable brace area. For
the retrofit scheme studied, a 43% increase in cable brace area resulted
in a 25% increase in stiffness in the retrofitted system.
7) For symmetric reinforced concrete frame structures with uniform
bracing in every bay, global frame response can be predicted accurately
by analysis of unique single story subassemblages established for each
story, as well as by multi-story subassemblage models.
8) The value of using a single generic single-story subassemblage
to represent the global behavior of a frame to retrofit strengthening is
somewhat limited. Comparable results with analysis of a multi-story
subassemblage can be obtained for a bracing scheme consisting of uniform
bracing in all bays and cable brace size determined uniquely for each
story using a constant design ratio n. For cases utilizing constant
brace areas over several stories, unique single story subassemblages for
each story in the frame should be developed.
9) Any practical retrofitting scheme will be based most likely on
two types of objectives. The primary objective will likely be to
increase the lateral strength capacity of the original frame at each
story to that required to resist current building code design loads.
The second objective might be a serviceability, or drift criteria. Such
a criteria might be to prevent shear failure of the columns from
occurring at low drifts as in the prototype frame studied. To meet such
objectives, the required design ratio n can be established for each
individual story. In the case the prototype frame studied, higher
152

design strength ratios are required for the first three stories than for
the upper three stories.
10) Actual application of practical prestressed cable bracing
systems introduces several design and installation considerations not
investigated in this analytical study. Some of these considerations are
briefly discussed below.
a) Location of post-tensioning anchors. The magnitude of the
prestressing forces applied to the cable braces may introduce
excessive internal stresses to the original frame. For the
prototype frame examined in this study, the beam-column joints
are more able to resist unbalanced prestress forces than
connection points located at the midspan of the spandrel
beams.
b) Post-tensioning sequence. Inattention to the post-tensioning
sequence of the cable braces can also introduce excessive
internal stresses to the original frame. The forces
introduced at a typical interior joint by prestressed cable
braces will balance or nearly balance each other after
installation. Any resulting unbalance should be small and is
transferred to the concrete frame. If post-tensioning of
cables terminating at the joint is not executed either
simultaneously or incrementally, the resulting unbalanced
force, however temporary, is transferred directly to the
concrete frame. Care must be taken to eliminate or minimize
such situations. If not avoidable one must ensure that such
induced stresses do not fail the concrete frame.
153

c) Out-of-plane forces. In the prototype frame studied the face
of the columns and the spandrel beams are not flush.
Installation of the bracing system therefore introduces
additional out-of-plane forces to the system. Such
eccentricities impose torque in addition to bending on the
frame columns. This problem is predominant during the post-
tensioning operation on all bays; however, it will persist on
columns adjacent to unbraced bays even after post-tensioning
is complete. The magnitude of such out-of-plane forces must
be evaluated and considered with respect to the capacity of
the frame to carry these forces.
7.3 RECOMMENDATIONS FOR FUTURE RESEARCH
EXPERIMNTAL RESEARCH: Experimental tests using prestressed cable
braces and beam alteration are needed to verify the analytical
conclusions made in this study. A single story subassemblage such as
those developed in this study for the prototype frame could form the
basis for an experimental study.
The most challenging task to be encountered in setting up an
experimental study will lie in designing and fabricating the post-
tensioning anchor blocks. The connections in the bracing system must
not be the weak link in the system under cyclic loading.
Experimental research is necessary to confirm the effectiveness of
improving the seismic performance of a prestressed cable braced frame
with weak columns by weakening the beams. Various possible weakening
154
techniques including sawing and coring should be investigated.
Guidelines for the design of weakening schemes should be developed.
ANALYTICAL RESEARCH: The research conducted in this study advances
knowledge of prestressed cable bracing system behavior in conjunction
with beam alteration. Analysis was limited to inelastic monotonic and
cyclic incremental displacement analysis. The next step is to perform a
dynamic analysis as well to assess the behavior of the retrofitted
system to a more realistic loading scenario. A dynamic analysis may
reveal some unforeseen problems not encountered in the static
incremental analysis.
The global behavior of the prototype frame was studied with respect
to vertical distribution of cable brace area. It would be interesting
to expand the model to include the entire frame in order to study the
effect of horizontal spacial distribution of prestressed cable braces.
Such a study should be performed using a dynamic analysis. Further
analytical work needs to focus on developing design guidelines for
developing practical prestressed cable area and beam weakening schemes
required to meet the designer's retrofitting objectives.
DRAIN-2D should be revised to increase its usefulness as a research
tool. The program is written in out-dated FORTRAN language and is
configured to run on main frame computer systems of vintage 1970 type.
The numerous changes and additions made to the program by various users
over the years has made troubleshooting the version of the program used
for this study a nightmare. A project could be undertaken to rewrite
the program, from the ground up, with moderti FORTRAN language and state-
of-the-art data storage and processing techniques. The rewritten
155

program should be well documented with a revised user's manual format
and adequate comment statements within the program itself.
156

REFERENCES
1. Kanaan, A. and Powell, G., "DRAIN-2D, A General Purpose ComputerProgram For Dynamic Analysis Of Inelastic Plane Structures WithUser's Guide And Supplement," Earthquake Engineering ResearchCenter, University of California RePort No. EERC 73-6 and 73-22,August 1975.
2. Masroor, T., "Seismic Strengthening Of Reinforced ConcreteStructures Using Prestressed Cable Bracing System," unpublishedMasters thesis , The University of Oklahoma, May 1990.
3. Badoux, M., "Seismic Retrofitting Of Reinforced Concrete StructuresWith Steel Bracing Systems," unpublished Ph.D. dissertation, TheUniversity of Texas at Austin, May 1987.
4. Tang, X. and Goel, S., "DRAIN-2DM Technical Notes And User'sGuide," Reasearch ReDort UMCE 88-1, Department of CivilEngineering, University of Michigan at Ann Arbor, January 1988.
5. Umehara, H., and Jirsa, J., "Shear Strength and Deterioration ofShort Reinforced Concrete Columns under Cyclic Deformations,"PMFSEL Report No. 82-3, The University of Texas at Austin, July1982.
6. Woodward, K., and Jirsa, J., "Influence of Reinforcement on theReinforced Concrete Short Column Lateral Resistance," ASCE Journalof Structural Engineering, Vol. 110, No. 1, January 1984.
7. Bush, T., "Seismic Strengthening of a Reinforced Concrete Frame,"unpublished Ph.D. dissertation, The University of Texas at Austin,May 1987.
8. Sugano, S., and Fujimura, M., "Seismic Strengthening of ExistingReinforced Concrete Buildings," Proceedings of the Seventh WorldConference on Earthauake Enzineerin , Part I, Vol. 4, Istanbul,Turkey, 1980, pp. 449-456.
9. American Concrete Institute, Building Code Reguirements forReinforced Concrete (ACI 318-89), Detroit, MI, 1989.
10. American Concrete Institute, "ACI Building Code," Journal of theAmerican Concrete Institute, Detroit, MI, April 1951.
11. American Concrete Institute, Reinforced Concrete Design Handbook,2nd Edition, American Concrete Institute, Detroit, MI, 1955.
12. Pacific Coast Building Officials Conference, Uniform Building Code1955 Edition, Volume 3, Los Angeles, CA, 1955.
157

13. Collins, M. and Mitchell, D., Prestressed Concrete Structures,Prentice Hall, Englewood Cliffs, NJ 07632, 1991.
14. Keshavarzian, M., Schnobrich, W.C., Analytical Models for theNonlinear Seismic Analysis of Reinforced Concrete Structures,"Engineering Structures, 1985, Vol. 7.
15. International Conference Of Building Officials, Uniform BuildingCode, 1988 Edition, Whittier, CA, 1988.
158

APPENDIX A
REVISED USER'S GUIDE FOR DRAIN-2D MAIN PROGRAM
WITH ELEMENTS EL7 AND ELl(m)
DRAIN-2D is a general purpose computer program for dynamic
response analysis of planar inelastic structures under earthquake
excitation. The program was originally developed by A. E. Kanaan and G.
H. Powell in 1972 at the University of California at Berkeley [1]. The
program has undergone several expansions and modifications since 1975 by
various users at the University of Michigan at Ann Arbor [4], University
of Texas at Austin [3], and the University of Oklahoma [2].
This appendix contains a complete user's guide for the program
version used in this study. Data input specifications are given for
elements EL7, reinforced concrete element with degrading stiffness, and
ELl(m), truss element modified to model a prestressed cable brace. The
reader is referred to the original user's manual found in reference [1]
for data input instructions for other elements in the program library
not used in this study.
INPUT DATA
The following input cards define the problem to be solved. Consistent
units must be used throughout.
A. PROBLEM INITIATION AND TITLE
CARD A: Problem Initiation And Title (A5,3X,18A4). One card required.
159

Columns I - 5: Type "START"
6 - 8: Leave blank
16 - 80: Problem title (to be printed with output)
B: STRUCTURE GEOMETRY INFORMATION
CARD Bl: Control Information (915,110). One card required.
Columns 1 - 5: (NJTS) Number of nodes in the structure.
6 - 10: (NCONJT) Number of "control nodes" for which
coordinates are specified directly. Equals number
of B2 cards used.
11 - 15: (NCDJT) Number of B3 node coordinate generation
cards used.
16 - 20: (NCDDOF) Number of B4 cards used to specify nodes
with zero displacements.
21 - 25: (NCDDIS) Number of B5 cards used to specify nodes
with identical displacements.
26 - 30: (NCDMS) Number of B6 cards used to specify EITHER
lumped masses at the nodes if performing a dynamic
analysis OR static loads or displacements at the
nodes if performing a static incremental analysis.
31 - 35: (NELGR) Number of different element types used to
describe the structure. See section E.
36 - 40: (KnA.TA) Data checking code. Leave blank or type a 0
to execute the program. Type 1 for a data checking
run only. If the number of elements used in the
structure does not exceed one, -1 can be typed to
execute the program in core if desired.
160

41 - 45: (KODST) Structure stiffness storage code. A
duplicate structural stiffness matrix must be
retained and periodically updated. Leave blank or
punch zero if this matrix is to be retained in the
core. Thii will reduce input/output cost. Type 1
if the matrix is to be saved on scratch stor-ge.
46 - 55: (TST) Blank COMMON length is assumed. If 0 or
blank the value compiled into the program will be
used. See discussion of capacity limitations in
reference (1).
CARD B2: Control Node Coordinates (15,2F10.0). One card for each
control node. See NOTE 1 for more information.
Columns I - 5: (IJT) Node number, in any sequence.
6 - 15: X(IJT) X coordinate of node.
16 - 25: Y(IJT) Y coordinate of node.
CARD B3: Commands For Straight Line Generation Of Node Coordinates
(415,FlU.O). One card required for each generation command. Omit if
there are no generation commands. See Note 1 for explanation.
Columns 1 - 5: (IJT) Number of the node at the beginning of the
line to b- generated.
6 - 10: (JJT) Number of the node at the end of the line to
be generated.
11 - 15: (NJT) Number of noes to be generated along the
line.
161

16 - 20: (KDIF) Node number difference (constant value)
between any two successive nodes on the line. If
blank or 0, assumed to be equal to 1.
21 - 30: (PROP) Spacing between successive nodes on the
generated line. If blank or 0, the nodes are
automatically spaced uniformly along the generation
line. If greater than 1.0, input value is assumed
to be actual spacing. If less than 1, assumed to
be the actual spacing divided by the length of the
generation line.
CARD B4: Commands For Nodes With Zero Displacements (615). One line
required for each command. Omit if no nodes are constrained to have
zero displacements. See NOTE 2 for more information.
Columns 1 - 5: (IJT) Node number, or number of first node in a
series of nodes covered by this command.
6 - 10: (KDOF(l)) Code for X displacement. Type I if X iz
constrained to zero, otherwise leave blAnk or typ.
0.
11 - 15: (KDOF(2)) Code for Y displacement.
16 - 20: (KDOF(3)) Code for rotation.
21 - 25: (JJT) Number of last node in the series. Leave
blank if this command covers only a single node.
26 - 30: Node number difference (constant value) between
successive nodes in the series. If blank or 0, the
program assumes difference is 1.
162

CARD B5: Commands for Nodes with Identical Displacements (1615). One
line required for each command. Omit if no nodes are constrained to
have identical displacements. See NOTE 3 for more information.
Columns 1 - 5: (KODOF) Displacement code as follows:
Type 1 for X displacement.
Type 2 for Y displacement.
Type 3 for rotation.
6 - 10: (NJT) Number of nodes covered by this command.
Maximum is 14. See NOTE 3 for procedure when more
than 14 nodes have identical displacements.
11 - 80: (IJOINT(I)) List of nodes in increasing numerical
order. Up to 14 fields, 15 each.
CARD B6: Commands For Lumped Masses At The Nodes If Performing A
Dynamic Analysis (15,3FI0.O,215,FlO.O) OR Commands For Loads Or
Displacements At The Nodes If Performing A Static Incremental Analysis
(I5,3FI0.0,215,FlO.0). One line required for each command.
Columns 1 - 5: (IJT) Node number, or number of first node in a
series of nodes covered by this command.
6 - 15: (FMAS(1))
If performing a dynamic analysis:
Mass associated with X displacement (may be zero)
If performing a static incremental analysis:
Portion of load or displacement associated with the
X direction.
163
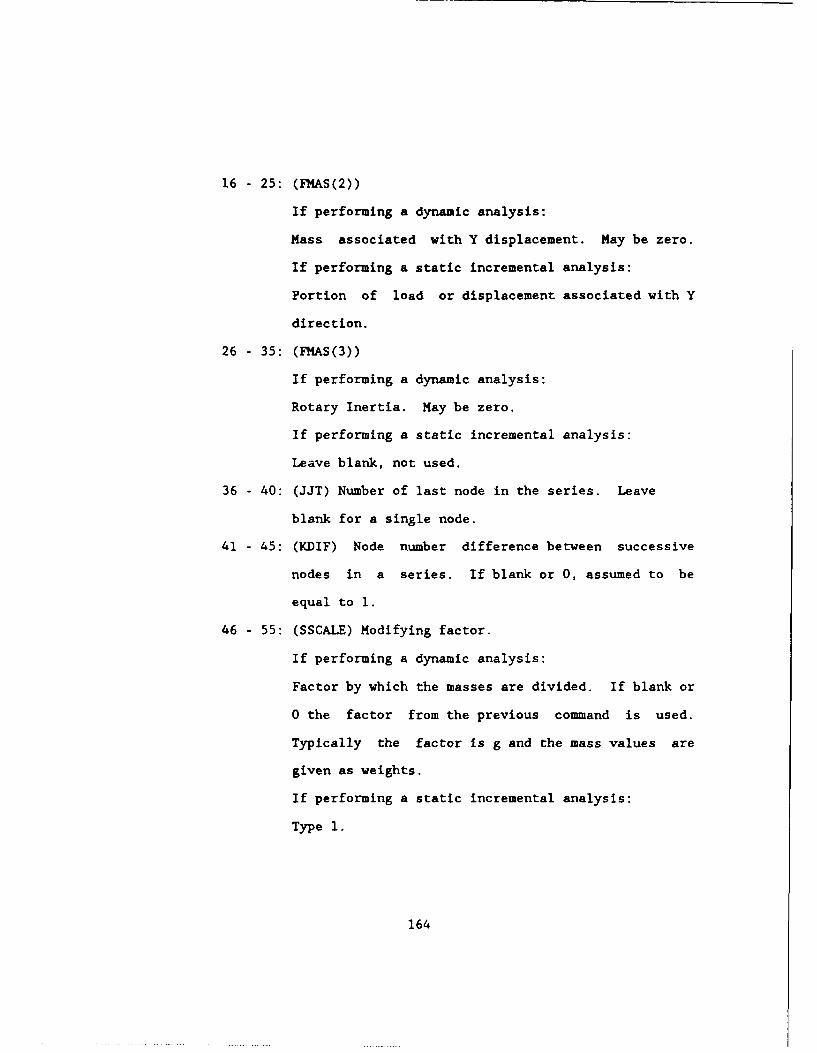
16 - 25: (FMAS(2))
If performing a dynamic analysis:
Mass associated with Y displacement. May be zero.
If performing a static incremental analysis:
Portion of load or displacement associated with Y
direction.
26 - 35: (FMAS(3))
If performing a dynamic analysis:
Rotary Inertia. May be zero.
If performing a static incremental analysis:
Leave blank, not used.
36 - 40: (JJT) Number of last node in the series. Leave
blank for a single node.
41 - 45: (KDIF) Node number difference between successive
nodes in a series. If blank or 0, assumed to be
equal to 1.
46 - 55: (SSCALE) Modifying factor.
If performing a dynamic analysis:
Factor by which the masses are divided. If blank or
0 the factor from the previous command is used.
Typically the factor is g and the mass values are
given as weights.
If performing a static incremental analysis:
Type 1.
164
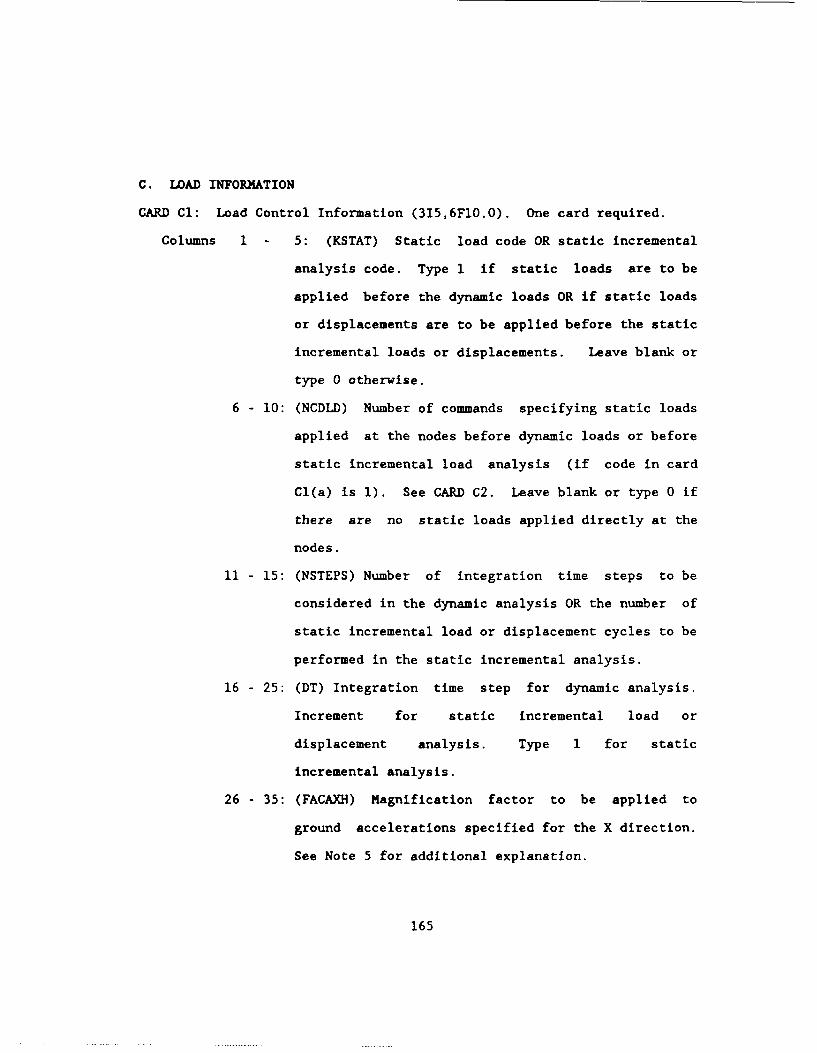
C. LOAD INFORMATION
CARD Cl: Load Control Information (315,6FI0.0). One card required.
Columns 1 - 5: (KSTAT) Static load code OR static incremental
analysis code. Type 1 if static loads are to be
applied before the dynamic loads OR if static loads
or displacements are to be applied before the static
incremental loads or displacements. Leave blank or
type 0 otherwise.
6 - 10: (NCDLD) Number of commands specifying static loads
applied at the nodes before dynamic loads or before
static incremental load analysis (if code in card
Cl(a) is 1). See CARD C2. Leave blank or type 0 if
there are no static loads applied directly at the
nodes.
11 - 15: (NSTEPS) Number of integration time steps to be
considered in the dynamic analysis OR the number of
static incremental load or displacement cycles to be
performed in the static incremental analysis.
16 - 25: (DT) Integration time step for dynamic analysis.
Increment for static incremental load or
displacement analysis. Type 1 for static
incremental analysis.
26 - 35: (FACAXH) Magnification factor to be applied to
ground accelerations specified for the X direction.
See Note 5 for additional explanation.
165

36 - 45: (FACTMH) Magnification factor to be applied to time
scale of the record specified for the X direction.
See Note 5.
46 - 55: (FACAXV) Magnification factor for ground
accelerations in the Y direction.
56 - 65: (FACTMV) Magnification factor for time scale in the
Y direction.
66 - 75: (DISMAX) Absolute value of the maximum displacement
permitted before the structure can be assumed to
have collapsed. The execution is terminated if this
value is exceeded at any step. If zero or blank,
value is assumed to be very high.
CARD Cl(a). Static Incremental Analysis Information (format free,
separate with commas).
Columns NA: (MSTAT) Static incremental load analysis code. Type
I if analysis is required. Otherwise leave blank or
type zero.
NA: (KSTDS) Static incremental displacement analysis
code. Type I if analysis is required. Otherwise
leave blank or type 0.
NA: (NCDDS) Number o. commands specifying static
displacements applied at the nodes before cyclic
incremental displacement analysis. Leave blank or
type 0 if there are no displacements applied. See
CARD C2.
166

CARD C2: Commands For Static Loads Applied Directly At Nodes OR
Commands For Static Loads Or Displacements Applied Directly at Nodes for
Static Incremental Analysis (15,3FI0.O,215). One line required for each
command. Omit if there are no static loads applied directly at the
nodes (if static load code is 0 in card Cl). Omit if there are no
static loads or displacements applied directly at the nodes before the
incremental analysis (if the static incremental analysis commands are 0
in card Cl(a).
Columns 1 - 5: (IJT) Node number, or number of first node in a
series of nodes covered by this command.
6 - 15: (FLD(l)) Load in the X direction, the same on all
nodes in the series.
16 - 25: (FLD(2)) Load in Y direction, the same on all nodes
in the series.
26 - 35: (FLD(3)) Moment load (right hand screw rule about
the Z axis - hence counterclockwise positive as
normally viewed).
35 - 40: (IJT) Number of last node in series. Leave blank
for a single node.
41 - 45: (KDIF) Node number difference (constant) between
successive nodes in series. If blank or 0, value
assumed by the program is 0.
Note: A single node may appear in two or more commands if desired. In
such a case, the total loads applied at the node will be the sum
of the loads from the separate commands.
167
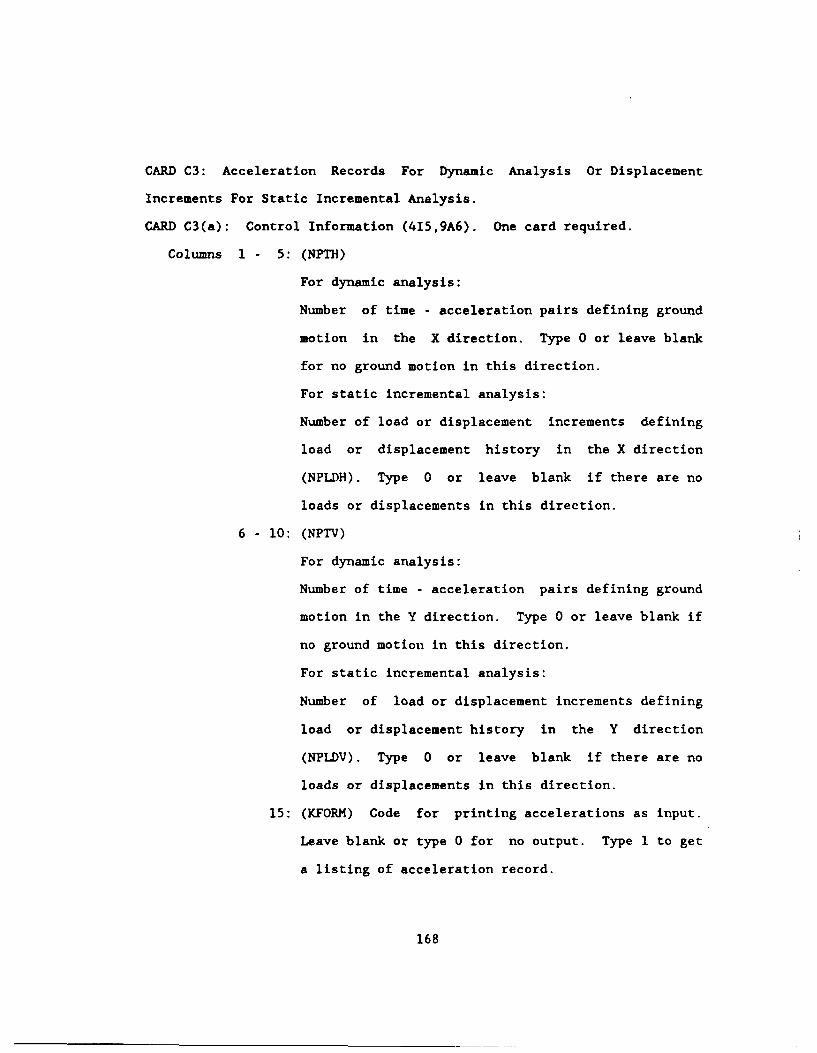
CARD C3: Acceleration Records For Dynamic Analysis Or Displacement
Increments For Static Incremental Analysis.
CARD C3(a): Control Information (415,9A6). One card required.
Columns 1 - 5: (NPTH)
For dynamic analysis:
Number of time - acceleration pairs defining ground
motion in the X direction. Type 0 or leave blank
for no ground motion in this direction.
For static incremental analysis:
Number of load or displacement increments defining
load or displacement history in the X direction
(NPLDH). Type 0 or leave blank if there are no
loads or displacements in this direction.
6 10: (NPTV)
For dynamic analysis:
Number of time - acceleration pairs defining ground
motion in the Y direction. Type 0 or leave blank if
no ground motion in this direction.
For static incremental analysis:
Number of load or displacement increments defining
load or displacement history in the Y direction
(NPLDV). Type 0 or leave blank if there are no
loads or displacements in this direction.
15: (KFORM) Code for printing accelerations as input.
Leave blank or type 0 for no output. Type 1 to get
a listing of acceleration record.
168

20: Leave blank. Not used.
21 - 80: Title to identify records, to be printed with
output.
CARD C3(b): Ground Acceleration Time History In X Direction For Dynamic
Analysis Or Load / Displacement History For Static Incremental Analysis
(12F6.0).
For Dynamic Analysis:
As many cards as needed to specify NPTH time - acceleration
pairs, 6 pairs to a card, assumed to be in acceleration units
(not multiples of the acceleration due to gravity). Omit if
NPTH equals 0. Note that both the acceleration and time
scales may be scaled if desired (see CARD Cl). If the record
is input in terms of the acceleration due to gravity, the
accelerations must be multiplied by g to convert to
acceleration units.
For Static Incremental Analysis:
As many lines as needed to specify NPLDH, number of increment
- load / displacement pairs, 6 pairs to a line. Omit if NPLDH
equals zero. The first specified step number must be zero,
and the first load or displacement must be zero.
CARD C3(c): Ground Acceleration Time History In Y Direction For Dynamic
Analysis Or Load / Displacement History For Static Incremental Analysis
(12F6.0).
169

For Dynamic Analysis:
As many cards as needed to specify NPTV time - acceleration
pairs. Omit if NPTV equals zero.
For Static Incremental Analysis:
As many lines as needed to specify NPLDV number of steps -
incremental loads / displacement pairs, 6 pairs to a line.
Omit if NPLDV equals zero. The first specified step number
must be zero, and the first load or displacement must be zero.
CARD C4: DAMPING INFORMATION (4El0.0). One card. Refer to reference 4
for explanation.
Columns 1 - 10: Mass proportional damping factor, alpha.
11 - 20: Tangent stiffness proportion factor, beta.
21 - 30: Horizontal stiffness proportion factor, beta o.
31 - 40: Structural damping factor, delta.
D. TIME HISTORY OUTPUT SPECIFICATION
Printed time histories of nodal displacements and element
results may be obtained if desired. The printout is bulky and should
not normally be requested.
CARD D1: Control Information (1315). One card required.
Columns 1 - 5: (IPJ) Time interval for printout of nodal
displacement time histories, expressed as a multiple
of the time step delta t. Leave blank for no
printout. The nodes for which the time histories
are required are specified in CARDS D2, D3 and D4.
170

6 - 10: Time interval for printout of time histories of
element results, expressed as a multiple of the time
step delta t. Leave blank for no printout. The
elements for which time histories are required are
specified in CARD E.
11 - 15: (IENV) Output interval for results envelopes.
16 - 20: (NHOUT) Number of nodes (NHOUT) for which X
displacement time histories are required.
21 - 25: (NVOUT) Number of nodes (NVOUT) for which Y
displacement time histories are required.
26 - 30: (NROUT) Number of nodes (NROUT) for which rotation
time histories are required.
Note: See program for additional input data required for more involved
printouts.
CARD D2: List Of Nodes For X Displacement Time Histories (1015). As
many cards as needed to specify NHOUT node numbers, typed ten to a card.
Omit if NHOUT equals 0.
CARD D3: List Of Nodes For Y Displacement Time Histories (1015). As
many cards as needed to specify NVOUT node numbers, typed ten to a card.
Omit if NVOUT equals 0.
CARD D4: List Of Nodes For Rotation Time Histories (1015). As many
cards as needed to specify NROUT node numbers, typed ten to a card.
Omit if NROUT equals 0.
171

CARD D5: List Of Pairs Of Nodes For Relative X Displacement History
(1015).
CARD D6: List Of Pairs Of Nodes For Relative Y Displacement History
(1015).
E. ELEMENT SPECIFICATION
For input and output, the elements must be divided into
groups. All elements in any group must be of the same type, and
typically all the elements of a single type will be included in a single
group. However, elements of the same type may be subdivided into
separate groups if desired.
Element groups may be input in any convenient sequence.
Within any group, the elements must be numbered in sequence beginning
with 1.
EL?. BEAM ELEMENT WITH NEGATIVE DEGRADING STIFFNESS. See reference 1
for complete description of the element. Number of words of information
per element - 181.
CARD E7(a): Control Information For Group (715). One line required.
Columns 5: (I) Type 6 to indicate the group consists of EL7
elements.
6 - 10: Number of elements in the group.
11 - 15: Number of different element stiffness types (maximum
of 40). See CARD E7(b).
172

16 - 20: Number of different end eccentricity types (maximum
of 15). See CARD E7(c).
21 - 25: Number of different yield moment values for cross
sections (maximum of 40). See CARD E7(d).
26 - 30: Number of different fixed end force patterns
(maximum of 34). See CARD E7(e).
31 - 35: Number of different initial element force patterns
(maximum of 30). See CARD E7(f).
CARD E7(b): Stiffness Types. Three lines for each stiffness type.
LINE 1: Beam Properties Data (I5,3F10.0,3F5.0).
Columns 1 - 5: (I) Stiffness type number, in sequence beginning
with 1.
6 - 15: (FTYP(I,1)) Reference flexural stiffness, EI.
16 - 25: (FTYP(I,2)) Reference axial stiffness, EA.
26 - 35: (FTYP(I,3)) Effective shear stiffness, GA. If blank
or 0, shear deformations are neglected.
36 - 40: (FTYP(I,4)) Flexural stiffness factor Kii.
41 - 45: (FTYP(I,5)) Flexural stiffness factor Kjj.
46 - 50: (FTYP(I,6)) Flexural stiffness factor Kij.
LINE 2: Hinge Stiffness Properties Data (15,6F10.0). Refer to Fig.
3.10.
Columns 1 - 5: Stiffness type number, in sequence beginning with 1
and corresponding to the stiffness type number on
the preceding Beam Properties Li.e.
6 - 15: Stiffness ratio of branch AB in proportion to
the initial stiffness OA of the moment - rotation
173

relationship for inelastic - flexure at node i. If
a non zero hinge stiffness is specified for node i
on LINE 3, columns 6-15, then this ratio wili apply
directly to the hinge moment - rotation relationship
or cantilever P-delta relationship.
16 - 25: Stiffness ratio of branch BC in proportion to
initial stiffness OA of the moment - rotation
relationship for inelastic - flexure at node i.
Same for branch AB, a zero or nonzero hinge
stiffness for node i on LINE 3, column 6-15 will
control whether this ratio is directly applied to
the hinge alone or to the beam as a whole. For
column negative stiffness this value must be input
as negative.
26 35: Stiffness ratio of branch CD in proportion to
initial stiffness OA of the moment - rotation
relationship for the inelastic - flexure at node i.
Same as for branch AB, a zero or non zero hinge
stiffness for node i on LINE 3, columns 6-15 will
control whether this ratio is directly applied to
the hinge alone or to the beam as a whole. For
negative stiffness this value must be input as
negative.
36 45: Stiffness ratio of branch AB in proportion to
initial stiffness OA of the moment - rotation
174

relationship for inelastic - flexure at node J. If
a non zero hinge stiffness is specified for node j
on LINE 3, columns 16-25, then this ratio will apply
directly to the hinge moment - rotation relationship
or cantilever P-delta relationship.
46 55: Stiffness ratio of branch BC in proportion to
initial stiffness OA of the moment - rotation
relationship for inelastic - flexure at node j.
Same for branch AB, a zero or nonzero hinge
stlifness for node j on LINE 3, column 16-25 will
control whether this ratio is directly applied to
the hinge alone or to the beam as a whole. For
column negative stiffness this value must be input
as negative.
56 - 65: Stiffness ratio of branch CD in proportion to
initial stiffness OA of the moment - rotation
relationship for the inelastic - flexure at node J.
Same as for branch AB, a zero or non zero hinge
stiffness for node j on LINE 3, columns 16-25 will
control whether this ratio is directly applied to
the hinge alone or to the beam as a whole. For
negative stiffness this value must be input as
negative.
LINE 3: Hinge Stiffness Propeities Data 2 (15,4F10.0).
Columns I - 5: Stiffness type number, in sequence beginning with 1
175

and corresponding to the stiffness type number on
the preceding Beam Properties line.
6 - 15: Hinge stiffness at node i. Leave blank or zero if
the hinge properties are to be determined by the
program. If blank or zero, the following field for
node j must also be blank or zero. If non zero, the
following field for node j must also be non zero.
16 - 25: Hinge stiffness at node J.
26 - 35: Unloading stiffness parameter for end i.
36 - 45: Unloading stiffness parameter for end J.
CARD E7(c): End Eccentricities (15,4F10.0). One line for each
eccentricity. Omit if there is no eccentricity. All eccentricities are
measured from the node to the element ends. See reference 4.
Columns 1 - 5: End eccentricity type number, in sequence beginning
with 1.
6 - 15: Xi - X eccentricity at end i.
16 - 25: Xj - X eccentricity at end J.
26 - 35: Yi - Y eccentricity at end i.
36 - 45: Yj - Y eccentricity at end j.
CARD E7(d): Cross Section Yield Interaction Surfaces (15,6F10.0).
Refer to Fig. 3.10.
Columns 1 - 5: Yield surface number, in sequence beginning with 1.
6 - 15: Positive moment at point A of the moment - rotation
curve of the element.
176

16 - 25: Negative moment at point A of the moment - rotation
curve of the element.
26 - 35: Positive moment at point B of the moment - rotation
curve of the element.
36 - 45: Negative moment at point B of the moment - rotation
curve of the element.
46 - 55: Positive moment at point C of the moment - rotation
curve of the element.
56 - 67: Negative moment at point C of the moment - rotation
curve of the element.
CARD E7(e): Fixed End Force Patterns (215,6F10.0). One card for each
fixed end force pattern. Omit if there are no fixed end forces.
Columns I - 5: Pattern number.
10: Axis code, as follows:
Code - 0: Forces are in the element coordinate
system. See reference 1.
Code - 1: Forces are in the global coordinate
system. See reference 1.
11 - 20: Clamping force, F i .
21 - 30: Clamping force, V i .
31 - 40: Clamping force, Mi.
41 - 50: Clamping force, Fj.
51 - 60: Clamping force, Vj.
61 - 70: Clamping force, Mj.
CARD E7(f): Initial Element Force Patterns (15,6F10.0). One card for
each initial force pattern. Omit if there ar! no initial forces.
177

Columns 1 - 5: Pattern number, in sequence beginning with 1.
6 - 15: Initial axial force, Fi.
16 - 25: Initial shear force, Vi.
26 - 35: Initial moment, Mi.
36 - 45: Initial axial force, F.
46 - 55: Initial shear force, VJ.
56 - 65: Initial moment, Mj.
CARD E7(g): Element Generation Commands (1215,2F5.0,15,F5.0). One line
for each generation command. Elements must be specified in increasing
numerical order. Lines for the first and last elements must be
included.
Columns 1 5: Element number, or number of the first element in a
sequentially numbered series of elements to be
generated by this command. See Note 6 for
explanation of this generation procedure.
6 - 10: Node number at the element end i.
11 - 15: Node number at the element end J.
16 - 20: Node number increment for the element generation.
If 0 or blank, assumed to be equal to 1.
21 - 25: Stiffness type number.
26 - 30: End eccentricity type number. Leave blank or zero
if there is no end eccentricity.
31 - 35: Yield surface number for element end i.
36 - 40: Yield surface number for element end J.
178

45: Code for including geometric stiffness. Type 1 if
geometric stiffness is to be included. Leave blank
or type 0 if geometric stiffness is to be ignored.
50: Time history output code. If a time history of the
element results is not required for the elements
covered by this command, type 0 or leave blank.
If a time history printout, at the intervals
specified on CARD Dl, is required, type 1.
51 - 55: Fixed end force pattern number for static dead loads
on the element. Leave blank if there are no dead
loads. If the static load code, CARD Cl, is 0, the
fixed end force information is ignored.
56 - 60: Fixed end forces pattern number for the static live
loads on the element. Leave blank if there are no
live loads.
61 - 65: Scale factor to be applied to the fixed end forces
due to static dead loads. Leave blank if there are
no dead loads.
66- 70: Scale factor to be applied to fixed end forces due
to static live loads. Leave blank or type 0 if
there are no live loads.
71 - 75: Intial force pattern number. Leave blank or type
zero if there are no initial forces.
76 - 80: Scale factor to be applied to initial element
forces. Leave blank if there are no initial forces.
179

ELl(m): MODIFIED TRUSS ELEMENT. Number of words of information per
element - 36.
CARD El(a): Control Information For The Group (415). One line.
Columns 1 - 5: Type I to indicate that the group consists of truss
elements.
6 - 10: Number of elements in the group.
11 - 15: Number of different element stiffness types (maximum
is 40). See CARD El(b).
16 - 20: Number of different fixed end force patterns
(maximum is 40). See CARD El(c).
CARD El(b): Stiffness Types (I5,5F10.0,215). One line for each
stiffness type.
Columns 1 - 5: Stiffness type number.
6 - 15: Young's modulus of elasticity.
16 - 25: Strain hardening modulus, as a proportion of Young's
modulus.
26 - 35: Average cross sectional area.
36 - 45: Yield stress in tension.
46 - 55: Yield stress or elastic buckling stress in
compression.
56 - 60: Buckling code. Type 1 if element buckles
elastically in compression. Type 0 or leave blank
if element yields in compression without buckling.
61 - 65: Prestressed cable bracing code. Type 1 for
prestressed cable braces. Otherwise, leave blank or
type 0.
180
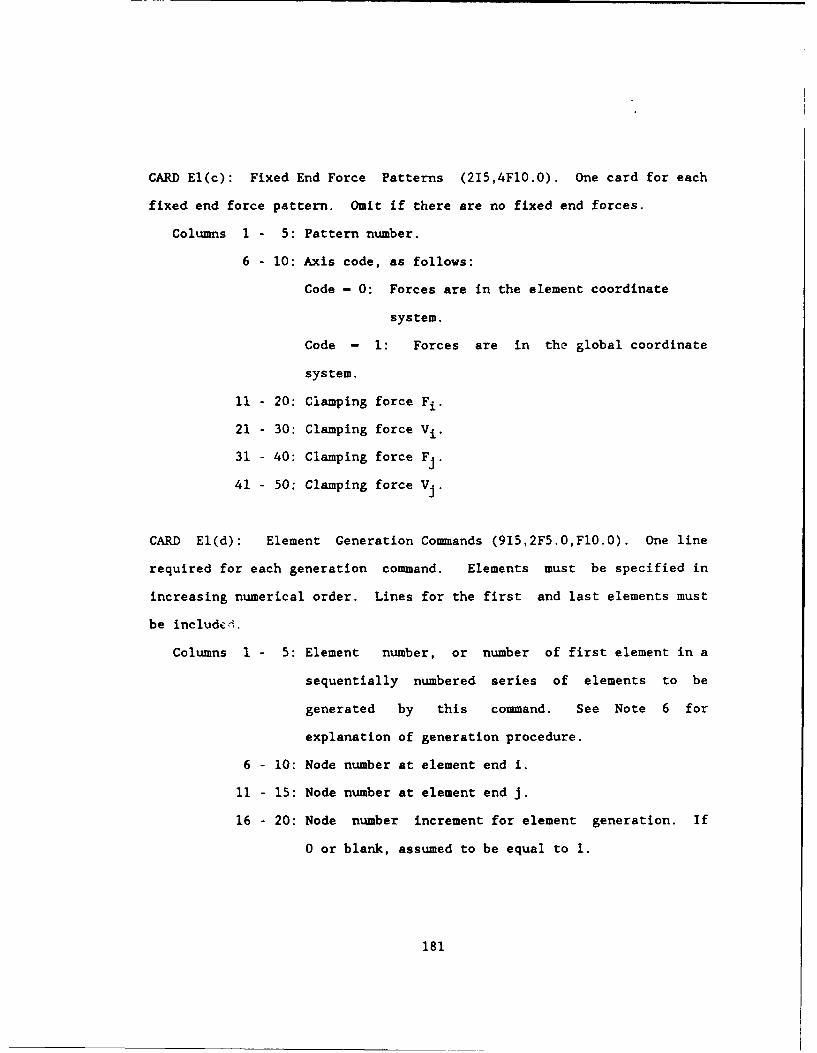
CARD El(c): Fixed End Force Patterns (215,4F10.0). One card for each
fixed end force pattern. Omit if there are no fixed end forces.
Columns 1 - 5: Pattern number.
6 - 10: Axis code, as follows:
Code - 0: Forces are in the element coordinate
system.
Code - 1: Forces are in the global coordinate
system.
11 - 20: Clamping force Fi.
21 - 30: Clamping force Vi .
31 - 40: Clamping force Fj.
41 - 50: Clamping force Vj.
CARD E1(d): Element Generation Commands (915,2F5.0,FlO.O). One line
required for each generation command. Elements must be specified in
increasing numerical order. Lines for the first and last elements must
be includ.4,
Columns 1 - 5: Element number, or number of first element in a
sequentially numbered series of elements to be
generated by this command. See Note 6 for
explanation of generation procedure.
6 - 10: Node number at element end i.
11 - 15: Node number at element end J.
16 - 20: Node number increment for element generation. If
0 or blank, assumed to be equal to 1.
181
21 - 25: Stiffness type number.
26 - 30: Code for including geometric stiffness. Type 1
if geometric stiffness is to be included. Leave
blank or type 0 if geometric stiffness is to be
ignored.
31 - 35: Time history output code. If a time history of
element results is not required for the elements
covered by this command, type 0 or leave blank. If
a time history printout (at the intervals specified
on CARD Dl) is required, type 1.
36 - 40: Fixed end force pattern number for static dead loads
on the element. Leave blank or type zero if there
are no dead loads.
41 - 45: Fixed end force pattern number for static live load
on the element. Leave blank if there are no live
loads.
46 - 50: Scale factor to be applied to fixed end forces due
to static dead Loads. Leave blank if there are no
dead loads.
51 - 55: Scale factor to be applied to fixed end forces due
to static live loads. Leave blank if there are no
live loads.
56 - 65: Initial axial force on element, tension positive.
182
F. NEXT PROBLEM
The data for a new problem may follow immediately, starting with
card A.
G. TERMINATION CARD (A4)
One card is needed to terminate the complete data set.
Columns 1 - 4: Type the word STOP.
NOTE 1. NODE COORDINATE SPECIFICATION
The "control node" coordinates must be defined with respect to the
X, Y coordinate system. The coordinates of the remaining nodes may be
generated using straight line generation commands (CARD B3). The number
of nodes generated by each command may be one or any larger number. The
coordinates of the two nodes at the beginning and end of the generation
line must have been previously defined, either by direct specification
or by previous straight line generation.
It is not necessary to provide generation commands for nodes which
are (a) sequentially numbered between the beginning and end nodes of any
straight line, and (b) equally spaced along that line. After all
generation commands have been executed, the coordinates for each group
of unspecified nodes are automatically generated assuming sequential
numbering and equal spacing along lines joining the specified nodes
immediately preceding and following the group. That is, any generation
command with equal spacing and a node number difference of one is
superfluous.
NOTE 2. NODES WITH ZERO DISPLACEMENTS
Each node of the structure may have up to three degrees of freedom,
183

namely X displacement, Y displacement and rotation. These are all
displacements relative to the ground.
Initially the program assumes that all three degrees of freedom are
present at all nodes (code - 0), and initializes the data arrays
accordingly. If this assumption is correct, CARD B4 should be omitted.
In some cases, however, either (a) certain nodes may be fixed relative
to the ground in certain directions or (b) it may be reasonable to
assume zero displacement. Any degree of freedom which is fixed is to be
assigned a code - 1, and cards must be included to specify those nodes
and degrees of freedom for which the codes are equal to 1.
If there is any doubt, it should be assumed that all nodes can
displace with all three degrees of freedom (i.e. all codes - 0). If
however, certain degrees of freedom can be eliminated, the computer time
may be significantly reduced.
NOTE 3. NODES WITH IDENTICAL DISPLACEMENTS
It may often be reasonable to assume that certain nodes displace
identically in certain directions. Identical displacements may be
specified by the commands of CARD B5. The input format for this card
limits to 14 the number of nodes covered by any single command. 7f more
than 14 nodes are to be assigned identical displacements, two or more
commands should be used, with the nodes in increasing numerical order
in each command, and with the smallest numbered node common to all
commands.
As with displacements which are constrained to be zero, greater
computational efficiency may be achieved by specifying identical
184

displacements. However, whereas the specification of zero displacements
will always decrease the structure stiffness band width or leave it
unchanged, specification of identical displacements may increase this
band width. The effect may be to increase the required structure
stiffness storage and/or the computational effort required to solve the
equilibrium equations. Identical displacements should therefore be
specified with caution, and their effects on storage requirements and
execution times should be investigated.
NOTE 4. SPECIFICATION OF LUMPED MASSES
The specification commands for lumped masses will generally permit
the user to input the nodal masses with only a few cards. Any node may,
if desired, appear in more than one specification command. In such
cases the mass associated with any degree of freedom will be the sum of
the masses specified in the separate commands. If certain nodes are
constrained to have identical displacement, the mass associated with
this displacement will be the sum of the masses specified for the
individual nodes. Note that the masses are to be input in units of
mass, not weight.
NOTE 5. SCALING OF EARTHQUAKE RECORDS
The acceleration scale factors may be used to increase or decrease
the ground accelerations, or to convert them from multiples of the
acceleration due to gravity to acceleration units. Modification of
earthquake intensity by scaling the acceleration values is a common
practice in research investigations, but should be undertaken cautiously
185

in practical applications. When the accelerations are scaled, the
ground velocities and displacements are scaled in the same proportion.
Provision is also made to modify the time scale. If a time scale
factor equal to, say, f, is specified, all input times are multiplied by
f before obtaining the interpolated accelerations at intervals equal to
the integration time step. If the ground accelerations remain
unchanged, the effect is to increase the ground velocities by f and the
ground displacements by f2 , and to alter the frequency content of the
earthquake. Time scale modifications should not be made without
carefully considering their influence on the ground motion.
NOTE 6. ELEMENT DATA GENERATION
In the element generation commands, the elements must be specified
in increasing numerical order. Cards may be provided for sequentially
numbered elements, in which each card specifies one element and the
generation option is not used. Alternatively, the cards for a group of
elements may be omitted, in which case the data for the missing group is
generated as follows:
1. All elements are assigned the same stiffness, strengths,
element load data and output code as the element preceding the
missing group.
2. The numbers of the nodes for each missing element are obtained
by adding Lhe specified node number increment to the node
numbers for the preceding element. The node number increment
is that specified for the element preceding the missing group.
186
APPENDIX B
WORKED EXAMPLE WITH DRAIN-2D (BRACED SUBASSEMBLAGE)
In this section an example problem will be solved using the current
version of DRAIN-2D. The revised user's manual given in Appendix A is
applicable. Working this example will aid future researchers and
interested readers to better understand the complicated data input
required for this program. Additionally, the assumptions made by this
researcher in modeling the subassemblage of the prototype structure will
be made clear to those who may follow this research.
The problem worked here is that of the braced subassemblage of the
prototype structure. The analytical model for the subassemblage is
given in Fig. 2.10. The geometric and structural properties of the beam
and column are given in Fig. 3.2. The input data is shown in Fig. B.I.
Cards A, Bl, B2, B3, B4, B6, Cl, Cla, C2, C3a, C3b, C4a, Dl, D2,
and E7a are self explanatory from the user's guide.
Card E7b. The initial column stiffness specified is calculated
from data derived from the load deformation curve shown in Fig. 3.9 and
EI - (V)(L)3/12(&), where V - 38 kips, L - 72 inches, and - .048
inches. EA and GA of the column are calculated based on the area of the
uncracked transformed section, Atran - 387.24 in2. The option for
having the program calculate the initial stiffness of the inelastic
rotational springs is chosen in Card E7b(3) by inputing zeros in the
appropriate fields for spring stiffnesses. As a result, the stiffness
ratios specified in Card E7b(2) are simply the relative slopes of the
load deformation curve in Fig. 3.9. The relative slopes of Fig. 3.9 are
187

also the relative slopes of the element moment rotation relationship.
The moment rotation relationship for the column is obtained from the
experimental load deformation curve of Fig. 3.9 by multiplying the load
axis by 1/2 - 72/2, and dividing the drift axis by 1 - 72.
For the spandrel beams, the initial stiffness, EI/2, is calculated
based on the uncracked transformed section. The uncracked transformed
section includes a 48 inch length section of the 6 inch thick floor
slab, EI/2 - (3122)(297,354)/2 - 464,169,594. Similarly, EA and GA are
also calculated based on the area of the uncracked transform section,
Atran - 895.8 in2 . The program again calculates the initial stiffness
of the inelastic rotational springs internally; therefore, the stiffness
ratios specified in Card 7b(2) are the averaged ratios of the element's
moment rotation relationship. The moment curvature diagram was first
hand calculated for both positive and negative moment and used to derive
the respective section moment rotation relationship at the beam ends.
The curvature axis of the moment curvature relationship was multiplied
by d/2 to obtain the moment rotation relationship. Because the spandrel
beams are severely under reinforced (i.e. less than the minimum
percentage of steel is provided) the positive cracking moment is larger
than the positive yield moment. For simplicity, the model used by
Badoux (3] for the beam element moment rotation relationship is
utilized. The model is shown in Fig. 3.10. With this model, a reduced
cracking moment is calculated based on the ultimate moment. Adjusting
the cracking moments in this way makes it possible to specify the
stiffness ratios of the moment rotation relationship in Card E7b(2) as
applicable for both positive and negative moment.
188

Card E7d. The moments specified for the column are calculated
again from the column load deformation curve in Fig. 3.9. The column is
assumed to develop an inflection point at mid height. The moment is
thus proportional to the shear force. The moment at points A, B, and C
are then the shear at points A, B, and C of Fig. 3.9 multiplied by half
the column effective height, 72/2 - 36 inches.
The moments specified for the spandrel beam are based on the hand
calculated ultimate moment and Fig. 3.10. The calculated positive
ultimate moment is 2013 kip-inches and the negative ultimate moment is
3186 kip-inches.
Card E7g, and G are self explanatory. A plot of the shear strength
of the braced subassemblage vs cyclic lateral displacement at node 5 is
shown in Fig. 4.11 with n - 2 and 0.5Py prestress force.
189
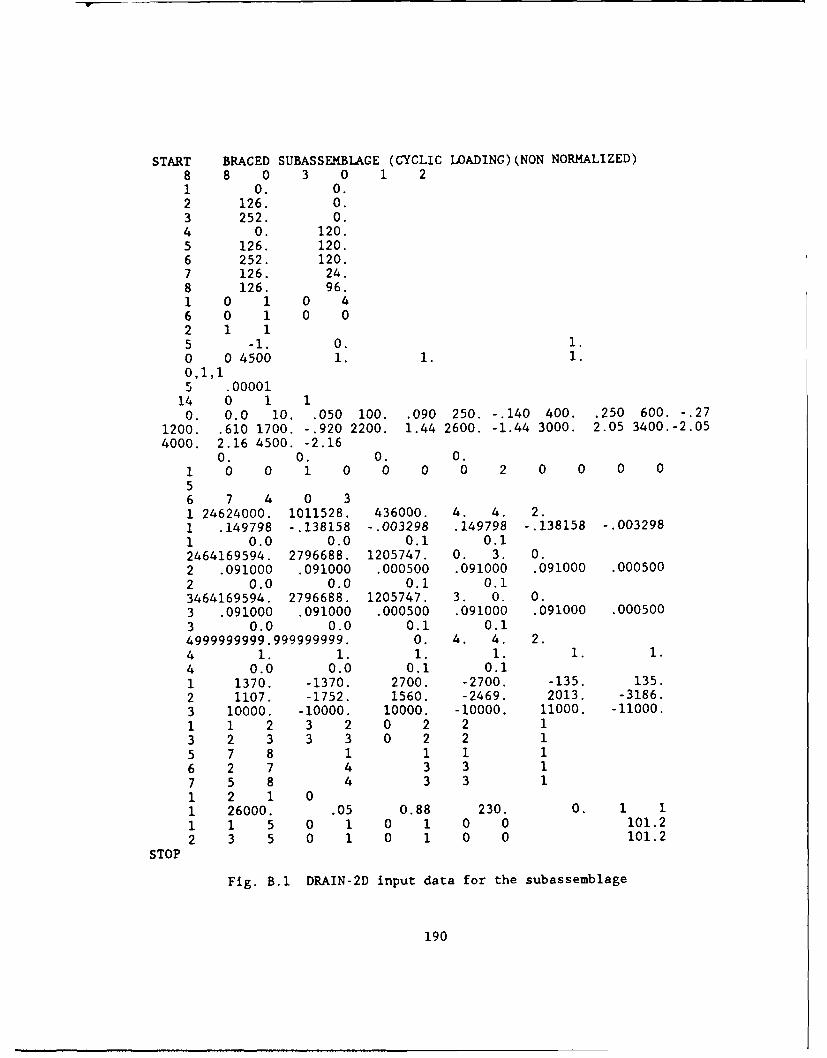
START BRACED SUBASSEMBLAGE (CYCLIC LOADING) (NON NORMALIZED)
8 8 0 3 0 1 21 0. 0.2 126. 0.3 252. 0.4 0. 120.5 126. 120.6 252. 120.7 126. 24.8 126. 96.1 0 1 0 46 0 1 0 02 1 15 -1. 0. 1.
0 0 4500 1. 1. 1.0,1,15 .00001
14 0 1 10. 0.0 10. .050 100. .090 250. -.140 400. .250 600. -.27
1200. .610 1700. -.920 2200. 1.44 2600. -1.44 3000. 2.05 3400.-2.054000. 2.16 4500. -2.16
0. 0. 0. 0.
1 0 0 1 0 0 0 0 2 0 0 0 056 7 4 0 31 24624000. 1011528. 436000. 4. 4. 2.
1 .149798 -.138158 -.003298 .149798 -.138158 -.003298
1 0.0 0.0 0.1 0.12464169594. 2796688. 1205747. 0. 3. 0.2 .091000 .091000 .000500 .091000 .091000 .0005002 0.0 0.0 0.1 0.13464169594. 2796688. 1205747. 3. 0. 0.3 .091000 .091000 .000500 .091000 .091000 .0005003 0.0 0.0 0.1 0.14999999999.999999999. 0. 4. 4. 2.4 1. 1. 1. 1. 1. 1.
4 0.0 0.0 0.1 0.1
1 1370. -1370. 2700. -2700. -135. 135.
2 1107. -1752. 1560. -2469. 2013. -3186.
3 10000. -10000. 10000. -10000. 11000. -11000.1 1 2 3 2 0 2 2 13 2 3 3 3 0 2 2 15 7 8 1 1 1 16 2 7 4 3 3 17 5 8 4 3 3 1
1 2 1 01 26000. .05 0.88 230. 0. 1 1
1 1 5 0 1 0 1 0 0 101.2
2 3 5 0 1 0 1 0 0 101.2
STOP
Fig. B.1 DRAIN-2D input data for the subassemblage
190