il&fs transportation networks limited - welcome to itnl narketpally addanki(1) chenani nashri...
TRANSCRIPT

IL&FS Transportation Networks Limited
August 4 2010August 4, 2010

Disclaimer
This presentation has been prepared solely by IL&FS Transportation Networks Limited (“ITNL”) and does not constitute a prospectus or placementmemorandum or an offer to acquire any securities. This presentation or any other documentation or information (or any part thereof) delivered orsupplied does not and should not be deemed to constitute an offer.
No representation or warranty, express or implied is made as to, and no reliance should be placed on, the fairness, accuracy, completeness or correctnessof such information or opinions contained herein. The information contained in this presentation is only current as of its date. Certain statements made inthis presentation may not be based on actual historical information or facts, and may be “forward looking statements”, including without limitation thoserelating to the general business plans and strategy of ITNL, its future financial condition and growth prospects, future developments in its industry and itscompetitive and regulatory environment, and any other statements which contain words or phrases such as ‘will’, ‘expected to’, ‘horizons of growth’,‘strong growth prospects’ etc or similar expressions or variations of such expressions These forward‐looking statements involve a number of risksstrong growth prospects , etc., or similar expressions or variations of such expressions. These forward looking statements involve a number of risks,uncertainties and other factors that could cause actual results, opportunities and growth potential to differ materially from those suggested by theforward‐looking statements. These risks and uncertainties include, but are not limited to risks with respect to ITNL’s growth, business and the industrythat it operates within.
ITNL reserves the right to alter modify or otherwise change in any manner the content of this presentation without obligation to notify any person ofITNL reserves the right to alter, modify or otherwise change in any manner the content of this presentation, without obligation to notify any person ofsuch revision or changes. This presentation cannot be copied and disseminated in any manner.
No person is authorized to give any information or to make any representation not contained in and not consistent with this presentation and, if given ormade, such information or representation must not be relied upon as having been authorized by or on behalf of ITNL. This presentation is strictly
fid ti lconfidential.
1

In this presentation…
Company Overview
Major Milestones
The ITNL Group
Road Asset Portfolio
P j t i th T t ti S b tProjects in other Transportation Sub‐sectors
Company Positioning
Performance in FY10 and FY11 (till date)
Key Financial parameters of FY11 First QuarterKey Financial parameters of FY11 First Quarter
Board of Directors and Key Managerial Personnel
2

An Introduction
Jammu & Kashmir
IL&FS Transportation Networks Limited (ITNL) has the largest BoTroad asset portfolio (in terms of lane kilometer) in India with presence in a majority of the States
ITNL i t d b I f t t L i d Fi i l S i
PAN India presence with BoT projects in 12 States
Gurgaon Metro
Haryana
ITNL is promoted by Infrastructure Leasing and Financial Services Limited (IL&FS) and was incorporated in 2000
A ‘Thought Leader’………..,IL&FS Transportation plays varied roles such as Sponsor, Project Developer cum Manager Operations & Maintenance Manager
Gujarat
RajasthanUttar Pradesh
JharkhandGujarat Jharkhand
Meghalaya
Developer cum Manager, Operations & Maintenance Manager, Design & Value Engineer and Policy Advisor
ITNL has ~12,000 lane km under its road assets portfolio
Of which ~2400 lane km in projects in which we are L-1
Maharashtra
ChhattisgarhGRICL: 333 km
WGEL: 386 km
Maharashtra
ChhattisgarhGRICL: 333 km
WGEL: 386 km
Has presence in other sub sectors viz. Metro Rail , Bus Transportation
Bessemer Capital Public Holding
14 0%
Karnataka
AP
Karnataka
Andhra PradeshStandard Chartered 4.4%
2.1% 14.0%
ShareholdingNKEL: 472 km
TRDCL: 168 km
Kerala
NKEL: 472 km
TRDCL: 168 km Map not to scale
IL&FS
69.5%IL&FS EWT
5 6%
GS Strategic Investments
4.4%
Pattern
p5.6%
3

Key Differentiators
Market Leadership in the Transportation Infrastructure Sector• With around 11,800 lane km comprised in 21 projects in its road assets portfolio • Forays into other surface transportation sub‐sectors like metro & bus transportation
Track Record of Successful Project Implementation• Commissioned over 4000 lane kms of highways operating one bus transportation projectCommissioned over 4000 lane kms of highways, operating one bus transportation project
• Projects substantially completed to budget ‐ Commissioned projects within time
Strong Parentage of IL&FS• IL&FS Brand and expertise in finance & other infrastructure areas• Experience in working with various Government and other Authorities
Partnerships and Bilateral contracts with State GovtsPartnerships and Bilateral contracts with State Govts
• State Highway Concessions in joint venture with the States of Kerala, Chhattisgarh, Gujarat, Rajasthan & Jharkhand
Diversified and de‐risked portfolio• Pan India presence with a fair mix of annuity and toll concessions• Presence in Europe, Latin America & Mexico through Elsamex SA
4
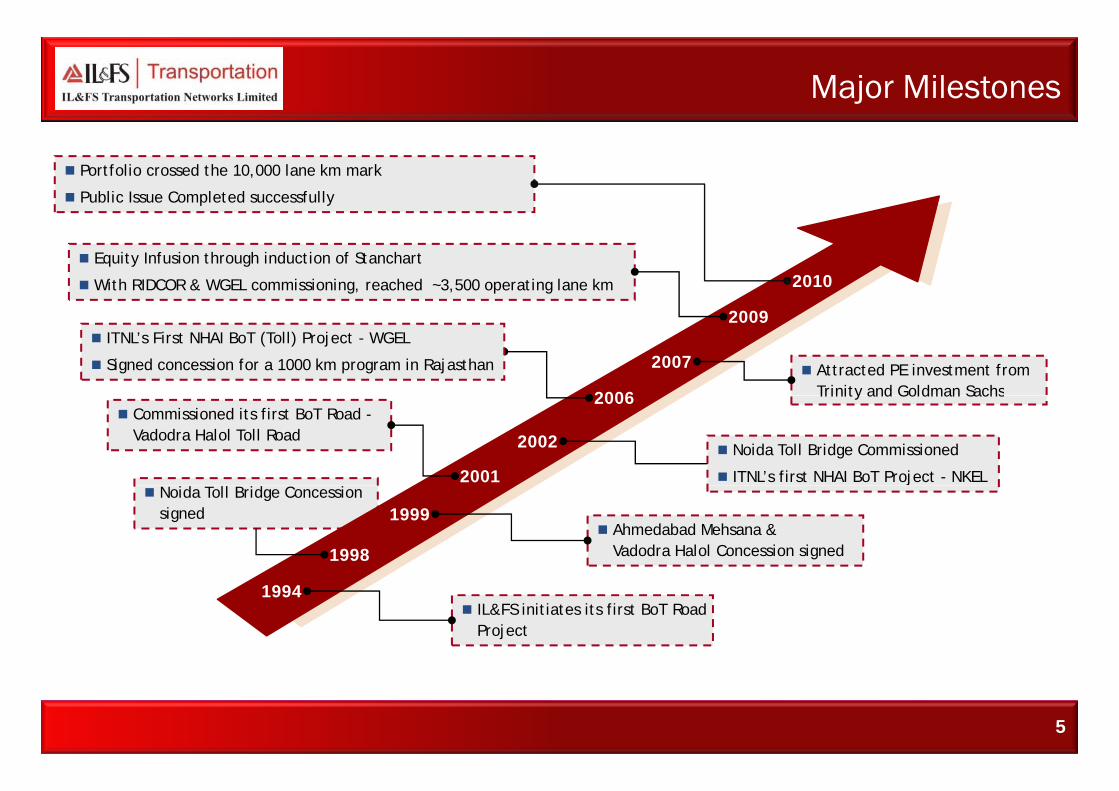
Major Milestones
Portfolio crossed the 10,000 lane km mark
Public Issue Completed successfully
Equity Infusion through induction of Stanchart
With RIDCOR & WGEL commissioning, reached ~3,500 operating lane km 2010
2009
2007
2006
Attracted PE investment from Trinity and Goldman Sachs
ITNL’s First NHAI BoT (Toll) Project - WGEL
Signed concession for a 1000 km program in Rajasthan
2001
2002
Commissioned its first BoT Road -Vadodra Halol Toll Road
Noida Toll Bridge Commissioned
ITNL’s first NHAI BoT Project - NKEL
2006 Trinity and Goldman Sachs
Noida Toll Bridge Concession signed
1998
1999Ahmedabad Mehsana &Vadodra Halol Concession signed
1994IL&FS initiates its first BoT Road Project
5

ITNL Group1
IL&FS Transportation Networks Limited
Operating Subsidiaries
83.61%As at March 31, 2010
GRICLOperating Subsidiaries25.35%
87.25%*
100.00%*70.00% 100.00%
NTBCL
WGEL
NKEL
Vs
IERS Elsamex SA50.00%*
49.93%
100.00%*
TRDCL
RIDCOR
APEL
ROAD
SPV
20 subsidiaries
00 00%
74.00%*
74.00%*
100 00%
48.00%CHDCL
JRPICL
APEL
JARDCL
R
RMRGL(Metro Rail SPV)
In Gurgaon VNIL
100.00%
74.00%
100.00%
74 00%
26.00%
JRPICL
IRIDCL
EHEL
g VNIL(Bus Transport SPV)
In Nagpur City
74.00%
35.00%
100.00%
100 00%
80.00%WCBTRL
MBEL
HREL
PSRDCL
6
* Includes indirect and beneficial interest too100.00% MBEL

Portfolio: Road Projects
40000014000
• Diverse BOT portfolio of 21(1) road projects covering ~12,000(1) lane km spread across various states of India
• Fair mix of “Annuity / assured payments” (ca. 48%) and “Toll” based (ca. 52%) projects at various stages of development
Almaty Horgos(1)Shillong
Jorbat
300000
350000
10000
12000
ChhattisgarhRoad
Chandrapur Warora
Narketpally Addanki(1)
Chenani Nashri ProjeRajasthan Mega
Highways-II
Jharkhand Road Development-II
200000
250000
8000
10000
West Gujarat Expressway AP
Development Jharkhand Road Development-I
Hyderabad Outer Ring Road
Beawar
Pune Sholapur
Ranchi Hazaribagh
in L
ane
km
Ramky Elsamex HyderabadRing Road A-4 Autovia,
Spain
Moradabad Bareilly
ect Cost in R
Thiruvananthapuram City Roads-II
Highways-II
Commissioned
100000
150000
4000
6000
Vadodara North
Karnataka
Thiruvananthapuram City Roads-I
Expressway
Rajasthan Mega Highways
AP Expressway
Beawar Gomti
p
Ahmedabad Mehsana RoadLe
ngth
p
Rs. Million
0
50000
0
2000
2001 2004 2005 2007 2009 2010
Halol
Noida Toll Bridge
Karnataka Expressway
2013 2014201220082002 2011
Under Development/Implementation
ITNL has one of the largest Private Sector BOT Road Portfolio in India
2001 2004 2005 2007 2009 2010 2013 2014201220082002 2011
Financial Years in which Commissioned /Expected to be Commissioned
1. Total lane km of ~12,000 includes 1,212 lane km from - Almaty Horgos where the Company is believed to be the preferred bidder
7
Project Cost

Portfolio Urban Infrastructure & Strategy
Metro Rail Project – awarded by Haryana Urban Development Authority (HUDA)
Metro link from Delhi metro Sikanderpur station to DLF Cyber City on NH-8 in Gurgaon
P j t C t f R 1100 ith i i d f 99 Metro
Project Cost of ~Rs. 1100 cr with a concession period of 99 years
ITNL – IERS – DLF awarded the Project (ITNL stake in the project ~59%)
Likely Commissioning in 2012
Rail
Nagpur Bus System Project – awarded by Nagpur Municipal Corporation
Mobilization, running, operating and maintaining the Nagpur City Bus Services
Concession period of 10 years - around 228 buses deployedBus
SystemProject Cost of ~ Rs. 500 mn - Term loan of Rs. 394.17 mn sanctioned by Pooled Municipal Debt Obligation Fund
Another 300 buses being deployed under the concession
System
Strategic partnership with AAI to venture into airport sector outside India
MoU with Middle East Coal Pte Ltd for financing of coal transportation infrastructure (Indonesia)
Entry into airports through acquisition of stake in Gulbarga and Shimoga regional airports
T h l g ti d f A t ti M ltil l P ki g t
Other Areas
& Technology tied up for Automatic Multilevel Parking sector
Entry Point check posts & Tolling Technologies
Acquiring equity stakes in existing Surface Transportation Projects
& Strategy
8

ITNL Positioning
B. Urban Transportation
Rapid MetroRail Gurgaon Limited (Jointly developed by a Consortium – ITNL, ITNL
A. Roads
We are India’s largest private sector BOT road operator with ~11,800 lane km in
Leveraget k d
BidSector
K l dgp y ,
Enso Rail Systems Limited and DLF Limited)
Operation and maintenance of Nagpur City Bus Services on BOO Basis
road operator with 11,800 lane km in our BoT road asset portfolio
Fair Mix of Annuity & Toll Projects
21 Projects under various stages of Engineering
track record
Environmental Construction
Knowledge
ydevelopment and commercial operations The IL&
FS
/Costing / SocialProgram
Value A
D. International Operations
Acquired 100% of Elsamex in early 2008
C. Other Infrastructure Opportunities
Leverage on IL&FS’s strategic partnership with AAI to venture into
Group Expert
ProjectFinance Brand Value
Financial Structuring
Addition by IT
Does Highway O&M and allied services
Currently providing maintenance service for over 21,000 lane km of roads
T ti L b f M t i l
partnership with AAI to venture into airport sector
Expand on Urban Infrastructure Opportunities
tiseConstruction/Supervision Funding
Construction
TNL
Testing Lab for Materials
Maintains 3,100 gas stations for European fuel suppliers
Automatic Multilevel Parking
Investing in existing Surface Transportation Projects within subsectors
O&M Syndication
Operations
9
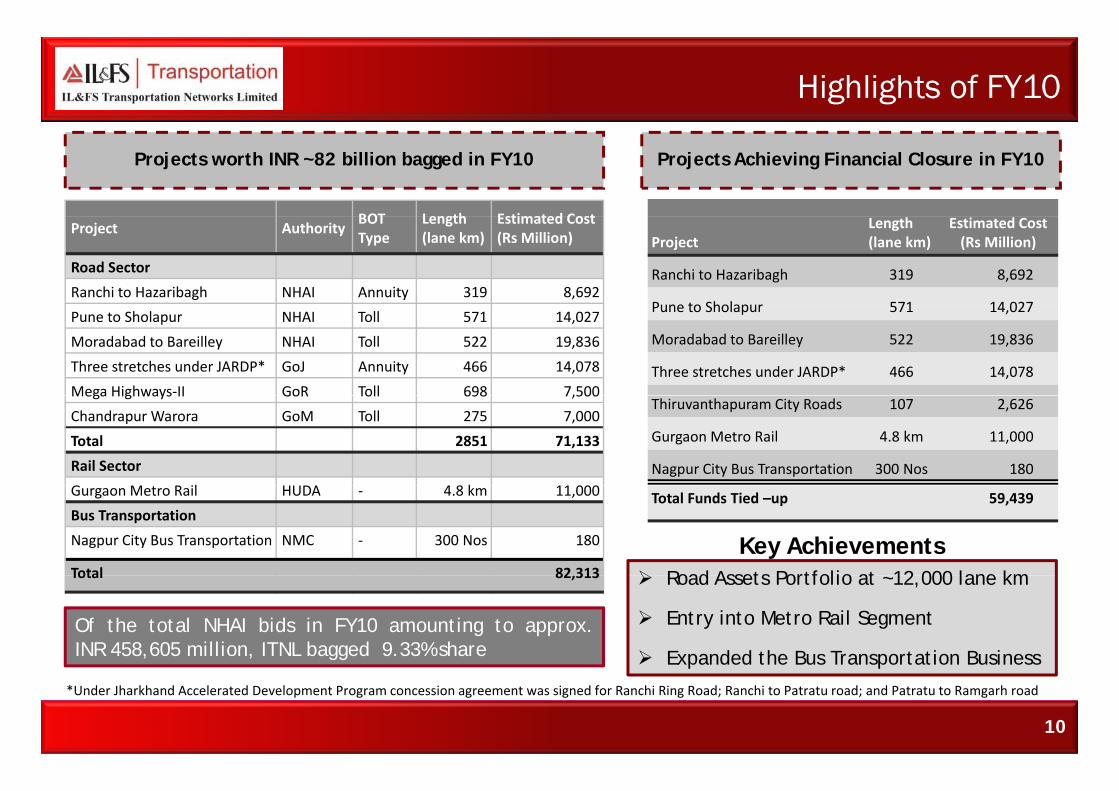
Highlights of FY10
BOT Length Estimated Cost
Projects worth INR ~82 billion bagged in FY10 Projects Achieving Financial Closure in FY10
Project AuthorityBOT Type
Length (lane km)
Estimated Cost (Rs Million)
Road Sector
Ranchi to Hazaribagh NHAI Annuity 319 8,692
Project Length (lane km)
Estimated Cost(Rs Million)
Ranchi to Hazaribagh 319 8,692
Pune to Sholapur 571 14 027Pune to Sholapur NHAI Toll 571 14,027
Moradabad to Bareilley NHAI Toll 522 19,836
Three stretches under JARDP* GoJ Annuity 466 14,078
Mega Highways‐II GoR Toll 698 7,500
Pune to Sholapur 571 14,027
Moradabad to Bareilley 522 19,836
Three stretches under JARDP* 466 14,078Mega Highways II GoR Toll 698 7,500
Chandrapur Warora GoM Toll 275 7,000
Total 2851 71,133
Rail Sector
G il 8 k 000
Thiruvanthapuram City Roads 107 2,626
Gurgaon Metro Rail 4.8 km 11,000
Nagpur City Bus Transportation 300 Nos 180Gurgaon Metro Rail HUDA ‐ 4.8 km 11,000
Bus Transportation
Nagpur City Bus Transportation NMC ‐ 300 Nos 180
Total 82 313
Total Funds Tied –up 59,439
Road Assets Portfolio at 12 000 lane km
Key AchievementsTotal 82,313 Road Assets Portfolio at ~12,000 lane km
Entry into Metro Rail Segment
Expanded the Bus Transportation Business
Of the total NHAI bids in FY10 amounting to approx.INR 458,605 million, ITNL bagged 9.33% share
*Under Jharkhand Accelerated Development Program concession agreement was signed for Ranchi Ring Road; Ranchi to Patratu road; and Patratu to Ramgarh road
p p
10

Project Pipeline for FY11
Project Authority BOT Type Length (lane km) Estimated Cost (Rs Million)
Projects Awarded after 31st March 2010
Chennani to Nashri in Jammu and Kashmir NHAI Annuity 38 37 400Chennani to Nashri in Jammu and Kashmir NHAI Annuity 38 37,400
Jorbat to Shillong in North East NHAI Annuity 262 8,100
Narkattpally to Addanki in Andhra Pradesh Govt of AP Toll 888 16,700
Total 1188 62,200
Lowest/Preferred Bidder
Almaty to Khorgos in Kazakhstan Govt of Kazakhstan Toll/ Annuity 1212 98,400
Total 1212 98,400
Total Project Cost 160 600Total Project Cost 160,600
RFP Stage RFQ Stage Total PipelineProjects Length (km) Cost (Rs. Mn) Projects Length (km) Cost (Rs. Mn)
NHAI 5 1,118 44,683 27 2,886 196,252
MORTH 1 192 5,580 7 794 40,722
Awarded 3 62,200
Preferred 1 98,400
RFP St 7 59 063MORTH 1 192 5,580 7 794 40,722
STATE PROJECTS 1 101 8,800 22 2,404 152,491
Total 7 1 411 59 063 56 6 084 389 465
RFP Stage 7 59,063
RFQ Stage 56 389,465
Total 67 609 128Total 7 1,411 59,063 56 6,084 389,465 Total 67 609,128
11

Road Sector Opportunity
Government plans to Award USD 50 billion of Road Projects in FY11 – Private Sector to fund ~70%
60 000
70,000 Program Target in Km
NHAI Construction Targets for 2010-11Estimated Capital Expenditure under NHDP PhasesRs in Cr
30 000
40,000
50,000
60,000 NHDP‐III385
NHDP‐V1,786
NHDP‐IV
10,000
20,000
30,000 NHDP‐IV9,401
SARDP‐NE282
-
NHDP-III NHDP-IV NHDP-V NHDP-VI NHDP-VIITotal 11,854
Preliminary estimates peg Infrastructure spend in the XIIth Plan (2012-17) at ~ INR 40 trillion
12

Financial Parameters (Consolidated)
6 000
8,00024,873
20,000
Revenue EBITDA(1)
(INR mn)(INR mn)
25,00011,500
9 000
960
2,4892,900
8,785
2787
0
2,000
4,000
6,000
1,981 4,375
13,320
8073
0
5,000
10,000
15,0009,000
2007 2008 2009 2010 2011-Q12007 2008 2009 2010 2011-Q1
3,44430%
1,500
PAT(2)(4) Average Capital Employed(3)(4)
(INR mn)(INR mn) RoCE (%)RoE (%)
3,50039,794 15%
20%
40 000
50,000
513932
2781046
7% 11%3%
20%24%
0%
15%
30%
0
500
1,000
18,57722,360
27,175
39,79452,163
3%4% 1%
9% 8% 5%
10%
15%
10,000
20,000
30,000
40,000
2007 2008 2009 2010 2011-Q1
PAT RoE
1. Includes other income and Excludes gain from Foreign exchange fluctuation2 RoE based on average equity
4% %
0%02007 2008 2009 2010 2011-Q1
AnnualisedAverage Capital Employed ROCE
2. RoE based on average equity3. RoCE based on average capital employed4. RoE, RoCE and Average Capital employed figures based on actual FY2007 numbers and not average for FY2007
13

Financial Parameters (Standalone)
6,4402 250
3,000
4,500
Revenue EBITDA(1)
(INR mn)10,500
(INR mn)
6,500
796
1358 1323
1525
0
750
1,500
2,250
1649
2499 2277
9415
25351,500
3,000
4,500
02007 2008 2009 2010 2011-Q10
2007 2008 2009 2010 2011-Q1
60%
1 500
Average Capital Employed(3)
(INR mn)(INR mn) RoCE (%)RoE (%)
PAT(2)
1,80023,496 30,326
20%30,000
462765
421
1,747737
14%12%
6%27%
18%
0%
15%
30%
45%
0
500
1,000
1,500
4,7159,657
13,499
23,496 30,326
10% 8%
3%
14%
10%
5%
10%
15%
7,500
15,000
22,500
2007 2008 2009 2010 2011-Q1
PAT RoE
1 Includes other income and including gain from Foreign exchange fluctuation
0%02007 2008 2009 2010 2011-Q1
AnnualisedAverage Capital Employed ROCE
1. Includes other income and including gain from Foreign exchange fluctuation2. RoE based on average equity3. RoCE based on average capital employed;
14

Profit & Loss Accounts Highlights
Standalone Consolidated
(All figures in INR million)
Key Parameters Q1‐FY11Q1
Annualised FY10 Change Q1‐FY11Q1
Annualised FY10 Change
Revenue 2,535 10,140 9,415 108% 8,073 32,292 24,873 130%, , , % , , , %
EBIDTA 1,525 6,100 6,439 95% 2,787 11,148 8,786 127%
EBIDTA Margin 60% 60% 68% 35% 35% 35%
Interest 315 1,260 1,425 88% 1,055 4,220 2,941 143%
Depreciation 22 88 43 205% 131 524 603 87%
Profit Before Tax 1,187 4,748 4,971 96% 1,601 6,404 5,241 122%
Profit After Tax (PAT) 737 2,948 3,247 91% 1,060 4,240 3,383 125%
PAT after adjustment 737 2,948 3,247 91% 1,046 4,184 3,444 121%PAT after adjustment 737 2,948 3,247 91% 1,046 4,184 3,444 121%
15

Revenue Collection on Operational Road Projects
(All figures in INR million)
Toll Projects under Operation Average Daily Revenuein FY10
Average Daily Revenue in Q1 of FY11
Ahmedabad Mehsana Road 1.17 1.21
Vadodra Halol Road 0.86 0.92
NoidaToll Bridge 1.94 1.93
Mega Highways – Rajasthan (Ph-I) 2.26 2.82g g
Rajkot to Jetpur – Gondal (Gujarat) 0.85 0.87
Operational Annuity Projects Annuity Per Annum Revenue received Operational Annuity Projects Annuity Per Annum Revenue received in Q1 of FY11
Maharashtra Border to Belgaum (Karnataka) 1,010.34 251.89g
Thirvananthapuram City Roads (Ph-I) 118.00 29.42
Kotakatta to Kurnol (Andhra Pradesh) 1130.40 284.00
16

Value for Shareholders
Have consistently created wealth for our shareholders….
BessemerINR 4184 Cr*
Public Issue
INR 5012 Cr*
(Mar, 2010)
Goldman
StanchartIL&FS FundINR 2280 Cr* (Mar, 2008)
(Oct, 2009)
Trinity Capital
Goldman SachsINR 1624 Cr* (Mar, 2007)
pINR 1542 Cr* (Dec, 2006)
* Post money valuation
17

Experienced Board of Directors
N i i Name D i ti
Independent Directors Non‐Independent Directors
Name Designation
Mr Deepak Dasgupta Chairman; Former Chairman NHAI
Name Designation
Mr Ravi Parthasarthy Chairman, IL&FS
Mr RC Sinha Vice Chairman & MD, Maharashtra
Airport Development Company Limited
Mr HP Jamdar Former Principal Secretary,
Mr Hari Sankaran Managing Director, IL&FS
Mr Arun K Saha Joint Managing Director, IL&FS
Mr HP Jamdar Former Principal Secretary,
Government of Gujarat
Mr Deepak Satwalekar Former Managing Director, HDFC
Mr Vibhav Kapoor Group Chief Investment Officer, IL&FS
Mr Pradeep Puri Managing Director, NTBCL
Mr K Ramchand Managing Director
Mr Mukund Sapre Executive Director
18

Key Managerial Personnel
• He has over 30 years of experience in urban and transport infrastructure development sectorK. RamchandManaging Director
• Has over 33 years of experience in various road construction projects
• He has over 27 years of experience in the industry. Mukund SapreExecutive Director
Harish Mathur • Has over 33 years of experience in various road construction projects. Chief Executive
• He has over 30 years of experience in the infrastructure and construction sector. He is responsible for Project
ImplementationM. K. MohanChief Executive
• He has over 35 years of experience in accounting and finance. Responsible for Financial and Accounting matters, Statutory
Compliances and Financial PlanningCherian George
Chief Financial Officer
• He has over 40 years of experience in the industry. He is our in‐house expert on structures including bridges and RoBs. In
the past, he has been associated with many projects and has authored many books on the subject too
• He has over 20 years of experience in the industry. He heads our in‐house design unit
V. K. RainaTechnical Director
Sanjay BhargavaS i Vi P id t
• He has over 28 years of experience in the industry He is the compliance officer legal adviser and Company Secretary
He has over 20 years of experience in the industry. He heads our in house design unit
• He has over 30 years of technical experience in infrastructure surface transport activities. He heads our ISO and Quality
Management Unit
Krishna Ghag
Senior Vice President
Rajul B. PanditVice President
19
• He has over 28 years of experience in the industry. He is the compliance officer, legal adviser and Company SecretaryAVP & Company Secretary

Thank You
IL&FS Transportation Networks LimitedThe IL&FS Financial CentreThe IL&FS Financial CentreC-22, G Block, Bandra Kurla ComplexBandra (East), Mumbai – 400 051
Board: +91 22 2653 3333Fax: +91 22 2652 3979Email: [email protected]