iii sem fluid mechanics lab manual
DESCRIPTION
labTRANSCRIPT
SRINIVASAN ENGINEERING COLLEGE,PERAMBALUR
DEPARTMENT OF MECHANICAL ENGINEERING
YEAR / SEMESTER - II / III
ME 2208 - FLUID MECHANICS AND MACHINERY LABORATORY
LAB MANUAL FOR STUDENTS

INDEX
S.No DATE NAME OF THE EXPERIMENT MARK SIGNATURE
1
2
3
4
5
6
7
8
9
10
11
12
Completed date:
Average Mark: Staff - in - charge

ME 2208 FLUID MECHANICS AND MACHINERY LAB
1. Determination of the coefficient of discharge of given Orifice meter.
2. Determination of the coefficient of discharge of given Venturi meter.
3. Calculation of the rate of flow using Rota meter.
4. Determination of friction factor of given set of pipes.
5. Conducting experiments and drawing the characteristics curves of centrifugal pump.
6. Conducting experiments and drawing the characteristics curves of reciprocating
pump.
7. Conducting experiments and drawing the characteristics curves of Gear pump.
8. Conducting experiments and drawing the characteristics curves of Pelton wheel.
9. Conducting experiments and drawing the characteristics curves of Francis turbine.
10. Conducting experiments and drawing the characteristics curves of Kaplan turbine.
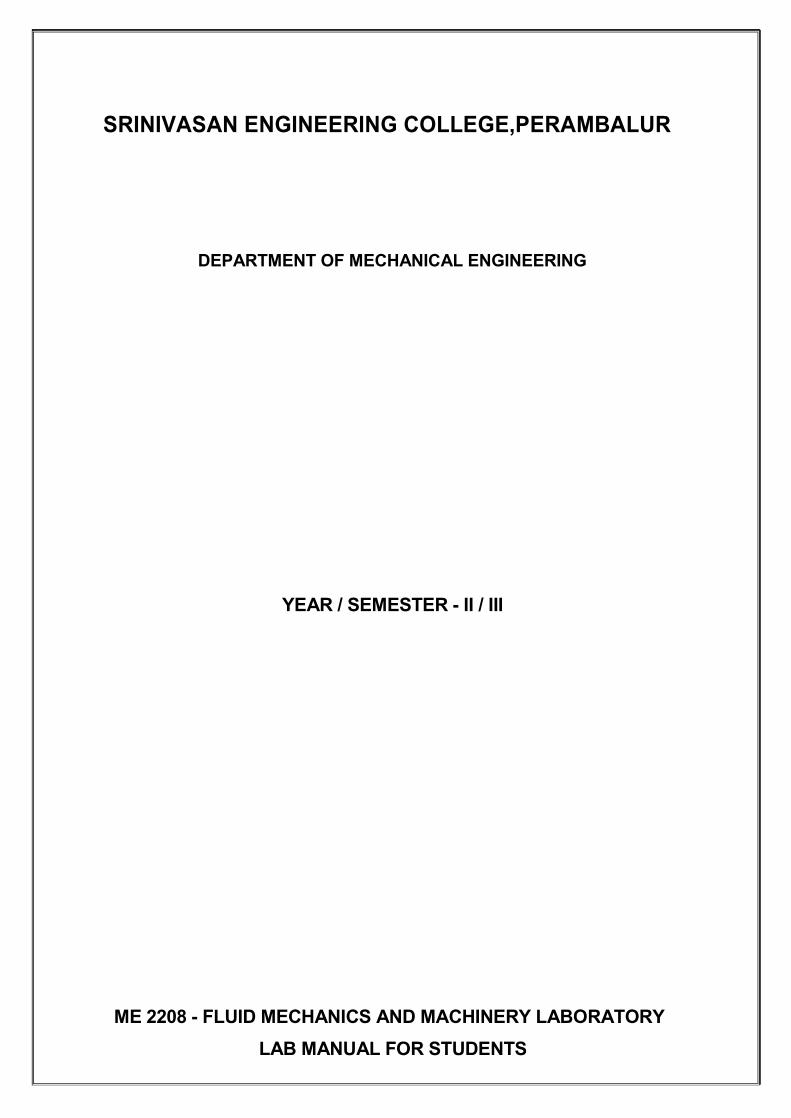
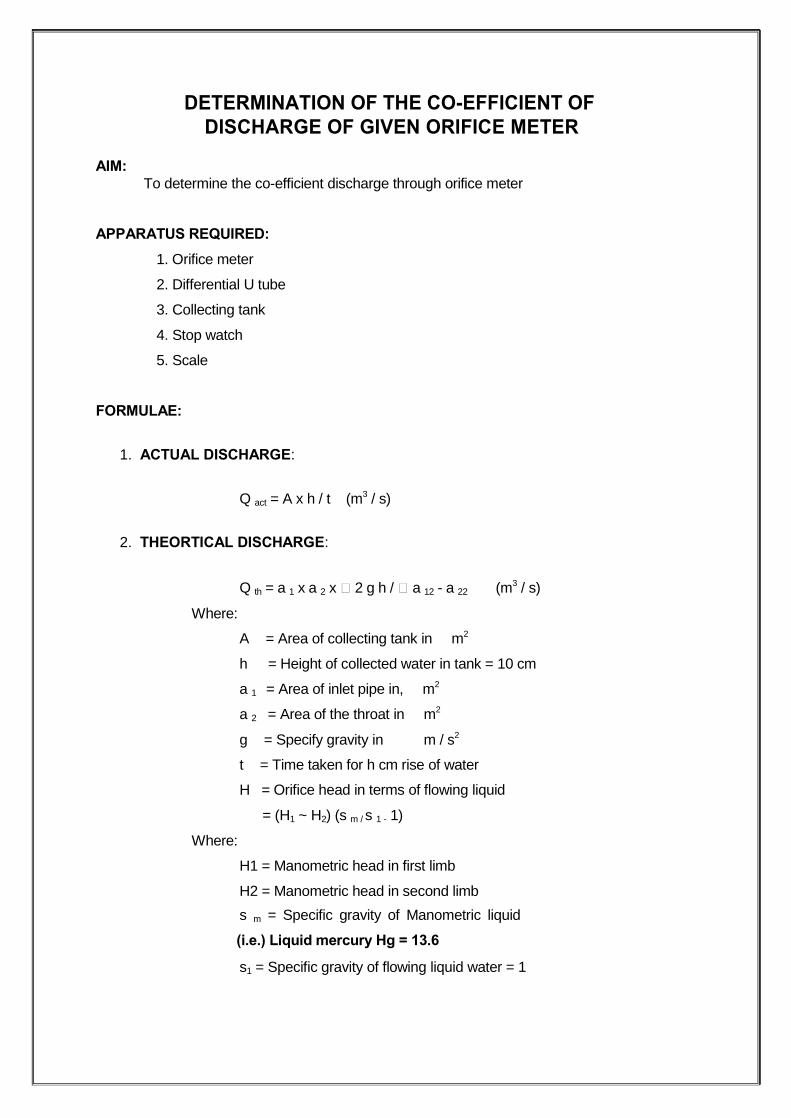
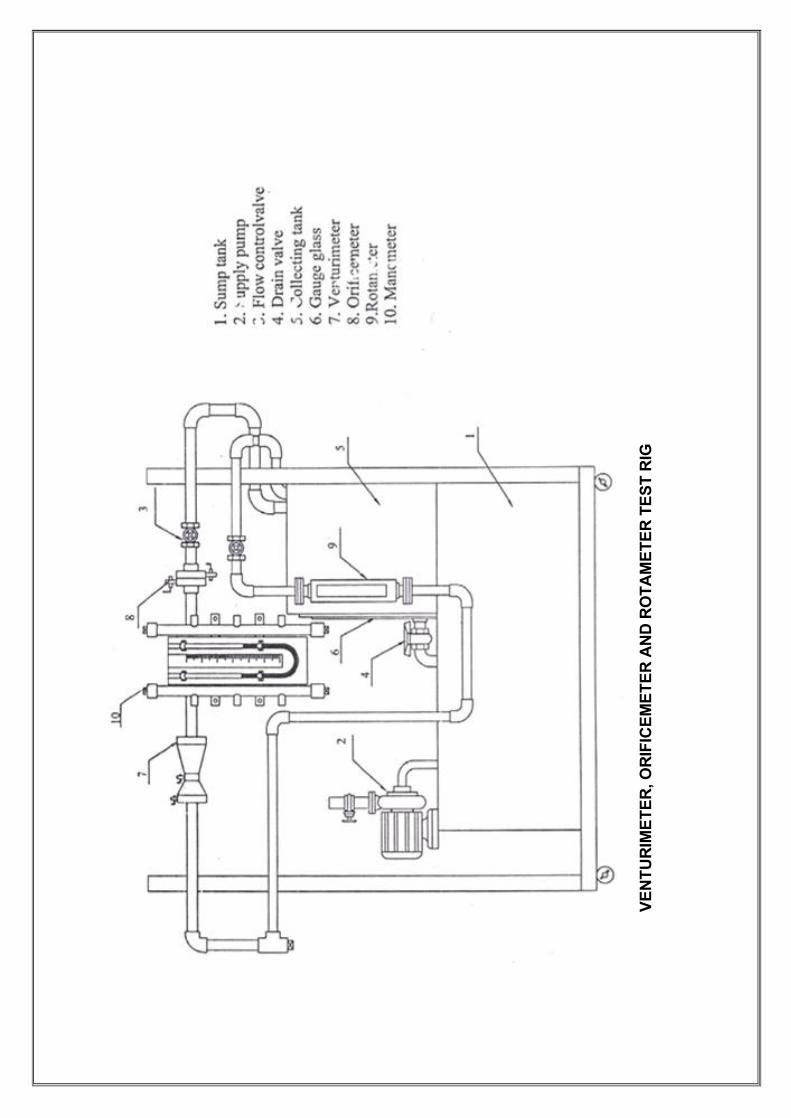
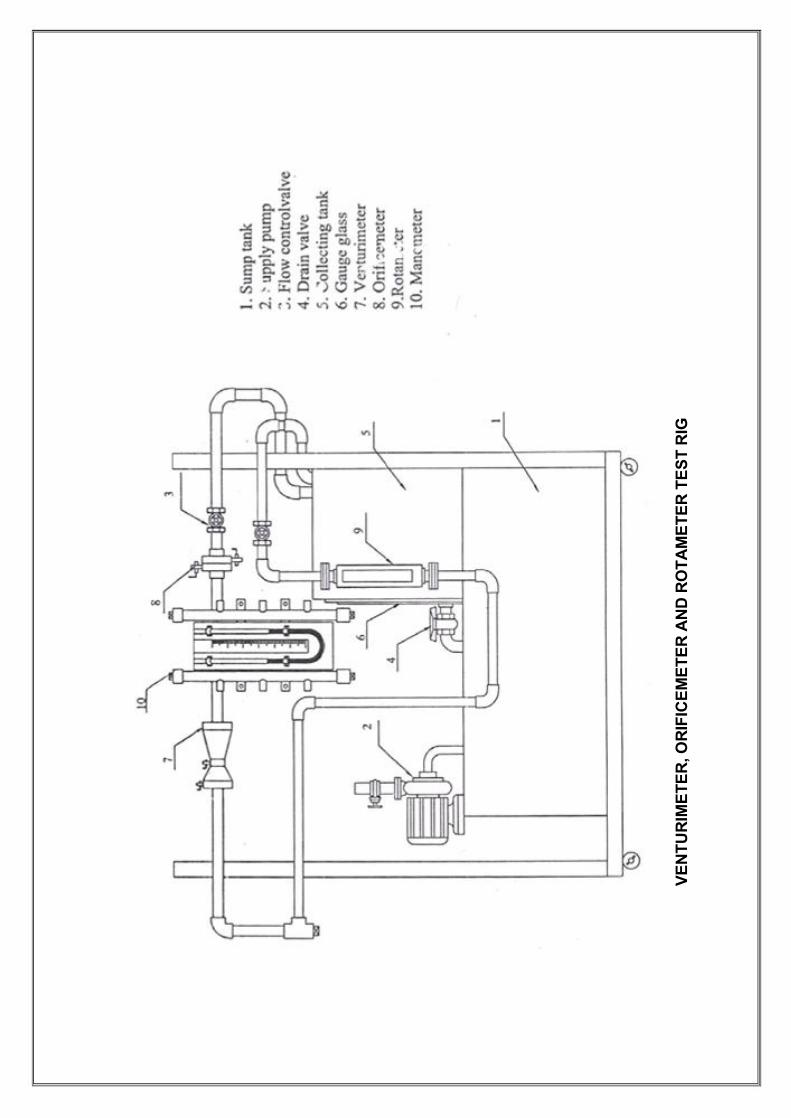
VE
NT
UR
IME
TE
R, O
RIF
ICE
ME
TE
R A
ND
RO
TA
ME
TE
R T
ES
T R
IG
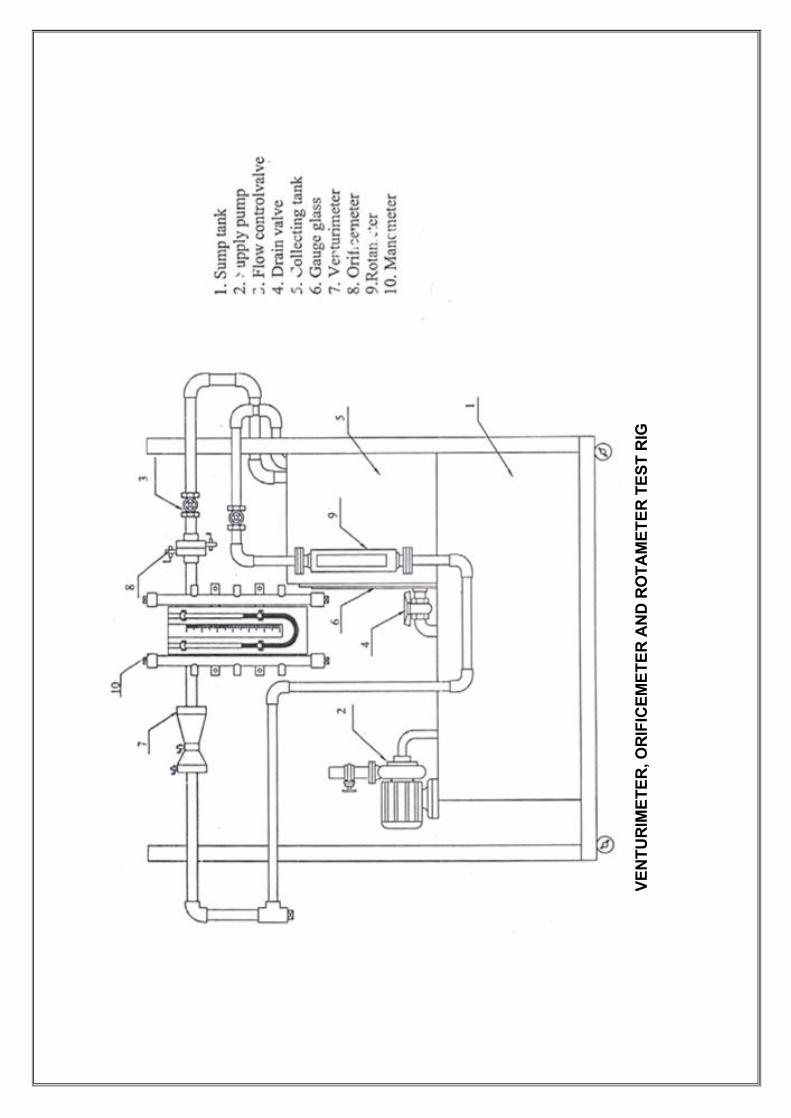
DETERMINATION OF THE CO-EFFICIENT OF
DISCHARGE OF GIVEN ORIFICE METER AIM:
To determine the co-efficient discharge through orifice meter APPARATUS REQUIRED:
1. Orifice meter
2. Differential U tube
3. Collecting tank
4. Stop watch
5. Scale FORMULAE:
1. ACTUAL DISCHARGE:
Q act = A x h / t (m3 / s)
2. THEORTICAL DISCHARGE:
Q th = a 1 x a 2 x 2 g h / a 12 - a 22 (m3 / s)
Where:
A = Area of collecting tank in m2
h = Height of collected water in tank = 10 cm
a 1 = Area of inlet pipe in, m2
a 2 = Area of the throat in m2
g = Specify gravity in m / s2
t = Time taken for h cm rise of water
H = Orifice head in terms of flowing liquid
= (H1 ~ H2) (s m / s 1 - 1)
Where:
H1 = Manometric head in first limb
H2 = Manometric head in second limb
s m = Specific gravity of Manometric liquid
(i.e.) Liquid mercury Hg = 13.6
s1 = Specific gravity of flowing liquid water = 1

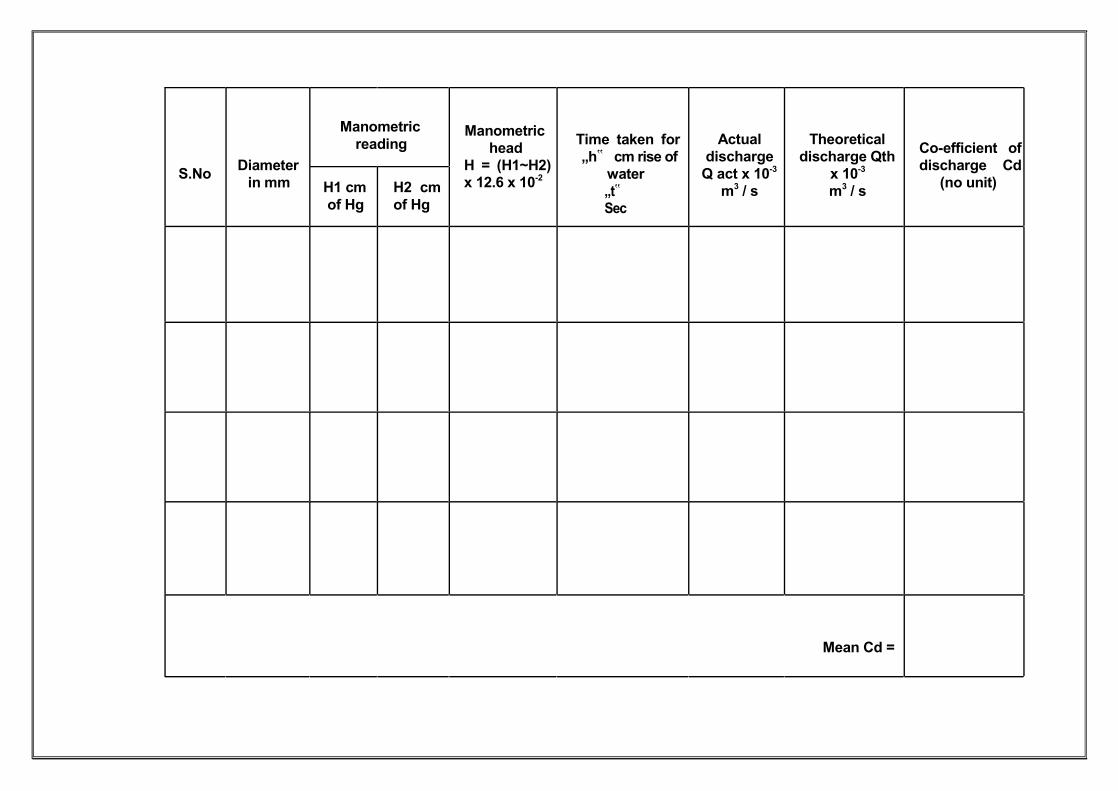
S.No
Diameter
in mm
Manometric
reading
H1 cm H2 cm
of Hg of Hg
Manometric
head
H=(H1~H2) x 12.6 x 10-2
Time taken for
„h‟ cm rise of
water
„t‟ Sec
Actual Theoretical
discharge discharge Qth
Q act x 10-3 x 10⁻³
m3 / s m3 / s
Co-efficient of
discharge Cd
(no unit)
Mean Cd =

3. CO EFFICENT OF DISCHARGE:
Co- efficient of discharge = Q act / Q th (no units)
DESCRIPTION:
Orifice meter has two sections. First one is of area a1, and second one of area a2, it
does not have throat like venturimeter but a small holes on a plate fixed along the diameter
of pipe. The mercury level should not fluctuate because it would come out of manometer.
PROCEDURE:
1. The pipe is selected for doing experiments
2. The motor is switched on, as a result water will flow
3. According to the flow, the mercury level fluctuates in the U-tube manometer
4. The reading of H1 and H2 are noted
5. The time taken for 10 cm rise of water in the collecting tank is noted
6. The experiment is repeated for various flow in the same pipe
7. The co-efficient of discharge is calculated

MODEL CALCULATION:
RESULT:
The co efficient of discharge through orifice meter is ……… (No unit)
VE
NT
UR
IME
TE
R, O
RIF
ICE
ME
TE
R A
ND
RO
TA
ME
TE
R T
ES
T R
IG

DETERMINATION OF THE CO EFFICIENT OF
DISCHARGE OF GIVEN VENTURIMETER AIM:
To determine the coefficient of discharge for liquid flowing through venturimeter. APPARATUS REQUIRED:
1. Venturimeter
2. Stop watch
3. Collecting tank
4. Differential U-tube
5. Manometer
6. Scale
FORMULAE:
1. ACTUAL DISCHARGE:
Q act = A x h / t (m3 / s)
2. THEORTICAL DISCHARGE:
Qth = a 1 x a 2 x 2 g h / a 12 - a 22 (m3 / s)
Where:
A = Area of collecting tank in m2
h = Height of collected water in tank = 10 cm
a 1 = Area of inlet pipe in m2
a 2 = Area of the throat in m2
g = Specify gravity in m / s2
t = Time taken for h cm rise of water
H = Orifice head in terms of flowing liquid
= (H1 ~ H2) (s m /s 1 - 1)
Where:
H1 = Manometric head in first limb
H2 = Manometric head in second limb
s m = Specific gravity of Manometric liquid
(i.e.) Liquid mercury Hg = 13.6
s1 = Specific gravity of flowing liquid water = 1
S.No
Diameter
in mm
Manometric
reading
H1 cm H2 cm
of Hg of Hg
Manometric
head
H = (H1~H2) x 12.6 x 10-2
Time taken for
„h‟ cm rise of
water
„t‟ Sec
Actual Theoretical
discharge discharge Qth
Q act x 10-3 x 10⁻³
m3 / s m3 / s
Co-efficient of
discharge Cd
(no unit)
Mean Cd =

3. CO EFFICENT OF DISCHARGE:
Co- efficient of discharge = Q act / Q th (no units)
DESCRIPTION:
Venturimeter has two sections. One divergent area and the other throat area. The
former is represented as a 1 and the later is a 2 water or any other liquid flows through the
Venturimeter and it passes to the throat area the value of discharge is same at a 1 and a 2 .
PROCEDURE:
1. The pipe is selected for doing experiments
2. The motor is switched on, as a result water will flow
3. According to the flow, the mercury level fluctuates in the U-tube manometer
4. The reading of H1 and H2 are noted
5. The time taken for 10 cm rise of water in the collecting tank is noted
6. The experiment is repeated for various flow in the same pipe
7. The co-efficient of discharge is calculated

MODEL CALCULATION:
RESULT:
The co efficient of discharge through Venturimeter is ……… (No unit)
VE
NT
UR
IME
TE
R, O
RIF
ICE
ME
TE
R A
ND
RO
TA
ME
TE
R T
ES
T R
IG

CALCULATION OF THE RATE OF FLOW USING ROTOMETER AIM:
To determine the percentage error in Rotometer with the actual flow rate.
APPARATUS REQUIRED:
1. Rotometer setup
2. Measuring scale
3. Stopwatch.
FORMULAE:
1. ACTUAL DISCHARGE:
Q act = A x h/ t (m3 / s)
Where:
A = Area of the collecting tank (m2)
h= 10 cm rise of water level in the collecting tank (10-2 m).
t = Time taken for 10 cm rise of water level in collecting tank. CONVERSION:
Actual flow rate (lit / min), Qact = Qact x 1000 x 60 lit /min
Rotometer reading ~ Actual x 100 %
Percentage error of Rotometer = Rotometer reading
= R ~ Qact / R x 100 %
PROCEDURE:
1. Switch on the motor and the delivery valve is opened
2. Adjust the delivery valve to control the rate in the pipe
3. Set the flow rate in the Rotometer, for example say 50 liters per minute
4. Note down the time taken for 10 cm rise in collecting tank
5. Repeat the experiment for different set of Rotometer readings
6. Tabular column is drawn and readings are noted
7. Graph is drawn by plotting Rotometer reading Vs percentage error of the
Rotometer

Perc
en
tag
e
Err
or
of
Ro
tom
ete
r (%
)
Actu
al d
isch
arg
e
Qact (l
pm
)
Avera
ge =
Tim
e t
aken
fo
r 10cm
rise o
f w
ate
r
In t
an
k (
t sec)
Actu
al
Dis
ch
arg
e
Qact (
m3/s
ec)
Ro
tom
ete
r
Read
ing
(lp
m)
S.N
o

MODEL CALCULATION:
RESULT:
The percentage error of the Rotometer was found to be………….…. %

FR
ICT
ION
LO
SS
ES
TE
ST
RIG

DETERMINATION OF FRICTION FACTOR OF
GIVEN SET OF PIPES AIM:
To find the friction ‘f’ for the given pipe. APPARATUS REQUIRED:
1. A pipe provided with inlet and outlet and pressure tapping
2. Differential u-tube manometer
3. Collecting tank with piezometer
4. Stopwatch
5. Scale FORMULAE:
1. FRICTION FACTOR ( F ):
f = 2 x g x d x h f / l x v2 (no unit)
Where,
g = Acceleration due to gravity (m / sec2)
d = Diameter of the pipe (m)
l = Length of the pipe (m)
v = Velocity of liquid following in the pipe (m / s)
hf = Loss of head due to friction (m)
= h1 ~ h2
Where
h1 = Manometric head in the first limbs
h2 = Manometric head in the second limbs
2. ACTUAL DISCHARGE:
Q = A x h / t (m3 / sec)
Where
A = Area of the collecting tank (m2)
h = Rise of water for 5 cm (m)
t = Time taken for 5 cm rise (sec)

Fri
cti
on
facto
r
f x 1
0-2
V2
m2 / s
2
Mean
f
=
Velo
cit
y
V
m/s
Actu
al d
isch
arg
e
Qact x
10
-3
m3 / s
Tim
e f
or
5cm
rise o
f
wate
r
t sec
Man
om
ete
r re
ad
ing
s
hf =
(h
1-h
2)
x 1
0-2
h2 x
10
-2
h1 x
10
-2
Dia
mete
r o
f
pip
e m
m
S.N
o

3. VELOCITY:
V = Q / a (m / sec)
Where
Q = Actual discharge (m3/ sec)
A = Area of the pipe (m2)
DESCRIPTION:
When liquid flows through a pipeline it is subjected to frictional resistance. The
frictional resistance depends upon the roughness of the pipe. More the roughness of the
pipe will be more the frictional resistance. The loss of head between selected lengths of the
pipe is observed.
PROCEDURE:
1. The diameter of the pipe is measured and the internal dimensions of the
collecting tank and the length of the pipe line is measured
2. Keeping the outlet valve closed and the inlet valve opened
3. The outlet valve is slightly opened and the manometer head on the limbs h1 and
h2 are noted
4. The above procedure is repeated by gradually increasing the flow rate and then
the corresponding readings are noted.

MODEL CALCULATION:
RESULT:
1. The frictional factor ‘f ‘ for given pipe = x 10-2 (no unit)
2. The friction factor for given pipe by graphical method = …… x 10-2 ( no unit )

CENTRIFUGAL PUMP TEST RIG
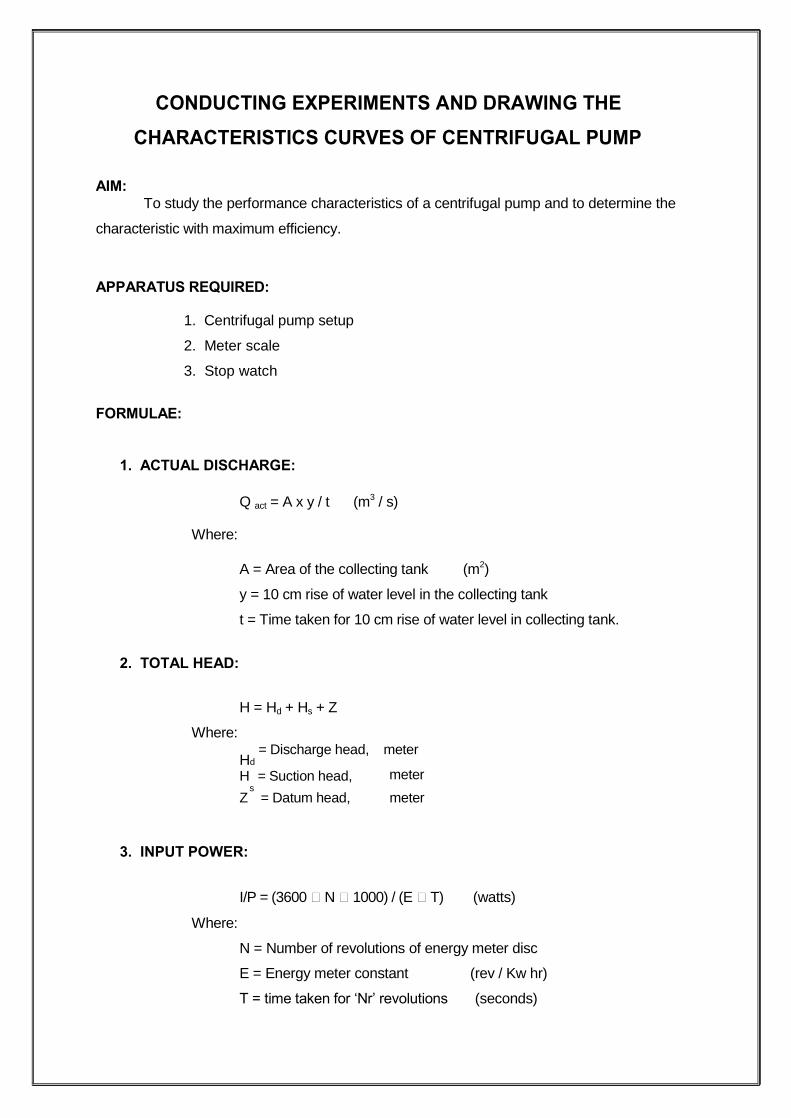
CONDUCTING EXPERIMENTS AND DRAWING THE
CHARACTERISTICS CURVES OF CENTRIFUGAL PUMP
AIM:
To study the performance characteristics of a centrifugal pump and to determine the
characteristic with maximum efficiency.
APPARATUS REQUIRED:
1. Centrifugal pump setup
2. Meter scale
3. Stop watch
FORMULAE:
1. ACTUAL DISCHARGE:
Q act = A x y / t (m3 / s)
Where:
A = Area of the collecting tank (m2)
y = 10 cm rise of water level in the collecting tank
t = Time taken for 10 cm rise of water level in collecting tank.
2. TOTAL HEAD:
H = Hd + Hs + Z
Where:
Hd = Discharge head, meter
Hs = Suction head, meter
Z = Datum head, meter
3. INPUT POWER:
I/P = (3600 N 1000) / (E T) (watts)
Where:
N = Number of revolutions of energy meter disc
E = Energy meter constant (rev / Kw hr)
T = time taken for ‘Nr’ revolutions (seconds)

%
Ou
tpu
t
Po
wer
(P
o)
watt
Avera
ge =
Inp
ut
Po
wer
(P
i )
watt
Actu
al
Dis
ch
arg
e
(Qact)
x10
-3
m3\s
ec
Tim
e
taken
fo
r
Nr
revo
luti
o
n t
S
Tim
e t
aken
for
„h‟
ris
e
of
wate
r
(t)
S
To
tal
Head
(H)
m o
f
wate
r
Delivery
Head
(Hd
) m
of
wate
r
Delivery
Gau
ge
Read
ing
(hd
) m
of
wate
r
Su
ctio
n
head
Hs
\m o
f w
ate
r
Su
ctio
n
gau
ge
Hs m
of
wate
r
S.N
o

4. OUTPUT POWER:
Where,
5. EFFICIENCY:
Where,
DESCRIPTION:
PRIMING:
Po = ρ x g x Q x H / 1000 (watts)
ρ = Density of water (kg / m³)
g = Acceleration due to gravity (m / s2)
H = Total head of water (m)
o = (Output power o/p / input power I/p)
100 %
O/p = Output power kW
I/ p = Input power kW
The operation of filling water in the suction pipe casing and a portion delivery pipe for
the removal of air before starting is called priming.
After priming the impeller is rotated by a prime mover. The rotating vane gives a
centrifugal head to the pump. When the pump attains a constant speed, the delivery valve is
gradually opened. The water flows in a radially outward direction. Then, it leaves the vanes
at the outer circumference with a high velocity and pressure. Now kinetic energy is gradually
converted in to pressure energy. The high-pressure water is through the delivery pipe to the
required height.
PROCEDURE:
1. Prime the pump close the delivery valve and switch on the unit
2. Open the delivery valve and maintain the required delivery head
3. Note down the reading and note the corresponding suction head reading
4. Close the drain valve and note down the time taken for 10 cm rise of water level
in collecting tank
5. Measure the area of collecting tank
6. For different delivery tubes, repeat the experiment
7. For every set reading note down the time taken for 5 revolutions of energy
meter disc.

GRAPHS:
1. Actual discharge Vs Total head
2. Actual discharge Vs Efficiency
3. Actual discharge Vs Input power
4. Actual discharge Vs Output power

MODEL CALCULATION:
RESULT:
Thus the performance characteristics of centrifugal pump was studied and
the maximum efficiency was found to be _____________

RECIPROCATING PUMP TEST RIG

CONDUCTING EXPERIMENTS AND DRAWING THE
CHARACTERISTICS CURVES OF RECIPROCATING PUMP
AIM:
To study the performance characteristics of a reciprocating pump and to determine
the characteristic with maximum efficiency. APPARATUS REQUIRED:
1. Reciprocating pump
2. Meter scale
3. Stop watch
FORMULAE:
1. ACTUAL DISCHARGE:
Q act = A x y / t (m3 / s) Where:
A = Area of the collecting tank (m2)
y = 10 cm rise of water level in the collecting tank
t = Time taken for 10 cm rise of water level in collecting tank
2. TOTAL HEAD:
H = Hd + Hs + Z
Where:
Hd = Discharge head; Hd = Pd x 10, m
Hs = Suction head; Pd = Ps x 0.0136, m
Z = Datum head, m
Pd = Pressure gauge reading, kg / cm2
Ps = Suction pressure gauge reading, mm of Hg
3. INPUT POWER:
Pi = (3600 N) / (E T) (Kw)
Where, N = Number of revolutions of energy meter disc E = Energy meter constant (rev / Kw hr)
T = time taken for ‘N’ revolutions (seconds)

%
Ou
tpu
t
po
wer
Po
kw
Mean
=
Inp
ut
po
wer
P
i kw
Tim
e t
aken
for
N r
ev o
f
en
erg
y
mete
r d
isc
t sec
Actu
al
dis
ch
arg
e
Qact
m³/
s
Tim
e t
aken
for
10 c
m o
f
rise o
f w
ate
r
in t
an
k t
sec
To
tal
head
H
Datu
m
hea
d Z
m
Su
cti
on
head
Hs
=
Ps x
0.0
136
Delivery
head
Hd
=
Pd
x10.0
Su
cti
on
pre
ssu
re
read
ing
P
s m
m
of
Hg
Delivery
pre
ssu
re
read
ing
P
d
kg
/ c
m2
S.N
o

4. OUTPUT POWER:
Where,
5. EFFICIENCY:
Where,
PROCEDURE:
Po = ρ x g x Q x H / 1000 (Kw)
ρ = Density of water (kg / m³)
g = Acceleration due to gravity (m / s2)
H = Total head of water (m)
Q = Discharge (m3 / sec)
o = (Output power po / input power pi)
100 % Po
= Output power KW
Pi = Input power KW
1. Close the delivery valve and switch on the unit
2. Open the delivery valve and maintain the required delivery head
3. Note down the reading and note the corresponding suction head reading
4. Close the drain valve and note down the time taken for 10 cm rise of water level
in collecting tank
5. Measure the area of collecting tank
6. For different delivery tubes, repeat the experiment
7. For every set reading note down the time taken for 5 revolutions of energy
meter disc.
GRAPHS:
1. Actual discharge Vs Total head
2. Actual discharge Vs Efficiency
3. Actual discharge Vs Input power
4. Actual discharge Vs Output power

MODEL CALCULATION:
RESULT:
The performance characteristic of the reciprocating pump is studied and the
efficiency is calculated …………… %

GE
AR
PU
MP
TE
ST
RIG
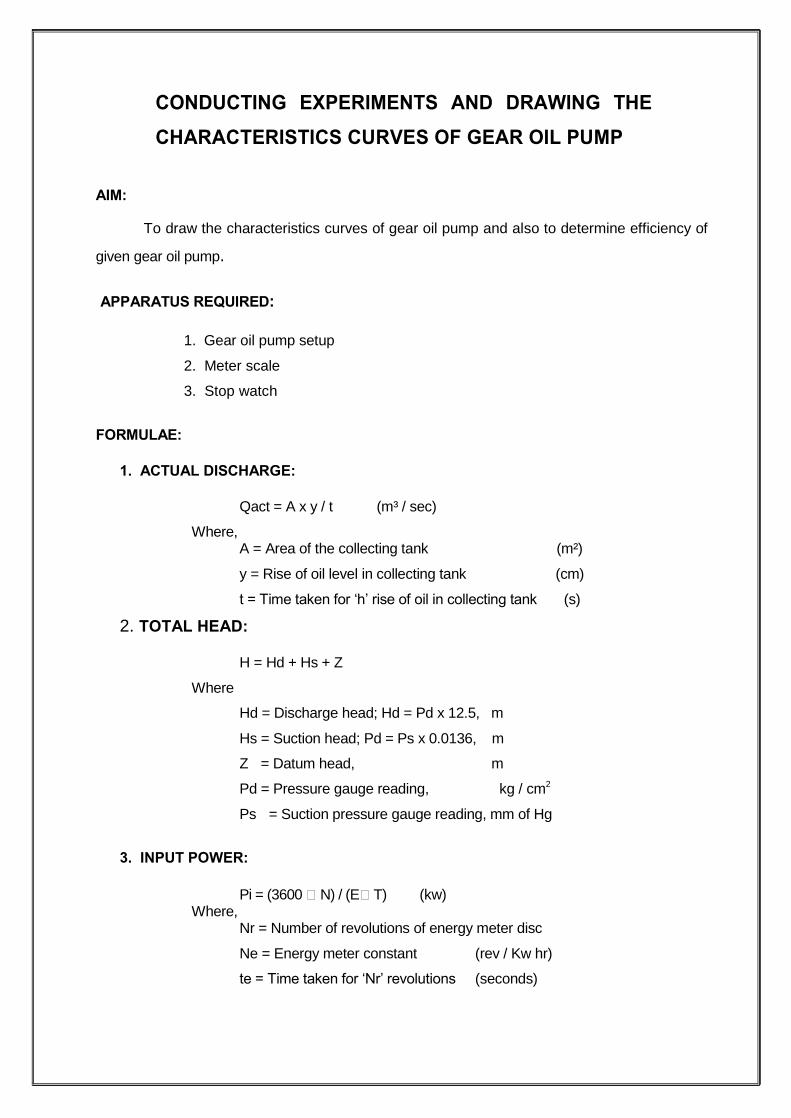
CONDUCTING EXPERIMENTS AND DRAWING THE
CHARACTERISTICS CURVES OF GEAR OIL PUMP AIM:
To draw the characteristics curves of gear oil pump and also to determine efficiency of
given gear oil pump.
APPARATUS REQUIRED:
1. Gear oil pump setup
2. Meter scale
3. Stop watch
FORMULAE:
1. ACTUAL DISCHARGE:
Qact = A x y / t (m³ / sec)
Where, A = Area of the collecting tank (m²)
y = Rise of oil level in collecting tank (cm)
t = Time taken for ‘h’ rise of oil in collecting tank (s)
2. TOTAL HEAD:
H = Hd + Hs + Z
Where
Hd = Discharge head; Hd = Pd x 12.5, m
Hs = Suction head; Pd = Ps x 0.0136, m
Z = Datum head, m
Pd = Pressure gauge reading, kg / cm2
Ps = Suction pressure gauge reading, mm of Hg
3. INPUT POWER:
Pi = (3600 N) / (E T) (kw) Where,
Nr = Number of revolutions of energy meter disc
Ne = Energy meter constant (rev / Kw hr)
te = Time taken for ‘Nr’ revolutions (seconds)

%
Ou
tpu
t
po
wer
Po
kw
Mean
=
Inp
ut
po
wer
Pi
kw
Tim
e t
aken
for
N r
ev o
f
en
erg
y
mete
r d
isc
t sec
Actu
al
dis
ch
arg
e
Qac
t
m³/
s
Tim
e t
aken
fo
r
10 c
m o
f ri
se
of
wate
r in
tan
k t
sec
To
tal
head
H m
Datu
m
head
Z
m
Su
cti
on
head
Hs
= P
s x
0.0
136
m
Delivery
head
Hd
=
Pdx1
2.5
m
Su
cti
on
pre
ssu
re
read
ing
Ps m
m o
f
Hg
Delivery
pre
ssu
re
read
ing
Pd
kg
/ c
m2
S.N
o

4. OUTPUT POWER:
Where,
5. EFFICIENCY:
DESCRIPTION:
Po = W Qact H /1000 (watts)
W = Specific weight of oil (N / m³)
Qact = Actual discharge (m³ / s)
h = Total head of oil (m)
% = (Output power Po / input power Pi) 100
The gear oil pump consists of two identical intermeshing spur wheels working with a
fine clearance inside the casing. The wheels are so designed that they form a fluid tight joint
at the point of contact. One of the wheels is keyed to driving shaft and the other revolves
as the driven wheel.
The pump is first filled with the oil before it starts. As the gear rotates, the oil is
trapped in between their teeth and is flown to the discharge end round the casing. The
rotating gears build-up sufficient pressure to force the oil in to the delivery pipe.
PROCEDURE:
1. The gear oil pump is stated.
2. The delivery gauge reading is adjusted for the required value.
3. The corresponding suction gauge reading is noted.
4. The time taken for ‘N’ revolutions in the energy meter is noted with the help of a
stopwatch.
5. The time taken for ‘h’ rise in oil level is also noted down after closing the gate
valve.
6. With the help of the meter scale the distance between the suction and delivery
gauge is noted.
7. For calculating the area of the collecting tank its dimensions are noted down.
8. The experiment is repeated for different delivery gauge readings.
9. Finally the readings are tabulated.
GRAPH:
1. Actual discharge Vs Total head
2. Actual discharge Vs Efficiency
3. Actual discharge Vs Input power
4. Actual discharge Vs Output power
MODEL CALCULATION:
RESULT:
Thus the performance characteristic of gear oil pump was studied and maximum
efficiency was found to be. ………%.

PE
LT
ON
WH
EE
L T
UR
BIN
E T
ES
T R
IG

CONDUCTING EXPERIMENTS AND DRAWING THE
CHARACTERISTICS CURVES OF PELTON WHEEL TEST RIG AIM:
To conduct load test on pelton wheel turbine and to study the characteristics of pelton
wheel turbine.
APPARATUS REQUIRED:
1. Venturimeter
2. Stopwatch
3. Tachometer
4. Dead weight
FORMULAE:
1. VENTURIMETER READING:
h = (P1 ~ P2) 10 (m of water)
Where, P1, P2 - Venturimeter reading in Kg /cm2
2. DISCHARGE:
Q = 0.0055 h (m3 / s)
3. BRAKE HORSE POWER:
BHP = ( x D x N x T) / (60 75) (hp) Where,
N = Speed of the turbine in (rpm)
D = Effective diameter of brake drum = 0.315 m
T = Torsion in To + T1 - T2 (Kg)
4. INDICATED HORSE POWER:
IHP = (1000 Q H) / 75 (hp) Where,
H = Total head (m)
5. PERCENTAGE EFFICIENCY:
% = (B.H.P / I.H.P x 100) (%)
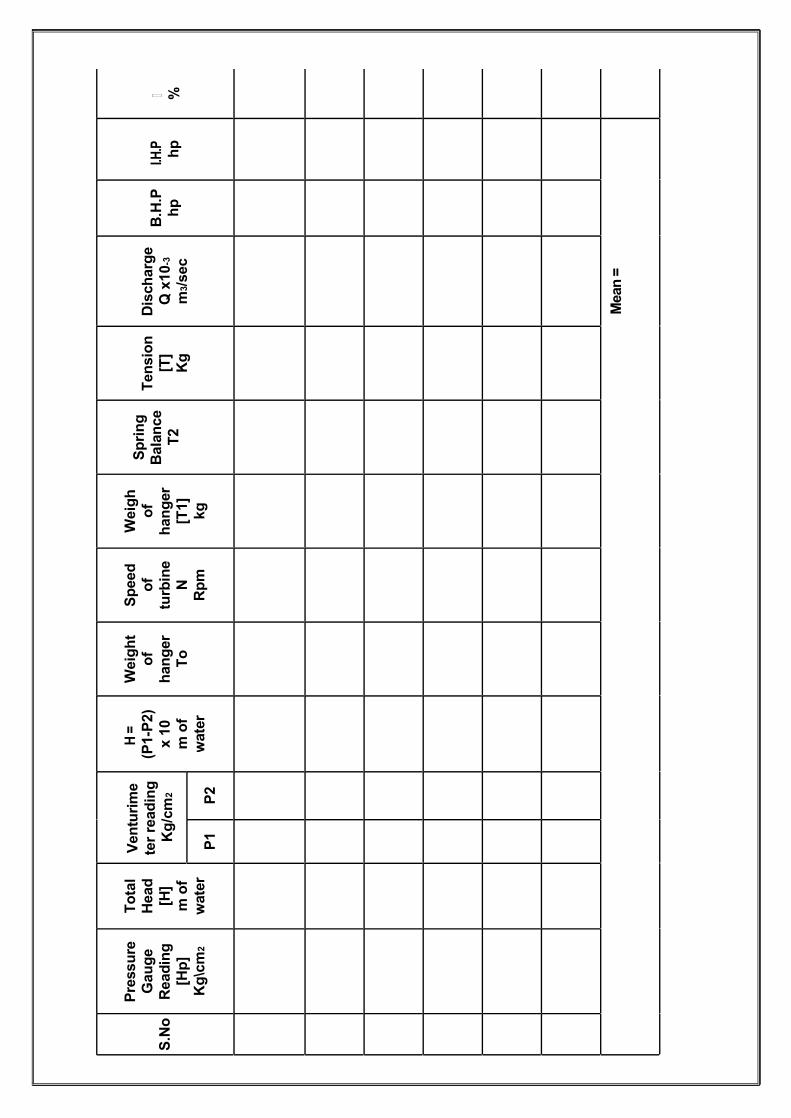
%
I.H.P
hp
Mean =
B.H
.P
hp
Dis
ch
arg
e
Q x
10
-3
m3/s
ec
Ten
sio
n
[T]
Kg
Sp
rin
g
Bala
nce
T2
Weig
h
of
han
ger
[T1]
kg
Sp
eed
of
turb
ine
N
Rp
m
Weig
ht
of
han
ger
To
H =
(P1-P
2)
x 1
0
m o
f
wate
r
Ven
turi
me
ter
read
ing
Kg
/cm
2
P2
P1
To
tal
Head
[H]
m o
f
wate
r
Pre
ssu
re
Gau
ge
Read
ing
[Hp
]
Kg
\cm
2
S.N
o
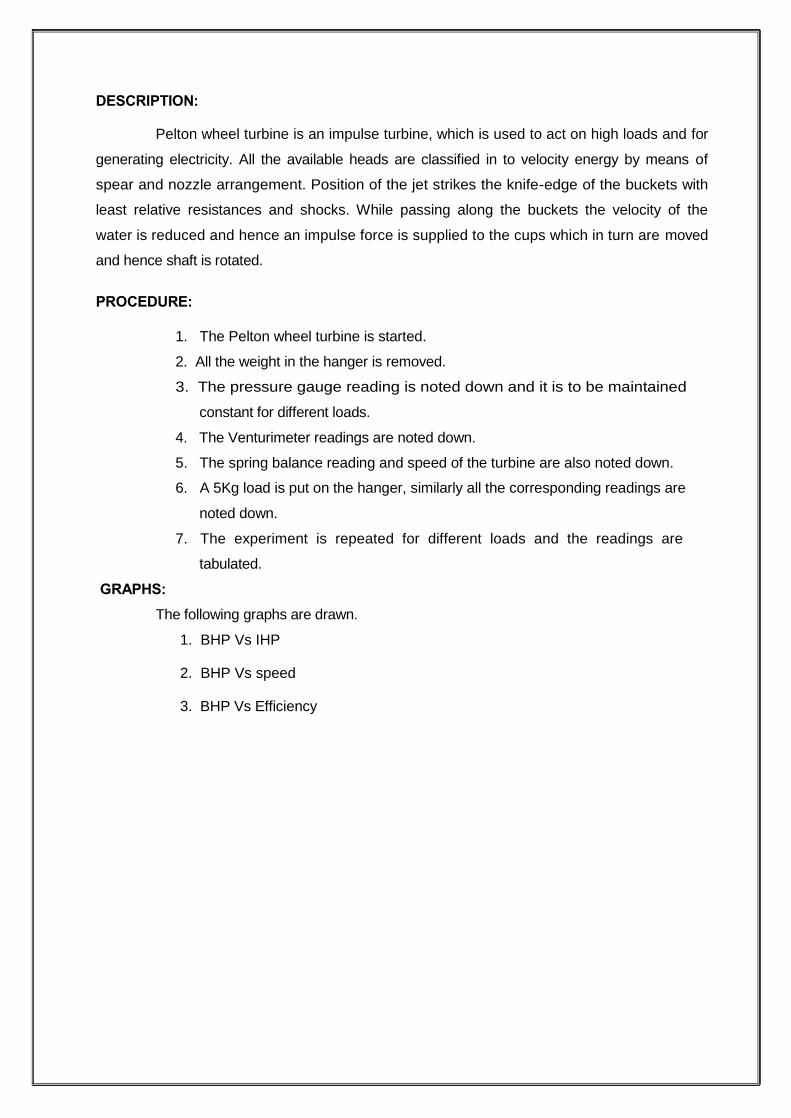
DESCRIPTION:
Pelton wheel turbine is an impulse turbine, which is used to act on high loads and for
generating electricity. All the available heads are classified in to velocity energy by means of
spear and nozzle arrangement. Position of the jet strikes the knife-edge of the buckets with
least relative resistances and shocks. While passing along the buckets the velocity of the
water is reduced and hence an impulse force is supplied to the cups which in turn are moved
and hence shaft is rotated.
PROCEDURE:
1. The Pelton wheel turbine is started.
2. All the weight in the hanger is removed.
3. The pressure gauge reading is noted down and it is to be maintained
constant for different loads.
4. The Venturimeter readings are noted down.
5. The spring balance reading and speed of the turbine are also noted down.
6. A 5Kg load is put on the hanger, similarly all the corresponding readings are
noted down.
7. The experiment is repeated for different loads and the readings are
tabulated.
GRAPHS:
The following graphs are drawn.
1. BHP Vs IHP
2. BHP Vs speed
3. BHP Vs Efficiency

MODEL CALCULATION:
RESULT:
Thus the performance characteristic of the Pelton Wheel Turbine is done and the
maximum efficiency of the turbine is ………. %
FR
AN
CIS
TU
RB
INE
TE
ST
RIG

CONDUCTING EXPERIMENTS AND DRAWING THE
CHARACTERISTICS CURVES OF FRANCIS TURBINE TEST RIG
AIM:
To conduct load test on Francis turbine and to study the characteristics of Francis
turbine.
APPARATUS REQUIRED:
1. Stop watch
2. Tachometer
FORMULAE:
1. VENTURIMETER READING:
h = (p1 - p2) x 10 (m)
Where
P1, P2- Venturimeter readings in kg /cm2
2. DISCHARGE:
Q = 0.011 x h (m3 / s)
3. BRAKE HORSEPOWER:
BHP = x D x N x T / 60 x 75 (hp)
Where
N = Speed of turbine in (rpm)
D = Effective diameter of brake drum = 0.315 m T
= torsion in [kg]
4. INDICATED HORSEPOWER:
HP = 1000 x Q x H / 75 (hp)
Where
H = Total head in (m)
5. PERCENTAGE EFFICIENCY:
% = B.H.P x 100 / I.H.P (%)

%
I.H.P
hp
Mean
=
B.H
.P
hp
Dis
ch
arg
e
Q x
10
-3
m3\s
ec
Ten
sio
n
[T]
Kg
Sp
rin
g
Bala
nce
T2
Weig
h o
f
han
ger
[T1]
kg
Sp
eed
of
turb
ine
N
Rp
m
Weig
ht
of
han
ger
To
Kg
H =
(P1-P
2)
x
10
m o
f w
ate
r
Ven
turi
m
ete
r
read
ing
Kg
\cm
2
P2
P1
To
tal
Head
[H]
m o
f
wate
r
Pre
ssu
re
Gau
ge
Read
ing
[Hp
]
Kg
/cm
2
H2
H1
S.N
o

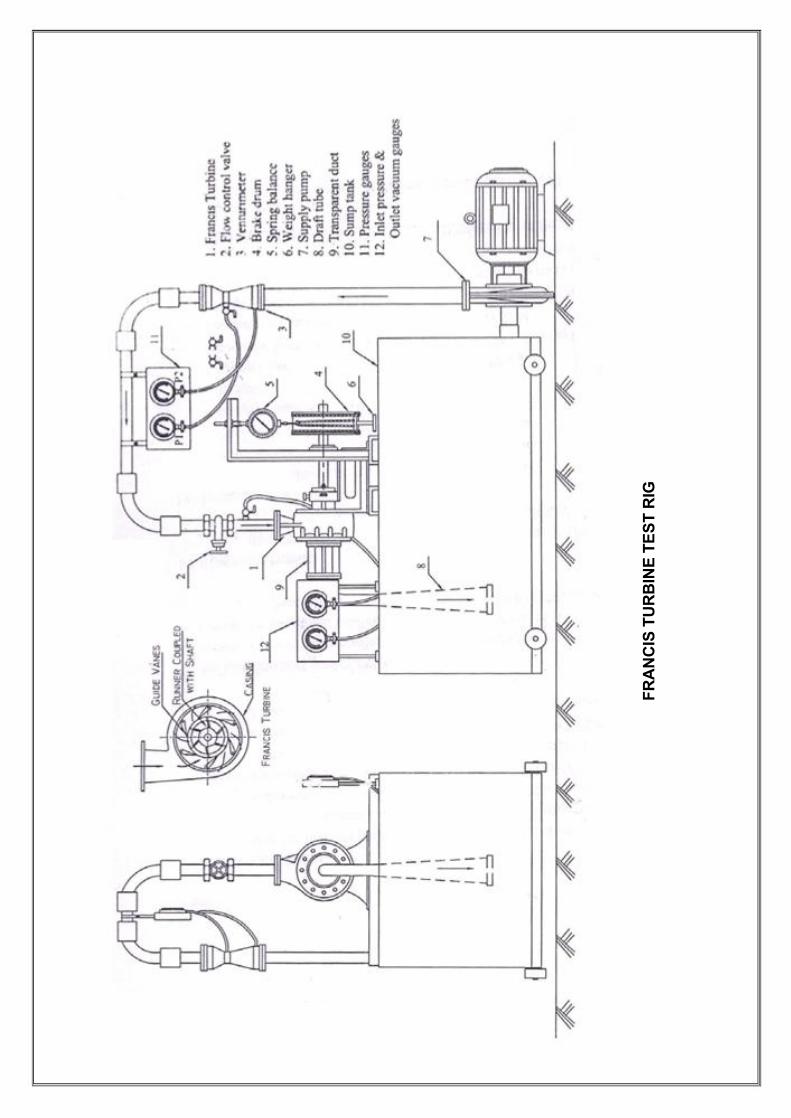
DESCRIPTION:
Modern Francis turbine in an inward mixed flow reaction turbine it is a medium head
turbine. Hence it required medium quantity of water. The water under pressure from the
penstock enters the squirrel casing. The casing completely surrounds the series of fixed
vanes. The guides’ vanes direct the water on to the runner. The water enters the runner of the
turbine in the dial direction at outlet and leaves in the axial direction at the inlet of the
runner. Thus it is a mixed flow turbine.
PROCEDURE:
1. The Francis turbine is started
2. All the weights in the hanger are removed
3. The pressure gauge reading is noted down and this is to be
Maintained constant for different loads
4. Pressure gauge reading is ascended down
5. The Venturimeter reading and speed of turbine are noted down
6. The experiment is repeated for different loads and the readings are tabulated.
GRAPHS:
The following graphs are drawn
1. BHP (vs.) IHP
2. BHP (vs.) speed
3. BHP (vs.) % efficiency

MODEL CALCULATION:
RESULT:
Thus the performance characteristic of the Francis wheel turbine is done and the
maximum efficiency of the turbine is …………. %
KA
PL
AN
TU
RB
INE
TE
ST
RIG

CONDUCTING EXPERIMENTS AND DRAWING THE
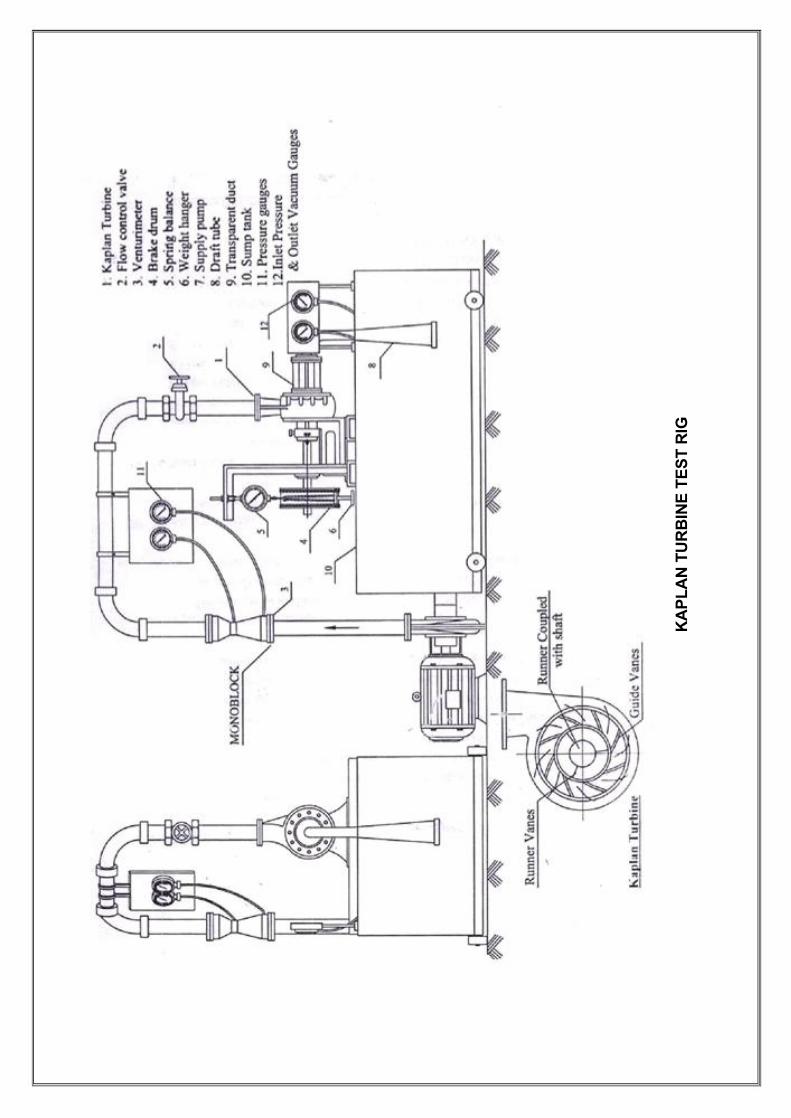
CHARACTERISTICS CURVES OF KAPLAN TURBINE TEST RIG
AIM:
To study the characteristics of a Kaplan turbine
APPARATUS REQUIRED:
1. Venturimeter
2. Stopwatch
3. Tachometer
4. Dead weight
FORMULAE:
1. VENTURIMETER READING:
h = (P1 ~ P2) 10 (m of water) Where,
P1, P2 - Venturimeter reading in Kg /cm2
2. DISCHARGE:
Q = 0.0055 h (m3 / s)
3. BRAKE HORSE POWER:
BHP = ( x D x N x T) / (60 75) (hp) Where,
N = Speed of the turbine in (rpm)
D = Effective diameter of brake drum = 0.315 m
T = Torsion in To + T1 - T2 (Kg)
4. INDICATED HORSE POWER:
IHP = (1000 Q H) / 75 (hp) Where,
H = Total head (m)
5. PERCENTAGE EFFICIENCY:
% = (B.H.P / I.H.P x 100) (%)

%
I.H.P
hp
Mean =
B.H
.P
hp
Dis
ch
arg
e
Q x
10
-3
m3/s
ec
Ten
sio
n
[T]
Kg
Sp
rin
g
Bala
nce
T2
Weig
h
of
han
ger
[T1]
kg
Sp
eed
of
turb
ine
N
Rp
m
Weig
ht
of
han
ger
To
H =
(P1-P
2)
x 1
0
m o
f
wate
r
Ven
turi
me
ter
read
ing
Kg
/cm
2
P2
P1
To
tal
Head
[H]
m o
f
wate
r
Pre
ssu
re
Gau
ge
Read
ing
[Hp
]
Kg
\cm
2
S.N
o

DESCRIPTION:
Kaplan turbine is an axial flow reaction turbine used in dams and reservoirs of low
height to convert hydraulic energy into mechanical and electrical energy. They are best
suited for low heads say from 10m to 5 m. the specific speed ranges from 200 to 1000
The flow through the pipelines into the turbine is measured with the office meter fitted in
the pipeline. A mercury manometer is used to measure the pressure difference across the
orifice meter. The net pressure difference across the turbine output torque is measured with a
pressure gauge and vacuum gauge. The turbine output torque is determined with the rope
brake drum. A tachometer is used to measure the rpm.
EXPERIMENTAL PROCEDURE:
1. Keep the runner vane at require opening
2. Keep the guide vanes at required opening
3. Prime the pump if necessary
4. Close the main sluice valve and they start the pump.
5. Open the sluice valve for the required discharge when the pump motor switches
from star to delta mode.
6. Load the turbine by adding weights in the weight hanger. Open the brake drum
cooling water gate valve for cooling the brake drum.
7. Measure the turbine rpm with tachometer
8. Note the pressure gauge and vacuum gauge readings
9. Note the orifice meter pressure readings.
Repeat the experiments for other loads GRAPHS:
The following graphs are drawn.
1. BHP Vs IHP
2. BHP Vs speed
3. BHP Vs Efficiency

MODEL CALCULATION:
RESULT:
Thus the performance characteristic of the Kaplan Turbine is done and the
maximum efficiency of the turbine is ………. %