iii - cmrpc
TRANSCRIPT

HIGHWAY
III

III-1
III. REGIONAL HIGHWAY SYSTEM A. GUIDING PRINCIPLES The Safe, Accountable, Flexible, Efficient Transportation Equity Act: A Legacy for Users (SAFETEA-LU) was signed into law in August 2005. SAFETEA-LU furthers the spirit of previous legislation that has governed the highway planning activities of the CMMPO since 1991. The new national law refines and continues important planning concepts such as safety, geographic equity, innovative finance, congestion relief, mobility and productivity, efficiency, and environmental quality. At the state level, the Commonwealth of Massachusetts established the principles of “Fix it First” and “Communities First” in its Statewide Road and Bridge Policy. “Fix it First” stipulates that priority be given to the repair of existing roadways and bridges. “Communities First” insists upon collaboration with communities in order to design context-sensitive roadway and bridge projects. According to the policy statement, context-sensitive projects are expected to “protect and enhance the surrounding community and landscape while addressing mobility for all transportation modes.” Both the federal and state policies are reflected in the CMMPO 2007 RTP Vision Statement, Goals, and Objectives, many of which are especially relevant to the regional highway system and have been developed into the following guiding principles:
• Improved safety: The CMMPO seeks to identify and improve critical locations of safety concern within the region in order to assist in the statewide goal of achieving a 20% reduction in the number of injuries and fatalities occurring as people and freight move throughout the Commonwealth’s transportation system.
• Better maintenance: The CMMPO aims to define and maintain acceptable conditions and
optimal functionality of the region’s transportation assets. • Reduced traffic congestion: The CMMPO recognizes that minimal traffic congestion
leading to improved air quality is essential for the livability of the region’s communities.
• Context-sensitive design: The CMMPO supports the definition of context-sensitive design as presented in MassHighway’s Project Development & Design Guidebook: “a collaborative, interdisciplinary approach that involves all constituents to develop a transportation facility that fits its physical setting and preserves scenic, aesthetic, historic and environmental resources, while maintaining safety and mobility for all users.”
• Application of technology to improve efficiency and connectivity. The CMMPO intends to
explore alternative, creative transportation methods that integrate multiple travel modes through the use of technology to safely and efficiently move people between homes, jobs, and services and move products between places of manufacture and sale.

Figure III-1 The Region's Interstate, U.S. and State Numbered Routes
Information depicted on this map is for planning purposes only.This information is not adequate for legal boundary definition,regulatory interpretation, or parcel-level analysis. Use cautionintrepreting positional accuracy.
Produced by the GIS Center atCentral Massachusetts Regional Planning Commission.35 Harvard Street, Second Floor, Worcester, MA 01609-2801
5
LegendTown BoundaryMass TurnpikeInterstateU.S. RouteState Numbered Route
%&l(
]Ç
]Õ
]Ç
]è
]w
]w
]ä
]ì
]ä
]w
]w
]Ï
]è]w
]Ö×
]ë
0 2 4 61Miles
BARRE
PRINCETON
HARDWICK
NEWBRAINTREE
OAKHAM
RUTLAND
PAXTON
HOLDEN
WESTBOYLSTON
WESTBROOKFIELD
WARREN BROOKFIELD
NORTHBROOKFIELD
EAST
BRO
OK
FIEL
D
SPENCER
LEICESTER
STURBRIDGE
SOUTHBRIDGE
DUDLEY
CHARLTON
WEBSTER
OXFORD
DOUGLAS
SUTTON
UXBRIDGE
MIL
LV
ILL
E
BLACKSTONE
NORTHBRIDGE
MENDON
HOPEDALE
UPTON
GRAFTON
MILLBURYAUBURN
WORCESTERSHREWSBURY WESTBOROUGH
NORTHBOROUGH
BERLINBOYLSTON
]Â
]Â
]ë
!"a$Iu
!"$
]Ö
]¾
!"a$!"a$
Iu%&k(
]È
]÷
]Ä
]È
]Ì
]Ì
!"a$Iu
Iu
]Â]Â
]Â%&g(
%&g(%&e(
]Õ
]í %&l(
]Ä
]w ]Õ
]Õ
]Ç
]Ï
]â
]Ô ]Â
]è
]w
]Â
]w_x
_x
_x
III - 2
Connecticut
Rhode Island

III-3
B. HIGHWAY NETWORK DESCRIPTION B.1 Interstates, US, and State Numbered Routes The highway network in central Massachusetts connects the region’s 40 communities to each other and to major New England cities such as Boston, Providence, Springfield, Hartford and Albany. Interstates 84, 90, 190, 290, 395, and 495, US Route 20, and State Routes 9 and 146 provide the majority of this access. The City of Worcester and the Towns of Auburn, Millbury, and Sturbridge house the major crossroads of these facilities within the region while a string of I-495 interchanges along the eastern edge of the region continue to attract significant traffic from Central Massachusetts. Figure III-1 shows the region’s Interstate, US, and State Numbered Highways. B.2 National Highway System (NHS) The National Highway System (NHS) is an interconnected network of principal arterial routes that serve major population centers, international border crossings, seaports, airports, public transportation facilities, intermodal freight facilities, and major travel destinations. Established through a cooperative effort between state, regional, and local officials, the NHS also meets national defense requirements and serves interstate and interregional travel. Mandated by the Intermodal Surface Transportation Efficiency Act of 1991 (ISTEA), the NHS was officially designated on September 30, 1995. NHS roadways in the Central Massachusetts region are shown in Figure III-2. As required, all Eisenhower National System of Interstate and Defense Highways, commonly known as the Interstate Highway System, are included in the NHS. In the region these facilities include I-84, I-190, I-290, I-395, and I-495. The Massachusetts Turnpike, I-90, a toll road, is also part of the NHS. U.S. Route 20 through the region is part of the system of United States Numbered Highways, often called U.S. Routes or U.S. Highways. Although the Interstate Highway System has largely replaced the U.S. Highways for through traffic, these facilities continue to serve critical regional connections. As such, U.S. Route 20 between I-395 and I-495 is part of the NHS. Further, State Route 9 and State Route 146, in their entirety, are included in the NHS network. As indicated on the figure, a number of other roadways are also identified as part of the NHS as they provide critical connections to downtown Worcester, various intermodal facilities for both passengers and freight as well as other major travel destinations. B.2.1 High Priority Corridors on the NHS From a wider perspective, the CMMPO is also cognizant of the “High Priority Corridors” on the NHS established under SAFETEA-LU. Although none of the High Priority Corridors are in Massachusetts, those identified in the greater New England and New York area have the potential to impact the region in regards to passenger movement, freight flows and evacuation routes. Some of the identified corridors also have the potential to expand into Massachusetts in the future. The High Priority Corridors in the greater area as included in SAFETEA-LU are as follows:
• The Interstate Route 87 Corridor from New York City to the Quebec border • The Interstate Route 95 Corridor in Connecticut beginning at the New York state line through
Connecticut to the Rhode Island state line. • The Interstate Route 91 Corridor from New Haven, CT, through Hartford to the Massachusetts
state line.

III-4
• The East-West Corridor commencing in Watertown, New York, continuing northeast through New York, Vermont, New Hampshire, and Maine, terminating in Calais, Maine.
• The Providence Beltline Corridor beginning at Interstate Route 95 in the vicinity of Hope Valley, RI, traversing eastwardly intersecting and merging into Interstate Route 295, continuing northeastwardly along Interstate Route 95, and terminating at the Massachusetts border. This identified corridor also includes the western bypass of Providence, RI, from Interstate Route 295 to the Massachusetts border.
B.2.2 NHS Connectors Through earlier freight planning work conducted by the CMRPC transportation staff, major intermodal terminals in the region serving freight and passengers were identified. The identified facilities were subsequently included in a statewide compilation entitled Major Intermodal Terminals Qualified for Connection to the National Highway System. As a result of this effort, the major roadways that provide “to the gate” access to the region’s identified major intermodal terminals and the greater NHS network were recognized as “NHS Connectors,” also included in Figure III-2. The major intermodal terminals that serve freight and passengers in the region along with brief descriptions of their respective NHS Connectors are summarized below. Town of Westborough
CSX Transportation Auto Yard, rail to truck transfer, Walkup Street: Yard to Walkup St. to Flanders Rd. to Connector Rd. to Lyon St. to Computer Dr. to Route 9 Westbound & Yard to Walkup St. to Flanders Rd. to Connector Dr. to Research Dr. to Route 9 Eastbound
City of Worcester
CSX Transportation, TOFC & bulk commodities terminal, rail to truck transfer, Franklin Street: Yard to Franklin St. to Grafton St. to I-290 interchange
P&W Railroad Yard/Intransit Container, rail to truck transfer, Southbridge Street: Yard to Southbridge St. to Cambridge St. & Yard to Southbridge St. to Quinsigamond Ave. to I-290/State Route 146 interchange
P&W Railroad Yard/Intransit Container, rail to truck transfer, Wiser Avenue: Yard to Blackstone River Road (formerly Millbury Street) northbound to State Route 146 interchange
Worcester Regional Airport, passenger & air freight facility, Airport Drive: Highland Street from the intersection of Park Avenue (Routes 9, 12 and 122A) to Pleasant Street to Airport Drive, terminating at Goddard Memorial Drive

III-5
B.2.3 Other Potential NHS Connectors As growth and change continue in the Central Massachusetts region, it may be necessary to designate other roadways as NHS Connectors. As such, a number of sites where intermodal operations might eventually meet the established NHS Connector criteria have been identified and are summarized below. East Brookfield Flats: During the early 1990’s, CSX Transportation predecessor Conrail purchased a rather large land parcel in an area of town known as the East Brookfield Flats. Adjacent to both the railroad’s Boston Line and State Route 9, it appeared that Conrail had plans for the property. It should be noted, however, that Conrail knowingly purchased the property despite the town of East Brookfield’s by-law prohibiting both Container on Flatcar (COFC) and Trailer on Flatcar (TOFC) terminal operations. In the future, the “Flats” could again face development pressures or eventually become dedicated open space. MassCentral Railroad’s Ware River Line: Potential site development opportunities adjacent to the MassCentral Railroad’s Ware River Line may include intermodal operations. The Ware River Valley that lies in both the CMRPC and PVPC planning regions has experienced fairly depressed economic conditions. The asset of the rail line, owned in large part by EOT since the mid-1970’s and leased to operator MassCentral, has the potential to attract rail served business and industry. MassCentral’s intermodal operations in Palmer, which have steadily declined in recent years, may have the potential for increased utilization. The MassCentral’s interchange with both CSX and the New England Central Railroad (formerly Central Vermont) may result in the future growth of intermodal operations. New England Automotive Gateway: The focus of this major intermodal facility is transloading new vehicles from railcars to car carrier trucks for final distribution to retail dealerships. Following over 15 years of planning, the construction of this facility was completed in late 2004 and began receiving the first shipments of new vehicles. A spur from CSX Transportation’s Boston Line provides rail access to the site while a site drive situated on Route 49 south of Route 9 provides highway access. Most car carrier trucks using the facility travel south on Route 49 to the U.S. Route 20, I-84, MassPike (I-90) interchange in Sturbridge. The rail spur serves six (6) yard tracks that have a total capacity of 30 rail cars. Paved parking areas nearly 35 acres in size accommodate the off-loaded vehicles and the car carrier trucks that provide final distribution to the greater region. Potential future plans for the site include a modest sized business park, perhaps accommodating automotive-related activities. Southbridge Municipal Airport: Starting in the late 1990’s, Southbridge Municipal Airport upgraded access roadways, vehicle parking and various aircraft facilities, including tie downs, additional hangar space and aircraft fuel storage/distribution systems. The airport facility has the capacity for increased utilization, perhaps including cargo operations. Currently, the community expects to begin work on a long-planned access road to the airport from Route 169. The construction of a new access road is expected to shift a fair volume of traffic away from resident Pleasant Street that provides access to the Airport. Further, an office/industrial park has also been proposed adjacent to Southbridge Municipal Airport.

]Ö
}
%&l(
!"a$
ß¾Ö
à
Þ]Ä
]Ä
¾!"$
Iu
!"a$
Ö]Õ
]ë
]âÏ
]Ê]ë
]Â
]Â
]Â
w
]Ä
]Õ
Ï
×
]Ö
w
]Ö
w
]Öa
]º
]ì
]ä
]Ä
]Õ
]í
]í
%&e(r
r
]õ
Ç
]¹
]¹
k
j
j
]è
]è
]ì
]Ä
]Ä j
]Â
]Õ
]Ô]õ
]ä
]í
Ç
%&e(
%&g(_x
_x
w
%&l(
]Â
]Â
Â
Iu
Iu
]ÔÇ
w%&g(
%&k(
!"a$
!"a$
_x
%&l(Ç
w
w
Ì
]È
Ì
]÷
]È
Figure III-2 Vital Transportation Links
Information depicted on this map is for planning purposes only.This information is not adequate for legal boundary definition,regulatory interpretation, or parcel-level analysis. Use cautionintrepreting positional accuracy.
Produced by the GIS Center atCentral Massachusetts Regional Planning Commission.35 Harvard Street, Second Floor, Worcester, MA 01609-2801
5
LegendCMRPC Region Boundary2000 Census: Urban AreaNational Highway System (NHS)Vital Transportation LinksFederal Aid Eligible Road
0 2 4 61Miles
BARRE
PRINCETON
HARDWICK
NEWBRAINTREE
OAKHAM
RUTLAND
PAXTON
HOLDEN
WESTBOYLSTON
WESTBROOKFIELD
WARREN BROOKFIELD
NORTHBROOKFIELD
EASTBROOKFIELD
SPENCER
LEICESTER
STURBRIDGE
SOUTHBRIDGE
DUDLEY
CHARLTON
WEBSTER
OXFORD
DOUGLAS
SUTTON
UXBRIDGE MILLVILLE
BLACKSTONE
NORTHBRIDGE
MENDON
HOPEDALE
UPTON
GRAFTON
MILLBURYAUBURN
WORCESTERSHREWSBURY WESTBOROUGH
NORTHBOROUGH
BERLINBOYLSTON
III - 6
ConnecticutRhode Island
Link to be Considered

III-7
B.3 CMMPO Vital Links As noted in Chapter I, the CMMPO developed a number of goals and objectives for this plan, including the following: “Identify the most vital transportation links for the region so that regional significance can be better incorporated in the prioritization and selection of transportation improvement projects.” All roadways designated as part of the NHS were designated by the CMMPO as Vital Links. In addition, the following criteria were utilized by both the Central Massachusetts Transportation Planning Committee (CMTPC) and the CMMPO to identify additional Vital Links:
• Is the roadway eligible to receive Federal-Aid funding? • What is the functional classification of the roadway? • Will the roadway enhance connectivity to the NHS? • Will the roadway provide connectivity to major intermodal centers not currently served by
the NHS? • Is the roadway within or does it connect to roadways within the 2000 Census Urban Area? • Does the roadway enhance regional mobility? (east-west, north-south, etc.) • Are the traffic volumes significant within the area served by the roadway? • Are Town Centers connected to the Vital Links network? • Are there parallel facilities that perform similar linkages and may eliminate some roadways
as Vital Links? The resulting Vital Links are depicted in Figure III-2. These Vital Links are intended to assist the CMMPO in measuring the regional significance of transportation improvement project choices. The CMMPO does not feel that identifying a roadway as a vital link should be used to preclude federal funding of projects on other roadways, but that it should be used as one of several criteria considered when projects are being prioritized for federal funding.

III-8
C. THE HIGHWAY IMPROVEMENT PROCESS C.1 Federal-Aid Eligibility Federal-aid eligibility is primarily determined by functional classification. Functional classification is the process by which streets and highways are grouped into classes, or systems, according to the character of service they provide. The highway network plays a dual service role by providing access to property and facilitating travel mobility. Streets and highways are subdivided into three general classifications: local, collector and arterial. The primary function of local facilities is access to properties, especially housing. In contrast, arterials provide high mobility to serve through movements. Collectors serve as connections between local and arterial facilities. When optimally designed, they provide a balance between property access and through mobility. All sections of roadway that are classified in rural areas as a major collector or higher, and in urban areas, as a minor collector or higher, are eligible to receive federal funding for transportation improvements. Many federal-aid eligible roadways are designated as part of the National Highway System (NHS). Funding associated with the NHS allows construction of projects on non-NHS highways, as well as the construction of any transit project that is eligible under the Federal Transit Act. However, this eligibility requires the project in question to be located within the corridor of a fully access-controlled NHS facility, to improve the level of service of the NHS facility, and to be more cost-effective than an improvement to the NHS facility. Improvements to non-NHS roadways that are federal-aid eligible are funded through the Surface Transportation Program (STP). SAFETEA-LU allows much flexibility with regard to STP funding as these funds may be used for projects on any federal-aid highway, including the NHS, bridge projects on any public road, and transit capital projects, such as public bus terminals and facilities. SAFETEA-LU expands STP eligibilities to include advanced truck stop electrification systems, high crash/high congestion intersections, and environmental restoration and pollution abatement, such as control of noxious weeds and aquatic noxious weeds and reestablishment of native species. Each state must set aside a portion of their STP funds (10 percent or the amount set aside in 2005, whichever is greater) for transportation enhancements activities. The set-aside of 10 percent previously required for safety construction activities (i.e., hazard elimination and highway-rail crossing improvements) was eliminated in 2006, as these activities are funded separately under the new Highway Safety Improvement Program. C.2 Funding Projects through the Transportation Improvement Program (TIP) The region’s Transportation Improvement Program, commonly referred to as the “TIP,” is a federally required planning document that lists all highway, bridge, transit and intermodal projects in the Central Massachusetts planning region that are programmed to receive federal-aid funding. In the most current TIP, projects are listed for federal fiscal years 2007 through 2010. Projects of regional & statewide significance, such as the Route 146 major infrastructure improvement project, as well as projects that improve air quality are also listed in the TIP document. Non federal-aid (NFA), or state-funded, projects are included as well. Cognizant of limited statewide transportation funding resources, the annual program of projects must demonstrate financial constraint within the federal-aid funding targets established for each of the MPO regions by the Executive Office of Transportation (Office of Transportation Planning).

III-9
The CMRPC transportation staff, working on behalf of the CMMPO, revises the TIP project listing on an annual basis. The annual process has traditionally begun by soliciting project proposals from the region’s communities. In order to be considered, project requests must come from the community’s highest elected official. During the 2006 Program Year, the community outreach process for TIP development was modified. In advance of the more formal solicitation of community officials, a TIP Needs Survey was deployed to the region’s Highway Superintendents, Department of Public Works (DPW) Directors, Town Planners, and Town Engineers. Information on federal-aid eligibility and the TIP development process was provided in the survey package, and respondents were asked to identify and describe their community’s highway and bridge improvement needs. Following the survey, six (6) TIP Information Workshops were held within each of the planning subregions. At the workshops, community officials were further educated on the TIP development process, were provided with the opportunity to get their questions answered, were informed of the important role of the community in project development, and were introduced to the new MassHighway Project Need Form as well as the Transportation Evaluation Criteria effort. After project proposals are formally submitted by the community’s highest elected official, project proposals are screened by the CMMPO and further evaluated by the Central Massachusetts Transportation Planning Committee (CMTPC), which acts as the technical transportation advisory group to the CMMPO. The prioritization process combines an exchange of project information and evaluation of project importance. An established set of Transportation Evaluation Criteria (TEC) is considered for each eligible project. The CMRPC transportation staff, working with the MassHighway District #2 & #3 offices and the Office of Transportation Planning, accumulates engineering design, right-of-way and environmental status information for each TIP project. If necessary, appropriate community personnel and/or engineering consultants are also contacted to obtain design status updates. Throughout the development of the TIP, the CMMPO oversees an extensive outreach effort that provides ample opportunity for public involvement. Usually commencing in February, the TIP development process culminates in August when the CMMPO convenes to endorse the finalized project listing. At that time, the CMMPO Endorsed TIP is forwarded to EOT and the Office of Transportation Planning where it is combined with the TIPs produced by all of the MPOs throughout the state. The resulting document, referred to as the State Transportation Improvement Program (STIP), is forwarded to the Federal Highway Administration (FHWA), the Federal Transit Administration (FTA) and the Environmental Protection Agency (EPA) for approval. Only after obtaining this approval can federal-aid transportation funds be made available to construct the projects included in the TIP. C.3 Maintenance Responsibility As indicated in Figure III-3, a significant portion of the federal-aid eligible roadway network is maintained by the region’s communities. The interstate highways and a number of major state-numbered routes are maintained by MassHighway or the Massachusetts Turnpike Authority. Maintenance responsibilities include ensuring usable and safe pavement condition, clearing snow and ice, cleaning drainage structures, and repairing sidewalks and shoulders. While the need for an improvement project may be identified by a number of entities, including the CMMPO, the entity responsible for maintaining the facility is also responsible for designing federally-funded improvement projects along that facility. Along with design, this responsibility also includes

III-10
acquiring the necessary right-of-way and obtaining all required permits. The ability to address these preliminary tasks varies considerably between communities, with many smaller communities at a disadvantage, resulting in some projects languishing within the TIP process for a number of years. For bridges, MassHighway is responsible for the reconstruction or replacement of bridges over 20 feet in length. Bridge maintenance responsibility is depicted in Figure III-3, which also illustrates bridge condition information. The statewide bridge management program includes inspections on all publicly-owned bridges. For those less than 20 feet in length, reports are provided to the owner of the bridge, often a city or town. C.4 Massachusetts Project Development & Design Guide As part of the implementation of “Communities First,” MassHighway developed the Project Development and Design Guide. This document replaces the former Design Guide (Blue Book), incorporates context sensitive solutions, and addresses all travel modes throughout the design process. The following are the Guiding Principles for the Project Development and Design Guide1:
• Multimodal Consideration — to ensure that the safety and mobility of all users of the transportation system (pedestrians, bicyclists and drivers) are considered equally through all phases of a project so that even the most vulnerable (e.g., children and the elderly) can feel and be safe within the public right of way. This includes a commitment to full compliance with sate and federal accessibility standards for people with disabilities.
• Context Sensitive Design — to incorporate, throughout project planning, design, and construction, the overarching principles of Context Sensitive Design (a collaborative, interdisciplinary approach that involves all constituents to develop a transportation facility that fits its physical setting and preserves scenic, aesthetic, historic and environmental resources, while maintaining safety and mobility for all users).
• A Clear Project Development Process — to establish a clear and transparent project development and design process that can be administered consistently throughout the state. The ideal is a process that results in project consensus among constituents which can be expeditiously accomplished within reasonable project cost.
The Project Development and Design Guide went into effect on January 1, 2006 and can be accessed online at http://www.vhb.com/mhdGuide/mhd_GuideBook.asp.
1 MassHighway, Project Development and Design Guide, January 2006: I-2.

Figure III-3 Maintenance Responsibility of Federal-Aid Highways
Information depicted on this map is for planning purposes only.This information is not adequate for legal boundary definition,regulatory interpretation, or parcel-level analysis. Use cautionintrepreting positional accuracy.
Produced by the GIS Center atCentral Massachusetts Regional Planning Commission.35 Harvard Street, Second Floor, Worcester, MA 01609-2801
5
LegendCMRPC Region Boundary2000 Census: Urban Area
Maintenance ResponsibilityMassachusetts Turnpike AuthorityMassachusetts Highway DepartmentCity or Town accepted
%&l(
]Ç
]Õ
]Ç
]è
]w
]w
]ä
]ì
]ä
]w
]w
]Ï
]è]w
]Ö×
]ë
0 2 4 61Miles
BARRE
PRINCETON
HARDWICK
NEWBRAINTREE
OAKHAM
RUTLAND
PAXTON
HOLDEN
WESTBOYLSTON
WESTBROOKFIELD
WARREN BROOKFIELD
NORTHBROOKFIELD
EASTBROOKFIELD
SPENCER
LEICESTER
STURBRIDGE
SOUTHBRIDGE
DUDLEY
CHARLTON
WEBSTER
OXFORD
DOUGLAS
SUTTON
UXBRIDGE MILLVILLE
BLACKSTONE
NORTHBRIDGE
MENDON
HOPEDALE
UPTON
GRAFTON
MILLBURYAUBURN
WORCESTERSHREWSBURY WESTBOROUGH
NORTHBOROUGH
BERLINBOYLSTON
]Â
]Â
]ë
!"a$Iu
!"$
]Ö
]¾
!"a$!"a$
Iu%&k(
]È
]÷
]Ä
]È
]Ì
]Ì
!"a$Iu
Iu
]Â]Â
]Â%&g(
%&g(%&e(
]Õ
]í %&l(
]Ä
]w ]Õ
]Õ
]Ç
]Ï
]â
]Ô ]Â
]è
]w
]Â
]w_x
_x
_x
III - 11
ConnecticutRhode Island

III-12
D. HIGHWAY CONDITION ASSESSMENT D.1 Transportation Management Systems Transportation management systems are the focus of a number of ongoing planning efforts within the region. Management systems identify issues through a systematic process of data collection and analysis, develop recommendations to address the issues, and monitor the effectiveness of improvement projects after they are implemented. With the passage of the Intermodal Surface Transportation Efficiency Act of 1991 (ISTEA), the CMMPO began to supplement its traffic monitoring program with a regional Congestion Management System (CMS), Pavement Management System (PMS), and Intermodal Management System (IMS), which later became known as “Freight Planning.” In 2004, the Transportation Safety Planning Program was developed as another element of the Transportation Management Systems Program. The goal of the Transportation Management System Program is: to provide timely and comprehensive transportation data in an easily-accessible format to:
1. CMRPC Transportation staff for use in its work program in support of the CMMPO transportation planning process;
2. All CMRPC staff for use in their work activities in support of the agency’s member communities; and
3. CMRPC/CMMPO member communities to enhance their local planning efforts. Toward that end, a number of efforts have been undertaken to integrate and share the information collected through the transportation management systems. In 1998, Community Profiles were prepared for each of the region’s communities. The Community Profiles also offered the opportunity to solicit input regarding the focus locations studied, especially for the CMS program. The Community Profiles described the management system requirements and used maps to depict, for each community, travel-time information, pavement improvement needs, bridge deficiencies, and locations included in MassHighway’s Top 1000 Accident Locations listing. In 2005, the Corridor Profile concept was developed as another method to integrate the management systems. The Corridor Profile correlates the information generated by the transportation management systems along a particular corridor and analyzes performance-based data, recommends short-term operational and physical improvements, and identifies candidates for further study. A third method for system integration that has become a more focused effort is the use of Geographic Information Systems (GIS) technology to maintain, map, and analyze information from the transportation management systems. It is envisioned that the spatial organization and analysis of the transportation performance measures determined by the CMMPO Congestion Management, Pavement Management, Transportation Safety Planning, and Traffic Monitoring programs will be used to support the development of CMMPO TIP project listings and Regional Transportation Plans (RTPs) as well as serve as a resource for other planning activities.

III-13
D.2 Highway Safety Highway safety is widely considered a public health issue. According to the Center for Disease Control (CDC), motor vehicle accidents were the leading cause of death in the United States for people between the ages of 4 and 34 during 2003. The National Safety Council estimates that the cost to society of each motor vehicle fatality is over $3 Million.
In 2004, 55 people died as a result of traffic-related crashes in the CMMPO region2, at a cost to the public of over $165,000 Million.
D.2.1 SAFETEA-LU Emphasis on Safety SAFETEA-LU authorizes a new core federal-aid funding program beginning in FY 2006 to achieve a significant reduction in traffic fatalities and serious injuries on all public roads. It creates a positive agenda for increased safety on our highways by almost doubling the funds for infrastructure safety and requiring strategic highway safety planning, focusing on results. Previous to this legislation, safety programs were typically funded from a set-aside from the Surface Transportation Program. By October 1, 2007, each State must have a Strategic Highway Safety Plan that identifies and analyzes safety problems and opportunities in order to use Highway Safety Improvement Program (HSIP) funds for new eligible activities under 23 USC 148. D.2.2 Massachusetts Statewide Safety Planning Activities In October 2006, Massachusetts completed its Strategic Highway Safety Plan, one year ahead of the deadline established by SAFETEA-LU. The Plan includes a Memorandum of Understanding between the following Federal and State agencies:
• MassHighway • Executive Office of Transportation, Office of Transportation Planning • Registry of Motor vehicle • Governor’s Highway Safety Bureau • Massachusetts State Police • Department of Public Health • Massachusetts Chiefs of Police Association • Joint Committee on Transportation • Massachusetts Association of Regional Planning Agencies • Federal Highway Administration • Federal Motor Carrier Safety Administration • National Highway Traffic Safety Administration
The Plan provides a Vision to “provide the safest roadway system in the country and promote its safe use.” The goal of reversing the increasing trend of traffic-related fatalities and injuries sets the benchmark of reducing the number of lives lost (476) and hospitalizations (5,554) by 20% by 2010.
2 MassHighway, Vehicle Crash Data, 2004.

III-14
The Plan identified a number of emphasis areas, including data systems, at-risk driver behavior, infrastructure, public education and media, safety program management, and higher-risk transportation system users (young drivers, older drivers, pedestrians, bicyclists). Of these, the infrastructure emphasis area is the one that most relates to the work conducted by the MPO transportation planning process. The infrastructure emphasis team reviewed crash and injury data and identified intersection crashes and lane departure crashes as the highest priorities to be addressed in the Plan. Intersection crashes represent 39% of all Massachusetts crashes resulting in incapacitating injuries or fatalities. Of these, approximately 32% of the crashes occurred at intersections controlled with a traffic signal system, 27% at intersections under stop-sign control, 6% at intersection under a different control, and 35% at intersections without any traffic control. MassHighway has traditionally developed a statewide listing of the Top 1000 High-Crash intersections. The most recent list was published utilizing statewide crash data from 1999, 2000, and 2001. CMRPC staff used this listing, among other methods, to identify intersections and other locations within the region to study, improve, and monitor through the CMMPO Transportation Safety Planning Program, further detailed in Section D.2.3 of this RTP. For lane departure crashes, MassHighway participated in a Lead State Initiative, sponsored by the Federal Highway Administration (FHWA). In an effort to further the implementation of the AASHTO Strategic Highway Safety Plan, Massachusetts was chosen as a Lead State to participate in research on FHWA-identified emphasis areas. MassHighway’s research has focused on lane departure crashes, most of which involve vehicles that run off the road or cross the highway centerline. In Massachusetts, lane departure crashes represent 19% of all crashes, cause 25% of all vehicle crash injuries, and produce 46% of all vehicle crash fatalities3. In Central Massachusetts, MassHighway’s research noted that the percentage of lane departure crashes resulting in incapacitating injuries that took place on icy, snowy, or slushy roads was higher than Massachusetts as a whole (19% vs. 12%). Figure III-4 depicts the locations of incapacitating injury lane departure crashes within the region. CMRPC, acting as staff to the CMMPO, partnered with MassHighway to communicate with local police departments, fire departments, and town officials to verify this information and develop improvement strategies. As part of this effort, a meeting was held on November 30, 2006, at which time MassHighway led the forum to solicit input regarding crash locations, contributing factors, and feasible improvements. MassHighway also asked the region to select two corridors for the implementation of Roadway Safety Audits. The audits, performed by MassHighway, will involve research into crash histories and roadway design at each location in an effort to eliminate or reduce the number and impact of the crashes. Utilizing MassHighway’s lane departure research and with input from planning boards, police, fire and Public Works departments, the CMMPO staff selected Interstate 290 in Worcester and the undivided segment of Route 20 in Charlton/Sturbridge for this further study.
3 MassHighway, Massachusetts Lane Departure Crash Data Analysis (2002-2004), January, 2006.

!
!
!
! !
!
!
!
!
!
! !!
!
!
!
!!
!
!!!
!
!
!!
!!
!
!
!
!
!!
!!
!
!
!
!
!
!
!
!
!
!
!
!!
!!
!
!
!!
!! !
!
!!
!!
!
!
!
!
!
!
! !
!
!
!
!
!
!
!
!
!
!
!
!!!
!!
!!
!!
!
! !
!!!!
!!
!
!
!
!
! !!
!
!
!
!
!
!!!
!!
!
!
!!
!!!
!
!
!
!
!
!
!
!
!
!
!
!
!!
!
!!
!!
!
!
!!
!
!
!
!
!!
! !
!
!
!!
!
!
!
!
!!
!
!
!!
!!
!
!!!!
!!!
!
!!!
!
!
! !
!
!
!! !!
!!
!
!!
!!
!
!
!
!
!
!
!!
!!
!!
!
!!! !
!
!!
!
!
!
!
!
!
!!
!
!
!
!
!
!
!!!
!!
!!
!
!
!!
!!!!
!
!
!
!
!
!
!
!!
!
!
!
!
!
!
!
!!
!
!
!!!
!
!
!!!!
!!
!
!!
!
!
!
!
!
!
!
!
!
!!
!
!
!
!
!
!
!
!
!
!
!
!
!
!
!
!
!
!
!
!
!
!
!!
!
!
!!
!
!
!
!
!
!
!
!
!
!
!
!
!
!
!!
!!!
!
!
!!
!
!
!
!
!
Figure III-4 Fatal & Incapacitating Injury Lane Departure Crashes, 2002 - 2004*
Information depicted on this map is for planning purposes only.This information is not adequate for legal boundary definition,regulatory interpretation, or parcel-level analysis. Use cautionintrepreting positional accuracy.
Produced by the GIS Center atCentral Massachusetts Regional Planning Commission.35 Harvard Street, Second Floor, Worcester, MA 01609-2801
5
LegendCMRPC Region
Major RoadsInterstateRural Principal Arterial or Urban Other ExpresswayRural Minor Arterial or Urban Principal ArterialUrban Minor Arterial or Rural Major Collector
Crash Type! Head On ! Run Off Road
%&l(
]Ç
]Õ
]Ç
]è
]w
]w
]ä
]ì
]ä
]w
]w
]Ï
]è]w
]Ö×
]ë
0 2 4 61Miles
BARRE
PRINCETON
HARDWICK
NEWBRAINTREE
OAKHAM
RUTLAND
PAXTON
HOLDEN
WESTBOYLSTON
WESTBROOKFIELD
WARREN BROOKFIELD
NORTHBROOKFIELD
EASTBROOKFIELD
SPENCER
LEICESTER
STURBRIDGE
SOUTHBRIDGE
DUDLEY
CHARLTON
WEBSTER
OXFORD
DOUGLAS
SUTTON
UXBRIDGE MILLVILLE
BLACKSTONE
NORTHBRIDGE
MENDON
HOPEDALE
UPTON
GRAFTON
MILLBURYAUBURN
WORCESTERSHREWSBURY WESTBOROUGH
NORTHBOROUGH
BERLINBOYLSTON
]Â
]Â
]ë
!"a$Iu
!"$
]Ö
]¾
!"a$!"a$
Iu%&k(
]È
]÷
]Ä
]È
]Ì
]Ì
!"a$Iu
Iu
]Â]Â
]Â%&g(
%&g(%&e(
]Õ
]í %&l(
]Ä
]w ]Õ
]Õ
]Ç
]Ï
]â
]Ô ]Â
]è
]w
]Â
]w_x
_x
_x
III - 15
ConnecticutRhode Island
Based on geocoded crashes only. 73% (220 of 302) ofCMRPC incapacitating injury lane departure crashes havesuccessfully geocoded. 74% of Massachusetts incapacitatinginjury lane departure crashes were successfully geocoded.*2004 data based on crash reports submitted to Registry ofMotor Vehicles by 7/16/2005

III-16
D.2.3 CMMPO Transportation Safety Planning Program The CMMPO Transportation Safety Planning Program was developed to improve the safety of region’s infrastructure for use by the traveling public. The program was designed to address multiple modes of travel, develop and monitor improvement strategies, and reduce the number of injuries and fatalities occurring as people and freight move along our region’s transportation system. The program includes six basic program elements, which are intended to address the region’s public roadways, bridges, rail crossings, and sidewalks as well as the manner in which people utilize this infrastructure. The long-term implementation of this program is described in Table III-1. Public and community involvement will be essential to the success of the Transportation Safety Planning Program. Not only is input from the public important in identifying locations where safety needs to be improved, consensus-building outreach activities will also need to be incorporated into each of the program elements to ensure that the best improvement strategies, tailored to local needs, are developed and implemented. In addition, outreach and education efforts to improve driver behavior, of both motorized and non-motorized vehicles, will be pursued where feasible.
Table III-1
Conceptual Transportation Safety Planning Program Schedule
ELEMENT/TASK 2005 2006 2007 2008 2009 20101. Vehicle Crash Analysis & Monitoring Identification of Locations of Concern X X X X X X Analysis of Vehicle Crashes X X X X X X Implementation of Improvement Projects X X X X X X Evaluation of Improvement Effectiveness X X X X X
2. Congestion Management Process Coordination Incorporation of Safety Research into CMP X X X X X Preparation of Corridor Profiles X X X X X X
3. Transit/Pedestrian Interface Assessment Research of Injuries & Fatalities X Evaluation of Bus Stop Conditions X X
4. Bicycle & Pedestrian Facility Planning Identification of Heavy Activity Areas X Research of Injuries & Fatalities X Implementation of Improvement Projects X X Evaluation of Improvement Effectiveness X
5. Collision Prevention (Road Safety Audits) X 6. Public & Community Outreach/Involvement X X X X X X

III-17
D.2.3.1 Vehicle Crash Analysis & Monitoring The Vehicle Crash Analysis & Monitoring element utilizes a management system approach by (1) identifying and refining a listing of locations of safety concern throughout the region; (2) conducting in-depth crash analysis to gain an understanding of vehicle crash trends at those particular locations; (3) suggesting improvements aimed at alleviating recurring incidents; and (4) monitoring the locations to determine the effectiveness of improvements. Activities conducted in an effort to identify locations of safety concern included: a thorough review of MassHighway’s most recent Top 1000 High Crash Locations listing; a 2005 survey of Police Departments within the region; a 2006 survey of Emergency Medical Technicians (EMTs) within the region; a review of previously conducted CMRPC Corridor Planning Studies; and review and consideration of vehicle crash locations recognized in the local media. These efforts resulted in the identification of locations shown in Figure III-5 where in-depth collision analysis has been or will be conducted. Some locations are part of a Corridor Profile; some are isolated locations; while others will be studied to monitor improvements. For further detail on these identification efforts, please refer to the 2006 CMMPO Transportation Safety Planning Program Annual Report. Since 2003, CMRPC has prepared three Preliminary Traffic Studies that have included in-depth crash analyses. The collision research utilized vehicle crash reports obtained at local Police Departments from the most recent three-year period. The 2005 Route 9 (Shrewsbury-Westborough) Corridor Profile and 2006 Route 20 (Auburn-Oxford) Corridor profile also included this level of crash research. Figure III-5 and Table III-2 incorporate the results from those studies along with the results of the 2005 and 2006 Vehicle Crash Analysis & Monitoring efforts. The calculated crash rates for each of these locations, in relation to the MassHighway District 3 average (0.84 crashes per million entering vehicles for signalized intersections, 0.79 crashes per million entering vehicles for unsignalized intersections), are denoted on the map.

]Ö
}
%&l(
!"a$
ß¾Ö
à
Þ]Ä
]Ä
¾!"$
Iu
!"a$
Ö]Õ
]ë
]âÏ
]Ê]ë
]Â
]Â
]Â
w
]Ä
]Õ
Ï
×
]Ö
w
]Ö
w
]Öa
]º
]ì
]ä
]Ä
]Õ
]í
]í
%&e(r
r
]õ
Ç
]¹
]¹
k
j
j
]è
]è
]ì
]Ä
]Ä j
]Â
]Õ
]Ô]õ
]ä
]í
Ç
%&e(
%&g(_x
_x
w
%&l(
]Â
]Â
Â
Iu
Iu
]ÔÇ
w%&g(
%&k(
!"a$
!"a$
_x
%&l(Ç
w
w
Ì
]È
Ì
]÷
]È
#
###
#
##
#
###
###
###
#
#
#
# #
###
#
#
#####
## #
#
#
#
#
#
#
#
# #
#
#
")
")
")
")
")")
")
")
")")
")
")
!(
!(!(!(
!(
!(!(!(
!(
!(!(
!(!(
!(!(!(!( !(
!(
!(
!(!(!(
!(
!(
!(
!(
!(!(
BARRE
HOLDEN
SUTTONCHARLTON
DOUGLAS
SPENCER
RUTLAND
HARDWICK
OXFORD
UPTON
WARREN
PRINCETON
WORCESTER
STURBRIDGE
UXBRIDGEDUDLEY
GRAFTON
OAKHAM
LEICESTER
MENDON
PAXTON
AUBURN
BOYLSTON
BERLIN
MILLBURY
WEBSTERSOUTHBRIDGE
WESTBOROUGH
NEW BRAINTREE
NORTHBRIDGE
SHREWSBURY
BROOKFIELD
WEST BROOKFIELD
NORTHBOROUGH
NORTH BROOKFIELD
BLACKSTONE
WEST BOYLSTON
EAST BROOKFIELD
HOPEDALE
MILLVILLE
Figure III-5 Transportation Safety Planning Program Study Locations (2003-2006)
Information depicted on this map is for planning purposes only.This information is not adequate for legal boundary definition,regulatory interpretation, or parcel-level analysis. Use cautionintrepreting positional accuracy.
Produced by the GIS Center atCentral Massachusetts Regional Planning Commission.35 Harvard Street, Second Floor, Worcester, MA 01609-2801
5
LegendCMRPC Region Boundary
Crash Rate*Signalized Intersections!( 0 - 0.84!( 0.85 - 1.68!( Greater than 1.68
Unsignalized Intersections") 0 - 0.79") 0.80 - 1.58") Greater than 1.58
Other# Future Study Intersections
0 2 4 61Miles
III - 18
ConnecticutRhode Island
* Based on Average Crash Rate figures for MHD District 3released by the Executive Office of Transportation. Crashrate is the number of crashes per 1 million entering vehicles.Signalized Intersection rate is 0.84Unsignalized Intersection rate is 0.79
Data collected by CMRPC transportation staff.

III-19
Table III-2 Crash Statistics Table
Study Year Community Location Crash
Rate* Injuries
per crash Fatalities per crash
2006 Auburn Route 20/Elm Street 0.537 0.308 0.000 2006 Auburn Route 20/Millbury Street 1.600 0.222 0.000 2006 Auburn Route 20/Prospect Street 1.069 0.289 0.000 2006 Auburn Route 20/Route 12 (eastern) 0.495 0.182 0.000 2006 Auburn Route 20/South Street 0.515 0.063 0.000 2005 Barre Routes 32/62/122 (Town Center) 1.633 0.231 0.000 2005 Grafton Route 122/Bridge St 0.372 0.300 0.000 2005 Grafton Route 140/Bridge St 0.521 0.273 0.000 2005 Grafton Rte 122/Rte 140 (N) 0.156 0.500 0.000 2005 Grafton Route 122-140/Plaza 0.305 0.400 0.000 2005 Grafton Rte 122-140/Carroll Rd 0.220 0.571 0.000 2005 Holden Brattle Street/Doyle Road 1.320 0.222 0.000 2003 Northborough Route 20/Davis Street 2.029 0.209 0.000 2003 Northborough Route 20/West Main Street 0.939 0.208 0.000 2003 Northborough Route 20/Church Street 1.722 0.113 0.000 2003 Northborough Route 20/South Street 2.187 0.106 0.000 2003 Northborough Route 20/Hudson Street 1.260 0.281 0.000 2003 Northborough Route 20/Bartlett Street 1.818 0.357 0.000 2006 Northbridge Route 122/Church Street 1.154 0.250 0.000 2006 Oxford Route 12/Route 56 0.738 0.333 0.000 2006 Oxford Route 20/Route 12 (western) 0.317 0.083 0.000 2006 Oxford Route 20/Route 56 0.841 0.206 0.000 2004 Shrewsbury Rte 20/Edgemere Blvd 0.713 0.091 0.000 2004 Shrewsbury Route 20/Lake Street 0.587 0.105 0.000 2004 Shrewsbury Route 20/Grafton Street 2.188 0.224 0.000 2004 Shrewsbury Route 20/Route 140 0.748 0.118 0.000 2004 Shrewsbury Route 20/South/Green 0.502 0.214 0.000 2005 Shrewsbury Route 9/Maple Avenue 1.152 0.205 0.000 2005 Shrewsbury Route 9/Oak Street 1.479 0.316 0.000 2005 Shrewsbury Route 9/Lake Street 0.906 0.190 0.000 2005 Shrewsbury Route 9/South Street 1.804 0.198 0.000 2005 Spencer Route 9/Route 49 1.212 0.103 0.000 2005 Spencer Route 9, just west of Route 49 0.602 0.200 0.100 2006 West Boylston Prospect Street/Woodland Street 1.360 0.333 0.000 2006 West Boylston Route 12/Franklin Street 0.421 0.125 0.000 2006 West Boylston Route 12/Route 110/Route 140 0.753 0.412 0.000 2006 West Boylston Route 12/WalMart Plaza 0.294 0.333 0.000 2006 West Boylston Route 12/Woodland Street 1.037 0.348 0.000 2005 Westborough Route 9/Otis Street 1.348 0.236 0.000 2005 Westborough Route 9/Lyman Street 1.474 0.096 0.000 2005 Westborough Connector Road/Research Drive 0.836 0.143 0.000 2006 Worcester Chandler Street/Park Avenue 1.093 0.214 0.000
* Crash rates are number of crashes per million entering vehicles. Locations where the calculated crash rate exceeds the District 3 average have been shaded. In addition, the one location where a fatal crash occurred is denoted in bold-italics.

III-20
D.2.3.2 Highway-Railroad At-Grade Intersections There are a total of 124 public at-grade highway-rail crossings within the CMRPC region. Twelve (12) of these crossings involve inactive rail-trails that are under development or have the potential for future conversion. CMRPC utilized the Federal Railroad Administration (FRA) Web Accident Prediction System to rank the at-grade crossings using the likelihood of a crash event. The complete listing of at-grade locations ranked by decreasing prediction rate is included in the Technical Appendix. CMRPC also investigated the incidence of crashes that have been documented at the region’s at-grade highway-railroad intersections since 1975. In the past 30 years, 18 at-grade crossings were the site of at least one crash, with a total of 28 crashes resulting in 5 injuries and 6 fatalities. The most notable locations where incidents have occurred include the following: AUBURN Central Street at P&W (Central Square): This location ranks number 29 in crash
prediction rate and has been the site of 4 crashes since 1975. No injuries or fatalities have been reported at this location. The most recent incident took place in 1996. This intersection of major roadways and the P&W railroad was reconstructed during the late 1990s.
NORTHBOROUGH Main Street at CSX: This location scored the second highest for crash prediction
rate and has been the site of 3 documented crashes, one resulting in a fatality in 1976 and one occurring as recent as 2003. The recent incident did not result in injury or fatality. This location will be addressed along with improvements to adjacent intersections in the downtown area, including the signalization of Route 20/Hudson Street. According to the CMMPO endorsed 2007-2010 Transportation Improvement program (TIP), these improvements are expected to be advertised for construction in 2008.
OXFORD Federal Hill Road at P&W: Ranked number 25 in crash prediction rate for the
region, one crash has occurred at this location, resulting in a fatality, in 1991. PRINCETON Brooks Station Road at P&W: Ranked number 97 in crash prediction rate for the
region, one crash has occurred at this location in 1989, resulting in 3 fatalities and 1 injury. This grade crossing was reconstructed and new equipment installed in 2005.
WEST BOYLSTON Prescott Street at Boston & Maine: Ranked number 65 in crash prediction rate for
the region, one crash has occurred at this location in 1980, resulting in a fatality. WORCESTER Blackstone River Road (formerly Millbury Street) at P&W: This location ranks
number 14 in crash prediction rate and has been the site of 4 crashes since 1975. The most recent incident took place in 1997. No injuries or fatalities have been reported. This at-grade crossing was reconstructed as part of the Route 146 major infrastructure improvement project.
III-21
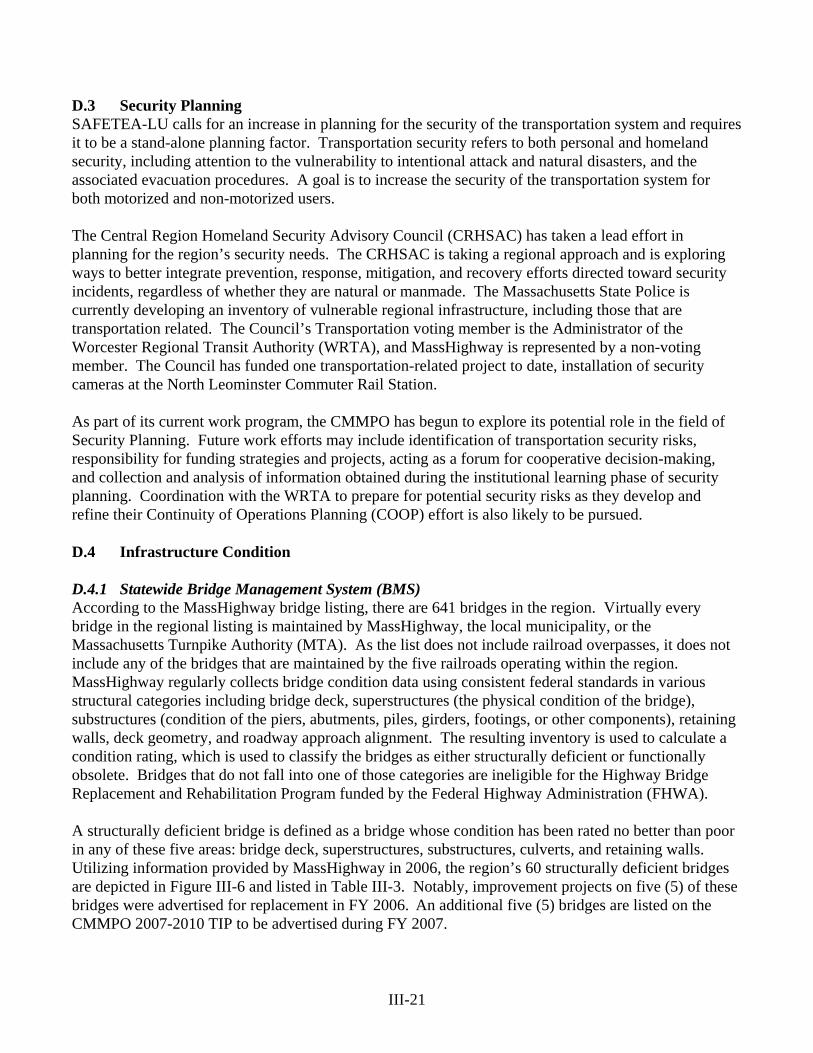
D.3 Security Planning SAFETEA-LU calls for an increase in planning for the security of the transportation system and requires it to be a stand-alone planning factor. Transportation security refers to both personal and homeland security, including attention to the vulnerability to intentional attack and natural disasters, and the associated evacuation procedures. A goal is to increase the security of the transportation system for both motorized and non-motorized users. The Central Region Homeland Security Advisory Council (CRHSAC) has taken a lead effort in planning for the region’s security needs. The CRHSAC is taking a regional approach and is exploring ways to better integrate prevention, response, mitigation, and recovery efforts directed toward security incidents, regardless of whether they are natural or manmade. The Massachusetts State Police is currently developing an inventory of vulnerable regional infrastructure, including those that are transportation related. The Council’s Transportation voting member is the Administrator of the Worcester Regional Transit Authority (WRTA), and MassHighway is represented by a non-voting member. The Council has funded one transportation-related project to date, installation of security cameras at the North Leominster Commuter Rail Station. As part of its current work program, the CMMPO has begun to explore its potential role in the field of Security Planning. Future work efforts may include identification of transportation security risks, responsibility for funding strategies and projects, acting as a forum for cooperative decision-making, and collection and analysis of information obtained during the institutional learning phase of security planning. Coordination with the WRTA to prepare for potential security risks as they develop and refine their Continuity of Operations Planning (COOP) effort is also likely to be pursued. D.4 Infrastructure Condition D.4.1 Statewide Bridge Management System (BMS) According to the MassHighway bridge listing, there are 641 bridges in the region. Virtually every bridge in the regional listing is maintained by MassHighway, the local municipality, or the Massachusetts Turnpike Authority (MTA). As the list does not include railroad overpasses, it does not include any of the bridges that are maintained by the five railroads operating within the region. MassHighway regularly collects bridge condition data using consistent federal standards in various structural categories including bridge deck, superstructures (the physical condition of the bridge), substructures (condition of the piers, abutments, piles, girders, footings, or other components), retaining walls, deck geometry, and roadway approach alignment. The resulting inventory is used to calculate a condition rating, which is used to classify the bridges as either structurally deficient or functionally obsolete. Bridges that do not fall into one of those categories are ineligible for the Highway Bridge Replacement and Rehabilitation Program funded by the Federal Highway Administration (FHWA). A structurally deficient bridge is defined as a bridge whose condition has been rated no better than poor in any of these five areas: bridge deck, superstructures, substructures, culverts, and retaining walls. Utilizing information provided by MassHighway in 2006, the region’s 60 structurally deficient bridges are depicted in Figure III-6 and listed in Table III-3. Notably, improvement projects on five (5) of these bridges were advertised for replacement in FY 2006. An additional five (5) bridges are listed on the CMMPO 2007-2010 TIP to be advertised during FY 2007.

III-22
The most notable structurally deficient bridge listed is the Route 9 bridge over Lake Quinsigamond between Worcester and Shrewsbury. Built in 1916 and reconstructed in 1983, the nearly 90-year-old bridge is structurally deficient and has a fairly low AASHTO rating (39.0). This bridge is not currently listed on the Central Massachusetts Metropolitan Planning Organization (CMMPO) 2007-2010 Transportation Improvement Plan (TIP) listing. However, MassHighway District 3 staff is aware of the need to address this aging structure of regional significance.
Table III-3
Structurally Deficient Bridges in Central Massachusetts*
Town Roadway Name Over/Under Owner AASHTO Rating
Barre Route 32 (Main Street) Ware Canal Town 37.7 Barre Route 32 (S Barre Road) Ware River MassHighway 11.0 Barre Rte 32 (New Braintree Road) Ware Canal MassHighway 56.3 Barre Vernon Avenue Ware River Town 56.2 Blackstone Route 122 (Main Street) Blackstone Canal & PWRR MassHighway 41.7 Charlton Rte 169 (Southbridge Rd) Cady Brook MassHighway 66.2 Douglas Mechanic Street Mumford River Town 41.3 Dudley Lower Perryville Road Perryville Channel Town 14.6 Dudley Perryville Road Canal Town 35.0 Dudley Perryville Road French River Town 28.4 Dudley West Dudley Road Quinebaug River Town 2.0 East Brookfield Shore Road East Brookfield River Town 7.0 Grafton Depot Street P&W Railroad MassHighway 14.4 Grafton Pleasant Street Blackstone River Town 21.9 Grafton Route 122A (Main Street) Blackstone River MassHighway 69.1 Hardwick Access Gate 43 Quabbin Res S BAF DAM Other State Agency 40.3 Hardwick Bridge Street Ware River Town 14.6 Holden Mill Street Quinapoxet River Town 33.0 Holden Princeton Street Quinapoxet Res Outlet Town 38.7 Holden River Street Quinapoxet River Town 23.6 Holden Route 31 (Wachusett St) Quinapoxet River MassHighway 33.6 Hopedale Mill Street Mill Brook Town 38.8 Leicester McCarthy Avenue Kettle Brook Town 40.9 Leicester Parker Street Bartons Brook Town 2.0 Millbury Rte 122A (N Providence Rd) Blackstone River MassHighway 32.6 Millville Central Street Blackstone River Town 2.0 North Brookfield Hines Bridge Road Five Mile River Town 46.5 Northborough Allen Street Assabet River Town 46.2 Northbridge Douglas Road Mumford River Town 23.0 Northbridge Rte 122 (Providence Rd) Blackstone River MassHighway 62.7 Oxford Comins Road French River Town 70.7 Oxford Holbrook Street I-395 MassHighway 72.9 Princeton Ball Hill Road Wachusett Brook Town 19.6 Princeton Route 62 (Hubbardston Rd) Ware River MassHighway 32.6 Shrewsbury Route 9 (Belmont Street) Lake Quinsigamond MassHighway 39.0

III-23
Table III-3 (continued) Structurally Deficient Bridges in Central Massachusetts*
Town Roadway Name Over/Under Owner AASHTO Rating
Southbridge Alpine Drive Lebanon Brook Town 24.5 Southbridge Route 131 (Sandersdale Rd) Sandersdale Canal Town 47.2 Southbridge Route 169 (N Woodstock Rd) P&W Railroad (Abandoned) MassHighway 28.8 Spencer Brooks Pond Road Five Mile River Town 22.9 Sturbridge Haynes Street Quinebaug River MassHighway 51.6 Sutton Blackstone Street Blackstone River Town 53.0 Sutton Main Street Mumford River MassHighway 20.9 Uxbridge River Road Ironstone Brook Town 24.0 Uxbridge Route 122 (Main Street) Blackstone River MassHighway 67.9 Uxbridge Route 16 (Mendon Street) Blackstone River MassHighway 38.0 Uxbridge Route 16 (Mendon Street) Rock Meadow Brook MassHighway 48.4 Warren Gilbert Road Quaboag River Town 32.6 Warren Old Boston Post Road Naultaug Brook MassHighway 41.0 West Brookfield Long Hill Road CSX Railroad MassHighway 32.8 West Brookfield Wickaboag Valley Road Sucker Brook Town 48.9 Westborough I-90 EB CSX Railroad MTA 39.0 Westborough I-90 WB CSX Railroad MTA 39.0 Worcester Cambridge Street P&W Railroad MassHighway 43.9 Worcester Exeter Street CSX Railroad MassHighway 12.8 Worcester I-290 EB McKeon Road MassHighway 59.0 Worcester Millbury Street Middle River City 30.0 Worcester Route 12 (Webster Street) Middle River MassHighway 64.9
Worcester Route 122 (Grafton St) US Route 20 (Southwest Cutoff) MassHighway 46.7
Worcester Route 9 (Belmont Street) I-290 MassHighway 35.0 Worcester West Mountain Street I-190 MassHighway 46.6 Source: MassHighway, June 2006 *Bridges listed on the CMMPO 2007-2010 TIP to be advertised during FY 2007 are indicated in bold-italics. Bridges where improvement projects were advertised for construction during FY 2006 have been shaded. A functionally obsolete bridge is defined as a bridge that is considered in serious condition in any of these three categories: deck geometry, underclearances, or approach roadway alignment. Additionally, if the structural condition or waterway adequacy is in serious condition (but better than that for a structurally deficient bridge), the bridge would be identified as being functionally obsolete. Essentially, a functionally obsolete bridge is one that is not built in accordance with currently accepted design standards. The region’s 169 functionally obsolete bridges are also depicted in Figure III-6. A tabular listing of these bridges has been provided in the Technical Appendix. Posted bridges are bridges that have weight restrictions. There are 65 such bridges within the region, 21 of which are also structurally deficient and 28 of which are functionally obsolete. The region’s posted bridges are depicted in Figure III-6 and listed in Table III-4.

III-24
Table III-4 Posted Bridges in Central Massachusetts*
Town Over Under Owner AASHTO Rating
Deficiency
Auburn Oxford Street Kettle Brook Town 37.7 FO Barre Route 32 (Main Street) Ware Canal Town 37.7 SD Barre Rte 32 (New Braintree Road) Ware Canal MassHighway 56.3 SD Berlin Bridge Road Assabet River Town 48.8 Berlin Linden Street North Brook Town 65.5 Berlin Pleasant Street North Brook Town 77.8 Berlin South Street North Brook Town 61.0 FO Blackstone Route 122 (Main Street) Blackstone River MassHighway 42.8 FO Blackstone Route 122 (Main Street) Blackstone Canal & PWRR MassHighway 41.7 SD Blackstone St. Paul Street Blackstone River Town 37.9 FO Brookfield Fiskdale Road Quaboag River Town 42.1 FO Charlton Glenmere Road Little River Town 49.2 FO Charlton Southbridge Road Ashworth Brook MassHighway 68.6 FO Douglas Mechanic Street Mumford River Town 41.3 SD Douglas Potter Road Mumford River Town 63.6 Dudley Brandon Road Mill Race (Dry) Town 51.4 FO Dudley Carpenter Road P&W Railroad MassHighway 37.7 FO Dudley Perryville Road Canal Town 35.0 SD Dudley Perryville Road French River Town 28.4 SD Dudley Peter Street French River Town 38.7 FO Dudley Tracy Court French River Town 50.4 FO Dudley West Dudley Road Quinebaug River Town 2.0 SD East Brookfield Shore Road East Brookfield River Town 7.0 SD East Brookfield South Pond Road Wouth Pond Inlet Town 79.3 Grafton Millbury Street Quinsigamond River Town 55.4 FO Grafton Route 140 (Shrewsbury St) CSX Railroad MassHighway 57.7 FO Hardwick Barre Road Moose Brook Town Hardwick Creamery Road Ware River Town 38.1 FO Hardwick Taylor Hill Road Moose Brook Town 64.4 FO Holden Mill Street Quinapoxet River Town 33.0 SD Leicester McCarthy Avenue Kettle Brook Town 40.9 SD Millville Central Street Abandoned Mill Race Town 50.6 FO Millville Central Street Blackstone River Town 19.9 FO Millville Central Street Mill Race River Town 30.0 FO New Braintree Barr Road Meadow Brook Town New Braintree Hardwick Road Winimussett Brook Town No. Brookfield Hines Bridge Road Five Mile River Town 46.5 SD Northbridge Douglas Road Mumford River Town 23.0 SD Oxford Dudley Road French River Town 67.4 FO Oxford Harwood Street French River Town 50.4 FO Princeton Ball Hill Road Wachusett Brook Town 19.6 SD Princeton Old Colony Road Ware River Town 82.5 Princeton Route 62 (Hubbardston Rd) Ware River MassHighway 32.6 SD Southbridge Central Street Quinebaug River Town 76.3 FO

III-25
Table III-4 (continued) Posted Bridges in Central Massachusetts*
Town Over Under Owner AASHTO Rating
Deficiency
Southbridge Mill Street Quinebaug River Town 67.5 FO Southbridge Rte 169 (N Woodstock Rd) P&W Railroad (Abandoned) MassHighway 28.8 SD Spencer Brooks Pond Road Five Mile River Town 22.9 SD Spencer North Spencer Road Seven Mile River MassHighway 53.2 Sturbridge Champeaux Road Water Long Pond Town 59.1 Sturbridge Holland Road Quinebaug River Town 50.9 FO Sturbridge Stallion Hill Quinebaug River Town 59.5 Sutton Depot Street Blackstone River Town 62.5 Upton Glen Avenue West River Town 75.6 Upton Pleasant Street West River Town 39.4 FO Uxbridge Hartford Avenue Mumford River Town 50.1 FO Uxbridge River Road Ironstone Brook Town 24.0 SD Uxbridge Route 122 (N. Main Street) Mumford River MassHighway 53.4 FO Warren Old Boston Post Road Naultaug Brook MassHighway 41.0 SD Warren Old West Brookfield Road Quaboag River Town W. Brookfield Foster Hill Road Coys Brook Town W. Brookfield Long Hill Road CSX Railroad MassHighway 32.8 SD W. Brookfield Wickaboag Valley Road Sucker Brook Town 48.9 SD Worcester Laurel Street I-290 MassHighway 51.7 FO Worcester May Street Beaver Brook/Sewer City 62.9 FO Worcester Route 9 (Belmont Street) I-290 MassHighway 35.0 SD
Source: MassHighway, January 2007 *Bridges listed on the CMMPO 2007-2010 TIP to be advertised during FY 2007 are indicated in bold-italics. Bridges where improvement projects were advertised for construction during FY 2006 have been shaded.

!
!
!
!
!
!
!
!
!
!
!! !!!!
!!!
!
!
!
!
!!
!!
!
!
!
!
!
!!!
!!
!!
!
!!
!
!
!
!!
!
!!!
!
!!
!!
!
!!
! !!!
!!
!
!!
!.
!.!!.!.
!
!
!!
!
!
!
!
!.!.!!.
!
!.!! ! !.
!!.
!
!
!.
!.
!.
!
!.!.
!.!.
!!
!.
!.
!
!
!!.
!.
!!! !!
!
!
!!
!.!.!
!.
!
!.!!.!.
!!.
!.
!
!.
! !.
!
!.! !!!.!.!.!!!!.!.
!!!.
!.!.!!.
!!!
!!.!!
!!
!
!
!
!!!.
!.!!!.!.
!!
!!
!
!.!.
!
!.
!!
!!. !!.
!
!!.
!.
!!!.!.!
!
!.!.
!
!.
!.
!.!.
!
!.!
!
!
!
!!
!
!
!
!!.!
!!!!
!!
!
!.
!.
!.!.
!.
!.
!
!.!.!.!!!.
!.! !
!!!!
!!.!!. !.
!.!.! !.
!.
!.
!
!!!
!.!
!!
!!.!!.
!
!
!
!!!!!!.!
!
!!.!!!.
!
!
!.!
!
!!
!
!
!.
!.
!
!.!
!
!
!.!
!.
!
!
!.!
!
!
!.
!!!!
!.
!.!
!
!!.
!
!.
!.!
!.
!
!
!
!.!
!.!
!.!.!!
!!!!
!
!
!
!!!.!
!
!.
!.
!.
!
!.!.
!!
!!
!.!.!.!.
!.
!!!!
!!
!.
!.!
!
!!
!.
!!
!
!
!.
!
! !.
!.!!
!!. !
!.
!!
!!! !.
!.
!.!
!!.!
!!!
!.
!!
!
!!
!
!
!!!
!.!.
!.
!!!!
!
!!
!
!.
!
!!
!.
!
!
!.!.
!
!
!
!
!
!
!
!
!
!
!.!
!.
!
!.
!!!.!
!!!!!!.
!. !
!.
!
!.!.!.
!.
!
!.
!.
!.
!!.
!
!
!
!
!
!
!.!.
!
!
!!
!!
!!. !
!!
!!
!
!
! !!!
!!!! !!
!
!.!
!!
!!
!!
!.
!
!
!!.
!. !!!.!
!
!!
!!.
!
!
!!
!
!.
!!!
!!!!!!!
!
!!.!
! !.!!
!
!.
!!.!!
!.
!.
!.!
!.!.!.!!
!!. !.
!
!!
!.!.
!.!.!!.!
!.!
!!.
!
!
! !.!.!.!
!
!! !.
!
!.
!.
!!.!.!!!!!!.!.!.!.
!.
!.
!!!
!
!
!
!.
!
!
!
!.
!
!.
!
!
!.
!.
!.
!!.!!
!.
!.
!
!!.
!!
!.!!!.!
!.!.!!!!!!!!
!!
!
!!!!.!!
!!
!
!.!.!!.!!.!.!
!! !.
!!.!.!.
!.
!
!!.
!.
!
!
!
!.
!!.
!.
!.!.
!!.
!
!!!
!.
]Ö
}
%&l(
!"a$
ß¾Ö
à
Þ]Ä
]Ä
¾!"$
Iu
!"a$
Ö]Õ
]ë
]âÏ
]Ê]ë
]Â
]Â
]Â
w
]Ä
]Õ
Ï
×
]Ö
w
]Ö
w
]Öa
]º
]ì
]ä
]Ä
]Õ
]í
]í
%&e(r
r
]õ
Ç
]¹
]¹
k
j
j
]è
]è
]ì
]Ä
]Ä j
]Â
]Õ
]Ô]õ
]ä
]í
Ç
%&e(
%&g(_x
_x
w
%&l(
]Â
]Â
Â
Iu
Iu
]ÔÇ
w%&g(
%&k(
!"a$
!"a$
_x
%&l(Ç
w
w
Ì
]È
Ì
]÷
]È
Figure III-6 Bridges
Information depicted on this map is for planning purposes only.This information is not adequate for legal boundary definition,regulatory interpretation, or parcel-level analysis. Use cautionintrepreting positional accuracy.
Produced by the GIS Center atCentral Massachusetts Regional Planning Commission.35 Harvard Street, Second Floor, Worcester, MA 01609-2801
5
LegendCMRPC Region Boundary2000 Census: Urban Area
Bridge Condition! Meeting Standards!. Functionally Obsolete!. Structurally Deficient
! Posted
0 2 4 61Miles
BARRE
PRINCETON
HARDWICK
NEWBRAINTREE
OAKHAM
RUTLAND
PAXTON
HOLDEN
WESTBOYLSTON
WESTBROOKFIELD
WARREN BROOKFIELD
NORTHBROOKFIELD
EASTBROOKFIELD
SPENCER
LEICESTER
STURBRIDGE
SOUTHBRIDGE
DUDLEY
CHARLTON
WEBSTER
OXFORD
DOUGLAS
SUTTON
UXBRIDGE MILLVILLE
BLACKSTONE
NORTHBRIDGE
MENDON
HOPEDALE
UPTON
GRAFTON
MILLBURYAUBURN
WORCESTERSHREWSBURY WESTBOROUGH
NORTHBOROUGH
BERLINBOYLSTON
III - 26
ConnecticutRhode Island

III-27
D.4.2 Pavement Management System Many states have implemented pavement management programs to assist decision makers in determining the most cost effective strategies to address poor or failing roadway conditions. In general, a successful program defines a roadway network, identifies the condition of each segment of the network, develops a list of needed improvements, and balances those needs with the available resources of the party responsible for maintaining the defined roadway network. Pavement distress information is generally collected in the field by conducting “windshield surveys.” A team of two technicians drives along each segment of the defined roadway network and takes note of the severity and extent of the following pavement distresses:
• potholes • distortions • alligator cracking • transverse and longitudinal cracking • block cracking • rutting • bleeding/polished aggregate • surface wear and raveling • corrugations, shoving, and slippage
Based on observed distresses, a quantified rating of pavement condition can be objectively ascertained. Using the pavement ratings and nature of the distress, repair options can be recommended, such as:
• complete reconstruction or reclamation • rehabilitation • preventive maintenance • routine maintenance • no immediate maintenance
Using the calculated pavement rating, the Average Daily Traffic (ADT) volume, and the unit cost and estimated life of the repair option chosen, recommended improvement projects can be organized in a prioritized order. The key to an efficient pavement management program lies in the project prioritization process. All roadways are in a constant state of deterioration because of time, weather, and traffic load. Since the ultimate goal of the highway department is to maintain a roadway network at an acceptable level of performance, roadways needing preventive or routine maintenance should receive sufficiently high priority. A “maintenance first” strategy can be viewed as far more efficient than the typical “worst first” approach. In a limited funding environment with the poorest performing roadways receiving highest priority, many maintenance projects are postponed, and, as that trend continues, a roadway once needing routine, inexpensive maintenance now needs a far more expensive improvement option. The “worst-first” roadway network typically remains at the same poor level of overall condition, while properly prioritized maintenance and repair can improve the overall condition of a network in time using the same level of resources.

III-28
Approximately 1/3 of the federal-aid highway network within the central Massachusetts region is maintained by MassHighway, while the remaining roadways fall under the jurisdiction of the 40 municipalities in the region. The pavement needs analysis from the 1997 Regional Transportation Plan determined that approximately $20 Million was needed on an annual basis to maintain this roadway system at its then-current level, with a Pavement Condition Index (PCI) in a range between 83 and 89. In the absence of an updated analysis of regional pavement conditions, an adjusted current cost was developed utilizing Consumer Price Indexing (CPI) Conversion factors. For 1997 – 2006, the published factor was 1.256. For 2007, an additional 3.2% is added. The total adjusted annual cost (in present dollars) to maintain the federal-aid eligible roadway system at the 1997 condition level equals $25.9 million, as indicated in Table III-5. The second alternative would be expected to reduce the network-level pavement condition from the 1997 rating (PCI = 83-89), but still maintain the federal-aid system in “good” condition (PCI = 75). The third alternative would be expected to reduce the network-level pavement condition from the 1997 rating to a “fair” condition (PCI = 65). While awaiting the results of the regional analysis of data collected in 2005 and 2006, these figures have been utilized for financial planning purposes.
Table III-5 Alternative Pavement Management Funding Scenarios
Scenario Number
Recommended Annual
Pavement Allocation
Estimated Network-Level PCI
Condition Description
1 $25,900,000 83-89 Very Good 2 $18,100,000 75 Good 3 $12,900,000 65 Fair
MassHighway collects pavement distress data on state-maintained federal-aid eligible roadways and state-numbered routes throughout the Commonwealth. From this data, a Pavement Serviceability Index (PSI) is calculated. Similar to the PCI utilized in the regional pavement management program, the state-developed PSI represents a scoring system of pavement condition ranging from “poor” to “excellent.” For the development of this RTP, MassHighway provided PSI data for the roadways illustrated in Figure III-7. The average PSI of this network was determined to be 3.12 on a scale of 0 to 5, with 5 representing a roadway in brand-new condition. A roadway with a PSI between 2.8 and 3.5 is considered to be in “good” condition, while a PSI > 3.5 represents “excellent” condition. Of the roadways surveyed, about 67% of the roadways can be considered “good” or “excellent.”

]Ö
}
%&l(
!"a$
ß¾Ö
à
Þ]Ä
]Ä
¾!"$
Iu
!"a$
Ö]Õ
]ë
]âÏ
]Ê]ë
]Â
]Â
]Â
w
]Ä
]Õ
Ï
×
]Ö
w
]Ö
w
a]ì
]ä
]Ä
]Õ
]í
]í
%&e(r
r
]õ
Ç ]¹
k
j
]è
]è
]ì
]Ä
]Ä j
]Â
]Õ
]Ô]õ
]ä
]í
Ç
%&e(
%&g(_x
_x
w
%&l(
]Â
]Â
Â
Iu
Iu
]ÔÇ
w%&g(
%&k(
!"a$
!"a$
_x
%&l(Ç
w
w
Ì
]È
Ì
]÷
]È
BARRE
HOLDEN
SUTTONCHARLTON
DOUGLAS
SPENCER
RUTLAND
HARDWICK
OXFORD
UPTON
WARREN
PRINCETON
WORCESTER
STURBRIDGE
UXBRIDGEDUDLEY
GRAFTON
OAKHAM
LEICESTER
MENDON
PAXTON
AUBURN
BOYLSTON
BERLIN
SHREWSBURY
MILLBURY
WEBSTERSOUTHBRIDGE
WESTBOROUGH
BROOKFIELD
NEW BRAINTREE
NORTHBRIDGE
NORTHBOROUGH
WEST BROOKFIELD
NORTH BROOKFIELD
BLACKSTONE
WEST BOYLSTON
EAST BROOKFIELD
HOPEDALE
MILLVILLE
Figure III-7 Pavement Management Pavement Serviceability Index (PSI) Ratings
Information depicted on this map is for planning purposes only.This information is not adequate for legal boundary definition,regulatory interpretation, or parcel-level analysis. Use cautionintrepreting positional accuracy.
Produced by the Transportation Staff atCentral Massachusetts Regional Planning Commission.35 Harvard Street, Second Floor, Worcester, MA 01609-2801
50 4 82
Miles
III - 29
LegendCMRPC Region BoundaryTown BoundaryMajor Road
PSI RatingPSI 3.5 - 5.0 ExcellentPSI 2.8 - 3.5 GoodPSI 2.3 - 2.79 FairPSI < 2.3 Poor
PSI Rating data provided by MassHighway.

III-30
D.5 Mobility D.5.1 Public Perception When highway improvement needs and options are discussed in the media, it is typical to read a quote such as this one from the Webster Times on December 14, 2005:
For Noyes [Oxford Police Chief], the top concern is “the volume of traffic coming through town on a day-to-day basis” – and how that volume has increased with residential and commercial development, both in Oxford and surrounding towns.
A number of public outreach and involvement efforts by CMRPC and others have resulted in similar concerns regarding the region’s mobility. D.5.1.1 495/MetroWest Top 10 Nightmares The 495/MetroWest Corridor Partnership is a regional advocacy non-profit group formed to address the needs of the I-495/MetroWest region. The group includes municipal officials, regional employers, legislators, environmentalists, and educators. In 2004, the 495/MetroWest Corridor Partnership conducted a web-based survey, advertised through the MetroWest Daily News. Over 150 locations were submitted for consideration, and the review committee chose the Top Ten Traffic Nightmares. Notably, the #1 “nightmare” was identified as “lack of public transportation.” The following highway-related “nightmares” are located within or affect the CMMPO planning region:
#2) I-495/I-290 Interchange #3) I-495/Massachusetts Turnpike (I-90) Interchange #5) Route 9/Lyman Street, Westborough #7) Route 20 (Northborough, Marlborough, Sudbury) #8) System wide maintenance #10) I-495/Route 9 Interchange
D.5.1.2 CMRPC On-Line Commuter Survey With the successful rate of return of the MetroWest survey as a model, the transportation staff deployed an online survey aimed at the region’s commuting public. Of the 228 respondents, 75% indicated that their daily commute trips originated or ended in Worcester, while 41% noted that they travel from Worcester to Worcester on a daily basis for work. The majority (75%) of the participants indicated that they drove to work, while 6% indicated that they took the train to work and 16% noted that they used more than one mode of travel. Almost half of the respondents indicated that traffic congestion at intersections and along roadway stretches was their worst problem that they encountered on their daily commute. About half of the respondents also specified that these problems occurred in Worcester. Of the Worcester locations, Kelley Square received the most votes for the worst problem. Tatnuck Square was second; the intersection of Chandler Street and Park Avenue was third; and Park Avenue itself came in fourth. Approximately 80% of the responses to the 2006 on-line Commuter survey included a suggestion for improvement. The most noted responses were:

III-31
• More trains to Boston • Fix potholes • Improve, add, and better maintain sidewalks • Better timing of traffic lights, synchronizing, sensors in roads • More bus service in Worcester and to the suburbs • Crack down on red light runners and traffic law breakers • Add more bicycle lanes and paths • More left-turn signals or advance left turns at Worcester intersections
D.5.1.3 CMRPC Early Public Outreach Subregional Meetings CMRPC hosted three early public outreach meetings: one in Rutland to solicit input from the northern tier of the region; one in Sutton to solicit input from the southern tier of the region; and one in Worcester to solicit input from the central part of the region. The general needs expressed through meeting attendees were typically repeated at meetings in other regions. The following topics were identified:
• Regional Traffic on Local Roads: Cut-through traffic on some local roads has increased to the point where residents feel they cannot safely or efficiently exit their own driveways due to excessive speed and/or heavy traffic volumes. Suggestions to mitigate congestion included intersection improvements, signal coordination, ITS applications such as traffic advisories, improved roadway signage, new park-and-ride facilities, or even new roads. Many expressed the need to be creative to address increasing needs in an environment of reduced funding.
• Future Visioning: Guests continued to make it clear that they felt that not enough forward visioning was taking place. We always seem to simply say: “There’s not enough money, and it’s just not possible.” If we continue in that vein, nothing will ever happen, and we are going to end up in intolerable bottlenecks and other situations which will have far-reaching impacts on the quality of life in the Central Massachusetts region. Some believe that the CMMPO and CMRPC could be a rallying point for consensus, or even to provide the points to rally around. The considerable length of time that the Route 146 connector project was in the planning stages was noted as a reason to start making hard choices and evaluations now and start pushing, or it will be forever before anything happens.
• Regional Impacts of Locally-Controlled Development: It was proposed that the CMMPO and CMRPC take a more aggressive, proactive role to promote regionalism and compromise in the face of conflicting local benefits. The RTP should incorporate the goals of local Master Plans as well as plans underway beyond the borders of the regional and state borders.
• Regional Transit Network: A bus network that better serves the region and improved commuter rail service was requested. Rail comments included requests for more rail service to Boston with adequate parking and bus connections and instituting commuter rail service to Providence, RI via Woonsocket.
• Maintenance: Meeting attendees continually noted the need to maintain the existing roadway, bridge, and sidewalk infrastructure.
• Non-motorized Modes of Travel: The need for improved sidewalk networks, safer crossing areas, and bikeways (specifically the Blackstone valley Bikeway) were consistently noted.

III-32
D.5.2 Freight Planning D.5.2.1 Introduction The mission of Freight Planning within the Commonwealth is to improve intermodal transportation system performance, that is, to increase the opportunities to move freight and interregional passengers at less cost and with fewer impediments, by guiding the decisions that are made regarding public policies and transportation investments. Freight Planning provides more effective inputs to the transportation planning process through its continued development, evaluation and recommendation of strategies to enhance system performance. This is done in the interest of the public at large by balancing intermodal cost and operating efficiencies with the potential effects of proposed decisions. Initially developed as an Intermodal Management System (IMS) by EOT in cooperation with the RPAs, MassPort, and the MAC, Freight Planning has emerged as both a regional and statewide effort. The major intermodal freight facilities connected to the National Highway System (NHS), emphasized under SAFETEA-LU, are the primary focus of Freight Planning. This undertaking also includes, to a lesser extent, other intermodal activity and the interregional component of passenger intermodal activity. The three main goals of Freight Planning in the Commonwealth are as follows:
1. Improve the performance of freight and interregional passenger intermodal corridors and terminals.
2. Coordinate and cooperate with affected constituencies from the public and private sectors. 3. Assist in identifying and considering the economic, social, environmental, energy, safety and
external impacts of potential decisions as appropriate. Carried out by the referenced state agencies and the RPAs, Freight Planning is an ongoing process of system evaluation, supported with limited data collection, which is utilized to provide technical support in the development of both the regional and statewide TIP and Transportation Plan documents. The CMMPO and the CMRPC anticipate continuing to have direct input into the ongoing refinement and operation of the program. The RPAs and other agencies will continue using regional travel demand models, vehicle classification counts and other methods to identify both the existing and future needs of the current intermodal transportation system as well as to suggest/evaluate strategies and projects to meet these needs. When the region’s intermodal facilities inventory was developed within the parameters of the system description framework, available data was utilized where possible. As previously indicated by EOT-OTP, Freight Planning and the ongoing CMP will continue to use a number of common performance measures. Intermodal freight and passenger data has been available from the RPAs and various state agencies. New data collection efforts, if necessary, are expected to be limited in nature. This may include purchasing already available data from vendors or acquiring information through the Public Outreach Program. As early SAFETEA-LU guidance continues prior emphasis on the nation’s NHS Connectors, the deployment of ATRs at key locations along the region’s NHS Connectors continues as an ongoing data collection task. It is also known that some freight intermodal requirements can only be met with data from the private sector. In response to identified needs in the transportation system, Freight Planning participants continue to recommend statewide, regional and location-specific strategies to improve the NHS Connectors which provide access to major intermodal facilities. These strategies, ranging from operational improvements to major capital investment, will address existing conditions and, if applicable, future year scenarios. Potential improvement

III-33
projects, which may address such issues as roadway condition and capacity, physical restrictions and safety, would need to be included in the CMMPO TIP and the STIP documents. The CMMPO, in order to follow the intent of the Freight Planning provisions of SAFETEA-LU, is required to provide the opportunity for input from both the communities as well as all pertinent stakeholders. Although the CMRPC staff has maintained contacts with various modal providers in the railroad, trucking and intermodal industries, in order to move forward it is necessary for the CMMPO to understand the issues and needs concerning freight mobility when formulating regional transportation policy. D.5.2.2 Major Intermodal Freight Terminals Prior Freight Planning work conducted by the CMRPC transportation staff led to the identification of all of the region’s major intermodal terminals that serve freight and passengers. A summary of the region’s intermodal facilities including name, type of operation and general location follows. Notably, due to the concentration of intermodal freight terminals in the city of Worcester, the area has been dubbed the “Intermodal Hub of New England”. As such, Figure III-8 shows the general location of the three (3) major intermodal freight yards in the city of Worcester. (The region’s major intermodal facilities are also discussed in the RTP document’s “Railroad” section.) Town of East Brookfield/Town of Spencer
Freight: Automotive
• New England Automotive Gateway, “NEAG”, (Worcester County Transportation, Distribution & Technology Center), rail to truck transfer, Route 49
Town of Westborough
Freight: Automotive
• CSX Transportation Auto Yard, rail to truck transfer, Walkup Street City of Worcester
Freight: Bulk, Intermodal Container & TOFC
• CSX Transportation, TOFC & bulk commodities terminal, rail to truck transfer, Franklin Street • P&W Railroad Yard/Intransit Container, rail to truck transfer, Southbridge Street • P&W Railroad Yard/Intransit Container, rail to truck transfer, Wiser Avenue
Passenger:
• Union Station Intermodal Transportation Center (ITC), passenger facility, Washington Square • Worcester Regional Airport, passenger & air freight facility, Airport Drive

WORCESTER
HOLDEN
AUBURN
GRAFTON
SHREWSBURY
BOYLSTON
MILLBURY
SUTTON
LEICESTER
WEST BOYLSTON
OXFORD
NORTHBOROUGH
PAXTON
BERLIN
NORTHBRIDGE
WESTBOROUGH
WESTBOROUGH
Figure III-8 Worcester's Intermodal Freight Yards
Information depicted on this map is for planning purposes only.This information is not adequate for legal boundary definition,regulatory interpretation, or parcel-level analysis. Use cautionintrepreting positional accuracy.
Produced by the GIS Center atCentral Massachusetts Regional Planning Commission.35 Harvard Street, Second Floor, Worcester, MA 01609-2801
5
FRANKLIN STREET
INTER
STATE 290
GRAFTON STREET
PLAN
TATI
ON STREET
GR
EEN STR
EET
SHREWSBURY STREET
WAT
ER S
TREE
T
TEMPLE STREET
GREENWOOD S
TREE
T
MILLB
UR
Y STREET
PUR
PLE
HEA
RT
HIG
HW
AY
SOU
THBR
IDG
E ST
REET
QUINSIG
AMO
ND AVENUE
CANTERBURY STREET
III - 34
Railroad Tracks Serving theIntermodal Yard
Legend
National Highway System (NHS)
Federal Aid Eligible Road
1
1
2
3
2
3
CSX INTERMODAL INC.
PROVIDENCE & WORCESTER RR CO.INTRANSIT CONTAINER INC.
INTRANSIT CONTAINER INC.

III-35
D.5.2.3 NHS Connector Monitoring As discussed earlier, designated NHS Connectors were previously established in the region to link major intermodal facilities with the greater NHS network. As part of the region’s ongoing Freight Planning efforts, the transportation staff has conducted traffic volume counts on a number of designated and potential NHS Connectors within the planning region. The traffic counters used in the field also have the capability to determine vehicle classification. As shown in Table III-4, vehicle classification along these critical routes was observed using four basic categories established by FHWA: passenger vehicles, single-unit trucks/buses, combination trucks and multi-trailer trucks. The total number of trucks and their resulting percentage of total traffic along the roadways counted are also shown. As can be seen from the table, the resulting truck percentages on the roadways counted range from just under 6% to slightly over 12%. As far as truck totals, the highest was observed in the city of Worcester on Southbridge Street north of Cambridge Street where nearly 1,400 heavy vehicles traveled over a 24-hour period. The region’s travel demand model, which simulates the operations of the greater highway network, has been recently updated with a truck forecasting capability consistent with U.S. DOT’s Quick Response Freight Manual. In the future, staff intends to utilize the model as another tool for Freight Planning. A potential first step may be the comparison of NHS Connector truck flows generated by the model to those observed in the field through ongoing monitoring efforts. Such an effort could potentially lead to model calibration refinements. D.5.2.4 Trucking Issues Through the proactive public outreach process used to develop the 2007 RTP document as well as the ongoing work of the CMMPO, a number of issues affecting trucking in the greater region were identified. Moving forward, both the CMMPO and the CMRPC intend to convene advisory groups in some fashion to discuss pertinent issues impacting freight-truck, rail and intermodal, as well as recommend potential solutions to identified deficiencies. The issues listed below, and others yet to be identified, are likely topics for forthcoming discussions.
• Increasing truck volumes along with related capacity and safety issues
• Lack of sufficiently large rest areas with full service facilities for trucks at key locations along the Interstate System. (SAFETEA-LU’s Truck Parking Facilities Grant Program aims to improve the present situation.)
• Lack of trailblazing signage to major intermodal facilities located on NHS Connectors
• Although there are minimal highway/railroad bridge overhead clearance issues in the region,
improvements at some key locations need to be considered.
• Bridge structures with posted load limitations that result in trucking diversions.
• Roadway geometry, pavement conditions and safety devices at highway-railroad grade crossings.

III-36
Table III-6 Vehicle Classification Observed on Designated and Potential
NHS Connectors Serving Intermodal Operations
COUNT LOCATION COUNT VEHICLE RESULTING TRUCK TRUCK& INTERMODAL SITE DATE TYPE/CLASS NB/EB SB/WB TOTALS PERCENTAGES TOTAL PERCENT
Rt 49 south of Rt 9 10/16/2006 Passenger vehicles 3044 3259 6303 87.97%Spencer - N.E. Automotive Single-unit trucks/buses 367 215 582 8.12%Gateway Industrial Park Combination trucks 129 150 279 3.89% 862 12.03%
Multi-trailer trucks 1 0 1 0.01%
Rt 49 north of Rt 20 6/20/2005 Passenger vehicles 4070 4142 8212 90.94%Sturbridge - N.E. Automotive Single-unit trucks/buses 184 202 386 4.27%Gateway Industrial Park Combination trucks 232 199 431 4.77% 818 9.06%
Multi-trailer trucks 1 0 1 0.01%
Connector Rd south of Rt 9 5/22/2003 Passenger vehicles 3814 3192 7006 92.50%Westborough - CSX Intermodal Single-unit trucks/buses 165 144 309 4.08%Automotive, Bulk Combination trucks 163 185 348 4.59% 668 8.82%
Multi-trailer trucks 9 2 11 0.15%
Flanders Rd east of Connector Rd 5/22/2003 Passenger vehicles 4338 4491 8829 92.43%Westborough - CSX Intermodal Single-unit trucks/buses 163 161 324 3.39%Automotive, Bulk Combination trucks 215 181 396 4.15% 723 7.57%
Multi-trailer trucks 0 3 3 0.03%
Franklin St east of Grafton St 8/16/2005 Passenger vehicles 4954 4384 9338 94.17%Worcester - CSX Intermodal Single-unit trucks/buses 184 229 413 4.16%TOFC, Bulk Combination trucks 89 67 156 1.57% 578 5.82%
Multi-trailer trucks 4 5 9 0.09%
10/12/2006 Passenger vehicles 2198 2016 4214 89.30%Single-unit trucks/buses 163 188 351 7.44%
Worcester - Prov & Worc RR Combination trucks 60 93 153 3.24% 505 10.70%Intransit Container Inc. Multi-trailer trucks 0 1 1 0.02%Containers, Chassis
Southbridge St north of Cambridge St 10/25/2006 Passenger vehicles 6629 7659 14288 91.11%Worcester - Prov & Worc RR Single-unit trucks/buses 530 499 1029 6.56%Intransit Container Inc. Combination trucks 172 162 334 2.13% 1395 8.89%Containers, Chassis Multi-trailer trucks 22 10 32 0.20%
Passenger vehicles consist of cars, light trucks, and motorcycles.Single-unit trucks are trucks with 3-4 axles or dual wheels, on one frame.Combination trucks have two units (for example, the typical 18-wheeler).Multi-trailer trucks have three or more units (often called tandem trailers).
* Formerly known as Millbury Street
Blackstone River Rd* south of Greenwood St
DIRECTION

III-37
D.5.2.5 Massachusetts Freight Flows Over the last two decades on a national level, the volume of freight has grown dramatically. Further, the mix of goods and the way they are moved has changed. System improvements have not kept pace with the growth in freight transportation demand, resulting in congestion on the nation’s highways and straining other freight modes as well. Truck vehicle-miles, for example, nearly doubled while roadway lane-miles increased by only 5 percent between 1980 and 2002. Understanding the current dynamics of freight transportation while attempting to plan for the future is important for matching infrastructure supply to demand, assessing potential operational strategies as well as prioritizing investments. Congestion is a serious problem for freight transportation. It increases the cost of freight movement by making travel times longer and more unpredictable. Reliable and predictable travel times are important in an economy where many goods are expensive and are needed in tightly scheduled manufacturing and distribution processes. Late arrivals can have significant economic costs for industries waiting for parts to assemble and for carriers who are missing guaranteed delivery times. Thus, when transportation system performance decreases, an economic price is exacted. The transportation network moves a staggering volume of freight each year. Over 15 billion tons worth more than $9 trillion were transported in 1998. By 2020, freight volumes are expected to increase by 70 percent and the value of shipments is expected to grow to nearly $30 trillion. To better understand the challenges that come with the increasing demand for freight transportation and to improve mobility and productivity, the Federal Highway Administration (FHWA) is conducting research and analysis on freight flows and commodity movements, developing analytical tools, measuring system performance, and examining the relationships between freight transportation improvements and the economy. In partnership with other modal administrations, FHWA developed the Freight Analysis Framework (FAF), both a database and analytical tool, to capture freight flow data by mode and commodity. This information is expected to assist in the identification of points of congestion and highlight areas needing improvement. Previously released FAF products include freight flow maps for states & modes and detailed databases on traffic flows and commodity movements. Condensed statistics for Massachusetts are shown in Table III-5, including the major mode of shipping for goods sent and received, major state trading partners, and the most frequently shipped commodities.
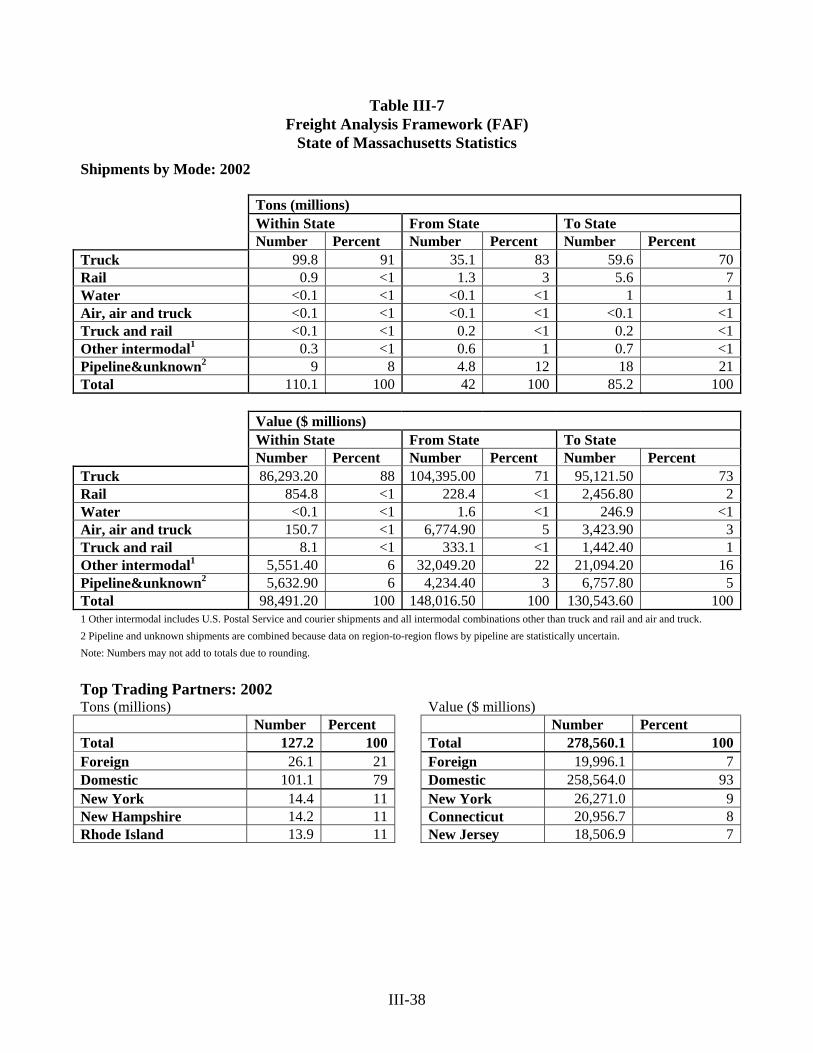
III-38
Table III-7 Freight Analysis Framework (FAF)
State of Massachusetts Statistics Shipments by Mode: 2002 Tons (millions) Within State From State To State Number Percent Number Percent Number Percent Truck 99.8 91 35.1 83 59.6 70Rail 0.9 <1 1.3 3 5.6 7Water <0.1 <1 <0.1 <1 1 1Air, air and truck <0.1 <1 <0.1 <1 <0.1 <1Truck and rail <0.1 <1 0.2 <1 0.2 <1Other intermodal1 0.3 <1 0.6 1 0.7 <1Pipeline&unknown2 9 8 4.8 12 18 21Total 110.1 100 42 100 85.2 100
Value ($ millions) Within State From State To State Number Percent Number Percent Number Percent Truck 86,293.20 88 104,395.00 71 95,121.50 73Rail 854.8 <1 228.4 <1 2,456.80 2Water <0.1 <1 1.6 <1 246.9 <1Air, air and truck 150.7 <1 6,774.90 5 3,423.90 3Truck and rail 8.1 <1 333.1 <1 1,442.40 1Other intermodal1 5,551.40 6 32,049.20 22 21,094.20 16Pipeline&unknown2 5,632.90 6 4,234.40 3 6,757.80 5Total 98,491.20 100 148,016.50 100 130,543.60 1001 Other intermodal includes U.S. Postal Service and courier shipments and all intermodal combinations other than truck and rail and air and truck. 2 Pipeline and unknown shipments are combined because data on region-to-region flows by pipeline are statistically uncertain. Note: Numbers may not add to totals due to rounding.
Top Trading Partners: 2002 Tons (millions) Value ($ millions) Number Percent Number Percent Total 127.2 100 Total 278,560.1 100Foreign 26.1 21 Foreign 19,996.1 7Domestic 101.1 79 Domestic 258,564.0 93New York 14.4 11 New York 26,271.0 9New Hampshire 14.2 11 Connecticut 20,956.7 8Rhode Island 13.9 11 New Jersey 18,506.9 7

III-39
Table III-7 (continued) Freight Analysis Framework (FAF)
State of Massachusetts Statistics
Top Commodities: 2002
Tons (millions) Within State Value ($millions) Within State Total 110.1 Total 98,491.20Waste/scrap 18.5 Machinery 13,448.3Gravel 15.9 Mixed freight 11,728.0Coal, n.e.c.1 9.2 Unknown 6,012.4Fuel oils 7.8 Electronics 6,005.2Cereal grains 7.2 Waste/scrap 4,424.41Coal and petroleum products, not elsewhere classified
Tons (millions) From State Value ($millions) From State Total 42.0 Total 148,016.5Coal, n.e.c.1 4.4 Electronics 40,513.9Newsprint/paper 3.7 Textiles/leather 19,053.6Waste/scrap 3.2 Machinery 11,235.6Mixed freight 2.6 Mixed freight 9,190.5Gravel 2.5 Precision instruments 8,681.11Coal and petroleum products, not elsewhere classified
Tons (millions) To State Value ($millions) To State Total 85.2 Total 130,543.6Coal, n.e.c.1 19.1 Electronics 16,945.2Gasoline 8.3 Machinery 12,203.6Other foodstuffs 5.8 Mixed freight 11,800.5Nonmetal min. prods.2 3.6 Textiles/leather 9,719.4Wood prods. 3.5 Motorized vehicles3 7,204.31Coal and petroleum products, not elsewhere classified 2Nonmetallic mineral products
3Motorized and other vehicles (including parts)

III-40
D.5.3 Traffic Monitoring CMRPC began conducting traffic volume counts in 1982 and has been developing a comprehensive Traffic Counting Program since 1984. Traffic volume counts are most common, but also included in the comprehensive program are a limited number of axle classification counts. The data is used by staff in its ongoing transportation planning program, including the regional travel demand forecast model, the various Management Systems and Freight Planning. Figure III-9 shows traffic volume ranges for major roadways in the region. This map was compiled using CMRPC’s extensive database of traffic volumes. Also, MassHighway’s data was used for roadways that CMRPC could not count. The highest traffic volumes are on the interstate highways, especially Interstate 90, Interstate 290, and Interstate 495. Currently, approximately 86,000 vehicles per day use the Massachusetts Turnpike between Sturbridge (Interchange 9) and Auburn (Interchange 10). Lower volumes are observed on other segments of the turnpike within the region. Daily volume surpasses 120,000 vehicles a day on sections of Interstate 290 in Worcester. Volumes on Interstate 495 in Berlin and Westborough approach 90,000 vehicles per day. In contrast, volumes on other interstate highways in the region are much lower. Interstate 84 near the Connecticut state line carries only approximately 43,000 vehicles. Interstate 190 carries over 77,000 vehicles per day north of Interstate 290, but by the time it leaves the region in West Boylston at the Sterling town line, a volume of only about 27,000 is observed. Interstate 395 also carries a relatively low volume by the time it leaves the region. Though over 45,000 vehicles use this highway in Auburn, fewer than 22,000 vehicles per day currently utilize the highway as it enters the State of Connecticut in the town of Webster. MassHighway is the agency that collected the data on the interstate highways. The diverse nature of the development in the region has resulted in widely varying traffic volume patterns. Route 9 between Lake Avenue in Worcester and I-495 in Westborough carries a volume of roughly 50,000 vehicles per day. There are several locations along Route 20, throughout the region, where volumes approach or exceed 20,000. Over 20,000 vehicles per day use a section of Route 122A in Holden. Worcester, the center of the region, is also the center of traffic in the region. Several roadways, including Belmont Street (Route 9), Cambridge Street, Grafton Street (Route 122), Highland Street (Route 9), Main Street (Route 9), and Park Avenue (Route 9, 12, and 122A), carry volumes in the 15,000 – 20,000 range. In contrast, several municipalities, especially in the northwest, have no roadways with over 10,000 vehicles per day.

BARRE
HOLDEN
SUTTONCHARLTON
DOUGLAS
SPENCER
RUTLAND
HARDWICK
OXFORD
PRINCETON
WORCESTER
UPTON
WARREN
STURBRIDGE
UXBRIDGEDUDLEY
GRAFTON
OAKHAM
LEICESTER
MENDON
AUBURN
PAXTON
BOYLSTON
BERLIN
SHREWSBURY
MILLBURY
WEBSTERSOUTHBRIDGE
WESTBOROUGH
BROOKFIELD
NEW BRAINTREE
NORTHBRIDGE
WEST BROOKFIELD
NORTHBOROUGH
NORTH BROOKFIELD
BLACKSTONE
WEST BOYLSTON
EAST BROOKFIELD
HOPEDALE
MILLVILLE
Figure III-9 Regional Traffic Flows
Information depicted on this map is for planning purposes only.This information is not adequate for legal boundary definition,regulatory interpretation, or parcel-level analysis. Use cautionintrepreting positional accuracy.
Produced by the GIS Center atCentral Massachusetts Regional Planning Commission.35 Harvard Street, Second Floor, Worcester, MA 01609-2801
50 2 4 61
Miles
LegendTown Boundary
Traffic Flow0 - 7,4997,500 - 14,99915,000 - 30,000> 30,000Not CountedIII - 41
Connecticut
Rhode Island

III-42
D.5.4 Congestion Management Process (CMP) The Intermodal Surface Transportation Efficiency Act of 1991 (ISTEA) required urban areas across the country to assess traffic congestion using a management system approach. On behalf of the CMMPO, staff at CMRPC began developing the region’s Congestion Management System in 1994. The first step was to identify “focus segments,” roadways where the traffic volume on the roadway was exceeding the operational capacity. A roadway’s capacity is defined as “the maximum hourly rate at which persons or vehicles can reasonably be expected to traverse a point or uniform section of a lane or roadway during a given time period under prevailing roadway, traffic and control conditions.”4 Utilizing the QRS II travel demand model for base year 1990 and 2020, a number of road segments across the region were identified as “congested” or “projected” to be congested by 2020. Once identified, CMRPC staff proceeded to verify and monitor the congested conditions in the field by conducting a series of travel-time-and-delay studies along roadways and turning movement counts at intersections. Utilizing the analysis of this data in conjunction with information provided by communities and MassHighway, strategies to mitigate observed congestion can then be developed. Recommendations have included signal timing optimization and coordination; signal equipment upgrades; geometric modifications, such as installation of intersection turn lanes; and deployment of ITS solutions, such as advanced warning systems and traffic control preemptive device technology for emergency responders. Occasionally, following the implementation of improvement projects, the same surveys described above are used for monitoring purposes and to assist in determining project effectiveness. It should be noted that the region’s CMP data collection schedule has the flexibility to accommodate roadways added to the focus network either through refinements to the regional model, ongoing public participation activities, or requests from the MassHighway District offices. Progress Reports for the region were compiled in 1995, 1997, and annually since 2000. Since 1998, Level-of-Service (LOS) analyses have been conducted at critical intersection locations and improvement options have been suggested for consideration. Beginning in 2000, signal warrants analyses have also been conducted under the region’s CMS program. Also notable, the Progress Reports have been utilized by the MassHighway District #3 office for project development purposes since 1996. Using more than a decade’s worth of travel time data, including repeated studies of about 25 CMP focus segments, trends in travel time were compiled, and annual growth rates were calculated. CMRPC staff has, in recent years, applied a 1.1% annual growth rate to regional traffic studies as verified through the Regional Traffic Monitoring Program. Figure III-10 depicts those roadway segments where the annual rate of increase in travel time has exceeded this 1.1% regional traffic volume annual growth rate. It should be noted that this analysis is based only on available information for about 25 CMP focus segments that have been studied more than once. There may be other roadway segments where congestion needs to be addressed, and efforts have been expanded to identify and prioritize the study of additional locations. In fact, the 2007 CMP data collection programs will provide the information needed to add a number of additional segments to this set. As the CMP program continues to evolve, this data set will more accurately reflect congested conditions within the region. 4 Highway Capacity Manual

%&l(
]Ä
w
]Ä
]Ä
]Â
%&e(
%&g(
_x
]Â
]Â
Â
Iu
Iu
]Ô
Ç
w
%&g(
!"a$
!"a$
_x
Ç
w
Ì
WORCESTER
UPTON
GRAFTON
HOLDEN
AUBURN
SHREWSBURY
MILLBURY
WESTBOROUGH
BOYLSTON
SUTTON
NORTHBOROUGH
LEICESTER
OXFORD
WEST BOYLSTON
BERLIN
NORTHBRIDGE
PAXTON
HOPEDALE
Figure III-10a Trends in Travel Time for AM Peak Hour, Worcester / Metro West Travel Area
Information depicted on this map is for planning purposes only.This information is not adequate for legal boundary definition,regulatory interpretation, or parcel-level analysis. Use cautionintrepreting positional accuracy.
Produced by the GIS Center atCentral Massachusetts Regional Planning Commission.35 Harvard Street, Second Floor, Worcester, MA 01609-2801
5
LegendCMRPC Region BoundarySegment Studied
Travel Time Growth Rates0.00 - 1.09%1.10 - 5.00%5.01 - 10.00%Greater than 10%
Other Travel TimesDecrease in Travel TimeNo AM Data Collected
0 2.51.25Miles
III - 43
Data collected by CMRPC transportation staff as part of the 1995-2006 Congestion Management System (CMS) program.

%&l(
w
]Ä
]Â
]Â
Â
Iu
Iu
]Ô
Ç
w
%&g(
!"a$
_x
Ç
w
Ì
]È
Ì
SUTTON
UPTON
GRAFTON
MENDON
WORCESTER
MILLBURY
DOUGLAS
UXBRIDGE
NORTHBRIDGE
WESTBOROUGH
AUBURN
SHREWSBURY
OXFORD
HOPEDALE
WEBSTER
NORTHBOROUGH
Figure III-10b Trends in Travel Time for AM Peak Hour, Blackstone Valley Travel Area
Information depicted on this map is for planning purposes only.This information is not adequate for legal boundary definition,regulatory interpretation, or parcel-level analysis. Use cautionintrepreting positional accuracy.
Produced by the GIS Center atCentral Massachusetts Regional Planning Commission.35 Harvard Street, Second Floor, Worcester, MA 01609-2801
5
LegendCMRPC Region BoundarySegment Studied
Travel Time Growth Rates0.00 - 1.09%1.10 - 5.00%5.01 - 10.00%Greater than 10%
Other Travel TimesDecrease in Travel TimeNo AM Data Collected
0 2.51.25Miles
III - 44
Data collected by CMRPC transportation staff as part of the 1995-2006 Congestion Management System (CMS) program.

à
]Ä
¾!"$
Iu
!"a$
Ö
]Õ
]â
]Â
w
]Ä
]Â
]ä
]Â
Iu
%&g(
%&k(
!"a$
]È
CHARLTON
OXFORD
SPENCER
LEICESTER
AUBURN
STURBRIDGE
WORCESTER
DUDLEY
SUTTON
MILLBURY
BROOKFIELD
DOUGLASSOUTHBRIDGE
WEBSTER
NORTH BROOKFIELD
EAST BROOKFIELD
Figure III-10c Trends in Travel Time for AM Peak Hour, Worcester West Travel Area
Information depicted on this map is for planning purposes only.This information is not adequate for legal boundary definition,regulatory interpretation, or parcel-level analysis. Use cautionintrepreting positional accuracy.
Produced by the GIS Center atCentral Massachusetts Regional Planning Commission.35 Harvard Street, Second Floor, Worcester, MA 01609-2801
5
LegendCMRPC Region BoundarySegment Studied
Travel Time Growth Rates0.00 - 1.09%1.10 - 5.00%5.01 - 10.00%Greater than 10%
Other Travel TimesDecrease in Travel TimeNo AM Data Collected
0 2.51.25Miles
III - 45
Data collected by CMRPC transportation staff as part of the 1995-2006 Congestion Management System (CMS) program.

%&l(
]Ä
w
]Ä
]Ä
]Â
%&e(
%&g(
_x
]Â
]Â
Â
Iu
Iu
]Ô
Ç
w
%&g(
!"a$
!"a$
_x
Ç
w
Ì
WORCESTER
UPTON
GRAFTON
HOLDEN
AUBURN
SHREWSBURY
MILLBURY
WESTBOROUGH
BOYLSTON
SUTTON
NORTHBOROUGH
LEICESTER
OXFORD
WEST BOYLSTON
BERLIN
NORTHBRIDGE
PAXTON
HOPEDALE
Figure III-10d Trends in Travel Time for PM Peak Hour, Worcester / Metro West Travel Area
Information depicted on this map is for planning purposes only.This information is not adequate for legal boundary definition,regulatory interpretation, or parcel-level analysis. Use cautionintrepreting positional accuracy.
Produced by the GIS Center atCentral Massachusetts Regional Planning Commission.35 Harvard Street, Second Floor, Worcester, MA 01609-2801
5
LegendCMRPC Region BoundarySegment Studied
Travel Time Growth Rates0.00 - 1.09%1.10 - 5.00%5.01 - 10.00%Greater than 10%
Other Travel TimesDecrease in Travel Time
0 2.51.25Miles
III - 46
Data collected by CMRPC transportation staff as part of the 1995-2006 Congestion Management System (CMS) program.

%&l(
w
]Ä
]Â
]Â
Â
Iu
Iu
]Ô
Ç
w
%&g(
!"a$
_x
Ç
w
Ì
]È
Ì
SUTTON
UPTON
GRAFTON
MENDON
WORCESTER
MILLBURY
DOUGLAS
UXBRIDGE
NORTHBRIDGE
WESTBOROUGH
AUBURN
SHREWSBURY
OXFORD
HOPEDALE
WEBSTER
NORTHBOROUGH
Figure III-10e Trends in Travel Time for PM Peak Hour, Blackstone Valley Travel Area
Information depicted on this map is for planning purposes only.This information is not adequate for legal boundary definition,regulatory interpretation, or parcel-level analysis. Use cautionintrepreting positional accuracy.
Produced by the GIS Center atCentral Massachusetts Regional Planning Commission.35 Harvard Street, Second Floor, Worcester, MA 01609-2801
5
LegendCMRPC Region BoundarySegment Studied
Travel Time Growth Rates0.00 - 1.09%1.10 - 5.00%5.01 - 10.00%Greater than 10%
Other Travel TimesDecrease in Travel Time
0 2.51.25Miles
III -47 Data collected by CMRPC transportation staff as part of the 1995-2006 Congestion Management System (CMS) program.

à
]Ä
¾!"$
Iu
!"a$
Ö
]Õ
]â
]Â
w
]Ä
]Â
]ä
]Â
Iu
%&g(
%&k(
!"a$
]È
CHARLTON
OXFORD
SPENCER
LEICESTER
AUBURN
STURBRIDGE
WORCESTER
DUDLEY
SUTTON
MILLBURY
BROOKFIELD
DOUGLASSOUTHBRIDGE
WEBSTER
NORTH BROOKFIELD
EAST BROOKFIELD
Figure III-10f Trends in Travel Time for PM Peak Hour, Worcester West Travel Area
Information depicted on this map is for planning purposes only.This information is not adequate for legal boundary definition,regulatory interpretation, or parcel-level analysis. Use cautionintrepreting positional accuracy.
Produced by the GIS Center atCentral Massachusetts Regional Planning Commission.35 Harvard Street, Second Floor, Worcester, MA 01609-2801
5
LegendCMRPC Region BoundarySegment Studied
Travel Time Growth Rates0.00 - 1.09%1.10 - 5.00%5.01 - 10.00%Greater than 10%
Other Travel TimesDecrease in Travel Time
0 2.51.25Miles
III - 48
Data collected by CMRPC transportation staff as part of the 1995-2006 Congestion Management System (CMS) program.

III-49
For all intersections where turning movement counts are obtained, it is possible to analyze the total delay encountered during the examined peak hour periods. A byproduct of the process that results in intersection LOS ratings is the “average delay encountered for entering vehicles.” When multiplied by the number of vehicles to which the particular delay pertains, we can arrive at a total amount of waiting time in “car-minutes.” A car-minute is one car waiting for one minute, presumably idling and producing emissions as well as adding to total social and economic costs. Five cars waiting for a minute each, or one car waiting for a total of five minutes, results in the same theoretical total waiting time cost and would be measured and quantified by a total net delay of five car-minutes. Signalized intersections have delays of varying levels in all directions, and this is accounted for. Stop sign controlled intersections have delay counted only for those vehicles arriving on the minor approaches that are required to stop as well as those vehicles on the major approaches that often times need to wait in order to make a left turn. Generally speaking, signalized intersections have more total delay, but a busy stop-controlled location that may not presently meet the warrants for signalization can have substantial delays if volumes on the minor approaches seek to cross the major approaches. Signals establish orderly traffic flows and increase safety by providing the opportunity for traffic to proceed on both the major and minor intersection approaches, thus balancing encountered vehicle delay. When two heavily traveled streets cross at a major signalized intersection, significant delays are often generated due to the high traffic volumes that need to be accommodated. Only after signal operations are optimized are geometric improvements considered, such as the construction of additional travel lanes. The 2005 CMS Progress report provides a table that shows these delay totals for recently observed intersections throughout the CMRPC planning region. The average total peak-hour delay in car-minutes for the analyzed intersections is 2,891 car-minutes. Figure III-11 shows the 97 intersections studied as part of the CMP and highlights the 33 intersections whose total calculated peak-hour delay exceeds the average of the set. At minimum, vehicle delay at these 38 locations needs to be reduced by mitigation strategies, such as geometric and lane marking improvements to enable more efficient turning movements, signal coordination to improve through flows on heavy travel corridors, and/or the installation of new or enhanced traffic control equipment. It should be noted that this analysis is based only on the analysis of 97 intersections within the region identified for further study based on the CMP field verification of congested conditions originally identified by the regional travel-demand and forecast model. There may be other congested intersections that need to be addressed, and efforts have been expanded to identify and prioritize additional locations. In fact, approximately15 additional locations will be studied as part of the 2007 CMP program. As more intersections are studied and analyzed, this data set will more accurately reflect congested conditions within the region.

]Ö
}
%&l(
!"a$
ß¾Ö
à
Þ]Ä
]Ä
¾!"$
Iu
!"a$
Ö]Õ
]ë
]âÏ
]Ê]ë
]Â
]Â
]Â
w
]Ä
]Õ
Ï
×
]Ö
w
]Ö
w
]Öa
]º
]ì
]ä
]Ä
]Õ
]í
]í
%&e(r
r
]õ
Ç
]¹
]¹
k
j
j
]è
]è
]ì
]Ä
]Ä j
]Â
]Õ
]Ô]õ
]ä
]í
Ç
%&e(
%&g(_x
_x
w
%&l(
]Â
]Â
Â
Iu
Iu
]ÔÇ
w%&g(
%&k(
!"a$
!"a$
_x
%&l(Ç
w
w
Ì
]È
Ì
]÷
]È
!.!.
!. !.!.!.!.!.!.
!.!.!.!.
!.!.
!.
!.
!.
!.!.
!.!.!.
!.!.
!.
!.
!.!.
!.
!.!.!.
!.!.!.!.!.!.!.!.!.!.
!.
!.!.
!.!.
!.!.
!.!.
!.
!.!.
!.
!.
!.
!.
!.
!.!.
!.
!.!.!.
!.
!.!.
!.
!.
!.
!.
!.
!.!.
!.!.
!.!.
!.
!.!.!.
!.
!.!.!.
!.
!.
!.
!.!.
!.
!.!.!.
!.
!.
!.!. !.
!.
!.!.
!.
!.
!.
!.
!.
!.
!.!.!.
BARRE
HOLDEN
SUTTONCHARLTON
DOUGLAS
SPENCER
RUTLAND
HARDWICK
OXFORD
UPTON
WARREN
PRINCETON
WORCESTER
STURBRIDGE
UXBRIDGEDUDLEY
GRAFTON
OAKHAM
LEICESTER
MENDON
PAXTON
AUBURN
BOYLSTON
BERLIN
MILLBURY
WEBSTERSOUTHBRIDGE
WESTBOROUGH
NEW BRAINTREE
NORTHBRIDGE
SHREWSBURY
BROOKFIELD
WEST BROOKFIELD
NORTHBOROUGH
NORTH BROOKFIELD
BLACKSTONE
WEST BOYLSTON
EAST BROOKFIELD
HOPEDALE
MILLVILLE
Figure III-11 Encountered Peak Hour Delay at Critical Intersections Studied (1996 - 2006)
Information depicted on this map is for planning purposes only.This information is not adequate for legal boundary definition,regulatory interpretation, or parcel-level analysis. Use cautionintrepreting positional accuracy.
Produced by the GIS Center atCentral Massachusetts Regional Planning Commission.35 Harvard Street, Second Floor, Worcester, MA 01609-2801
5
LegendCMRPC Region Boundary
Intersection Delay*!. Less than 2,792!. 2,792 - 5,000!. 5,001 - 10,000!. 10,001 - 15,000!. Greater than 15,000
0 2 4 61Miles
III - 50
ConnecticutRhode Island
* In car-minutes per hour: The total number of minutes that drivers as a group wait at the intersection during the AM+PMhours. 2,792 minutes is the average peak hour delay of theintersections studied.
Data collected by CMRPC transportation staff as part of the 1995-2006 Congestion Management System (CMS) program.

III-51
D.5.5 Intelligent Transportation Systems (ITS) & Operations Technology has found its way into nearly every aspect of our lives, and so it should come as no surprise that it is now being used extensively in ways that improve everyday mobility. From traffic signals to toll collectors to transit fare payment systems, technology is spreading quickly in ways that increase the efficiency of the transportation system. Intelligent Transportation Systems, or ITS, is the use of electronics, communications, or information processing to improve the efficiency or safety of transportation systems. Because ITS transportation solutions are real-time solutions, they are a natural fit for improving the management and operations of transportation systems. Management and operations encompass daily roadway actions, such as reconstruction and maintenance, snow plowing and salting, providing real time traveler information, and traffic signalization. It also encompasses special circumstances like preparing and responding to accident-related congestion, planned special events, and unplanned security concerns. By focusing on the evolving technology of ITS and the day-to-day activities of management and operations, transportation planners have a greater opportunity of providing more efficient and effective solutions to the region's transportation problems.
While computer-based technology improvements are happening daily within the sphere of the central Massachusetts transportation system, most are not yet real-time, nor are they multi-agency. One of the fastest growing technology improvements is computer-actuated signalization using sensors in the pavement or cameras on the signal equipment, such as those used within the City of Worcester. While it is not typically responsive to changing levels of congestion, it can help to keep traffic at optimum levels under most predictable circumstances.
Cameras that are used to monitor traffic congestion levels have been installed at intersections in other regions. When congestion becomes an issue, the signals at these intersections are adjusted remotely to improve traffic flows. Cameras have also been strategically located along I-290 to provide SmartRoutes, a traveler information service, to provide real-time information on commuter congestion via television and, eventually, on the internet.
Pre-emptive devices on traffic signals that allow for emergency vehicles to proceed quickly through intersections are very common, especially within the urban core. In the past, there were issues with technology incompatibility between different products, but the 2006 Emergency Medical Technician (EMT) Survey showed that most mobile devices are currently adaptive to the various fixed devices used on traffic signals poles. (See Chapter III - Regional Highway System for more information on the EMT survey) While using electronics to improve efficiency or safety is not a totally new idea, what is new is the level of planning and coordination to ensure that different ITS projects can “talk” to each other and “work” together. Section 5206(e) of the 1997 Transportation Equity Act for the 21st Century (TEA-21) required all ITS projects funded through the Highway Trust Fund to be in conformance with the National ITS Architecture and applicable standards. The National ITS Architecture is a common, established framework for developing integrated transportation systems and is maintained by the United States Department of Transportation (USDOT). The US Department of Transportation required a compliant Regional ITS Architecture to be in place by April 8, 2005 in regions that are deploying ITS projects.

III-52
In 2004, the Executive Office of Transportation-Office of Transportation Planning (EOT-OTP) led the effort to develop a Central Massachusetts Regional ITS Architecture. CMRPC coordinated by building local involvement and support for the effort. During the needs analysis step of the Regional Architecture development process, the Guidance Committee identified key regional needs and major themes for the Regional ITS Architecture. These findings helped shape the architecture to the unique circumstances of central Massachusetts. The four regional needs were: congestion management; transit efficiency; efficient use of existing infrastructure; and economic development. The three major themes expressed by participants were: transit demand and revenue; traffic congestion and traveler information; and use of ITS data. From these expressed regional needs and major themes came four Near-Term Multi-Agency Initiatives that were recommended by the Guidance Committee for Central Massachusetts. They are:
• Event Reporting System: Internet-based tool that serves as a centralized repository for information on events affecting the transportation network.
• Expansion of the Massachusetts Interagency Video Integration System (MIVIS): Expansion of video sharing and distribution system to allow sharing of real-time video feeds among a larger group of agencies.
• 511 Travel Information System: Public travel information system, covering the roadways and transit services in the region.
• Planning Data Archive: System for coordinating the planning data archives for the transportation agencies in the region.
The 511 Travel Information System is the only initiative that is actively being pursued at this time. The EOT is in the process of negotiating a contract with which to implement the 511 system statewide. The timeline for implementation will not be known until the contract negotiations are complete. The CMMPO work program for FY’07 includes a task to identify and assist EOT-OTP and other regional stakeholders in effecting implementation of all the “near-term multi-agency initiatives” outlined in the Regional Architecture. D.5.6 Activities that Support Reduction in Single-Occupancy Vehicles D.5.6.1 Transportation Demand Management Program In order to reduce the pollution created by mobile and stationary sources, the Clean Air Act Amendments (CAAA) of 1990 call for cleaner fuels, cleaner vehicles and reductions in vehicle miles of travel (VMT). Additionally, the 1991 Intermodal Surface Transportation Efficiency Act (ISTEA) mandated that transportation plans include provisions for improved air quality through reductions in energy consumption and pollution levels. The entire Commonwealth of Massachusetts is currently designated in the “serious” non-attainment category for ozone producing pollutants, while the City of Worcester has been classified in the “maintenance” category for carbon monoxide (CO) pollution levels, having been reclassified from “non-attainment” in 2002. Under the ISTEA legislation, funds were set aside specifically for Congestion Management and Air Quality (CMAQ) projects. Funding was continued under the Transportation Equity Act for the 21st Century (TEA-21) and SAFETEA-LU. A variety of programs are available for funding with CMAQ funds, one of which is the Transportation Demand Management Program (TDM), which has several purposes:

III-53
• To support projects and programs that offer additional choices of transportation services to commuters and others that reduce traffic congestion and air quality impacts, such as alternatives to single-occupancy vehicles (SOV) travel, cycling and walking programs;
• To support TDM programs through the development and improvement of infrastructure; and • To provide seed money for operating assistance for new transportation services that are effective
in reducing transportation demand; such as vanpooling and transit subsidies. (Please refer to Section VIII, “Regional Air Quality Issues”, for further information on this topic.) D.5.6.2 Rideshare Activities One possible method to aid in the reduction of mobile source emissions would be to increase the existing level of ridesharing activities. MASSRIDES, the Executive Office of Transportation’s statewide travel options program, provides assistance to commuters, employers, students, and others, by facilitating transit and shared-ride transportation as alternatives to drive-alone commuting through its toll-free telephone line (1-888-4-COMMUTE) and information center on the web (www.commute.com). These resources put Massachusetts commuters in touch with the statewide computerized ride matching system database that delivers carpools, vanpools, and transit alternatives that match their work trip. Within CMRPC’s region, MASSRIDES encourages all alternatives to drive-alone commuting, including WRTA transit service, carpools, vanpools, biking and walking. Vanpools are comprised of groups of 12 to 15 commuters who travel to work each day. Riders pay a monthly fare, based on the length of the trip, which includes use of the van, fuel, parking, tolls, insurance and maintenance. Vanpools are cost-effective on relatively long commutes, as the current average daily round trip length of over 100 miles illustrates. One vanpool commuter, or a combination of commuters, drives free and has personal use of the van. Regular vanpool riders also save 10 percent on the collision and property damage section of Massachusetts automobile insurance bills. In addition, vanpools qualify for the Massachusetts Turnpike Authority’s Carpool Pass Program for discounted tolls. There are currently 10 vanpools originating in CMRPC’s region, as shown in Table III-4. All of the MASSRIDES vanpools listed in the table have destinations in the Boston metropolitan area and use the Massachusetts Turnpike (I-90) as the primary route of travel. It should be noted, however, that MASSRIDES officials have emphasized that individual vanpools and riders change according to personal circumstances. One of the advantages of vanpools is flexibility. Routes change frequently to meet commuters’ needs. Commuters commit to vanpools for only 30 days at a time. Therefore, the number of MASSRIDES vanpools operating within the region at any given time is subject to change.

III-54
Table III-8 MASSRIDES Vanpools Originating in the CMRPC Region
Route Number of Vanpools Auburn to Boston 1 Auburn/Millbury to Boston 1 Millbury to Boston 4 Sturbridge to Boston 1 Westborough to Boston 1 Worcester/Millbury to Boston 1 Worcester/Westboro to Chelsea 1
Total 10 Measures that attempt to promote ridesharing activities through employers include the following:
• The Massachusetts Rideshare Regulation: Established in the late 1970s, this regulation requires that major employers provide on-site commuter services. To comply, facilities that employed 250 or more “applicable” employees in the last 12 months must implement commuter programs that reduce SOVs by 25 percent. “Applicable” employees work 17 or more hours per week for 20 or more weeks per year, travel to the facility in order to work there, and do not customarily use their vehicle in the course of employment. If a company employs more than 1,000 persons at a single facility, it must implement a vanpool program. Massachusetts law allows employers a 30% tax credit of the cost of purchasing or leasing a commuter van for its employees. Other employer-sponsored commuter programs, such as transit pass programs, preferential parking, and incentives for bicycle commuting are also are suggested under this regulation.
• SAFETEA-LU: The Commuter Choice provisions of TEA-21, which amended the federal tax
code to offer employers new options for saving money while supporting transit and vanpool commuting, were continued under SAFETEA-LU. MASSRIDES provides developers and employers with resources to take advantage of this initiative and create incentives, such as:
Commuter Tax Benefits/Pass Sales – Section 132(f) of the federal tax code allows employers
to support transit and vanpool options in ways that benefit both employers and employees. Employer financed: Employers may give employees up to $105 monthly in tax-free
benefits for transit or vanpool commuting. Companies then treat the cost as a deductible cost of doing business.
Employee financed: Employers may also permit employees to set aside up to $100/month in pre-tax income to pay for transit and vanpool commuting costs. Employers save payroll costs, while employees save payroll and income taxes on commuting expenses.
Combination: Employers and employees may share transit and vanpool commuting costs, again, to the $105 monthly limit.
Companies who sell transit passes at the work site offer added convenience for their employees who commute using transit. Employers may also provide parking benefits up to $190 monthly in any of the three ways outlined above.

III-55
Emergency Ride Home Programs – Emergency ride home programs promote shared-ride commuting by insuring that people will not be stranded in case of an emergency. Employers, developers and TMAs offer emergency ride home programs to encourage drive alone commuters to carpool, vanpool, or use public transit. Commuters are more likely to use transit or shared ride-commuting modes of transportation if they are assured of a ride home in cases of personal or family illness, unexpected overtime or other emergencies. Companies that provide emergency ride home programs report that employees utilize the program for true emergencies only. Successful examples of established ride home programs include: Company Car, available for emergencies or unscheduled overtime Taxi service, where employees either pay for the taxi and are reimbursed or present a
voucher provided by the employer Rental cars, usually for commutes over 20 miles
Preferential Parking for Carpools and Vanpools - Companies can encourage ridesharing by
waiving parking fees or offering discounts. In addition, priority in the assignment of spaces can be given to carpools and vanpools. In areas with free parking, reserving the most convenient spaces for shared ride commuters encourages these modes and compensates commuters for the extra time they take picking up passengers on the way to work.
D.5.6.3 Park-and-Ride Facilities within the Region MassHighway supports the development of Park-and-Ride facilities as an integral part of the multimodal transportation system throughout the Commonwealth. These facilities enhance the mobility of the traveling public by providing transfer points for automobiles, bicycles, pedestrians, and other feeder transportation services needing access to and from car and vanpools, rapid transit, bus, passenger rail, ferry boat, and other transportation services. As this system is further developed, it will lead to improved transportation while reducing congestion and improving air quality. MassHighway published a Park-and-Ride Utilization Study in March 2006. Within the CMRPC region, the study surveyed the MassHighway lot in Berlin as well as the Massachusetts Turnpike lots in Auburn, Grafton, Millbury, Sturbridge, Westborough, and Worcester. These lots are illustrated in Figure III-12. The primary purpose of his study was to determine the utilization and the community of origin of users of the lots. The lots were counted in the spring of 2005 by tallying the number of cars in each lot and recording license plate numbers. The Massachusetts license plate numbers were matched against the Registry of Motor Vehicles database to determine the community of origin of the parked vehicle, which was approximately 2 years old at the time resulting in varying success rates for matching. No attempts were made to match out-of-state plates. MassHighway’s findings are provided in Table III-5.

!.!.
!.
!.
!. !.!. !.!.!.
!.
!.
!.
!.
!.
!.
!.
!.
!.!.
]Ö
}
%&l(
!"a$
ß¾Ö
à
Þ]Ä
]Ä
¾!"$
Iu
!"a$
Ö]Õ
]ë
]âÏ
]Ê]ë
]Â
]Â
]Â
w
]Ä
]Õ
Ï
×
]Ö
w
]Ö
w
]Öa
]º
]ì
]ä
]Ä
]Õ
]í
]í
%&e(r
r
]õ
Ç
]¹
]¹
k
j
j
]è
]è
]ì
]Ä
]Ä j
]Â
]Õ
]Ô]õ
]ä
]í
Ç
%&e(
%&g(_x
_x
w
%&l(
]Â
]Â
Â
Iu
Iu
]ÔÇ
w%&g(
%&k(
!"a$
!"a$
_x
%&l(Ç
w
w
Ì
]È
Ì
]÷
]È
BARRE
HOLDEN
SUTTON
DOUGLAS
CHARLTON
RUTLAND
SPENCER
HARDWICK
OXFORD
UPTON
WARREN
PRINCETON
WORCESTER
STURBRIDGE
UXBRIDGEDUDLEY
GRAFTON
OAKHAM
LEICESTER
MENDON
AUBURN
PAXTON
BOYLSTON
BERLIN
MILLBURY
WEBSTERSOUTHBRIDGE
WESTBOROUGH
NEW BRAINTREE
NORTHBRIDGE
SHREWSBURY
BROOKFIELD
WEST BROOKFIELD
NORTHBOROUGH
NORTH BROOKFIELD
BLACKSTONE
WEST BOYLSTON
EAST BROOKFIELD
HOPEDALE
MILLVILLE
Figure III-12 The Regional Park-and-Ride Facilities
Information depicted on this map is for planning purposes only.This information is not adequate for legal boundary definition,regulatory interpretation, or parcel-level analysis. Use cautionintrepreting positional accuracy.
Produced by the GIS Center atCentral Massachusetts Regional Planning Commission.35 Harvard Street, Second Floor, Worcester, MA 01609-2801
5
LegendTown Boundary
MBTA Commuter Rail Line
!. Mass. Highway Department Facility
!. Mass. Turnpike Authority Facility
!. MBTA Commuter Rail Facility
0 2 4 61Miles
III - 56
Connecticut
Rhode Island

III-57
Table III-9 2006 MassHighway Park-and-Ride Use Study Findings
Lot Capacity Utilization % License
Plate Matches
Top 3 Communities of Origin
Berlin, I-495 Exit 26 45 67% 57% Clinton Acton Athol
Auburn, I-90 Exit 10 135 98% 81% Worcester Spencer Auburn
Grafton, Route 122 (1/2-mile east of Exit 11)
500 1% 100% Grafton Leicester
Millbury, I-90 Exit 10A 446 22% 67% Worcester Auburn Douglas
Millbury, I-90 Exit 11 140 51% 79% Worcester Grafton Millbury
Sturbridge, I-90 Exit 8 50 20% 86% Boston Burlington Milford
Westborough, Route 9 (3 miles west of I-495 Exit 23)
100 0% --- ---
Worcester, Route 122 (3 miles north of I-90 Exit 11)
90 0% --- ---

III-58
D.5.6.4 Trends in Peak Hour Usage at the Berlin Park-and-Ride Facility As part of the region’s Congestion Management Process (CMP), peak period parking accumulation and utilization surveys are conducted annually at the MassHighway maintained Park-and-Ride lot on Route 62 at I-495 in the town of Berlin-the only such facility in the region. Staff has monitored both the utilization and physical condition of the Berlin lot since 1995. The results of the utilization studies have been summarized and graphed in each annual CMP Progress Report. A listing of potential improvements has also been compiled. Staff has also monitored the seasonal fluctuation of parking levels at this location. Usage at the MassHighway Park-and-Ride in Berlin has been compiled by counting and analyzing the number of vehicles that enter and exit the facility as well as the number that remain parked. The following figures show the annual results using sample observation days over the past several years. The total usage shown in the charts is in car-hours, that is, the number of vehicles in the lot multiplied by the amount of time they remain there. These values are calculated for the busier AM and PM peak travel periods when, presumably, most of the activity at the lot occurs. Trends have been about even by this measure up through about 2003. Since then, there has been a notable and sustained increase in usage, even though slightly lower levels of traffic were recently observed on Route 62. This trend has most likely been the result of fuel price increases. It is probable that as long as price pressure continues this lot will continue to be well-utilized. Morning usage is heavier, and 20 cars were present in the lot at the beginning of the 2006 observation period, higher than previous years. Many of the trips to the lot during the day and much of its usage is for the transfer of passengers as opposed to clear and direct pooling; vehicles will rendezvous to exchange riders and thus will not stay in the lot for any appreciable period of time. By its nature, that type of activity would not be counted in the car-hour measurement figures. However, it appears that this type of activity is still one that is worthy of support, as it is apparent that an increase in the utility of commuting vehicles is being attained. Based on the direct correlation between fuel prices and the usage of this lot it would seem that any additional areas made available for this type of activity would be well-received and beneficial to the transportation network.

III-59
Morning Peak Period (6:00-8:30)
01020304050607080
1995 1996 1997 1998 1999 2000 2001 2002 2003 2004 2005 2006
Year
Car
-hou
rs
Evening Peak Period (3:30-6:00)
0
10
20
30
40
50
60
1995 1996 1997 1998 1999 2000 2001 2002 2003 2004 2005 2006
Year
Car
-hou
rs
Figure III-13: Observed Usage at Berlin Park-and-Ride Lot

III-60
D.5.7 Potential Major Infrastructure Improvement Projects D.5.7.1 Identification of Proposed Improvement Concepts Over the years, there have been a number of significant mobility enhancement concepts that have been proposed, studied, and/or evaluated within the region as part of the CMMPO’s ongoing transportation planning, management systems, and public outreach activities. As part of the development of this RTP, the CMMPO staff compiled a summary of capital improvement project concepts that would be expected to exceed $5 Million in cost. Since the CMMPO region has typically received between $10 and $12 million annually in target funding to program on the Transportation Improvement Program (TIP), projects exceeding $5 million would be expected to utilize a significant portion of the region’s funding. As such, each of the following improvement concepts were specifically discussed by the CMMPO and its advisory committee, the Central Massachusetts Transportation Planning Committee (CMTPC), as part of this long-range planning effort. Mass Pike (I-90) / I-290 / I-395 / US Route 20 / Route 12 Interchange, Auburn
• 1993 American Trucking Association (ATA) Survey identified this area’s “poor ramp design” as a structural impediment to efficient freight flow within the region.
• 2005: In response to a request from EOT to identify non-commuter congestion, CMRPC identified this interchange as experiencing severe back-ups during holiday weekends and Friday and Sunday evenings during the summer. It was also noted that Friday evening weekend and holiday traffic is exacerbated by PM peak-hour commute traffic. Massachusetts Turnpike Authority staff indicated that their traffic data verified this observation.
• 2005 Auburn Master Plan includes objective to “advocate for funding to modernize the Massachusetts Turnpike (I-90)/I-290/I-395 interchange with a layout that considers Auburn’s needs and issues.”
Mass Pike (I-90) / I-495 Interchange, Westborough, Hopkinton
• 1993 American Trucking Association (ATA) Survey identified this interchange’s “poor ramp design” as a structural impediment to efficient freight flow within the region
• 2004 Arc of Innovation -- 495 Metrowest Corridor Top Ten Traffic Nightmares: Identified as “Nightmare #3”
• 2006 stakeholder consultation interviews conducted for the 2007 RTP revealed a long-term vision of an intermodal “Super Station” serving interstate highway traffic and adjacent CSX rail line, which accommodates both freight movement and MBTA Commuter Rail service.
I-190 / I-290 Interchange, Worcester
• May 2005: Citizen written comment (re: TIP) expressed concern regarding confusing signage and potential safety issues at I-190/I-290 eastbound split. The guide signs have since been inventoried by CMRPC staff with the intent of utilizing the information as part of a larger effort to improve the operation of I-290 through Worcester. While crash research has yet to be conducted, a number of recent significant vehicle crashes have been noted, including at least one that has resulted in a fatality.

III-61
I-190 / Malden Street Interchange Construction, Holden, West Boylston
• 1969 Worcester Urbanized Area Transportation Study (WUATS) identified need to consider a new highway to carry traffic between Route 68 and I-190.
• 1977 Holden Corridor Planning Study investigated potential alignments for a connector between Route 31 and I-190.
• 1983 Holden Transportation Study further analyzed the impacts of a potential connector and developed improvement options for Route 122A (Main St).
• 1990 Main Street Bypass Feasibility Study incorporated an origin-destination survey conducted in 1989 and provided pre-engineering analyses for improvements to Main Street, the construction of a bypass, and the addition of an interchange at I-190 on Malden Street.
• 1993 Central Massachusetts RTP (and subsequent RTP documents): Travel Demand Model indicated that a new interchange at Malden Street with a bypass between Route 31 and I-190 would be very well utilized.
• 2004 Worcester City Council expressed interest in discussing the potential for a new I-190 interchange in Holden.
• 2005 West Boylston Master Plan noted opposition to a new interchange on I-190, stating “it would need to be shown that the regional benefits of improved traffic flow would not unduly impact West Boylston residents or alter the character of local streets.”
• 2006 public outreach meetings for the 2007 RTP solicited comments regarding the need to address increasing traffic on Route 68 and provide relief to congestion on Route 122A via a bypass or connector facility.
• 2007 Holden Master Plan (under development): Community has requested CMRPC to utilize its current Travel Demand Model to assess the “relative attractiveness” of a potential new interchange and the ability for the local roadway to support travel to this location.
I-290 / I-495 Interchange, Marlborough (MAPC; impacts CMMPO Northeast subregion)
• 2004 Arc of Innovation -- 495 MetroWest Corridor Top Ten Traffic Nightmares: Identified as “Nightmare #2”
• 2005 Correspondence from MAPC to CMRPC indicates that this interchange project is recognized on the Boston MPO 2007-2010 TIP.
• 2006: Massachusetts Transportation Secretary Cogliano announced that MassHighway had begun the permitting process for the conceptual plan to construct a flyover ramp to eliminate existing hairpin turn on I-290 east ramp to I-495 north.
I-290 / Hope Avenue Interchange, Worcester, Auburn
• 1979 Southwest Worcester Corridor Planning Study documented mobility issues between southwestern section of Worcester, its surrounding communities, and the interstate system. The study also included recommendations to improve the Hope Avenue interchange.
• 1993 Central Massachusetts RTP (and subsequent RTP documents) referenced the need to investigate Route 9 West bypass options between Hope Avenue in Worcester and Route 9 in Leicester and Spencer.

III-62
• 2000 Greater Worcester Access Improvement Project (GWAIP) investigated alternative alignments for new and improved roadways to address the need for improved access between southwest Worcester and the interstate highway system. The Hope Avenue Extension Alternative called for reconstructing the Hope Avenue interchange to allow for full access in both directions on I-290 as well as on Hope Avenue.
• 2005 Auburn Master Plan includes objective to “work with neighboring communities, CMRPC, and MassHighway to improve access from I-290 to western Worcester and Leicester to divert regional traffic from Heard Street and Oxford Street North.”
• April 2006: EOT presented its Proposed East-West Corridor Projects (City of Worcester) to the CMMPO. Mobility improvements to three routes (north, central, south) focus on modifying intersection configurations and operations. As part of the southern route improvement project concept, the proposal recommends upgrading the partial interchange of I-290 at Hope Avenue to a full interchange through new ramp construction and intersection improvements.
I-290 / Vernon Street / Kelley Square Interchange, Worcester
• 1995 Congestion Management System (CMS) Progress Report identified the need to improve travel and safety conditions at Kelley Square.
• 2001: Project to replace the Vernon Street bridge over I-290, replace and install signals at the I-290 ramps, and improve intersection geometrics at Kelley Square introduced to Project Review Committee (PRC).
• April 2006: EOT presented its Proposed East-West Corridor Projects (City of Worcester) to the CMMPO. Mobility improvements to three routes (north, central, south) focus on modifying intersection configurations and operations. Kelley Square improvements are included as part of the central route improvement project concept.
• CMMPO 2007-2010 TIP lists reconstruction, signalization, and bridge replacement at this location within the listing of “potential project proposals for further evaluation.”
I-395 / Cudworth Road Interchange Improvements with Newly Constructed French River Parkway, Oxford, Dudley, Webster
• 2006: Town of Oxford requested that the CMMPO consider including a project to extend Route 49 from Cudworth Road in Oxford west to Route 20 in Sturbridge on the 2007-2010 STIP.
• 2006: Representatives from the towns of Oxford, Dudley, and Webster met with CMRPC staff to discuss construction of a new roadway between I-395 and Old Webster Road to alleviate congestion in downtown Oxford by increasing the utilization of the Cudworth Road interchange and to provide access to industrial land in southern Oxford for economic development.
I-495 / Route 9 Interchange, Westborough/Southborough
• 2004 Arc of Innovation -- 495 MetroWest Corridor Top Ten Traffic Nightmares: Identified as “Nightmare #10”

III-63
• 2005: Town of Westborough discussions with CMRPC regarding Westborough traffic included the potential for a slip ramp within the southwest quadrant as a mitigation measure for nearby development.
• 2006 EMC development proposal includes improvements to the eastern (Southborough) side of this interchange.
US Route 20, Region-wide
• 1986 Route 20 Corridor Safety Study (Route 12 to I-84) recommended operational and safety improvements, including minimizing left turns, increasing enforcement to control speeding, minimizing lane changes and merges by providing a consistent cross-section, improving lighting, enhancing pedestrian safety, and increasing setback requirements to allow for potential future widening of the highway.
• 1989 US Route 20 East Phase 1 & 1991 US Route 20 East Phase 2 studies recommended that plans be advanced to upgrade Route 20 from the Auburn/Oxford town line east to the Shrewsbury /Northborough town line (passing through the City of Worcester) to a four-lane divided highway, and proposed jug-handle-type intersections be constructed at a number of key locations along the corridor.
• 2003 Preliminary Route 20 Traffic Study prepared for the Town of Northborough suggested upgrades to a number of major Route 20 intersections, particularly in the town center, all of which need to be coordinated with the adjacent CSX at-grade railroad crossing.
• 2004 Preliminary Route 20 Traffic Study prepared for the Town of Shrewsbury suggested improvement options to address congestion, roadway safety and freight movement issues. In particular, the intersection of Route 20 with Grafton Street, in vicinity of the Route 140 interchange, was viewed as a critical location in need of reconstruction.
• 2006 Route 20 Corridor Profile (Auburn-Oxford): under development. Route 9 Bridge over Lake Quinsigamond, Worcester/Shrewsbury
• 2005 Route 9 East Corridor Profile (Shrewsbury-Westborough) refers to this structurally deficient bridge as an “aging structure of regional significance.” It was built in 1916 and reconstructed in 1983.
• 2006 MassHighway Bridge Listing (most recently available) identifies this bridge as “structurally deficient” with an AASHTO rating of 39.0.
Route 9 East, Westborough
• 2004 Arc of Innovation -- 495 MetroWest Corridor Top Ten Traffic Nightmare identified Route 9/Lyman Street as “Nightmare #5”
• 2005 Route 9 East Corridor Profile (Shrewsbury-Westborough) indicated that the Route 9 intersections with Lyman Street and Otis Street operated at low Levels-of-Service (LOS) and were projected to “fail” by 2015. Improving the ability to travel between abutting properties, perhaps through the construction of frontage roads, was recommended.

III-64
Route 9 West Access Alternatives, Auburn, Leicester, Spencer, Worcester
• 1979 Southwest Worcester Corridor Planning Study documented mobility issues between southwestern section of Worcester, its surrounding communities, and the interstate system.
• 1993 Central Massachusetts Regional Transportation Plan (and subsequent RTPs) referenced the need to investigate bypass options between Hope Avenue in Worcester and Route 9 in Leicester/Spencer.
• 2000 Greater Worcester Access Improvement Project (GWAIP) investigated alternative alignments for new and improved roadways to improve access between southwest Worcester and the interstate system.
• 2005 Auburn Master Plan includes objective to “work with neighboring communities, CMRPC, and MassHighway to improve access from I-290 to western Worcester and Leicester to divert regional traffic from Heard Street and Oxford Street North.”
• 2006 public outreach meeting for the 2007 RTP solicited comment from a Leicester Selectman indicating the need to explore improved access to the Mass Pike from Leicester.
Route 16 East, Uxbridge, Mendon, Hopedale
• 2003 Blackstone Valley Corridor Planning Study recommended continued investigation of site-specific improvements, such as the realignment of the intersections of Route 16 with Route 122 in Uxbridge.
Route 16 East, Milford (MAPC; impacts CMMPO Southeast subregion)
• Downtown alternate route requested by Town of Milford. Milford Daily news reported, “First studied back in 1971, the alternate route was recommended in the town’s 2003 Comprehensive plan.”
Route 30/Route 135 Downtown Rotary, Westborough
• 1982 Westborough Corridor Planning Study identified deficiencies with the downtown rotary, especially in relation to adjacent on-street parking. The option presented would eliminate the rotary and install signals.
• 2005: Town of Westborough approached CMRPC regarding the utilization of a traffic model to further analyze this location. It was determined that a community-specific model would need to be developed separate from the current regional model.
Route 49 Northern Extension, Barre, Oakham, Paxton, Rutland, Spencer (extends into MRPC region)
• 1967 Central Corridor Study, which preceded the construction of I-190, included an alignment that Route 49 roughly follows today, with travel north of Leicester and Worcester envisioned as utilizing an alignment whose function is now served by I-190.
• 2003 Central Massachusetts Regional Transportation Plan recommended that further study be pursued to improve access from the Mass Pike (I-90) / I-84 interchange to the Fitchburg/Leominster area.

III-65
• 2006 public outreach meetings for the 2007 RTP solicited comments reiterating need to explore additional north-south capacity, especially in light of projected increases in truck traffic on the New England roadways.
Route 49 Southern Extension, Charlton, Dudley, Oxford, Sturbridge, Southbridge, Webster
• 1978 Podunk Pike Extension – Southwest Corridor Planning Study concluded that a southern extension of Route 49 from Sturbridge to Webster could not be justified based upon 1978 traffic patterns or projected growth forecasts. The Town of Southbridge felt that improved access was integral for the realization of its economic development goals.
• 1993 Central Massachusetts Regional Transportation Plan recommended pursuing Transportation Systems Management (TSM) techniques in the short term and conducting a Corridor Planning Study to further analyze two proposed east-west connector facilities.
• 1997 Central Massachusetts Regional Transportation Plan indicated that the potential connector options had evolved to the concept of a facility that would primarily serve the Town of Southbridge and, to a lesser extent, Charlton and Sturbridge. The RTP reiterated the need to pursue TSM techniques on existing roadways and to conduct a corridor study.
• 1999 Tri-Community Corridor Planning Study explored connector road options, but consensus could not be reached on a preferred alternative.
• 2006: Town of Oxford communicated to the CMMPO their request to consider a project to extend Route 49 from Cudworth Road in Oxford west to Route 20 in Sturbridge for inclusion on the 2007-2010 STIP.
• 2006 public outreach meeting comment for the 2007 RTP indicated need for another E-W route south of the Mass Pike between I-84 and I-395.
Route 146/Boston Road Interchange Construction, Sutton
• The 2005 MassHighway Route 146 Transportation Study recommended a new interchange at Boston Road in Sutton to replace the last remaining at-grade intersection on Route 146 within Massachusetts.
• 2006 public outreach meetings for the 2007 RTP solicited comment noting the need to “acknowledge the transportation efforts occurring in adjacent regions, including Rhode Island.” The RI Statewide Planning Office, acting as the MPO for the entire state, is considering the elimination of the traffic signal at Route 146 and Sayles Hill Road in North Smithfield.
Route 146/West Main Street Interchange Improvements, Millbury
• The 2005 MassHighway Route 146 Transportation Study recommended reconstruction of the West Main Street interchange to correct significant safety deficiencies.

III-66
Route 146 Frontage Roads, Millbury, Sutton
• The 2005 MassHighway Route 146 Transportation Study recommended constructing frontage roads as part of a Boston Road interchange project to create a limited access roadway between that interchange and the existing Central Turnpike interchange. The study also included a longer term recommendation to build frontage roads between Boston Post Road and the West Main Street interchange.
• The 2006 CMRPC Route 146 Futures Study documented strong local support for the frontage road concept.
Blackstone Valley Connector, Northbridge, Upton
• 2003 Blackstone Valley Corridor Planning Study Citizen Advisory Committee (CAC) could not reach consensus on whether or not to construct of a new roadway from Northbridge to Upton.
• 2006: As part of the development of the 2007 RTP, the Draft Vital Links network indicates that an improved east-west connection is missing between Route 122 and Route 140.
Blackstone Valley Roadway Improvements: Hartford Avenue, High Street, Hopkinton Road, & West Main Street, Upton/Hopkinton
• 2003 Blackstone Valley Corridor Planning Study recommended consideration of widening this roadway segment in Upton.
• 2006: As part of the development of the 2006-2010 Transportation Improvement program (TIP), the town of Upton submitted a Project Need Form (PNF) indicating the need to upgrade/improve Hartford Avenue, High Street, and Hopkinton Street.
Worcester East-West Northern Arterial Improvements, Worcester
• 2003 RTP identified need to investigate ways to improve the efficiency of the entire central roadway system, including developing improvement options to major arterials. A proposal to advance this work effort has been included in both the 2006 and 2007 CMMPO UPWP.
• April 2006: EOT presented its Proposed East-West Corridor Projects (City of Worcester) to the CMMPO. Mobility improvements to three routes (north, central, south) focus on modifying intersection configurations and operations. EOT and the City prioritized northern route for inclusion on the TIP, contingent upon approval by the CMMPO.
ITS Infrastructure Deployment, Region-wide
• 1995-present Central Massachusetts Congestion Management System has recommended signal coordination at numerous locations in the region.
• The 2005 Central Massachusetts ITS Architecture recommended four multi-agency near-term initiatives as well as future initiatives.
• 2006: The WRTA has adopted a Strategic ITS multi-year plan which includes implementation of major initiatives

III-67
• 2006 CMMPO Transportation Safety Planning Program EMT Survey identified the need to implement traffic control pre-emptive technology at numerous locations within the region to improve EMT response time.
• 2006 public outreach meetings and on-line commuter survey for the 2007 RTP suggested utilizing ITS improvement options.
• 2007 Central Massachusetts RTP Vision Statement includes the need to pursue “alternative, creative transportation systems that integrate multiple travel modes through the use of technology.”
Construction of New Park-and-Ride Facilities, Region-wide
• 2006 public outreach meetings for the 2007 RTP identified the following potential future park-and-ride locations: Route 146/Boston Road, Sutton Rutland/Holden area Sturbridge area I-190/Route 140 interchange in Sterling
D.5.7.2 Evaluation of Proposed Improvement Concepts As part of the process of evaluating these project concepts, the CMTPC and CMMPO began their deliberations by considering the following questions:
• Which of these project concepts should be considered high-priority candidates by the CMMPO for design and construction funding within the 25-year planning horizon of the 2007 Regional Transportation Plan (RTP)? Why?
• Which of these project concepts need to be studied in more detail before a determination can
be made regarding construction within 25 years? What questions need to be answered? • Which of these project concepts could be phased into lower-cost projects for consideration
by the CMMPO for inclusion on the Transportation Improvement Program (TIP)?
• Which of these project concepts should be addressed in the short term with improvements easily implemented within existing Rights-of-Way while long-term needs and improvement options continue to be studied?
Over the course of four or five months of CMTPC, CMMPO, and internal staff meetings, the CMMPO refined the list of projects under consideration to those listed in Table III-10. A high, medium, or medium-longer term rank was assigned to each as indicated.

III-68
Table III-10 Potential Major Infrastructure Improvement Projects
Project Location Community Rank* Safety Issue
Air Quality Benefit
Community Support Comments
Mass Pike/I-495 Westborough, Hopkinton H Interim improvement
efforts likely
Route 146/West Main Street Millbury H
Existing substandard geometry; Roundabout proposed
I-290/Kelley Square Worcester H Worcester E-W (Central) related
Route 20 Charlton, Oxford H
Plan to extend Charlton improvements (median-divided)
Worcester E-W (North) Worcester H Design underway
Route 20 Shrewsbury, Worcester M
Inconsistent lane configuration; congestion; anticipated improvement for heavy vehicle movement
Route 20 Auburn M Corridor Profile Effort underway
I-495/Route 9 Westborough, Southborough M Monitoring; Turnpike
backups noted Worcester E-W (Central) Worcester M Kelley Square related
Route 146/Boston Road Sutton M-L
Private mitigation efforts could delay need for grade-separation
Route 146 Frontage Roads
Millbury, Sutton M-L
EOT study recommended medium-to-long range implementation
I-290/Hope Avenue Worcester M-L Worcester E-W (South) related
Route 9 East Frontage Roads Westborough M-L
Private mitigation efforts under design for parcel near Lyman Street
Mass Pike/290/395/20/12 Auburn M-L
Interim efforts likely; peak period issue; Auburn Master Plan
Worcester E-W (South) Worcester M-L Hope Avenue
Interchange related *Ranking Codes: H = High; M = Medium; M-L = Medium, Longer term

III-69
E. RECOMMENDED IMPROVEMENTS E.1 Improvements to the Project Development Process During the stakeholder consultation interview effort conducted as part of the development of this planning document, a number of improvements to the project development process were identified. It is anticipated that the following suggestions will be discussed in further detail with the CMMPO as part of future planning efforts:
• Integrating the Vital Links network into MPO prioritization process • Improvements to the Transportation Evaluation Criteria (TEC) process:
Obtaining and utilizing improved data for more objective TEC scoring Ensuring equity between urban vs. rural TEC scores Ensuring TEC consistency between MassHighway District offices and from year-to-year Periodically review TEC scores for projects as it is an evolving process and to take into
account changing conditions and new data. • Providing a forum for communities to share experiences with TIP project design process
regarding community responsibilities and consultants. • Defining the role of the MPO in proposing or reviewing major infrastructure projects that cross
regional boundaries • Distinguishing between preservation projects and reconstruction projects to ensure that enough
funding is utilized for maximum benefit to preserve and maintain the system E.2 Safety Improvements Of the 42 intersections analyzed to date as part of the CMMPO Transportation Safety Planning Program, 23 or 55% experienced a crash rate higher than the regional average. Should this trend continue to be observed at the remaining 45 locations identified for further study, then it can be assumed for long-term planning purposes that a minimum of nearly 50 intersections within the region experience crash rates higher than the regional average and should be specifically addressed with safety improvements. At an average cost of $250,000 per intersection, a total cost estimate of addressing intersection safety, in present dollars, has been calculated as $12.5 million. The CMMPO endorsed 2007-2010 Transportation Improvement Program (TIP) recognizes a total of $3.57 million in safety-related intersection projects. Should the remaining $8.93 million be distributed among four five-year funding categories as indicated in Table III-11 and adjusted for inflation at 4% annually, the total minimum amount of funding needed to address the anticipated intersection safety issues over the next 24 years equals nearly $14 million.
Table III-11 Anticipated Minimum Cost to Address Identified Highway Safety Needs
2007 – 2010 Costs (from 07-10 TIP)
Cost of funding 25% of identified
needs in 2011-2015
Cost of funding 25% of identified
needs in 2016-2020
Cost of funding 25% of identified
needs in 2021-2025
Cost of funding 25% of identified
needs in 2026-2030
Total Cost*
$3,570,000 $2,512,000 $3,056,000 $3,718,000 $4,524,000 $13,810,000*Total Cost does not include amounts from 2007-2010 TIP

III-70
In addition, MassHighway’s lane departure roadway safety audits will likely result in the identification of needed improvements, some of which may be funded outside of the CMMPO regional funding target with statewide money dedicated to highway safety. Utilizing MassHighway’s lane departure research and with input from planning boards, police, fire and Public Works departments, CMRPC selected Interstate 290 in Worcester and the undivided segment of Route 20 in Charlton/Sturbridge for the implementation of roadway safety audits. The audits, performed by MassHighway, will involve research into crash histories and roadway design at each location in an effort to eliminate or reduce the number and impact of the crashes. E.3 Transportation Security The CMMPO has begun to explore its potential role in the field of Security Planning. Future work efforts may include identification of transportation security risks, responsibility for funding strategies and projects, acting as a forum for cooperative decision-making, and collection and analysis of information obtained during the institutional learning phase of security planning. Coordination with the Worcester Regional Transit Authority (WRTA) to prepare for potential security risks as they develop and refine their Continuity of Operations Planning (COOP) effort is also likely to be pursued. E.4 Maintenance Needs E.4.1 Bridge Needs Bridge maintenance and repair in the region has taken on a higher priority in recognition of both the safety and mobility implications of a failure. MassHighway’s Draft Statewide Transportation Plan, entitled A Framework for Thinking: A Plan for Action indicated that a statewide allocation of $170 million would be needed annually for bridge preservation. To reduce the backlog, bridge spending would need to increase to approximately $200 million. Within the CMMPO, the 60 bridges considered structurally deficient could cost as much as $178 million over the planning horizon of this document based upon estimates using bridge replacement costs allocated in the region’s 2006-2010 TIP, recent cost estimates from the MassHighway District 3 office, and assuming as much as $35 million will be needed to reconstruct the regionally significant Route 9 Bridge over Lake Quinsigamond between Worcester and Shrewsbury. The CMMPO endorsed 2007-2010 TIP recognizes approximately $27 million in structurally deficient bridge projects. Should the remaining $151 million be distributed among four five-year funding categories as indicated in Table III-12 and adjusted for inflation at 4% annually, the total minimum amount of funding needed to address today’s structurally deficient bridges between 2011 and 2030 would equal nearly $234 million. Also notable, there are 65 posted bridges within the region, 21 of which are also considered structurally deficient. The remaining 44 posted bridges could cost as much as $146 million over the planning horizon of this document based upon estimates using bridge replacement costs allocated in the region’s 2006-2010 TIP and recent cost estimates from the MassHighway District 3 office. The CMMPO endorsed 2007-2010 TIP does not include funding for any posted bridges. Should the estimated $146 million be distributed among four five-year funding categories as indicated in Table III-12 and adjusted for inflation at 4% annually, the total minimum amount of funding needed to address today’s posted bridges between 2011 and 2030 would equal a little more than $226 million.

III-71
There are also 169 bridges within the region that are currently designated as functionally obsolete, 28 of which are also posted. The remaining 144 functionally obsolete bridges could cost a little more than $95 million over the planning horizon of this document based upon estimates using bridge rehabilitation costs allocated for functionally obsolete bridges in the CMMPO endorsed 2007-2010 TIP. The TIP recognizes approximately $1.3 million in functionally obsolete bridge projects. Should the remaining $94 million be distributed among four five-year funding categories as indicated in Table III-12 and adjusted for inflation at 4% annually, the total minimum amount of funding needed to address today’s functionally obsolete bridges between 2011 and 2030 would equal a little more than $145 million.
Table III-12 Anticipated Bridge Improvement Costs
Bridge Category
2007 – 2010 Bridge Costs (from 07-10
TIP)
Cost of funding 25% of
identified needs in 2011-
2015
Cost of funding 25% of
identified needs in 2016-2020
Cost of funding 25% of
identified needs in 2021-2025
Cost of funding 25% of
identified needs in 2026-2030
Total Cost*
Structurally Deficient $27,133,000 42,552,000 51,772,000 62,988,000 76,635,000 $233,947,000
Posted $0 $41,122,000 $50,031,000 $60,870,000 $74,058,000 $226,081,000Functionally
Obsolete $1,351,000 $26,405,000 $32,126,000 $39,086,000 $47,554,000 $145,171,000
*Total Cost does not include amounts from 2007-2010 TIP E.4.2 Pavement Needs The pavement needs analysis from the 1997 Regional Transportation Plan determined that approximately $20 Million was needed at that time on an annual basis to maintain the federal-aid eligible roadway system at its then-current level (PCI = 83-89). In the absence of an updated analysis of regional pavement conditions, an adjusted current cost was developed utilizing Consumer Price Indexing (CPI) Conversion factors as discussed in Section D.4.2. The total adjusted annual cost (in present dollars) to maintain the federal-aid eligible roadway system at the 1997 condition level is therefore assumed to equal approximately $25.9 million. Similarly, a second scenario, utilizing an annual allotment of $18.1 million, would be expected to reduce the network-level pavement condition from the 1997 rating (PCI = 83-89), but still maintain the federal-aid system in “good” condition (PCI = 75). A third scenario, funded at $12.1 million annually, would be expected to reduce the network-level pavement condition from the 1997 rating to a “fair” condition (PCI = 65). The total costs of each of these scenarios are presented in Table III-13.
Table III-13
Anticipated Pavement Improvement Costs
Scenario Number
Estimated Network-Level PCI
Condition Description
Recommended Annual
Allocation
Total Cost Estimate
(2007-2030)
Total Cost Estimate*
(2011-2030) 1 83-89 Very Good $25,900,000 $621,600,000 $587,600,0002 75 Good $18,100,000 $434,400,000 $400,400,0003 65 Fair $12,900,000 $309,600,000 $275,600,000
*Total Cost does not include $34 million of pavement improvement projects listed in the 2007-2010 TIP

III-72
E.5 Congestion Mitigation Projects The identified needs listed in Table III-14 were compiled utilizing a summary of improvement recommendations developed as part of the region’s CMP travel-time-and-delay studies dating back to 1995 (See Technical Appendix), Traffic Studies and Corridor Profiles conducted as part of CMMPO work programs, and CMP trend analyses.
Table III-14
Congestion Mitigation Recommendations
Facility Community Year(s) Studied
Recommended Improvements Not yet Implemented
Cost Estimate
Route 122 Blackstone, Millville
2004 Resurfacing w/lighting & landscaping [not yet programmed]
$688,000
Route 122-140 Grafton 1995 2000 2004
Route 122/Millbury Street reconstruction/signalization [2007]
$820,000
Route 122 Northbridge 1995 2003
Route 122/Church Street (Plummers Corner) Intersection improvements [not yet programmed]
$1,000,000
Route 20 Northborough 2001 Route 20/Hudson St signal installation to be coordinated with signals at Church Street and South Street. [2008]
$960,000
Route 12 & Route 16
Webster 1995 Route 12/16/193 intersection improvements [2007]
$1,276,000
Route 9 (Belmont Street)
Worcester 2003 Route 9 geometric improvements (Carver St to Lake Ave) including improvements to the Route 9/Lake Ave intersection [2009]
$3,500,000
Cambridge Street Worcester 1995 2002
Cambridge Street/Southbridge Street intersection improvements [2007]
$1,500,000
Route 122 (Grafton Street)
Worcester 1995 2001 2002 2006
Grafton Street resurfacing and intersection improvements [not yet programmed]
$4,800,000
Route 70 (Lincoln Street)
Worcester 1995 2001 2002 2006
Improvements to Lincoln Street and I - 290 Interchange [2008]
$1,059,000
High Delay Intersections (See Figure III-11)
Region-wide 1995-2006
34 intersections with vehicle delays greater than regional average ($1.5 million average estimated cost to improve one intersection – projects are likely to incorporate ITS applications)
$51,000,000
Total Cost of Identified Congestion Mitigation Projects $66,603,000

III-73
The CMMPO endorsed 2007-2010 Transportation Improvement Program (TIP) recognizes a total of $3.36 million in congestion-related improvement projects. Should the remaining $63 million be distributed among four five-year funding categories as indicated in Table III-15 and adjusted for inflation at 4% annually, the total minimum amount of funding needed to address the anticipated intersection safety issues over the next 24 years equals nearly $14 million.
Table III-15 Anticipated Minimum Cost to Address Identified Congestion Mitigation Needs
2007 – 2010 Costs (from 07-10 TIP)
Cost of funding 25% of identified
needs in 2011-2015
Cost of funding 25% of identified
needs in 2016-2020
Cost of funding 25% of identified
needs in 2021-2025
Cost of funding 25% of identified
needs in 2026-2030
Total Cost*
$3,360,000 $17,785,000 $21,638,000 $26,326,000 $32,030,000 $97,779,000*Total Cost does not include amounts from 2007-2010 TIP E.6 Intelligent Transportation Systems (ITS) As part of its FY 2007 work program, the CMMPO staff is developing a process to identify roadway projects that might benefit from ITS solutions, based upon information gained through the management systems processes, and from security initiatives. Pending any additions produced by that planning initiative, the needs identified by the Guidance Committee during the development of the Central Massachusetts Regional ITS Architecture presently form the core ITS needs for the region. The four regional needs were; Congestion Management, Transit Efficiency, Efficient Use of Existing Infrastructure, and Economic Development. The three major themes expressed by participants were; Transit Demand and Revenue, Traffic Congestion and Traveler Information, and Use of ITS Data. As noted previously, four Near-Term Multi-Agency Initiatives were recommended by the Guidance Committee for Central Massachusetts to meet these needs. They are:
Event Reporting System: Internet-based tool that serves as a centralized repository for information on events affecting the transportation network. Expansion of the Massachusetts Interagency Video Integration System (MIVIS):
Expansion of video sharing and distribution system to allow sharing of real-time video feeds among a larger group of agencies. 511 Travel Information System: Public travel information system, covering the
roadways and transit services in the region. Planning Data Archive: System for coordinating the planning data archives for the
transportation agencies in the region. The 511 Travel Information System is the only initiative that is actively being pursued at this time. EOT is in the process of negotiating a contract with SmartRoutes to implement the 511 system statewide. The timeline for implementation will not be known until the contract negotiations are complete. The CMMPO 2007 work program includes a task to identify and assist EOT-OTP and other regional stakeholders in effecting implementation of all the “near-term multi-agency initiatives” outlined in the Regional Architecture.

III-74
E.7 Transportation Demand Management Through the early public outreach efforts undertaken for the development of this RTP, four general locations were identified as good candidates for the potential construction of park-and-ride facilities:
1. Holden/Rutland: Somewhere north of Route 31 along Route 122A to attempt to reduce traffic traveling south through Holden Center
2. Route 146/Boston Road: Considered accessible and convenient for traffic traveling to both Worcester and Providence area destinations
3. Sturbridge: Potential facility to serve traffic utilizing the Mass. Pike, I-84, or Route 20. 4. Sterling (Montachusett Region): I-190/Route 140 interchange, just beyond the CMMPO border
Assuming an average potential cost of $1 million to construct a medium-sized park-and-ride facility, with one being constructed every five years or so between 2010 and 2025, and assuming a 4% annual inflation rate, it is estimated that more than $6 million may be needed to construct four facilities as indicated in Table III-16. While the fourth potential location identified as part of the RTP public outreach process is located just outside the CMMPO region, funding was reserved for a fourth facility within the region in a pro-active measure to encourage ridesharing in the future.
Table III-16 Estimated Cost of Park-and-Ride Facility Expansion Program
2007 – 2010 Costs (from 07-10 TIP)
Cost of funding 25% of identified
needs in 2011-2015
Cost of funding 25% of identified
needs in 2016-2020
Cost of funding 25% of identified
needs in 2021-2025
Cost of funding 25% of identified
needs in 2026-2030
Total Cost
$0 $1,125,000 $1,369,000 $1,665,000 $2,026,000 $6,185,000 E.8 Operations & Maintenance (O & M) As indicated in the CMMPO endorsed 2007-2010 TIP, MassHighway Districts 2 and 3 spent about $3.2 million of federal-aid funding on Operations & Maintenance (O & M) within the CMMPO region during 2006. This amount funded items such as traffic signal maintenance, pavement markings, guardrails, and signage. Utilizing this figure and adjusting for inflation at 4% per year, it is anticipated that the region should allocate a minimum of $115,935,000 between 2011 and 2030 for MassHighway District O & M.
Table III-17 Estimated Cost of Federal-Aid Share of MassHighway Districts 2 & 3 Operations and
Maintenance Expenditures within the CMMPO Region
2007 – 2010 Costs (from 07-10 TIP)
Cost of funding 25% of identified
needs in 2011-2015
Cost of funding 25% of identified
needs in 2016-2020
Cost of funding 25% of identified
needs in 2021-2025
Cost of funding 25% of identified
needs in 2026-2030
Total Cost*
$14,132,000 $21,087,000 $25,656,000 $31,214,000 $37,977,000 $115,935,000*Total Cost does not include amounts from 2007-2010 TIP

III-75
E.9 Potential Major Infrastructure Projects As discussed previously in Section D.5.7.2, the CMMPO, with input from its advisory committee, the Central Massachusetts Transportation Planning Committee (CMTPC), deliberated over the course of about five months to select and prioritize a number of significantly costly improvement projects. Table III-18 lists the selected projects, programmed within five-year increments and accounting for a 4% annual inflation rate over the planning horizon of this RTP as encouraged by the Massachusetts Executive Office of Transportation (EOT).
Project Location Community 2011-2015
2016-2020
2021-2025
2026-2030 Need*
Mass Pike/I-495 Westborough, Hopkinton 33.301 H Route 146/W. Main Street Millbury 11.249 H I-290/Kelley Square Worcester 20.529 H Route 20 Charlton, Oxford 41.057 H Worcester E-W (North) Worcester 7.030 H Route 20 Shrewsbury, Worcester 16.873 M Route 20 Auburn 5.624 M I-495/Route 9 Westborough, Southborough 30.387 M Worcester E-W (Central) Worcester 10.129 M Worcester E-W (South) Worcester 10.129 M-L Route 146/Boston Road Sutton 41.627 M-L Route 146 Frontage Roads Millbury, Sutton 24.310 M-L Total Cost Estimate 40.776 61.586 74.928 74.955 252.245Funding Assumed to be Available (EOT estimate) 45.292 60.097 69.669 80.765 255.823
*Ranking Codes: H = High; M = Medium; M-L = Medium, Longer term