iihs research on vehicle roof crush · iihs research on vehicle roof crush stephen l. oesch june 4,...
TRANSCRIPT

Statement before the US Senate Committee on Commerce, Science, and Transportation IIHS research on vehicle roof crush
Stephen L. Oesch
June 4, 2008

The Insurance Institute for Highway Safety is a nonprofit research and communications organiza-
tion that identifies ways to reduce the deaths, injuries, and property damage on our nation’s
highways. We are sponsored by US automobile insurers. Thank you for inviting IIHS to testify on
the findings of our recent research on the relationship between roof strength and injury risk in
rollover crashes.
Principles of vehicle crashworthiness
A key to protecting occupants in front, side, rear, or rollover crashes is ensuring that compart-
ments, or “safety cages,” surrounding the occupants remain intact so lap/shoulder belts and air-
bags can provide protection during the crashes.
If an occupant compartment allows excessive
intrusion of the door, instrument panel, footwell,
roof, or other vehicle structure, it compromises
the ability of vehicle restraint systems to protect
the occupants.
This is demonstrated by comparing 2 vehicles
IIHS evaluated in 40 mph frontal offset crash
tests. The occupant compartment in the 1997
Pontiac Transport was compromised, thus in-
creasing the potential for occupant injury. In
sharp contrast is the occupant compartment in
the 2005 Chevrolet Uplander, which withstood
the forces of the frontal impact and remained
intact, allowing the lap/shoulder belt and airbag
to provide good occupant protection.
Prior to our recent research on roof strength,
several studies had reported no relationship
between roof strength and injury risk in rollover
crashes. These earlier findings defy logic because, as I just explained, in every other crash con-
figuration — whether front, side, or rear — the basic principles of occupant protection dictate
that the compartment be designed to resist intrusion so lap/shoulder safety belts and airbags
can provide protection to occupants. There is no logical reason to assume that in a rollover
1997 Pontiac Transport
2005 Chevrolet Uplander
Insurance Institute for Highway Safety 1 1005 North Glebe Road, Arlington, VA 22201 June 4, 2008

crash, you would design a vehicle to
permit excessive intrusion. This is
the reason NASCAR vehicles are
equipped with roll bars to prevent
roof crush in violent rollover crashes
such as the one experienced by Mi-
chael McDowell at the Texas Motor
Speedway in 2008. He walked away
from this crash uninjured. Michael McDowell’s rollover crash
Findings of IIHS’s study of SUV roof strength
Our study, described in the attached documents,1-3 is a 2-part analysis involving vehicle testing
and examination of the outcomes of real-world rollover crashes. Eleven midsize 4-door SUV
roof designs were subjected to a test similar to the one conducted by automakers to comply with
federal roof strength requirements. Researchers applied force to the roofs until crush reached
10 inches, measuring the peak force required
for 2 inches of crush, 5 inches of crush, and 10
inches. There was a range of performance
among the SUVs tested, and 2 demonstration
tests illustrate the differences.
2000 Nissan Xterra
2000 Ford Explorer
These photographs show what happened when
the 2000 Nissan Xterra, the SUV with the
strongest roof in IIHS tests, and the 2000 Ford
Explorer, which has one of the weakest roofs,
were subjected to a force of up to 10,000
pounds. The Xterra resisted a force of 10,000
pounds after only 2 inches of crush, while the
Explorer crushed all the way to 10 inches with-
out reaching this level of resistance. Such a
striking difference in the amount of roof crush
illustrates why higher injury risk would be ex-
pected in SUVs with weaker roofs.
Insurance Institute for Highway Safety 2 1005 North Glebe Road, Arlington, VA 22201 June 4, 2008

Having established the range of roof strength among the SUVs in the IIHS study, the research-
ers then focused on almost 23,000 rollover crashes of the same SUVs that occurred in the real
world during 1997-2005. Logistic regression was used to assess the effect of roof strength on
the likelihood of serious or fatal driver injury in the on-the-road rollover crashes of the SUVs.
The regression controlled for state-to-state differences, vehicle stability, and driver age, and the
results denote the injury risk, given the strength of an SUV’s roof. No matter what measure of
roof strength the researchers used, a consistent relationship emerged: SUVs with stronger roofs
had lower injury risks.
There are important strengths of our study. We looked only at midsize SUVs because they are
similar vehicles with similar drivers and a high risk of rolling over. This allowed researchers to
limit the number of variables in the analysis and concentrate on the ones that would ensure that
results were not biased by factors such as differences in driver age, types of use, etc. Another
strength is that we used several different measures of roof strength, all of which confirmed that
injury risk is lower among vehicles with stronger roofs. This makes logical sense, and the data
confirm it.
Based on our research, we expect that the study’s finding of reduced injury risk with increased
roof strength will hold for other types of vehicles, although the magnitude of the injury risk reduc-
tions may differ among vehicle groups. To further establish this, we plan to conduct another
series of roof crush tests involving a different class of vehicles — small passenger cars — that
also has a high rollover rate.
Dynamic rollover test A dynamic rollover test using instrumented test dummies would be a gold standard for assess-
ing occupant protection in rollover crashes. However, we are not certain that the procedures for
a dynamic test are reasonably repeatable, and we are not sure how to conduct such a test to
obtain the most relevant information. Real-world rollover crashes vary widely. They often are
preceded by violent events as vehicles leave the road and begin to roll over. The positions of
occupants at the time a rollover begins are uncertain, so it is difficult to position test dummies to
represent where occupants would be in real-world rollover crashes. Current dummies designed
for front, side, and rear testing have not been shown to behave in a human-like manner in roll-
over crashes.
Insurance Institute for Highway Safety 3 1005 North Glebe Road, Arlington, VA 22201 June 4, 2008

Insurance Institute for Highway Safety 4 1005 North Glebe Road, Arlington, VA 22201 June 4, 2008
Proposed federal roof crush standard IIHS’s study clearly shows the relationship between increased roof strength and reduced injury
risk in rollover crashes. We support the continued use of the current roof crush procedures set
forth in the existing federal standard on roof crush resistance. However, our study supports re-
quiring vehicles to have a strength-to-weight ratio of at least 3.0. We estimate that a 1-unit
increase in peak strength-to-weight ratio — for example, from 1.5 times vehicle weight, as spe-
cified in the existing federal standard, to 2.5 times, as proposed by the National Highway Traffic
Safety Administration — would reduce the risk of serious or fatal injury in a rollover crash by 28
percent. Increasing roof strength requirements beyond 2.5 times vehicle weight would reduce
injury risk even further.
Attachments/references 1. Brumbelow, M.L.; Teoh, E.R.; Zuby, D.S.; and McCartt, A.T. 2008. Roof strength and injury risk in
rollover crashes. Arlington, VA: Insurance Institute for Highway Safety.
2. Insurance Institute for Highway Safety. 2008. Comment to the National Highway Traffic Safety Admin-istration in response to comments by Padmanaban and Moffatt on the Institute’s study, “Roof Strength and Injury Risk in Rollover Crashes,” May 13. Arlington, VA.
3. Insurance Institute for Highway Safety. 2008. Strength of roofs on SUVs influences risk of occupant injury in rollover crashes, new Institute study finds. Status Report 43:1. Arlington, VA.

Roof Strength and Injury Risk in Rollover Crashes
Matthew L. Brumbelow Eric R. Teoh David S. Zuby Anne T. McCartt
March 2008

ABSTRACT
Vehicle rollover is a major cause of fatality in passenger vehicle crashes. Rollovers are more
complicated than planar crashes, and potential injury mechanisms still are being studied and debated. A
central factor in these debates is the importance of having a strong vehicle roof. Minimum roof strength
is regulated under Federal Motor Vehicle Safety Standard (FMVSS) 216, but no study to date has
established a relationship between performance in this or any other test condition and occupant protection
in real-world rollover crashes. The present study evaluated the relationship between roof strengths of 11
midsize SUV roof designs and the rate of fatal or incapacitating driver injury in single-vehicle rollover
crashes in 12 states. Quasi-static tests were conducted under the conditions specified in FMVSS 216, and
the maximum force required to crush the roof to 2, 5, and 10 inches of plate displacement was recorded.
Various measures of roof strength were calculated from the test results for evaluation in logistic
regression models. In all cases, increased measures of roof strength resulted in significantly reduced rates
of fatal or incapacitating driver injury after accounting for vehicle stability, driver age, and state
differences. A one-unit increase in peak strength-to-weight ratio (SWR) within 5 inches of plate
displacement, the metric currently regulated under the FMVSS 216 standard, was estimated to reduce the
risk of fatal or incapacitating injury by 28 percent.
INTRODUCTION
During the past two decades automobile manufacturers have made important advances in
designing vehicle structures that provide greater occupant protection in planar crashes (Lund and Nolan
2003). However, there has been little consensus regarding the importance of roof strength in rollover
crashes, as well as the best method for assessing that strength. In 2006 one-quarter of fatally injured
passenger vehicle occupants were involved in crashes where vehicle rollover was considered the most
harmful event (Insurance Institute for Highway Safety, 2007). Many fatally injured occupants in
rollovers are unbelted, and some are completely or partially ejected from the vehicle (Deutermann 2002).
There is disagreement concerning how structural changes could affect ejection risk or the risk of injury
for occupants who remain in the vehicle, regardless of belt use.
Some researchers have concluded there is no relationship between roof crush and injury risk as
measured by anthropometric test devices (ATDs) (Bahling et al. 1990; James et al. 2007; Moffatt et al.
2003; Orlowski et al. 1985; Piziali et al. 1998), whereas others have reached the opposite conclusion
using data from the same crash tests (Friedman and Nash, 2001; Rechnitzer et al. 1998; Syson 1995).
These disparate conclusions have led to distinct hypotheses about the primary source of rollover injury:
either a diving mechanism in which injury occurs independently of roof crush, or a roof intrusion
mechanism in which injury is caused by structural collapse. These hypotheses often are seen as being
1

mutually exclusive, but both assume that keeping occupants in the vehicle and preventing head-to-roof
contact reduces injury risk. According to Bahling et al. (1990), “the absence of deformation may benefit
belted occupants if it results in the belted occupant not contacting the roof.”
Federal Regulation of Roof Strength
Although many researchers have studied potential rollover injury mechanisms, evaluation of the
federal regulation governing roof strength has been lacking. Federal Motor Vehicle Safety Standard
(FMVSS) 216 was introduced in 1971 to establish a minimum level of roof strength and is the only
regulation governing rollover crashworthiness for passenger vehicles (Office of the Federal Register
1971). FMVSS 216 specifies a quasi-static test procedure that measures the force required to push a
metal plate into the roof at a constant rate. It requires a reaction force equal to 1.5 times the weight of the
vehicle be reached within 5 inches of plate displacement. In 1991 the standard was extended to apply to
light trucks and vans with gross vehicle weight ratings less than 6,000 pounds (Office of the Federal
Register 1991).
In 2005 NHTSA issued a notice of proposed rulemaking (NPRM) announcing its intent to
upgrade the roof strength standard (Office of the Federal Register 2005). According to the proposal the
test procedure would remain largely unchanged but the level of required force would be increased to a
strength-to-weight-ratio (SWR) of 2.5. The maximum 5-inch plate displacement limit would be replaced
by a requirement that the minimum strength be achieved prior to head-to-roof contact for an ATD
positioned in the front outboard seat on the side of the vehicle being tested. Using two different analysis
methods, NHTSA estimated 13 or 44 lives per year would be saved by the proposed standard, equivalent
to less than 1 percent of rollover fatalities. These estimates were based on an evaluation of 32 crashes in
the National Automotive Sampling System/Crashworthiness Data System (NASS/CDS), after assuming
that the following occupants, among others, would not benefit from the proposed upgraded standard:
occupants in arrested rolls, ejected occupants, unbelted occupants, occupants in rear seats, and occupants
without coded intrusion above their seating positions.
In 2008 NHTSA issued a supplemental notice of proposed rulemaking announcing the results of
additional research tests (Office of the Federal Register 2008). The proposal indicated the agency may
consider adopting a sequential two-sided test. Final decisions about the minimum SWR for either a one-
or two-sided test are pending results of an updated benefits analysis.
Previous Research Relating Roof Strength to Crash Injury Outcomes
NHTSA’s benefits analysis in the 2005 NPRM assumed that roofs designed to meet a higher
strength requirement in the quasi-static test are better able to maintain occupant headroom during rollover
crashes in the field. This link has never been shown, nor has any measure of roof strength been found to
2

predict injury risk. The agency’s own assessment found most vehicles “easily exceeded” the
requirements of FMVSS 216, even vehicles produced before introduction of the standard (Kahane 1989).
Demonstrating that a test promotes crashworthy designs is difficult without either a sample of vehicles
not meeting the test requirements or a range of performance among vehicles that pass. Kahane found that
some hardtop roof designs without B-pillars sustained more crush before meeting the minimum strength
requirement, and that fleet-wide fatality risk in non-ejection rollover crashes declined during the 1970s, a
time period corresponding to a shift towards roof designs with B-pillars. These findings did not establish
a relationship between roof strength and injury because test results for specific vehicles were not
compared with injury rates for those vehicles.
Only two studies directly investigated the relationship between peak roof strength and injury
outcome for occupants in real-world rollover crashes (Moffatt and Padmanaban 1995; Padmanaban et al.
2005). Vehicles were evaluated using the quasi-static procedure outlined in FMVSS 216, but every
vehicle was tested to a full 5 inches of plate displacement to measure roof strength in excess of the
minimum SWR. An earlier study by Plastiras et al. (1985) did not incorporate measures of peak roof
strength and used a severely limited sample of crashes.
Moffatt and Padmanaban (1995) constructed a logistic regression model to investigate the effects
of age, gender, belt use, alcohol use, crash environment (rural/urban), number of vehicle doors, vehicle
aspect ratio (roof height divided by track width), vehicle weight, roof damage, and roof strength on the
likelihood of fatal or incapacitating driver injury in single-vehicle rollover crashes. Crash data consisted
of single-vehicle rollovers in databases of police-reported crashes in four states. Multiple vehicle types
were included. The study reported no relationship between roof strength and the likelihood of fatal or
incapacitating injury. Although more severe roof damage was associated with higher likelihood of injury,
the study found roof strength did not predict the likelihood of severe roof damage.
Padmanaban et al. (2005) conducted a follow-up study that expanded the vehicle sample and
differed in a few other respects, but the findings were similar. Driver factors such as belt use, age, and
alcohol use were reported as important predictors of injury risk, whereas roof strength was not related to
the risk of fatal or incapacitating injury, or to the risk of fatal injury alone. Both studies also found that
vehicles with higher aspect ratios had lower rates of fatal or incapacitating injury.
These findings call into question the effectiveness of the FMVSS 216 regulation. The standard
was established to “reduce deaths and injuries due to the crushing of the roof,” but according to this
research, roof strength assessed under the regulated test conditions has no relationship to injury
likelihood. Furthermore, the Moffatt and Padmanaban (1995) study found no relationship between roof
strength and roof damage in rollover crashes. This finding suggests two possibilities: either the federal
standard is not evaluating roof strength in a mode relevant to real-world rollovers, or the methods used in
3

these studies have allowed other factors to obscure this relevance. Differences among vehicle types and
state reporting practices are two examples of factors that may have confounded the results for roof
strength.
The purpose of the present study was to investigate whether there is any relationship between
performance in the quasi-static test specified by FMVSS 216 and injury risk in rollover crashes. By
restricting the analysis to midsize four-door SUVs the study sought to minimize other factors that may
confound an analysis of roof strength, such as the differences in crash severity, vehicle kinematics,
occupant kinematics, and driver demographics associated with vehicles of different types. Vehicle
stability, occupant age effects, and differences between states were controlled statistically in the analyses.
The study estimated the effects of raising the minimum SWR requirement and also compared alternative
strength metrics calculated from the roof test data.
METHODS
Logistic regression was used to evaluate the effect of roof strength on driver injury risk in single-
vehicle rollover crashes involving midsize four-door SUVs. Roof strength data for 11 SUV models were
obtained from quasi-static tests in which roofs were crushed with up to 10 inches of plate displacement.
Using data from police-reported crashes in 12 states, driver injury rates by make/model were calculated as
the proportion of drivers in single-vehicle rollover crashes who were coded as having fatal or
incapacitating injury.
Vehicle Selection and Roof Strength Testing
Certain vehicle safety features might affect the rate of injuries in rollover crashes and thereby
confound the analyses of roof strength. Side curtain airbags and electronic stability control (ESC) are two
such features. In a single-vehicle rollover crash the presence of side curtain airbags may reduce the risk
of full or partial occupant ejection or reduce the risk of injury for occupants remaining in the vehicle.
ESC does not influence injury risk once a rollover has begun, but it most likely affects the type of rollover
crashes in which ESC-equipped vehicles are involved. All models with side curtain airbags or ESC as
standard features were excluded. None of the remaining vehicles had optional ESC installation rates
exceeding 3 percent, and only one had an optional curtain airbag installation rate higher than 5 percent
(Ward’s Communications, 2006). Potential confounding from the inclusion of 2002-04 Ford Explorers,
15 percent of which had curtain airbags, was addressed in a manner described below. Although it would
have been desirable to evaluate roof strength effects for vehicles with these safety features, which soon
will be standard across the fleet, there were insufficient data to do so.
Roof strength data from vehicle manufacturers typically do not enter the public domain and
therefore are not readily available to independent researchers. Additionally, compliance testing rarely is
4

extended beyond the crush distance required to demonstrate the minimum SWR of 1.5. To study the
range of roof strengths in the vehicle fleet, testing must continue beyond this level to measure peak force.
The required test data were available for three midsize SUVs from NHTSA research related to the
proposed standard upgrade. These data were included in the study.
Roof strength data for additional vehicles were obtained from tests conducted by General Testing
Laboratories, under contract with the Insurance Institute for Highway Safety. The eight midsize SUVs
with the most rollover crashes in the state databases used for the study were tested. Six of these models
were not current designs, so it was necessary to test used vehicles. Tested vehicles had no previous crash
damage and were equipped with the original factory-installed windshield and side windows. It has been
suggested that the windshield and its bond to the vehicle frame can contribute up to 30 percent of the
strength measured in the test (Friedman and Nash 2001).
In total, tests of 11 roof designs provided the data for the study. Some of these designs were
shared by corporate twins, so the number of vehicle models in the study exceeds 11.
Static Stability Factor
Moffatt and Padmanaban (1995) and Padmanaban et al. (2005) found that vehicles with larger
aspect ratios had lower rates of serious driver injury. The authors did not discuss the implications of this
finding, although the 2005 study suggested it was not due to any increased headroom of taller vehicles.
Assuming identical suspension properties, taller and narrower vehicles are less stable than wider shorter
ones, leading to rollovers at lower speeds and with less severe tripping events. It is possible that these
lower speed rollovers are less likely to cause serious injury, meaning that when rollovers do occur, less
stable vehicles may have lower severe injury rates simply because they roll more easily. Harwin and
Emery (1989) reported this from a sample of 3,000 rollover crashes in Maryland. The present study
included static stability factor (SSF) as a predictor in the logistic regression. SSF is a better measure of
stability than aspect ratio because the height of the center of gravity is measured instead of the height of
the roof. NHTSA uses SSF to assign rollover risk ratings to the vehicle fleet, and these publicly available
data were used in this study.
Roof Strength Metrics
Because performance in the FMVSS 216 test has not been shown to affect injury risk, it is not
clear that a baseline SWR within 5 inches of plate displacement better predicts injury outcome than other
strength metrics that can be calculated from the same test data. The energy absorbed by the roof may be
more relevant to injury risk than the peak force it can withstand, or the roof’s performance over a plate
displacement other than 5 inches could better predict injury risk. The contribution of vehicle mass to
rollover crashworthiness also is unknown.
5

In the present study the following metrics were evaluated: peak force, SWR, energy absorbed,
and equivalent drop height. SWR is peak force divided by vehicle curb weight, and equivalent drop
height is energy divided by curb weight converted to inches. The term “equivalent drop height” is used
because this metric can be considered the height from which the vehicle could be dropped on its roof to
produce the same level of crush as observed in the test (under an ideal condition where the roof deforms
identically in the dynamic and quasi-static conditions). Each of the metrics was calculated within 2, 5,
and 10 inches of plate displacement. Two inches was chosen based on the highly linear characteristic of
the force-deflection curves up to this displacement. Ten inches represented the maximum deflection in 10
of the 11 tests.
Because there were 11 tested roof designs, the evaluations using peak force and energy
absorption had 11 available values for comparison. The use of curb weight for calculating SWR and
equivalent drop height produced many more unique values. Corporate twins were separated where curb
weights differed, and two-wheel drive vehicles were separated from four-wheel drive versions due to their
lower weights and varying SSF values. These 31 vehicles produced 28 unique values of SWR and
equivalent drop height. Table 1 lists the vehicle test data used in the analysis. Appendix A reports the
other metrics for these vehicles as well as the other models for which these data can be applied. The
results for the 1996-2001 Ford Explorer and Mercury Mountaineer reflect the use of averaged values
obtained from two tests. The Mitsubishi Montero Sport was omitted from the 10-inch displacement
evaluations because NHTSA’s test of this vehicle did not continue beyond 7.4 inches. This omission did
not substantially affect the results; the Montero Sport had the smallest exposure of all vehicles in the
study.
Table 1FMVSS 216 roof strength test results
Peak roof strength (lbf) Model years Make Model 2 in 5 in 10 in 1996-2004 Chevrolet Blazer 4,293 7,074 7,337 2002-2005 Chevrolet TrailBlazer 6,896 8,943 8,943 1998-2003 Dodge Durango 6,409 9,138 9,138 1996-2001 Ford Explorer 5,901 7,072 8,196 2002-2004 Ford Explorer 6,895 9,604 12,372 1996-1998 Jeep Grand Cherokee 5,497 8,455 8,455 1999-2004 Jeep Grand Cherokee 5,073 6,560 7,090 2002-2005 Jeep Liberty 8,226 10,374 10,544 1997-2004 Mitsubishi Montero Sport 6,063 10,069 N/A 2000-2004 Nissan Xterra 9,431 11,996 11,996 1996-2000 Toyota 4Runner 5,269 8,581 8,581
Rollover Crash Data
Data for single-vehicle rollover crashes were obtained from the State Data System. The system is
maintained by NHTSA and consists of data from police-reported crashes submitted to the agency by
certain states. Qualifying states had data available for some part of calendar years 1997-2005, had event
6

and/or impact codes allowing single-vehicle rollovers to be identified, and had available information on
vehicle identification numbers sufficient for determining vehicle make, model, and model year. Twelve
states met these criteria: Florida, Georgia, Illinois, Kentucky, Maryland, Missouri, New Mexico, North
Carolina, Ohio, Pennsylvania, Wisconsin, and Wyoming. All of these states use the KABCO injury
coding system, where “K” represents fatal injuries and “A” represents incapacitating injuries as assessed
by the investigating police officer.
Logistic Regression
Logistic regression was used to assess the effect of roof strength on the likelihood of fatal or
incapacitating driver injury. The final models controlled for state, SSF, and driver age. Controlling for
state is necessary because of differences in reporting methods, terrain, urbanization, and other factors that
could result in state-to-state variation in injury rates. The potential influence of SSF on rollover crash
severity was discussed previously, and age has been found to affect injury risk (Li et al. 2003). A
separate model was fit for each roof strength metric at each plate displacement distance, yielding 12
models. The effect of roof strength was assumed to be constant across all states. Because rollovers
resulting in fatal or incapacitating injuries are fairly rare events, the odds ratios resulting from these
models are reasonable approximations of relative risks and are interpreted accordingly.
Other covariates initially were examined in the models. These included coded belt use, driver
gender, vehicle drive type (two- vs. four-wheel drive), and vehicle age. Driver gender, drive type, and
vehicle age did not have significant effects on injury likelihood and were excluded from the final model.
Coded belt use did affect injury risk in rollover crashes, and there was concern that belt use may confound
the observed effects of roof strength. To study this possibility, separate models were fit for drivers coded
as belted, unbelted, and unknown despite the unreliability of this information from police reports.
Tests that provided data for the 2002-04 Ford Explorer and 2000-04 Nissan Xterra were
conducted with an alternative tie-down procedure that NHTSA was investigating for a change to the
laboratory test procedure specified by the Office of Vehicle Safety Compliance (NHTSA 2006). At least
one manufacturer has expressed concern that this tie-down procedure produces different results than the
procedures used in its own compliance tests (Ford Motor Company 2006). The test procedure employed
by General Testing Laboratories for this study differed from both the alternative being investigated by
NHTSA and the procedure used by Ford. Two supplemental analyses addressed these procedural
variations. First, results for the Explorer and Xterra were excluded and the data were modeled again.
This also addressed any potential confounding resulting from the 15 percent installation rate of side
curtain airbags in the 2002-04 Explorer. Second, a sensitivity analysis was conducted. This consisted of
10 separate regression models in which the roof strength inputs to the model varied by up to 10 percent
7

above or below the measured strength. These values were sampled from a distribution using a random
number generator.
One difficulty associated with using fatal and incapacitating injury counts as the measure of crash
outcome is the subjectivity with which police can code incapacitating injuries. To check potential error
from police judgment, separate models were fit for fatal injuries alone to ascertain that they followed the
same pattern as models including incapacitating injuries.
Estimated Lives Saved
The present study has direct bearing on any future upgrades to FMVSS 216. Most of the study
vehicles would require stronger roofs if the SWR requirement increased from 1.5 to 2.5 without any other
modifications to the test procedure. To estimate the number of lives saved by such a change, data were
extracted from the Fatality Analysis Reporting System for 2006. Fatalities were counted for occupants in
front outboard seating positions in single-vehicle rollover crashes for each of the study vehicles. For
vehicles with SWRs below 2.5, the increase required to achieve this level of strength was used to scale the
effectiveness estimates of the final logistic regression model, producing vehicle-specific effectiveness
values. These values were applied to the number of fatalities in each vehicle to produce an estimate of
total lives saved. A second estimate was calculated using a target SWR of 3.16, the highest level
achieved by any of the study vehicles. No compliance margin was included in these estimates; it was
assumed that the roof strength values would not be greater than the target strength value.
RESULTS
Figure 1 shows the unadjusted relationship between the rate of fatal or incapacitating driver injury
and peak SWR within 5 inches of plate displacement, the metric used in FMVSS 216. The circles
represent the raw injury rate data; circle sizes are proportional to the total number of rollover crashes in
the state databases for each study vehicle, and hence to that vehicle’s contribution to the weighted
regression line that is plotted. The slope of the line represents an injury rate 24 percent lower than
average for an SWR one unit higher than average, but no adjustment was made for potentially
confounding factors.
After controlling for state effects, SSF, and driver age the logistic regression models estimated
changes in the odds of fatal or incapacitating driver injury for greater roof strength. Lower injury rates
were associated with higher values of peak force, SWR, energy absorption, and equivalent drop height at
2, 5, and 10 inches of plate displacement. All of these findings were statistically significant at the 0.05
level. The model for peak SWR within 5 inches predicted that a one-unit increase in SWR would reduce
the risk of fatal or incapacitating driver injury by 28 percent. These findings were based on 22,817
rollover crashes in the 12 states.
8

Figure 1 Rates of fatal or incapacitating driver injury by peak strength-to-
weight ratio (SWR) within 5 inches of plate displacement
y = -0.025x + 0.155
0.00
0.02
0.04
0.06
0.08
0.10
0.12
0.14
0.16
0.18
0.20
1.4 1.6 1.8 2.0 2.2 2.4 2.6 2.8 3.0 3.2 3.4
Inju
ry ra
te
Peak SWR within 5 inches of plate displacement
Circle size represents number of rollover crashes
Table 2 lists the odds ratios for fatal or incapacitating driver injury for higher roof strength
values. Odds ratios less than one indicate that greater roof strength is associated with lower injury risk.
The units vary by metric. Peak force is given in English tons, SWR in increments of vehicle weight,
energy absorption in kilojoules, and equivalent drop height in inches. One-unit differences in these
metrics do not represent equivalent changes in roof strength, so the point estimates in the first column
should not be directly compared against one another. To facilitate comparison, the second column lists
the range of roof strength test performance for the study vehicles, and the third column lists the effect
associated with a difference of this amount. For example, the lowest peak force within 2 inches of plate
displacement was 4,293 lbf (2.15 tons), observed in the test of the Chevrolet Blazer. The highest peak
force was 9,431 lbf (4.72 tons) for the Nissan Xterra, or 2.57 tons greater than the force in the Blazer test.
A strength difference of 2.57 tons was associated with a 49 percent lower injury risk for the stronger roof.
The effects of driver age and SSF also are listed in Table 2. SSF values ranged from 1.02 to 1.20
for the study vehicles, so the effect of a 0.1 unit increase in SSF was evaluated. Results did not show a
clear trend in injury risk by SSF. The effect of age was very consistent and statistically significant. Each
10-year increase in driver age was estimated to increase injury risk, given a single-vehicle rollover had
occurred, by 12-13 percent.
9

Table 2Results of logistic regression models for risk of fatal or incapacitating driver injuries
Roof strength SSF Driver ageStrength metric
Plate displacement
Odds ratio for1 unit increase Range
Odds ratio for observed range
Odds ratio for 0.1 unit increase
Odds ratio for10 year increase
Peak force (tons)
2 in 0.77* 2.15-4.72 0.51* 1.05 1.13* 5 in 0.82* 3.28-6.00 0.58* 1.06 1.12*
10 in 0.74* 3.55-6.19 0.46* 1.06 1.13*
SWR 2 in 0.55* 1.05-2.48 0.43* 0.98 1.13* 5 in 0.72* 1.64-3.16 0.61* 0.96 1.12*
10 in 0.57* 1.77-3.16 0.45* 0.93 1.13*
Energy absorbed (kJ)
2 in 0.34* 0.45-0.97 0.57* 1.01 1.13* 5 in 0.71* 2.58-4.51 0.52* 1.08 1.13*
10 in 0.82* 6.28-8.96 0.59* 1.06 1.13*
Equivalent drop height (in)
2 in 0.56* 0.96-2.25 0.48* 0.95 1.13* 5 in 0.85* 5.56-10.5 0.45* 0.98 1.13*
10 in 0.89* 13.6-20.5 0.44* 0.93 1.13* *Statistically significant at 0.05 level
Eighty-three percent of drivers in the study were coded as belted. Logistic regression models
using only these drivers produced estimates for the effectiveness of roof strength in preventing injury that
were very similar to those of the regression models for all drivers. All estimates were statistically
significant. Ten percent of drivers were coded as unbelted, and regression models restricting to these
crashes found small effects of roof strength on injury risk that were not statistically significant. Police
reported unknown belt use for the remaining 7 percent of drivers. Roof strength effect estimates for these
crashes were similar to the overall model, although not all were statistically significant at the 0.05 level.
Results are listed in Table 3.
Table 3Results of logistic regression models for risk of fatal or
incapacitating driver injuries by police-reported belt use
Plate Odds ratios for 1 unit increases in roof strength,
by police reported belt use displacement All drivers Belted Unbelted Unknown
Peak force (tons)
2 in 0.77* 0.79* 0.93 0.79 5 in 0.82* 0.82* 1.00 0.90
10 in 0.74* 0.76* 0.94 0.81
SWR 2 in 0.55* 0.59* 0.85 0.54* 5 in 0.72* 0.73* 0.99 0.78
10 in 0.57* 0.59* 0.90 0.59
Energy absorbed (kJ)
2 in 0.34* 0.40* 0.64 0.34 5 in 0.71* 0.73* 0.95 0.79
10 in 0.82* 0.85* 0.95 0.86
Equivalent drop height (in)
2 in 0.56* 0.62* 0.79 0.54* 5 in 0.85* 0.86* 0.98 0.86
10 in 0.89* 0.91* 0.97 0.88* *Statistically significant at 0.05 level
The two supplemental analyses addressing test procedure differences produced results
comparable with the overall results in Table 2. The odds ratio for fatal or incapacitating driver injury
associated with a one-unit higher SWR at 5 inches of plate displacement, originally 0.72, was 0.74 for the
10

regression model excluding the Explorer and Xterra and ranged from 0.67 to 0.78 for the 10 regression
models with varying roof strengths. These results remained statistically significant at the 0.05 level.
Of the 22,817 rollover crashes in the state data set, 1,869 drivers sustained incapacitating injuries
and 531 sustained fatal injuries. Because these injuries were split among 12 different states and up to 28
unique SWR values, fatality counts were quite small. Nevertheless, results from the fatality models were
similar to results from the models that also included incapacitating injury, and in 11 of 12 cases were
statistically significant at the 0.05 level. Results are presented in Table 4.
Table 4Results of logistic regression models of risk of driver fatality
Plate
displacement Odds ratio for1 unit increase
Peak force (tons)
2 in 0.61* 5 in 0.80*
10 in 0.58*
SWR 2 in 0.36* 5 in 0.76
10 in 0.43*
Energy absorbed (kJ)
2 in 0.11* 5 in 0.54*
10 in 0.62*
Equivalent drop height (in)
2 in 0.35* 5 in 0.79*
10 in 0.80* *Statistically significant at 0.05 level
In 2006, 668 occupants in front outboard seating positions were killed in single-vehicle rollover
crashes involving the study vehicles. It was estimated that 108 of these lives (95 percent confidence
interval: 63-148) could have been saved by increasing the minimum SWR required by FMVSS 216 from
1.5 to 2.5. Increasing the minimum SWR to 3.16 could have saved 212 lives (95 percent confidence
interval: 130-282).
DISCUSSION
The present study demonstrates that roof strength has a strong effect on occupant injury risk.
This is in contrast to previous research relating roof test results to injury rates in field rollover crashes
(Moffatt and Padmanaban 1995; Padmanaban et al. 2005). To fully investigate these differences, the
detailed roof strength data from the previous studies would need to be compared with the data reported
here. Unfortunately, these earlier data are confidential and a precise reason for the difference in results
cannot be established. Nevertheless, the differing methods employed by the studies offer some potential
explanations.
One of the biggest differences is that confounding effects associated with vehicle type largely
were ignored in earlier research. Passenger cars, minivans, pickups, and SUVs all were included, and
vehicles were classified by aspect ratio (roof height divided by track width). The substantial differences
11

in driver demographics, rollover kinematics, and other factors associated with these vehicle types were
unlikely to be captured with a measurement based solely on two exterior vehicle dimensions.
The only consideration of vehicle type was a secondary analysis in the Moffatt and Padmanaban
(1995) study in which sports cars were grouped with pickups and SUVs, while non-sports cars were
grouped with minivans. This attempted to control for the likelihood of drivers engaging in risky driving
maneuvers, but likely only served to exacerbate differences in rollover crashes. Sports cars typically are
the least rollover prone of all vehicles, with low centers of gravity and wide track widths. By grouping
sports cars with SUVs and pickups, the authors combined vehicles requiring very severe roll-initiation
events with vehicles requiring less severe initiation. Calculations using data reported by Digges and
Eigen (2003) showed that for belted non-ejected occupants in rollover crashes, more than 20 percent of
those in passenger cars were exposed to two or more roof impacts, whereas less than 10 percent of SUV
and pickup occupants were in rollovers this severe.
Another difference was that these two previous studies did not control for differences among the
states used in the analysis. NHTSA analyses of rollover crashes using state data controlled for these
differences (Office of the Federal Register 2000), and the present study did so as well.
Belt Use and Ejection
Schiff and Cummings (2004) found that police reports overestimate belt use as compared with
NASS/CDS, which is regarded as a more reliable source of this information. The authors found the most
disagreement in cases where occupant injuries were least severe; for uninjured occupants coded as
unbelted in NASS/CDS, police reported positive belt use 47 percent of the time. Because of this
discrepancy, including restraint use as a predictor of injury would produce regression models that
overestimate the true effect of belt use and reduce the apparent effect of other variables, such as roof
strength.
The present study did not include police-reported belt use in the final regression model.
Preliminary models separately analyzed drivers coded as belted and unbelted. Regression models for
drivers with reported belt use estimated roof strength effects nearly identical to the effects estimated for
all drivers. This is not surprising given the high percentage of reported belt use, but it does imply that
belt use is not confounding the results of the final regression model. The models for drivers reported as
unbelted did not find a significant relationship between roof strength and injury risk. Roof strength may
have less of an effect on injury risk for unbelted drivers, but results are inconclusive given the limited
sample of drivers reported as unbelted and the inaccuracy of restraint use from police reports.
Thirty-eight percent of drivers who police said were unbelted also were reported as ejected.
Digges et al. (1994) reported that 42 percent of unrestrained occupants who were ejected exited the
12
vehicle through a path other than the side windows, such as the door opening or the windshield.
Increased roof strength potentially can reduce the integrity loss that can lead to doors opening or
windshields being displaced. As the number of vehicles with side curtain airbags increase, the likelihood
of ejection through the side windows should decrease. However, weak roofs could compromise the
protection afforded by these airbags if they allow the roof rails to shift laterally and expose occupants to
contacts with the ground.
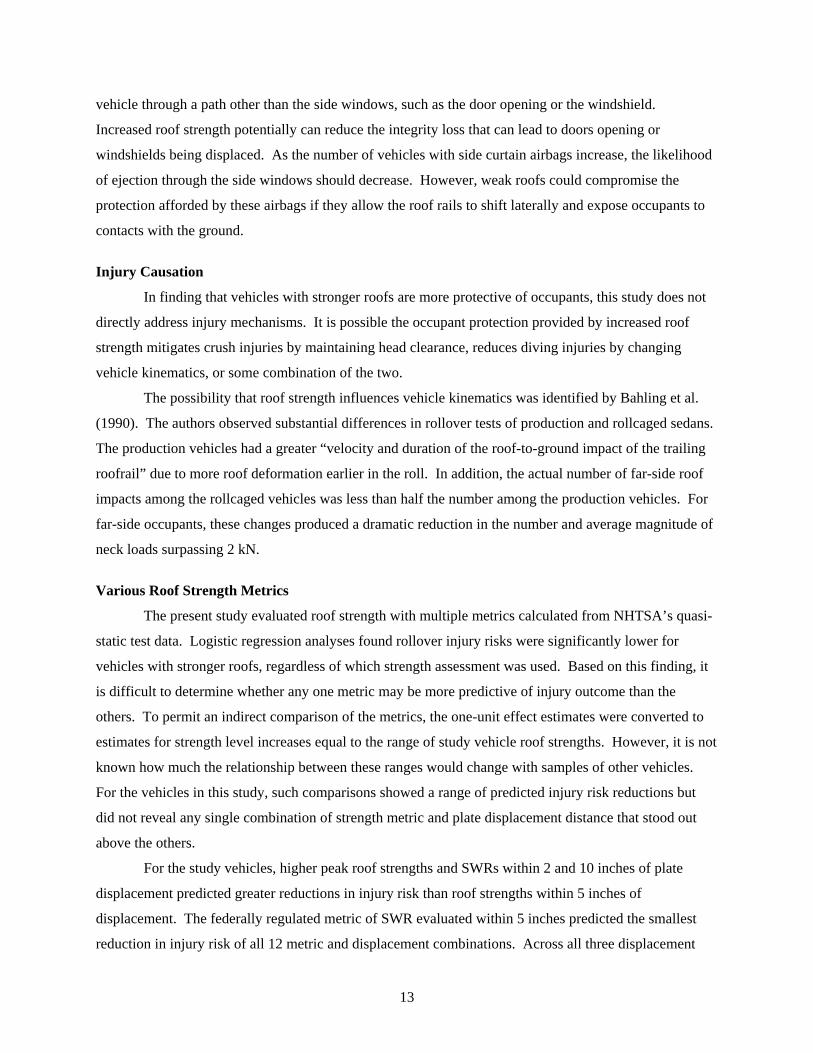
Injury Causation
In finding that vehicles with stronger roofs are more protective of occupants, this study does not
directly address injury mechanisms. It is possible the occupant protection provided by increased roof
strength mitigates crush injuries by maintaining head clearance, reduces diving injuries by changing
vehicle kinematics, or some combination of the two.
The possibility that roof strength influences vehicle kinematics was identified by Bahling et al.
(1990). The authors observed substantial differences in rollover tests of production and rollcaged sedans.
The production vehicles had a greater “velocity and duration of the roof-to-ground impact of the trailing
roofrail” due to more roof deformation earlier in the roll. In addition, the actual number of far-side roof
impacts among the rollcaged vehicles was less than half the number among the production vehicles. For
far-side occupants, these changes produced a dramatic reduction in the number and average magnitude of
neck loads surpassing 2 kN.
Various Roof Strength Metrics
The present study evaluated roof strength with multiple metrics calculated from NHTSA’s quasi-
static test data. Logistic regression analyses found rollover injury risks were significantly lower for
vehicles with stronger roofs, regardless of which strength assessment was used. Based on this finding, it
is difficult to determine whether any one metric may be more predictive of injury outcome than the
others. To permit an indirect comparison of the metrics, the one-unit effect estimates were converted to
estimates for strength level increases equal to the range of study vehicle roof strengths. However, it is not
known how much the relationship between these ranges would change with samples of other vehicles.
For the vehicles in this study, such comparisons showed a range of predicted injury risk reductions but
did not reveal any single combination of strength metric and plate displacement distance that stood out
above the others.
For the study vehicles, higher peak roof strengths and SWRs within 2 and 10 inches of plate
displacement predicted greater reductions in injury risk than roof strengths within 5 inches of
displacement. The federally regulated metric of SWR evaluated within 5 inches predicted the smallest
reduction in injury risk of all 12 metric and displacement combinations. Across all three displacement
13

distances, higher values of equivalent drop height predicted the most consistent reductions in injury risk
but the differences from other metrics were not large. Future analyses of the quasi-static test condition’s
relevance to real-world rollovers should further evaluate the equivalent drop height metric.
The metrics that accounted for vehicle curb weight were somewhat better predictors of injury risk
than the metrics that did not. The importance of weight may be stronger across the entire vehicle fleet,
where the range of curb weights is much wider than for the study vehicles. More than 80 percent of the
rollover crashes in this study occurred among vehicles with curb weights between 3,800 and 4,200
pounds.
Other Covariates
All of the logistic regression models estimated significant injury risk increases of 12-13 percent
for each 10-year increase in driver age. The findings for SSF were not statistically significant. Although
the full range of SSF values for the study vehicles was 1.02-1.20, 74 percent of the rollover crashes in this
study involved vehicles with SSF values between 1.06 and 1.09. This could explain the inconclusive
injury risk estimates because such small variation in SSF values may be outweighed by other differences
that affect vehicle stability and cannot be captured in SSF calculations, such as wheelbase or suspension
and tire properties. A stronger trend may exist across the wider range of SSF values found in the entire
fleet, with the most stable vehicles typically having values of 1.50 (Robertson and Kelley 1989).
Implications of Testing Used Vehicles
The analyses required vehicle models that have been in the fleet for enough years to accumulate
sufficient crash data, so it was necessary to test used vehicles. According to vehicle manufacturers and
NHTSA, roof strengths of used vehicles may not be equivalent to those of new vehicles (Office of the
Federal Register 2006). Vehicles in the present study had no crash damage or corrosion that could have
affected test results. Factory-installed windshields and side glazing still were present. However, it is
possible that different results would have been obtained for new models. To some extent, this concern
was addressed with the sensitivity analysis. The injury risk findings did not vary substantially when roof
strength values were varied up to 10 percent.
Test results for the study vehicles may better represent the roof strengths of vehicles involved in
rollover crashes than results for vehicles used in compliance testing and those used in earlier research.
Previous studies included tests of production vehicles, prototypes, and vehicles “representative of
production” that were “deemed satisfactory for compliance…[based on] engineering judgment” (Moffatt
and Padmanaban 1995). The authors did not specify how many values were obtained from production
vehicles.
14

Relevance to Proposed FMVSS 216 and Estimated Lives Saved
The estimated number of lives saved by increasing the regulated SWR to 2.5 is considerably
higher than the estimated 13 and 44 lives saved indicated in NHTSA’s 2005 NPRM, despite the fact the
agency’s estimates cover the entire passenger vehicle fleet. Estimates presented here are limited to the 11
study vehicles for two reasons: peak roof strength values for other vehicles mostly are unknown, and the
effectiveness of roof strength in reducing injury may vary across vehicle types. Another difference in the
estimates comes from the NPRM’s modified plate displacement criterion, which allows roof intrusion for
each vehicle until head contact with an ATD. The NPRM details 10 research tests in which plate
displacement ranged from 3.2 to 7.3 inches at roof contact with the ATD. Because the present study
looked at midsize SUVs with a narrow range of headroom values relative to the entire fleet, results could
not directly address the headroom criterion proposal.
The number of rollover fatalities in the future will be affected by other changes to the vehicle
fleet in addition to roof strength, such as wider availability of ESC and side curtain airbags, especially
those designed to inflate in rollovers. Nevertheless, an upgraded standard requiring an SWR value of 2.5
likely would produce much greater reductions in fatal and incapacitating injuries than estimated by
NHTSA. Further increasing the minimum SWR requirement beyond 2.5 would prevent even more deaths
and serious injuries.
CONCLUSIONS
Increased vehicle roof strength reduces the risk of fatal or incapacitating driver injury in single-
vehicle rollover crashes. This finding contradicts those from two previous studies on the topic, but the
present study more tightly controlled potential confounding factors. The study focused on midsize SUVs,
but there is no obvious reason similar relationships would not be found for other vehicle types, although
the magnitudes of injury rate reductions may differ. Any substantial upgrade to the FMVSS 216 roof
strength requirement would produce reductions in fatal and incapacitating injuries that substantially
exceed existing estimates.
ACKNOWLEDGMENT
This work was supported by the Insurance Institute for Highway Safety.
15
REFERENCES
Bahling, G.S.; Bundorf, R.T.; Kaspzyk, G.S.; Moffatt, E.A.; Orlowski, K.F.; and Stocke, J.E. 1990. Rollover and drop tests – the influence of roof strength on injury mechanics using belted dummies. Proceedings of the 34th Stapp Car Crash Conference. SAE Technical Paper Series 902314. Warrendale, PA: Society of Automotive Engineers.
Digges, K.H. and Eigen, A.M. 2003. Crash attributes that influence the severity of rollover crashes. Proceedings of the 18th International Technical Conference on the Enhanced Safety of Vehicles. Paper 231-O. Washington, DC: National Highway Traffic Safety Administration.
Digges, K.H.; Malliaris, A.C.; and DeBlois, H.J. 1994. Opportunities for casualty reduction in rollover crashes. Proceedings of the 14th International Technical Conference on the Enhanced Safety of Vehicles. Paper 94-S5-O-11. Washington, DC: National Highway Traffic Safety Administration.
Deutermann, W. 2002. Characteristics of fatal rollover crashes. Report no. DOT HS-809-438. Washington, DC: US Department of Transportation.
Ford Motor Company. 2006. Comment to the National Highway Traffic Safety Administration concerning Federal Motor Vehicle Safety Standard 216, Roof Crush Resistance. Docket Document No. NHTSA-2005-22143-191, January 11, 2006. Washington, DC: US Department of Transportation.
Friedman, D. and Nash, C.E. 2001. Advanced roof design for rollover protection. Proceedings of the 17th International Technical Conference on the Enhanced Safety of Vehicles. Paper 01-S12-W-94. Washington, DC: National Highway Traffic Safety Administration.
Harwin, E.A. and Emery, L. 1989. The crash avoidance rollover study: a database for the investigation of single vehicle rollover crashes. Proceedings of the 12th International Technical Conference on the Enhanced Safety of Vehicles, 470-477. Washington, DC: National Highway Traffic Safety Administration.
Insurance Institute for Highway Safety. 2007. Analysis of 2006 data from the Fatality Analysis Reporting System. Arlington, VA.
James, M.B.; Nordhagen, R.P.; Schneider, D.C.; and Koh, S.W. 2007. Occupant injury in rollover crashes: a reexamination of Malibu II. SAE Technical Paper Series 2007-01-0369. Warrendale, PA: Society of Automotive Engineers.
Kahane, C.J. 1989. An evaluation of door locks and roof crush resistance of passenger cars, Federal Motor Vehicle Safety Standards 206 and 216. Report no. DOT HS-807-489. Washington, DC: US Department of Transportation.
Li, G.; Braver, E.R.; and Chen, L. 2003. Fragility versus excessive crash involvement as determinants of high death rates per vehicle-mile of travel among older drivers. Accident Analysis and Prevention 35:227-35.
Lund, A.K. and Nolan, J.M. 2003. Changes in vehicle designs from frontal offset and side impact crash testing. SAE Technical Paper Series 2003-01-0902. Warrendale, PA: Society of Automotive Engineers.
16

Moffatt, E.A.; Cooper, E.R.; Croteau, J.J.; Orlowski, K.F.; Marth, D.R.; and Carter, J.W. 2003 Matched-pair rollover impacts of rollcaged and production roof cars using the controlled rollover impact system (CRIS). SAE Technical Paper Series 2003-01-0172. Warrendale, PA: Society of Automotive Engineers.
Moffatt, E.A. and Padmanaban, J. 1995. The relationship between vehicle roof strength and occupant injury in rollover crash data. Proceedings of the 39th Annual Conference of the Association for the Advancement of Automotive Medicine, 245-267. Des Plaines, IL: Association for the Advancement of Automotive Medicine.
National Highway Traffic Safety Administration. 2006. Laboratory test procedure for FMVSS 216 roof crush resistance. Report no. TP-216-05. Washington, DC: US Department of Transportation.
Office of the Federal Register. 1971. Federal Register, vol. 36, no. 236, pp. 23299-23300. National Highway Traffic Safety Administration – Final rule. Docket no. 2-6, Notice 5; 49 CFR Part 571 – Motor Vehicle Safety Standards. Washington, DC: National Archives and Records Administration.
Office of the Federal Register. 1991. Federal Register, vol. 56, no. 74, pp. 15510-15517. National Highway Traffic Safety Administration – Final rule. Docket no. 89-22, Notice 03; 49 CFR Part 571 – Federal Motor Vehicle Safety Standards, Roof Crush Resistance. Washington, DC: National Archives and Records Administration.
Office of the Federal Register. 2000. Federal Register, vol. 65, no. 106. pp. 34998-35024. National Highway Traffic Safety Administration – Request for comments. Docket no. NHTSA-2000-6859; 49 CFR Part 575 – Consumer Information Regulations, Federal Motor Vehicle Safety Standards, Rollover Prevention. Washington, DC: National Archives and Records Administration.
Office of the Federal Register. 2005. Federal Register, vol. 70, no. 162, pp. 49223-49248. National Highway Traffic Safety Administration – Notice of proposed rulemaking. Docket no. NHTSA-2005-22143; 49 CFR Part 571 – Federal Motor Vehicle Safety Standards, Roof Crush Resistance. Washington, DC: National Archives and Records Administration.
Office of the Federal Register. 2006. Federal Register, vol. 71, no. 168, pp. 51663-51665. National Highway Traffic Safety Administration – Denial of petition for compliance investigation. Docket no. NHTSA-2005-22904, Notice 1; 49 CFR Part 571 – Federal Motor Vehicle Safety Standards, Roof Crush Resistance. Washington, DC: National Archives and Records Administration.
Office of the Federal Register. 2008. Federal Register, vol. 73, no. 20, pp. 5484-5493. National Highway Traffic Safety Administration – Supplemental notice of proposed rulemaking. Docket no. NHTSA-2008-0015; 49 CFR Part 571 – Federal Motor Vehicle Safety Standards, Roof Crush Resistance. Washington, DC: National Archives and Records Administration.
Orlowski, K.F.; Bundorf, R.T.; and Moffatt, E.A. 1985. Rollover crash tests-the influence of roof strength on injury mechanics. Proceedings of the 29th Stapp Car Crash Conference. SAE Technical Paper Series 851734. Warrendale, PA: Society of Automotive Engineers.
Padmanaban, J; Moffatt, E. A.; and Marth, D.R. 2005. Factors influencing the likelihood of fatality and serious/fatal injury in single-vehicle rollover crashes. SAE Technical Paper Series 2005-01-0944. Warrendale, PA: Society of Automotive Engineers.
17

18
Piziali, R.; Hopper, R.; Girvan, D.; and Merala, R. 1998. Injury causation in rollover accidents and the biofidelity of Hybrid III data in rollover tests. SAE Technical Paper Series 980362. Warrendale, PA: Society of Automotive Engineers.
Plastiras, J.K.; Lange, R.C.; McCarthy, R.L.; and Padmanaban, J.A. 1985. An examination of the correlation between vehicle performance in FMVSS 216 versus injury rates in rollover accidents. SAE Technical Paper Series 850335. Warrendale, PA: Society of Automotive Engineers.
Rechnitzer, G.; Lane, J.; McIntosh, A.S.; and Scott, G. 1998. Serious neck injuries in rollovers – is roof crush a factor? International Journal of Crashworthiness 3:286-94.
Robertson, L.S. and Kelley, A.B. 1989. Static stability as a predictor of overturn in fatal motor vehicle crashes. The Journal of Trauma 29:313-19.
Schiff, M.A. and Cummings, P. 2004. Comparison of reporting of seat belt use by police and crash investigators: variation in agreement by injury severity. Accident Analysis and Prevention 36:961-65.
Syson, S.R. 1995 Occupant to roof contact: rollovers and drop tests. SAE Technical Paper Series 950654. Warrendale, PA: Society of Automotive Engineers.
Ward’s Communications. 2006. Ward’s Automotive Reports, 2003-06. Southfield, MI.

APPENDIX A Table A1
All study vehicle make and model combinations with roof strength and SSF data; vehicles grouped by FMVSS 216 test result; only 4 door models were included in the study
First model
Last model Drive SWR Energy absorbed (J)
Equivalent dropheight (in)
year year Make Model type SSF 2 in 5 in 10 in 2 in 5 in 10 in 2 in 5 in 10 in1996 2004 Chevrolet Blazer 2wd 1.02 1.16 1.91 1.98 447 2575 6282 1.1 6.2 15.0 1996 2004 Chevrolet Blazer 4wd 1.09 1.06 1.75 1.81 447 2575 6282 1.0 5.6 13.7 1996 2001 GMC Jimmy 2wd 1.02 1.14 1.89 1.96 447 2575 6282 1.1 6.1 14.8 1996 2001 GMC Jimmy 4wd 1.09 1.05 1.73 1.79 447 2575 6282 1.0 5.6 13.6 1996 2001 Oldsmobile Bravada 4wd 1.09 1.05 1.74 1.80 447 2575 6282 1.0 5.6 13.6
2002 2005 Chevrolet TrailBlazer 2wd 1.16 1.58 2.04 2.04 729 3482 7647 1.5 7.0 15.5 2002 2005 Chevrolet TrailBlazer 4wd 1.18 1.52 1.97 1.97 729 3482 7647 1.4 6.8 14.9 2002 2005 GMC Envoy 2wd 1.16 1.58 2.04 2.04 729 3482 7647 1.5 7.0 15.5 2002 2005 GMC Envoy 4wd 1.18 1.52 1.97 1.97 729 3482 7647 1.4 6.8 14.9 2002 2004 Oldsmobile Bravada 2wd 1.16 1.56 2.02 2.02 729 3482 7647 1.5 7.0 15.3 2002 2004 Oldsmobile Bravada 4wd 1.18 1.50 1.94 1.94 729 3482 7647 1.4 6.7 14.7
1998 2003 Dodge Durango 2wd 1.20 1.46 2.08 2.08 694 3405 7483 1.4 6.9 15.1 1998 2003 Dodge Durango 4wd 1.16 1.39 1.98 1.98 694 3405 7483 1.3 6.5 14.3
1996 2001 Ford Explorer 2wd 1.06 1.50 1.79 2.07 710 2966 7064 1.6 6.6 15.8 1996 2001 Ford Explorer 4wd 1.06 1.40 1.68 1.96 710 2966 7064 1.5 6.3 14.9 1997 2001 Mercury Mountaineer 2wd 1.06 1.48 1.77 2.05 710 2966 7064 1.6 6.6 15.6 1997 2001 Mercury Mountaineer 4wd 1.06 1.40 1.68 1.96 710 2966 7064 1.5 6.3 14.9
2002 2004 Ford Explorer 2wd 1.10 1.64 2.29 2.95 838 3713 8780 1.8 7.8 18.5 2002 2004 Ford Explorer 4wd 1.14 1.57 2.18 2.81 838 3713 8780 1.7 7.5 17.7
1996 1998 Jeep Grand Cherokee 2wd 1.07 1.53 2.35 2.35 577 2971 6443 1.4 7.3 15.8 1996 1998 Jeep Grand Cherokee 4wd 1.07 1.45 2.23 2.23 577 2971 6443 1.3 6.9 15.0
1999 2004 Jeep Grand Cherokee 2wd 1.09 1.33 1.72 1.86 661 2645 6376 1.5 6.1 14.8 1999 2004 Jeep Grand Cherokee 4wd 1.11 1.27 1.64 1.77 661 2645 6376 1.5 5.9 14.1
2002 2005 Jeep Liberty 2wd 1.10 2.12 2.68 2.72 962 3896 8959 2.2 8.9 20.5 2002 2005 Jeep Liberty 4wd 1.12 1.99 2.51 2.56 962 3896 8959 2.1 8.4 19.2
1997 2004 Mitsubishi Montero Sport 2wd 1.07 1.56 2.59 N/A 667 3473 N/A 1.5 7.9 N/A 1997 2004 Mitsubishi Montero Sport 4wd 1.11 1.46 2.42 N/A 667 3473 N/A 1.4 7.4 N/A
2000 2004 Nissan Xterra 2wd 1.09 2.48 3.16 3.16 967 4514 8708 2.3 10.5 20.3 2000 2004 Nissan Xterra 4wd 1.12 2.30 2.93 2.93 967 4514 8708 2.1 9.7 18.8
1996 2000 Toyota 4Runner 2wd 1.08 1.51 2.45 2.45 612 2896 6618 1.5 7.3 16.7 1996 2000 Toyota 4Runner 4wd 1.06 1.39 2.26 2.26 612 2896 6618 1.4 6.7 15.4
19

May 13, 2008 The Honorable Nicole R. Nason Administrator National Highway Traffic Safety Administration 1200 New Jersey Avenue, SE, West Building Washington, DC 20590 Supplemental Notice of Proposed Rulemaking; 49 CFR Part 571, Federal Motor Vehicle Safety Standards, Roof Crush Resistance; Docket No. NHTSA-2008-0015 Dear Administrator Nason: The Insurance Institute for Highway Safety (IIHS) has conducted a study that demonstrates a direct relationship between roof strength and injury risk reduction in rollover crashes (Brumbelow et al., 2008). We included this study in our previous comment to the docket (IIHS, 2008) because of its relevance to the National Highway Traffic Safety Administration’s (NHTSA) rulemaking under Federal Motor Vehicle Safety Standard (FMVSS) 216. Finding that stronger roofs reduce the risk of injury in rollover crashes, the IIHS study contradicts two previous studies on the topic (Moffatt and Padmanaban, 1995; Padmanaban et al., 2005). Two authors of these earlier studies have submitted a comment and additional analysis to NHTSA (Padmanaban and Moffatt, 2008), questioning the IIHS study and concluding that “stronger roofs are not safer roofs.” The comments by Padmanaban and Moffatt (2008) contain misleading statements about the IIHS study that are detailed in item 6 of the attached document, “Logical and Statistical Errors in Comments by Padmanaban and Moffatt on the Insurance Institute for Highway Safety Study, ‘Roof Strength and Injury Risk in Rollover Crashes.’ ” In addition, the analytical tactics recommended and used by Padmanaban and Moffatt depart in fundamental ways from appropriate use and interpretation of statistical results (see item 4). Of most concern is their insistence on including ejection, belt use, and alcohol use as control variables in their analysis when, in fact, these variables are either direct outcomes of roof crush strength or affected by the dependent variable, injury risk. Inclusion of them in the analysis obfuscates the real effects of roof strength on injury risk (see items 1-3). These concerns are detailed in the attachment. We would be happy to discuss the issues further if NHTSA has questions. Sincerely, Adrian K. Lund, Ph.D. President
cc: Docket Clerk, Docket No. NHTSA-2008-0015

Nicole Nason May 13, 2008 Attachment – page 1 Logical and Statistical Errors in Comments by Padmanaban and Moffatt on the Insurance Institute for Highway Safety Study, “Roof Strength and Injury Risk in Rollover Crashes”
1. Ejection is an outcome of rollover and is influenced by roof strength. Including ejection as a predictor of death or serious injury in a rollover crash masks a major benefit of roof strength.
Padmanaban and Moffat argue that IIHS should have included a number of additional variables in the predictive model of injuries and deaths in rollovers. One of these variables is ejection. Their argument is that ejection greatly increases the risk of injury while “ejection is…likely to be unrelated to roof strength” (pg. 1).
a. This argument is illogical. Roof strength may not affect injury risk once a person is ejected, but a strong roof may prevent occupants from being ejected in the first place. Preventing an occupant compartment from collapsing obviously can reduce ejection risk by preventing broken glazing and deformed structure, which create ejection paths.
b. This argument is testable. Using the midsize SUVs in the IIHS study, IIHS researchers investigated the relationship between roof strength and ejection risk with an additional analysis. The risk of ejection was 31 percent lower for each 1-unit increase in peak roof strength-to-weight ratio (SWR) measured within 5 inches of plate displacement (p-value of 0.004). Appendix A reports details of this analysis. Clearly, ejection risk is not “unrelated to roof strength.”
c. By treating ejection as a risk factor unrelated to roof strength, when reduced ejection risk is one of the benefits of stronger roofs, Padmanaban and Moffatt bias their analysis against finding a relationship between roof strength and injury risk.
d. Padmanaban and Moffatt’s concern about ejection implies that roof strength does not matter if ejected occupants are not counted. However, a new IIHS analysis limited to drivers coded by police as not having been ejected reveals that stronger roofs reduced injury risk among these drivers. Many of the fatal and incapacitating injuries in the overall analysis were sustained by ejected drivers, but risk reductions for drivers not ejected were statistically significant and very similar to the overall analysis. Appendix B reports the full results.
2. Belt use cannot be used in a model evaluating roof strength and injury likelihood because information about belt use in crashes is inaccurate, incomplete, and subject to influence by the injury outcomes.
Another variable that Padmanaban and Moffat argue should be included as a control (predictor) variable in the IIHS study is police-reported belt use. According to Padmanaban and Moffat, “It is well known that the majority of rollover KA injuries and fatalities are to unbelted occupants, mostly ejectees” (pg. 2) and, later, “… 56% of the fatalities and 28% of the serious/fatal injuries were unbelted and completely ejected” (pg. 5). As a result, Padmanaban and Moffat conclude that belt use should have been a predictor variable. However, because this variable is difficult to know with precision, inclusion as a predictor variable can bias any analysis of roof strength.
a. The principal source of bias in belt use codes is that police-coded belt use is subject to distortion by crash outcomes. No official typically is present to observe belt use prior to a crash. Instead, police must judge belt use based on information gathered after the crash including statements by occupants about their own belt use, statements by witnesses to the crash and, significantly, the presence of injuries and whether police believe they are consistent or inconsistent with belt use. In other words, Padmanaban and Moffat include in their analysis a variable that is itself subject to

Nicole Nason May 13, 2008 Attachment – page 2
influence by the outcome (injury severity and pattern) to be predicted. In addition, occupant statements about belt use are influenced by the fact that it is illegal in most states to be unbelted. A result of these twin biases is that belt use in crashes can be overestimated, especially for occupants with lesser injuries whose claims of belt use are more believable (Schiff and Cummings, 2004). Models including belt use as a predictor of injury severity not only introduce general inaccuracy but also overestimate the effect of belt use on reducing injury, simultaneously masking the effects of any other variables. Evidence of the bias toward overestimating belt use in the dataset used in the IIHS study is provided by comparisons with NHTSA’s National Occupant Protection Use Survey (NOPUS), which records rates of belt use for the general population observed during daylight hours. During the calendar years of the IIHS study, NOPUS data show driver belt use averaging 70-75 percent, which is lower than the 83 percent recorded by police for drivers in the rollover crashes in the IIHS study. It is unlikely that drivers involved in single-vehicle rollover crashes, many of which occur at night when belt use rates are lower (NHTSA, 2005, 2007), were wearing belts more often than the general population during daylight hours.
b. Because of these problems, IIHS did not include belt use as a predictor. However, IIHS did examine whether the effects varied by coded belt use. As reported in the study, additional statistical models were run for occupants coded as belted (83 percent), for those coded as unbelted (10 percent), and for those coded as unknown (7 percent).
i. For those coded as belted, the pattern of effects of roof strength varied little from the overall analysis. This is not surprising because most drivers in the study were coded as belted. In addition, if belt use is miscoded, as argued above, then many of the drivers actually were unbelted, again meaning that this analysis is very similar to the overall analysis.
ii. For those coded as unknown, the pattern also was quite similar to the overall analysis. Again, this is not surprising because the unknown group also included both belted and unbelted occupants.
iii. Effects estimated for those coded as unbelted were much smaller, but this would be expected from the twin biases noted in item 2.a. It is likely many of those coded as unbelted received their codes because their injuries were serious and inconsistent with belt use. This bias would occur for both weak and strong roofs, masking the effect of roof strength by assigning higher weight to the (overestimated) effect of belt use.
The conclusion from these separate analyses is that coded belt use does not affect the estimated effect of roof strength on injury severity, except in a way that would be expected from the biases and inaccuracies inherent in police-coded belt use.
3. Like police-coded belt use, police-coded alcohol involvement in crashes is incomplete, inaccurate, and may be related to the injury severity. Besides, Padmanaban and Moffatt offer no justification other than the empirical relationship, which could be spurious, for including alcohol use codes in the prediction equation.
a. Results of blood alcohol concentration (BAC) tests are the most objective measures of the presence of alcohol, but only a small percentage of crash-involved drivers typically are tested. Queries of the state databases used in the IIHS study show that about 11 percent of the drivers studied were tested. Padmanaban and Moffatt report using a combination of BAC test results and “had been drinking” codes. They do not specify in their comments to NHTSA what

Nicole Nason May 13, 2008 Attachment – page 3
percentage of the codes resulted from actual BAC tests, what codes were used for those not tested, or the extent of missing data. In response to an IIHS inquiry, they provided this additional information:
i. Of drivers identified in their analysis as positive for alcohol use, about 18 percent were tested. About 13 percent tested positive, and 5 percent were coded as having positive alcohol use despite negative BAC tests. Thus 5 percent were coded as positive for alcohol despite chemical tests to the contrary.
ii. For drivers without BAC test results, Padmanaban and Moffatt determined alcohol use from a variety of codes regarding police judgment of alcohol use or factors contributing to the crashes. When alcohol was not listed as a factor, alcohol use was coded as negative.
b. It is incorrect to assume that all of the drivers not tested were alcohol-free based on police not listing alcohol as a contributing factor to the crashes. According to Moskowitz et al. (1999), police most often cite breath odor in determining alcohol involvement in traffic offenses, but the ability to detect this odor is unreliable even under controlled laboratory conditions.
c. It is likely that reported alcohol use is spuriously related to injury outcome because more seriously injured people are more likely to undergo close examination. About half of the states included in the IIHS study mandate BAC testing of fatally injured drivers (NHTSA, 2004), creating inherent reporting bias because the likelihood of testing is correlated with injury outcome. Padmanaban and Moffatt do not report or account for this bias.
d. It is likely that factors such as crash severity, vehicle damage, and driver age and gender have some influence on whom police choose to test for alcohol as well as which crashes they judge to be influenced by alcohol. Previous research has found that driver age and gender affect which drivers at sobriety checkpoints are judged not drinking (Wells et al., 1997).
e. Although alcohol clearly increases crash likelihood, Padmanaban and Moffatt offer no explanation of how alcohol increases the likelihood of K/A injury, given that a crash already has occurred. Absent convincing evidence that alcohol increases the susceptibility of human tissue and bones to injury, the primary determinants of whether an injury occurs to alcohol-impaired or sober occupants are the forces experienced during the crash. It might be argued that sober drivers’ rollover crashes would be more severe, and their injurious forces greater, than those of drinking drivers because more extreme circumstances would be required for the sober drivers to lose control of their vehicles or leave the road. But this argument leads to the opposite of the effect claimed by Padmanaban and Moffatt. Any empirical relationship to the contrary observed between alcohol and K/A injury likelihood is likely to be spurious and related to the absence of objective evidence of alcohol involvement after a crash has occurred.
4. Padmanaban and Moffatt’s docket submission is based on unsound and inconsistent statistical treatment. It contains numerous misstatements and omissions that undermine its conclusions.
a. They either misunderstand or misconstrue the fundamental concepts of statistical estimation and significance testing. The object of a study of roof strength is to obtain the best estimate permitted by the data. In this context, statistical significance is only a way of representing how often one expects to be wrong in concluding that the observed estimate is indicative of a real non-zero effect. Padmanaban and Moffatt claim that if the estimated effect of roof strength on injury risk is found to be “not significant, then the lives saved [by strengthening roofs] could just as well be

Nicole Nason May 13, 2008 Attachment – page 4
zero or negative” (pg. 2). This trivializes the process of statistical estimation in a way that is fundamentally misleading.
i. It is misleading to treat any estimate with a p-value slightly above 0.05 as if it were drastically different from estimates with p-values slightly below 0.05. For example, among the effects estimated for reductions in the likelihood of driver death with increased roof strength, the p-value for SWR within 5 inches of crush was slightly greater than 0.06. This means that if one were to conclude that an effect this large is different from zero, one would expect to be wrong about 6 times out of 100 (a p-value of 0.05 would lower the error risk only slightly, to 5 times in 100). This 6 percent error risk also means that the likelihood of seeing effects as large as that estimated for roof strength when the true effect is zero or negative is only about 3 in 100. Padmanaban and Moffatt misrepresent the logic of statistical estimation and misconstrue the implications of significance testing.
ii. This illogical approach leads them to ignore the overwhelming consistency of the results of the IIHS study. Their docket submission suggests that a single IIHS estimate for injury risk reduction that was not significant at the 0.05 level contradicts and invalidates the overall finding that stronger roofs reduce injury risk. Of the 12 estimates for K/A injury risk related to roof strength measured in 4 different ways and at 3 different crush distances, all were significant at p<0.0001. For the 12 estimates for K injury risk, 9 were significant at p<0.0001, 2 at p<0.05, and 1 at p<0.07. Robustness of an empirical pattern when measured in different ways is much more important than the fact that 1 of 24 tests did not meet an arbitrary level of p<0.05.
b. The docket submission does not include sample sizes for any of Padmanaban and Moffatt’s 7 statistical models. In response to subsequent requests by IIHS, they indicated sample sizes ranging from 1,352 to 20,010. These details should have been included in the discussion of their statistical modeling, especially given their ill-advised reliance on levels of statistical significance for interpretation of results. For example, they emphasize that odds ratios in the IIHS study were not statistically significant for the subset of drivers that police coded as unbelted, asserting that this means roof strength is not beneficial for these occupants. However, these drivers account for only 10 percent of the total sample, limiting the power to detect statistically significant effects.
c. Padmanaban and Moffatt do not give parameter estimates for the predictors of injury risk they chose to include in their comment. Without these, it is unknown whether the effects being estimated by their models are consistent or realistic relative to some underlying reasonable theory. Subsequent IIHS inquiries produced some, but not all, of the parameter estimates (see item 5.a.i. below).
d. Padmanaban and Moffatt do not present p-values for their additional parameters in the model that looked at fatality risk, saying only that roof SWR was not significant at a p-value of 0.10. It is possible that some variables previously claimed to be major factors (alcohol, belt use, ejection status) in injury outcome were not significant in this model.
5. Padmanaban and Moffatt’s docket submission is based on questionable engineering judgment.
a. They stress the importance of aspect ratio (height divided by track width) in previous research and criticize IIHS for excluding it. In their reproduction of the IIHS study, they find it statistically significant. This is problematic for 4 reasons:

Nicole Nason May 13, 2008 Attachment – page 5
i. Based on data provided to IIHS, their models predict greater injury risk in SUVs with larger aspect ratios. This directly contradicts their previous studies, which reported decreased injury risk for vehicles with larger aspect ratios. Padmanaban and Moffatt do not explain or even disclose this fact in their submission to NHTSA.
ii. They do not offer a hypothesis for how the shape of these SUVs, as defined by aspect ratio, would affect injury risk. This also is true of their previous research, although they have stated that it is unrelated to differences in headroom. If the small geometric differences between these midsize SUVs are important in the rollover crash dynamics, more meaningful measurements would include maximum vehicle width or vehicle width at the height of the roof.
iii. The range of aspect ratios given for these vehicles is very small. Height and track width vary by up to only about 2 inches.
iv. There is enough variation in the specified height and track width measurements between model years of several of the study vehicles to invalidate whatever data were used.
b. Padmanaban and Moffatt do not seem to understand the IIHS motivation for including static stability factor (SSF) in the statistical models, stating that “the purpose of the IIHS study and of ours was to evaluate the likelihood of serious/fatal injuries given a rollover and not the likelihood of rollovers.” The IIHS study clearly explains why SSF may be correlated to crash severity: By definition, more stable vehicles require more severe events to cause them to roll over.
c. Padmanaban and Moffatt do not explain why vehicle weight should be included in two different places in their statistical models. They include it both as an independent variable and in the calculation of SWR.
6. Padmanaban and Moffatt misrepresent the IIHS study.
a. They say they “agree [with the IIHS study] that SWR within 5 inches is the most useful and universally accepted roof strength metric,” but the IIHS study makes no such claim. Its calculations of lives saved use this metric simply because FMVSS 216 uses the same metric. SWR within 5 inches of plate displacement is 1 of 12 roof strength metrics IIHS evaluated, and several of the other metrics predict greater reductions in injury risk across the range of tested vehicles. Even with their problematic predictors, it is possible that Padmanaban and Moffatt would have found statistically significant results with different roof strength metrics.
b. Padmanaban and Moffatt claim that the regression line in Figure 1 of the IIHS study is the “primary finding” and later in their submission to NHTSA dedicate much time to discussing this line. However, they separately state their understanding that the plot is included “solely to present a visual representation of their raw data. [IIHS does] not rely upon it in any way for their conclusions.” This second statement is correct, and it is disingenuous to criticize the statistical fit of a plot presented for visualization and understood to be uncorrected for known confounding factors.
c. They claim IIHS used the estimate for the reduction of fatal and incapacitating injury in the lives-saved calculations because the fatality estimate alone was not statistically significant (see items 4.a.i. and 4.a.ii. above). However, the former estimate was used because it is based on more observations (of injuries) and therefore likely to be more accurate. For the other 11 roof strength

Nicole Nason May 13, 2008 Attachment – page 6
metrics, little variation was observed between effect estimates for K/A injury and for fatal injury, so the choice was well founded.
d. Padmanaban and Moffatt say their analysis does not “differ significantly from [IIHS] raw data counts” but do not give any details. Responses to subsequent requests from IIHS indicate their analysis includes 2,807 fewer drivers overall and 100 more drivers with fatal or incapacitating injuries. These differences are not explained. Padmanaban and Moffatt fail to demonstrate that their data and analysis replicate the IIHS study before including additional predictor variables. If their initial analysis cannot replicate IIHS’s, then none of their subsequent claims are applicable to the current discussion.
7. Padmanaban and Moffatt’s docket submission and associated analysis cannot be fully evaluated due to the lack of detailed information about data sources, methods, and results.
In contrast, IIHS methods and findings are fully described in the study. IIHS staff further assisted JP Research in understanding the construction of the statistical models used in the study. All information necessary to reconstruct the IIHS study is available to the public.
a. For some additional predictor variables, unexplained discrepancies exist between the data counts in the state files and the counts JP Research reported to IIHS. For example, JP Research reports that ejection status was known for all but 2,198 drivers, whereas IIHS observed that ejection status was coded as unknown or completely missing for 8,713 drivers in the state data files. It would be useful to know how JP Research obtained the ejection status for their analyses.
b. The docket submission includes statements about the methods used in their two previous studies that were not disclosed in that research. For example, the submission claims that both earlier studies controlled for ejection and rural/urban land use, but their 2005 study mentions neither among the factors included in the logistic regression models. The docket comment says “all our previous models also controlled for states, though it was not explicitly stated in the reports” (pg. 3). It is impossible to judge the credibility of any study when important details are omitted about how the research was conducted.
c. Padmanaban and Moffatt report access to the results of other roof strength tests of the IIHS study vehicles that differ substantially from the IIHS results. These other results are not public, so it is impossible to determine their relevance. Previous research by Padmanaban and Moffatt included confidential tests conducted by vehicle manufacturers on non-production vehicles (Moffatt and Padmanaban, 1995; Padmanaban et al., 2005), and we do not know the nature of any additional test data on IIHS study vehicles.
d. As detailed above, Padmanaban and Moffatt exclude several important facts that were revealed to IIHS only after follow-up inquiries to JP Research (see items 3.a., 4.b., 4.c., 5.a.i., 6.d., and 7.a.).

Nicole Nason May 13, 2008 Appendix A
Appendix A – Relationship between roof strength and ejection risk
To address Padmanaban and Moffatt’s claim that ejection is “likely to be unrelated to roof strength,” IIHS conducted a logistic regression analysis of ejection likelihood based on roof strength. Vehicle and crash data were the same as in IIHS’s analysis of vehicle roof strength and injury risk (Brumbelow et al., 2008). Figure 1 shows the relationship in the raw data between peak roof SWR within 5 inches of plate displacement and ejection rate before adjusting for any potentially confounding factors. Of 22,817 rollover crashes of study vehicles, police coded 13,086 drivers as not ejected, 1,018 as fully or partially ejected, and the rest were coded as unknown or had missing values. Only the drivers with known ejection status were included in this analysis. Table 1 presents results of the logistic regression model controlling for the effects of state, driver age, and vehicle SSF. For a 1-unit increase in peak SWR, ejection risk was reduced 32 percent. For each 10-year increase in driver age, there was an 11 percent decrease in ejection risk. Both of these results are statistically significant at the 0.05 level. An increase in SSF of 0.1 was predicted to increase ejection risk by 4 percent, but this result was not statistically significant at the 0.05 level.
Figure 1 – Rates of full or partial driver ejection by peak SWR within 5 inches of plate displacement
y = -0.023x + 0.118
0.00
0.02
0.04
0.06
0.08
0.10
0.12
0.14
1.4 1.6 1.8 2.0 2.2 2.4 2.6 2.8 3.0 3.2 3.4
Ejec
tion
rate
Peak SWR within 5 inches of plate displacement
Circle size represents number of rollover crashes with known ejection status
Table 1 – Results of logistic regression model for risk of ejection Parameter Odds ratio Roof SWR within 5 inches (1-unit increase) 0.68* Driver age (10-year increase) 0.89* SSF (0.1-unit increase) 1.04
*Statistically significant at 0.05 level

Nicole Nason May 13, 2008 Appendix B
Appendix B – Relationship between roof strength and injury risk for drivers coded as not ejected
The logistic regression model described in Appendix A demonstrates that reducing the risk of driver ejection is one benefit of stronger roofs. Also of interest is how stronger roofs benefit drivers who remain inside a vehicle during a rollover crash. Police coded 13,086 drivers in the IIHS study as not ejected. Figure 2 shows the relationship between the rate of fatal or incapacitating injury among the nonejected drivers and the peak roof SWR measured within 5 inches of plate displacement for each of the vehicles. The figure plots the raw data before adjusting for any confounding factors. Controlling for state effects, SSF, and driver age, a logistic regression model estimated a 27 percent reduction in the risk of fatal or incapacitating driver injury for a 1-unit increase in peak SWR within 5 inches of plate displacement. Nearly identical to the risk reduction estimated for all drivers in the IIHS study (see Table 2), this result is not surprising because nonejected drivers represent 93 percent of all drivers with known ejection status. A 10-year increase in driver age was predicted to increase the risk of K/A injury by 18 percent. A 0.1-unit increase in SSF was associated with a 6 percent increase in K/A injury risk. The odds ratios for SWR and driver age were significant at the 0.05 level, but the odds ratio for SSF was not.
Figure 2 – Rates of fatal or incapacitating driver injury by peak SWR within 5 inches of plate displacement
y = -0.018x + 0.133
0.00
0.02
0.04
0.06
0.08
0.10
0.12
0.14
0.16
0.18
0.20
1.4 1.6 1.8 2.0 2.2 2.4 2.6 2.8 3.0 3.2 3.4
Inju
ry ra
te
Peak SWR within 5 inches of plate displacement
Circle size represents number of rollover crashes with drivers coded nonejected
Table 2 – Results of logistic regression model for risk of fatal or incapacitating injuries for drivers coded as nonejected by police and for all drivers
Parameter Odds ratio for drivers coded as nonejected
Odds ratio forall drivers
Roof SWR within 5 inches (1-unit increase) 0.73* 0.72* Driver age (10-year increase) 1.18* 1.12* SSF (0.1-unit increase) 1.06 0.96
*Statistically significant at 0.05 level
Nicole Nason May 13, 2008 References
References
Brumbelow, M.L.; Teoh, E.R.; Zuby, D.S.; and McCartt, A.T. 2008. Roof strength and injury risk in rollover crashes. Arlington, VA: Insurance Institute for Highway Safety.
Insurance Institute for Highway Safety. 2008. Comment to the National Highway Traffic Safety Administration concerning proposed changes to Federal Motor Vehicle Safety Standard 216, Roof Crush Resistance; Docket No. NHTSA-2008-0015, March 27. Arlington, VA.
Moffatt, E.A. and Padmanaban, J. 1995. The relationship between vehicle roof strength and occupant injury in rollover crash data. Proceedings of the 39th Annual Conference of the Association for the Advancement of Automotive Medicine, 245-67. Des Plaines, IL: Association for the Advancement of Automotive Medicine.
Moskowitz, H.; Burns, M.; and Ferguson, S. 1999. Police officers’ detection of breath odors from alcohol ingestion. Accident Analysis and Prevention 31:175-80.
National Highway Traffic Safety Administration. 2004. State laws and practices for BAC testing and reporting drivers involved in fatal crashes. Report no. DOT HS-809-756. Washington, DC: US Department of Transportation.
National Highway Traffic Safety Administration. 2005. Connecticut’s day and night safety belt use. Report no. DOT HS-809-954. Washington, DC: US Department of Transportation.
National Highway Traffic Safety Administration. 2007. Daytime and nighttime seat belt use at selected sites in New Mexico. Report no. DOT HS-810-705. Washington, DC: US Department of Transportation.
Padmanaban, J. and Moffatt, E.A. 2008. Comment to the National Highway Traffic Safety Administration concerning proposed changes to Federal Motor Vehicle Safety Standard 216, Roof Crush Resistance; Docket No. NHTSA-2008-0015, March 27. Mountain View, CA.
Padmanaban, J; Moffatt, E. A.; and Marth, D.R. 2005. Factors influencing the likelihood of fatality and serious/fatal injury in single-vehicle rollover crashes. SAE Technical Paper Series 2005-01-0944. Warrendale, PA: Society of Automotive Engineers.
Schiff, M.A. and Cummings, P. 2004. Comparison of reporting of seat belt use by police and crash investigators: variation in agreement by injury severity. Accident Analysis and Prevention 36:961-65.
Wells, J.K.; Greene, M.A.; Foss, R.D.; Ferguson, S.A.; and Williams, A.F. 1997. Drinking drivers missed at sobriety checkpoints. Journal of Studies on Alcohol 58:513-17.

Vol. 43, No. 2, March 15, 2008
IN YOUR SUV, AND YOUWANT THE ROOF TO HOLDUP SO YOU’RE PROTECTED
from injury, including harm from the roof cavingin on you. Every passenger vehicle meets fed-
eral requirements for roof strength, measured ina test, and some exceed the requirements by sub-
stantial amounts. The question has been whetherstronger roofs actually reduce injury risk in real-
SR43_2:SR 43-2 3/3/08 3:05 PM Page 1

2 Status Report, Vol. 43, No. 2, March 15, 2008
world rollover crashes. Some studies have concluded that the strengthof a vehicle’s roof has little or no effect on the likelihood of injury, buta new Institute study indicates that roof strength definitely influencesinjury risk.
Researchers tested SUVs in a procedure similar to what the govern-ment requires automakers to conduct to assess roof strength and thenrelated the findings to the real-world death and injury experience of thesame SUVs in single-vehicle rollover crashes. The main finding is thatinjury risk went down as roof strength increased.
Injury rates vary considerably among vehicles in rollovers, andthere’s still a lot researchers don’t know about these crashes. Forexample, is injury risk primarily from the sudden crushing of the roof? Is it because people crash into the roof when the vehicle is upside down?Or does the main risk come from full or partial ejection of occupantswhen vehicle doors and windows break open during rollover crashes?
“We don’t know just what happens to people in these crashes orwhat the injury mechanisms are. What we do know from the new studyis that strengthening a vehicle’s roof reduces injury risk, and reducesit a lot,” says Institute president Adrian Lund.
Extent of the rollover problem: About 35 percent of all occupantdeaths occur in crashes in which vehicles roll over. This problem isworse in some kinds of vehicles than others. About 25 percent of occu-
pant deaths in crashes of cars and minivans involve rolling over. Theproportion jumps to 59 percent in SUVs.
Of course, the best way to prevent these deaths is to keep vehiclesfrom rolling over in the first place, and electronic stability control ishelping. It’s reducing rollover crashes, especially fatal single-vehicleones, by significant percentages.
“But until these crashes are reduced to zero, roof strengthwill remain an important aspect of occupant protection,”Lund points out.
What the US government requires: Federal MotorVehicle Safety Standard 216 establishes minimum roofstrength for passenger vehicles. Compliance testinginvolves the application of a metal plate to one sideof a roof at a constant speed. The roof must with-stand a force of 1.5 times the weight of the vehiclebefore reaching 5 inches of crush. Thus, a vehicleweighing 4,000 pounds has to withstand 6,000pounds of force while sustaining 5 or fewer inch-es of crush.
This requirement, in effect since 1973 forcars and 1994 for other passenger vehicles, isin the process of an upgrade. One of the gov-ernment’s main proposals, issued in 2005, is toboost the specified force to 2.5 times vehicleweight (see Status Report, Jan. 28, 2006; on theweb at iihs.org). Last month the governmentindicated it may consider further altering thestandard by testing both sides of vehicle roofsinstead of applying the force to one side only.When the changes were proposed in 2005, theInstitute voiced general support but noted the“surprising lack of evidence” connecting the re-quirements of the standard to real-world rollovercrash outcomes.
The new Institute study provides some missingevidence. Across 11 SUVs at 3 different degrees ofroof crush — 2, 5, and 10 inches — the strongest roofsare associated with injury risks 39 to 57 percent lowerthan the weakest roofs. Peak roof strength at 2 and 10inches of crush is more highly related to injury risk than at5 inches. Based on these findings, the researchers estimatethat if the roofs on every SUV the Institute tested were asstrong as the strongest one, about 212 of the 668 deaths thatoccurred in these SUVs in 2006 would have been prevented.
“These are big risk reductions, bigger than what the governmentor anybody else has established,” Lund says.
The researchers estimate that a 1-unit increase in peak strength-to-weight ratio — for example, from 1.5 times vehicle weight to 2.5, as thegovernment proposed in 2005 — reduces the risk of serious and fatalinjury in a rollover crash by 28 percent. Increasing roof strengthrequirements beyond 2.5 times vehicle weight would reduce injuryrisk even further.
IMPORTANCE OF ESC AND SIDE AIRBAGS
Vehicle roof strength is crucial to occupant protection in rollovercrashes. Other features are effective, too, in both preventing
such crashes in the first place and protecting people when theirvehicles do roll. Researchers estimate that electronic stabilitycontrol, or ESC, reduces the risk of a fatal single-vehicle rolloverby about 69 percent for all passenger vehicles and 72 percent
for SUVs in particular. Side curtain airbags are expected toreduce the risk of death in the rollovers that still occur.
“These technologies are essential,” Institute president Adrian Lund points out, “but electronic stability control doesn’t completely eliminate rollover crashes, and side airbags aren’tthe only protection occupants need if they do roll over. This is
why we have to pay attention to the roof. If a vehicle’s roof is strong enough to absorb the energy of a rollover without
caving in on its occupants, injury risk goes down.”
Electronic stability control monitors vehicle response to driversteering and applies the brakes on individual wheels to maintain
the path that’s indicated by the steering wheel position (seeStatus Report, June 13, 2006; on the web at iihs.org).
This technology is standard or optional on about two-thirds of all current passenger vehicle models. Side airbags are
standard or optional in about 80 percent.
SR43_2:SR 43-2 3/3/08 3:05 PM Page 2

The difference in roof strength was obvious whenthe Nissan Xterra and Ford Explorer, both 2000 models, weresubjected to a crushing force of up to 10,000 pounds. TheXterra’s roof crushed about 2 inches, and damage is hard-
ly visible except for a cracked windshield. Meanwhilethe Explorer’s roof crushed 10 inches, caving far
into the occupant compartment even beforereaching 10,000 pounds of force.
SR43_2:SR 43-2 3/3/08 3:05 PM Page 3

4 Status Report, Vol. 43, No. 2, March 15, 2008
New findings vs. previous studies: Before the Institute’s study,there was no conclusive evidence about the specific contribu-tion of a vehicle’s roof strength to occupant protection. Thegovernment estimated that proposed changes in federalroof strength requirements would save 13 to 44 livesper year.
“This was based on assumptions that wereconservative in the extreme,” Lund explains.“For example, the government assumed zerobenefit for unbelted occupants. We don’tknow exactly what the benefit of an upgrad-ed roof strength standard would be forthese occupants, but it would be likely toexceed zero.”
Meanwhile two studies sponsoredby automakers, one in 1995 and theother a decade later, found no relation-ship at all between roof strength andinjury risk in rollovers. Findings of thefirst study prompted General Motorsto tell The Detroit News in 2002, “Goodscience, long established and well re-viewed in the technical literature, hasconclusively demonstrated that there isno relationship between roof strengthand the likelihood of occupant injurygiven a rollover.” Four years later, Fordtold the government that “substantial andcompelling real-world crash data and labo-ratory testing have confirmed that simplyincreasing roof strength will not measurablyreduce the risk of injury or death to vehicle oc-cupants in rollovers.”
A main problem with these studies is that theyincluded all kinds of passenger vehicles with their sub-stantial differences in driver demographics, rolloverpropensity, and other factors that confound the results. Incontrast, the Institute’s new study focuses on one kind of vehi-cle, midsize 4-door SUVs, and tightly controls for other factors thatcould confound the results. While the findings are about a limited num-ber of SUVs, the researchers conclude that the overall finding ofreduced injury risk as roof strength increases would hold for otherkinds of vehicles, although the magnitude of the injury rate reductionmay differ among vehicle groups.
Lund adds that the findings “prompt us to expand our research onroof strength with an eye to supplying consumers with comparisons ofhow well vehicles protect people in rollover crashes. A dynamic testwith dummies instrumented to measure injury risk in rollovers wouldbe desirable, but there’s a sticking point. First we have to understandhow the movement of dummies in controlled tests could reflect howreal people move in real-world rollovers. Meanwhile, simpler roofstrength measurements could provide useful consumer information.”
Details of the study:The Institute study is atwo-part analysis involving ve-hicle testing and examination of the outcomes of real-world rollovercrashes. Eleven midsize 4-door SUVs were subjected to a test similar tothe one run by automakers to comply with federal roof strength require-ments (the manufacturers’ own test data aren’t public information). The11 SUVs exclude features that might affect injury rates in rollovers suchas side curtain airbags and electronic stability control (see p.2). To
The drivers of these SUVsdied when their vehicles over-
turned. It’s a big problem — more thanhalf of all occupant deaths in SUVs occur
in rollover crashes. New research indi-cates that strengthening vehicle roofs
would reduce this problem. If the roofon every SUV were as strong as the bestone the Institute tested, injury risk in roll-over crashes could be reduced 39 to 57 per-
cent. These are very big risk reductions, biggerthan the federal government or anybody
else has established.
SR43_2:SR 43-2 3/3/08 3:05 PM Page 4

Status Report, Vol. 43, No. 2, March 15, 2008 5
assess the range of roof strength among the SUVs, researchersapplied force to the roofs until crush reached 10 inches, meas-uring the peak force required for 2 inches of crush, 5 inches,and 10 inches. Because crush in a rollover can depend on vehi-cle weight as well as roof strength, the researchers calculatedstrength-to-weight ratios for each degree of crush. They alsomeasured the amount of energy absorbed by each roof at eachdegree of crush and, again taking vehicle weight into account,the height from which the vehicle would have to be droppedto produce equivalent energy absorption.
By almost any of these measures, the strongest roof was onthe 2000-04 Nissan Xterra while one of the weakest was on the1999-2004 Jeep Grand Cherokee. Within 5 inches of crush, theJeep withstood a force as high as 6,560 pounds, whichamounts to 1.64 times the weight of the 4-wheel-drive versionand 1.72 times the weight of the 2-wheel-drive. The correspond-ing figure for the Xterra was 11,996 pounds, or 2.93 times theweight of the 4-wheel-drive and 3.16 times the 2-wheel-drive.
Having established the range of roof strength among theSUVs, the researchers studied almost 23,000 real-worldrollovers of the same 11 SUVs during 1997-2005. This infor-mation was collected from 12 states with sufficient data onpolice-reported crashes to comply with study criteria.
Logistic regression was used to assess the effect of roofstrength on the likelihood of driver injury in the rollover crash-es of the 11 SUVs. The regression controlled for state-to-statedifferences in methods of reporting crashes, terrain, urbaniza-tion, etc.; vehicle stability; and driver age. Results indicate thevarious injury risks given the various SUV roof strengths.
“No matter what measurement of roof strength we usedor whether we measured at 2 or 5 or 10 inches of crush, wefound a consistent relationship between roof strength andinjury risk,” Lund points out.
The relationship between roof strength-to-weight ratio andinjury risk was stronger at 2 inches than at 5 inches, the crushspecified for testing under the federal standard (the govern-ment doesn’t require automakers to assess roof strength at 2or 10 inches). At 5 inches, the predicted injury risk for peoplein SUVs with roof strength-to-weight ratios as strong as theXterra’s would be 39 percent lower than for people in vehicleswith roof strength like the Grand Cherokee’s. At 2 inches ofcrush, the difference in predicted injury risk is 51 percent.
The 11 SUV designs in the study include the 1996-2004Chevrolet Blazer, 2002-05 Chevrolet TrailBlazer, 1998-2003 DodgeDurango, 1996-2001 Ford Explorer, 2002-04 Ford Explorer,1996-98 Jeep Grand Cherokee, 1999-2004 Jeep Grand Cher-okee, 2002-05 Jeep Liberty, 1997-2004 Mitsubishi MonteroSport, 2000-04 Nissan Xterra, and 1996-2000 Toyota 4Runner.
For a copy of “Relationship between roof strength and in-jury risk in rollover crashes” by M.L. Brumbelow et al., write:Publications, Insurance Institute for Highway Safety, 1005 N.Glebe Rd., Arlington, VA 22201, or email [email protected].
SR43_2:SR 43-2 3/3/08 3:05 PM Page 5

insurance claims for injuriesin all kinds of crashes. The an-nual cost of these claims ex-ceeds $8 billion annually.
While findings about real-world neck injury in vehicleseats rated good and poor areclear, those for seats ratedacceptable and marginal aren’tas clear. There wasn’t any re-duction in initial neck injurycomplaints for acceptableand marginal seats,comparedwith poor, though long-termneck injuries were reduced.
“The long-term injuriesare the very ones we want toreduce because they’re themost serious,” Zuby pointsout.“While many neck injuriesinvolve moderate discomfortthat goes away in a week or so,about one of every four initialcomplaints still was beingtreated three months later.These longer term injuriesinvolve more pain and costmore to treat. They’re be-ing reduced about one-third in vehicles with seat/head restraints ratedgood compared withpoor. Serious neck in-juries also are beingreduced in seats thatare rated acceptableor marginal.
Improvements:More and morepassenger vehi-cles are beingequipped withseats and headrestraints ratedgood. Whenthe Institutestarted eval-uating andcomparingthe geom-etry of thehead re-
6 Status Report, Vol. 43, No. 2, March 15, 2008
NECK INJURY RISK ISLOWER IF SEATS AND
HEAD RESTRAINTSARE RATED GOOD
The rate of neck injury complaints is 15 per-cent lower in cars and SUVs with seat/headrestraint combinations rated good comparedwith poor. The results for serious injuries aremore dramatic. Thirty-five percent fewerinsurance claims for neck injuries lasting 3months or more are filed for cars and SUVswith good seat/head restraints than for onesrated poor.
These are the main findings of a newInstitute study of thousands of insuranceclaims filed for damage to vehicles, all 2005-06 models, that were struck in front-into-rearimpacts. Conducted in cooperation withState Farm and Nationwide, the study is thefirst time seat/head restraint ratings basedon dynamic tests conducted by the Institutehave been compared with real-world neckinjury results.
“In stop and go traffic,you’re morelikely toget in a rear-end collision than any other kindof crash, so you’re more likely to need yourseat and head restraint than any other safetysystem in your vehicle,” says David Zuby, theInstitute’s senior vice president for vehicleresearch. “This is why it’s so important to fitvehicles with seats and head restraints thatearn good ratings for saving your neck.”
The Institute has been measuring and rat-ing head restraint geometry since 1995. Thehigher and closer a restraint is, the more like-ly it will be to prevent neck injury in a rearcollision. In 2004 the Institute added a dy-namic test simulating a rear crash to refinethe ratings. Vehicles are rated good, accept-able, marginal, or poor based on both re-straint geometry and test results (see StatusReport, Nov. 20, 2004; on the web at iihs.org).The same rating system is used internation-ally by a consortium of insurer-sponsoredorganizations, the International InsuranceWhiplash Prevention Group.
An estimated 4 million rear collisions occureach year in the United States. Neck sprain orstrain is the most serious injury in one-third of
These vehicles didn’t sustain a lot of damage when they werestruck from behind, but the driverswere treated for injuries suffered in the impacts. Neck sprains andstrains are the most serious problemsreported in about 1 of 3 insuranceclaims for injuries. This problemcould be reduced by equipping vehicles with seat/head restraintsrated good, based on Institute tests.Twenty-nine of all recent model cars and 22 perent of other passenger vehicles have systems rated good for protection against neck injury.
SR43_2:SR 43-2 3/3/08 3:05 PM Page 6

straints in 1995model cars, only ahandful were rated goodand 80 percent were poor. Thenthe automakers responded, and by 2004 about4 of every 5 head restraints had good or ac-ceptable geometry (see Status Report, Nov. 20,2004; on the web at iihs.org). Similarly, thedynamic performance of seat/head restraintcombinations is improving. Only 12 percent of2004 model cars had combinations ratedgood, but by the 2007 model year the propor-tion had increased to 29 percent (see StatusReport, Aug. 4, 2007; on the web at iihs.org).
These improvements are being driven notonly by ratings of seat/head restraints pub-lished by the Institute and other insurer-sponsored groups but also by a US standardthat will require the restraints to extendhigher and fit closer to the backs of people’sheads by the 2009 model year. In the UnitedStates, automakers also have been spurredby the Institute’s TOP SAFETY PICK award.To win this designation, a vehicle has to earngood ratings in all three tests — front, side,and rear.
How the injuries occur: When a vehicle isstruck in the rear and driven forward, its seatsaccelerate occupants’ torsos forward. Unsup-ported, an occupant’s head will lag behind
this forward torso movement, andthe differential motion causes
the neck to bend and stretch.The higher the torso accel-eration, the more suddenthe motion, the higher theforces on the neck, andthe more likely a neck in-
jury is to occur. Factors that influence
neck injury risk include genderand seating position in addition tothe designs of seats and head re-
straints. Women are more likelythan men to incur neck injuries
in rear crashes, and front-seatoccupants, especially drivers,are more likely to incur suchinjuries than people riding inback seats.
The key to reducing whip-lash injury risk is to keep an
occupant’s head and torso mov-ing together. To accomplish this, the
geometry of a head restraint has to beadequate — high enough and near the backof the head. Then the seat structure and stiff-ness must be designed to work in concertwith the head restraint to support an occu-pant’s neck and head, accelerating them withthe torso as the vehicle is pushed forward.
About the study: To correlate seat/headrestraint ratings with real-world neck injuryrisk, researchers studied about 3,000 insur-ance claims associated with rear crashes of105 of the 175 passenger vehicles (2005-06models) for which the Institute has ratingsbased on both restraint geometry and seatperformance in dynamic tests. The claimswere filed with State Farm Mutual Insuranceand Nationwide Insurance, which togetheraccount for more than 20 percent of the per-sonal auto insurance premiums paid in theUnited States in 2005. The researchers mod-eled the odds of a neck injury occurring in arear-struck vehicle as a function of seat rat-ings (good, acceptable, marginal, or poor),while controlling for other factors that also
affect neck injury risk, such as vehicle sizeand type and occupant age and gender.
The percentage of rear-struck drivers withneck injury claims was 16.2 in vehicles withseats rated good, based on dynamic testing.Corresponding percentages were 21.1 forseats rated acceptable, 17.7 for marginalseats, and 19.2 for poor ones. Neck injurieslasting 3 months or more were reported by 3.8percent of drivers in good seats, 4.7 percent inacceptable seats, 3.6 percent in marginalseats, and 5.8 percent in seats rated poor.
“What these data show is that we’re push-ing seat designs in the right direction,” Zubysays, “Results for acceptable and marginalseats weren’t as clear as for good seats. Initialneck injury claims weren’t significantly lowerthan for poor seats. Still we saw reductions inclaims for serious neck injuries in acceptableand marginal seats as well as in good ones.”
This is the third study the Institute hasconducted that indicates the superiority ofseat/head restraint combinations rated goodfor reducing neck injury risk. In 1999 the In-stitute found that head restraints rated good
Status Report, Vol. 43, No. 2, March 15, 2008 7
The key to reducingwhiplash is to keepoccupants’ heads andtorsos moving forwardtogether when theirvehicles are struck from behind. for geometry alone had lower insuranceclaims for neck injuries. In 2003 Institute re-searchers expanded the data, finding thatmodern features such as head restraints thatautomatically adjust in rear-end collisionsand seats that absorb energy also reduceinsurance claims.
For a copy of “Relationship of dynamicseat ratings to real-world neck injury rates”by C.F. Farmer et al., write: Publications, In-surance Institute for Highway Safety, 1005 N.Glebe Rd., Arlington, VA 22201, or email [email protected].
SR43_2:SR 43-2 3/3/08 3:05 PM Page 7

NON-PROFIT ORG.U.S. POSTAGE
PAIDPERMIT NO. 252ARLINGTON, VA
21st Century InsuranceAAA Mid-Atlantic Insurance GroupAffirmative InsuranceAIG Agency AutoAIG DirectAlfa InsuranceAlfa Alliance Insurance CorporationAllstate Insurance GroupAmerican Family Mutual InsuranceAmerican National Property and CasualtyAmeriprise Auto & HomeAmerisure InsuranceAmica Mutual Insurance CompanyAuto Club GroupAuto Club South Insurance CompanyBituminous Insurance CompaniesBristol West InsuranceBrotherhood MutualCalifornia State Automobile AssociationCapital Insurance GroupChubb Group of Insurance CompaniesConcord Group Insurance CompaniesCotton States InsuranceCOUNTRY Insurance & Financial ServicesCountrywide Insurance GroupErie Insurance Group
Contents may be republished with attribution. This publication is printed on recycled paper.
EsuranceFarm Bureau Financial ServicesFarm Bureau Mutual Insurance Company of IdahoFarmers Insurance Group of CompaniesFarmers Mutual of NebraskaFlorida Farm Bureau Insurance CompaniesFrankenmuth InsuranceThe GEICO GroupGainscoGeneral Casualty Insurance CompaniesGMAC InsuranceGrange InsuranceThe Hartford Hanover Insurance GroupHigh Point Insurance GroupHomeowners of AmericaICW GroupIndiana Farm Bureau InsuranceKemper, a Unitrin BusinessKentucky Farm Bureau InsuranceLiberty MutualThe Main Street America GroupMarkel CorporationMercury Insurance GroupMetLife Auto & HomeMichigan Insurance CompanyMiddleOakMMG InsuranceMutual of Enumclaw Insurance CompanyNationwide InsuranceN.C. Farm Bureau Mutual Insurance CompanyNodak Mutual Insurance
Norfolk & Dedham GroupOhio Casualty GroupOklahoma Farm Bureau Mutual Insurance CompanyOregon Mutual InsurancePalisades InsurancePekin InsurancePEMCO InsuranceThe Progressive CorporationResponse InsuranceRockingham Group Safeco InsuranceSamsung Fire & Marine Insurance CompanyS.C. Farm Bureau Mutual Insurance CompanySECURA InsuranceShelter InsuranceSompo Japan Insurance Company of AmericaState Auto Insurance CompaniesState Farm InsuranceTennessee Farmers Mutual Insurance CompanyTokio Marine NichidoThe Travelers CompaniesUnitrinUSAAVirginia Farm Bureau Mutual InsuranceWest Bend Mutual Insurance CompanyZurich North America
FUNDING ASSOCIATIONSAmerican Insurance AssociationNational Association of Mutual Insurance CompaniesProperty Casualty Insurers Association of America
The Insurance Institute for Highway Safety is a nonprofit scientific and educational organization dedicated to reducing deaths, injuries, and property damage from crashes on the nation’s highways. The Institute is wholly supported by auto insurers:
1005 N. Glebe Rd., Arlington, VA 22201 Phone 703/247-1500 Fax 247-1588Internet: www.iihs.orgVol. 43, No. 2, March 15, 2008
Strength of the roofs on SUVs influences the risk ofoccupant injury in rollover crashes, new Institutestudy finds .................................................................1
ESC helps keep vehicles from rolling over, andside airbags protect people in the rollovercrashes that still occur .....................................2
Demonstration of strong vs. weak roofsshows why roof strength matters ....................3
Rollovers in which drivers died demonstrateneed for strong roofs on SUVs ............................4
Seat/head restraints that earn good ratings, basedon dynamic tests, reduce neck injury risk among driv-ers of rear-struck vehicles .............................................6
SR43_2:SR 43-2 3/3/08 3:05 PM Page 8