ii ii i i i - cca | completed assessments
TRANSCRIPT

Science Advice in the Public Interest
Preliminary Data UPDate on CanaDian researCh PerformanCe anD international rePUtation

ii Preliminary Data Update on Canadian Research Performance and International Reputation
THE COUNCIL OF CANADIAN ACADEMIES 180 Elgin Street, Suite 1401, Ottawa, ON, Canada K2P 2K3
Notice: The project that is the subject of this preliminary data update was undertaken with the approval of the Board of Governors of the Council of Canadian Academies. Board members are drawn from the Royal Society of Canada (RSC), the Canadian Academy of Engineering (CAE), and the Canadian Academy of Health Sciences (CAHS), as well as from the general public. The members of the expert panel responsible for the report were selected by the CCA for their special competencies and with regard for appropriate balance.
This data update was prepared for the Government of Canada. Any opinions, findings, or conclusions expressed in this publication are those of the Council of Canadian Academies and do not necessarily represent the views of the sponsoring organization, Innovation, Science and Economic Development Canada.
This data update should be cited as: Council of Canadian Academies, 2016. Preliminary Data Update on Canadian Research Performance and International Reputation. Ottawa (ON): Council of Canadian Academies.
Disclaimer: The internet data and information referenced in this report were correct, to the best of the CCA’s knowledge, at the time of publication. Due to the dynamic nature of the internet, resources that are free and publicly available may subsequently require a fee or restrict access, and the location of items may change as menus and webpages are reorganized.
© 2016 Council of Canadian Academies
Printed in Ottawa, Canada
This project was made possible with the support of the Governement of Canada

iiiThe Expert Panel on the State of Science and Technology and Industrial Research and Developpement in Canada
The Expert Panel on the State of Science and Technology and Industrial Research and Development in Canada
Max Blouw, Chair, President and Vice-Chancellor of Wilfrid Laurier University (Waterloo, ON)
Luis Barreto, President, Dr. Luis Barreto & Associates and Special Advisor, NEOMED-LABS (Concord, ON)
Catherine Beaudry, Professor, Economics of Innovation and Canada Research Chair in Creation, Development and Commercialization of Innovation, Department of Mathematical and Industrial Engineering, Polytechnique Montréal (Montréal, QC)
Donald Brooks, FCAHS, Professor, Pathology and Laboratory Medicine, and Chemistry, University of British Columbia (Vancouver, BC)
Madeleine Jean, General Manager, Prompt (Montréal, QC)
Philip Jessop, FRSC, Professor, Inorganic Chemistry and Canada Research Chair in Green Chemistry, Department of Chemistry, Queen’s University; Technical Director, GreenCentre Canada (Kingston, ON)
Claude Lajeunesse, FCAE, Corporate Director and Interim Chair of the Board of Directors, Atomic Energy of Canada Ltd. (Magog, QC)
Steve Liang, Associate Professor, Geomatics Engineering, University of Calgary; Director, GeoSensorWeb Laboratory; CEO, SensorUp Inc. (Calgary, AB)
Robert Luke, Vice-President, Research and Innovation, OCAD University (Toronto, ON)
Douglas Peers, Professor, Dean of Arts, Department of History, University of Waterloo (Waterloo, ON)
John M. Thompson, O.C., FCAE, Retired Executive Vice-Chairman, IBM Corporation (Toronto, ON)
Anne Whitelaw, Vice Provost, Planning and Positioning and Associate Professor, Department of Art History, Concordia University (Montréal, QC)
David A. Wolfe, Professor, Political Science and Co-Director, Innovation Policy Lab, Munk School of Global Affairs, University of Toronto (Toronto, ON)
Data Update Review
This data update was reviewed in draft form by the individuals listed below. The reviewers assess the objectivity and quality of the data update. Their submissions will remain confidential. They were not asked to endorse the conclusions, nor did they see the final draft of the data update before its release. Responsibility for the final content of this data update rests entirely with the authoring expert panel and the CCA.
The CCA wishes to thank the following individuals for their review of this data update:
Linda Butler, School Visitor, Australian National University (Canberra, Australia)
Susan A. McDaniel, FRSC, Director, Prentice Institute; Canada Research Chair (Tier 1) in Global Population and Life Course; Prentice Research Chair in Global Population and Economy; Professor of Sociology, University of Lethbridge (Lethbridge, AB)
Eliot A. Phillipson, O.C., FCAHS, Sir John and Lady Eaton Professor of Medicine Emeritus, University of Toronto (Toronto, ON); Former President and CEO, Canada Foundation for Innovation (Ottawa, ON)
Project Staff of the Council of Canadian Academies
Assessment Team:
Emmanuel Mongin, Project DirectorR. Dane Berry, Research AssociateWeronika Zych, Project CoordinatorAaron Maxwell, Intern
With assistance from:
Clare Walker, EditorFrançois Abraham, Certified Translator, Communications Léon Inc., translation English-French
Marc Dufresne, Report Design

iv Preliminary Data Update on Canadian Research Performance and International Reputation
Message from the Chair
This report comes at a pivotal moment for Canadian research, development, and innovation (R-D-I). Our federal government recently reaffirmed its commitment to these vitally important foundational activities — both as a means to building a prosperous and innovative society, and as a basis for effective public policy. Two initiatives are underway that could shape the course of R-D-I in Canada for years to come. First, the government is undertaking a comprehensive review of federal support for fundamental science in Canada. Second, it is developing an Innovation Agenda with potentially far-reaching implications for social, cultural, and economic prosperity.
I have the privilege of being asked by the Council of Canadian Academies to chair an expert panel tasked with assessing the state of science & technology and industrial research & development (i.e., R-D-I) in Canada. Formed at the request of the Minister of Science in 2016, the final product of our deliberations is not expected until Fall 2017.
Some opportunities to inform public policy, however, are too important to be missed. Early in our process, the Panel concluded that we have a responsibility to help inform the work of the ongoing Fundamental Science Review Panel and related federal initiatives to the best of our ability. To this end, we are releasing this preliminary data update. It provides an early window into some of the data we are using to explore the state of R-D-I in Canada. Our intention is to provide timely access to a body of evidence on Canada’s research performance that may serve as an important input to ongoing federal R-D-I policy development.
A note of caution, however, is warranted. This data update is preliminary and, for that reason, it does not evaluate Canada’s specific research strengths. The data presented here will be subject to further contextualization, review, and analysis by the Panel over the coming year. They will also be supplemented with data from additional sources as the scope of our inquiry broadens. The Panel’s final conclusions will be based on the entire body of evidence that we review. In this preliminary work, we have tried to avoid imparting what might be premature interpretations. Instead, we provide an update of basic evidence from an analysis of research publications and opinion from international research leaders.
It is an honour to serve as Chair of this Panel. I would like to thank Innovation, Science, and Economic Development Canada, and the Council of Canadian Academies, for making this work possible and also Science-Metrix and EKOS Research for their key roles in gathering the data. Finally, I would like to thank my fellow Panel members for their efforts to date, and for those efforts yet to come. I look forward to continuing our dialogue and assessment of these important subjects over the coming year.
Sincerely,
Max Blouw, Chair

vPurpose and Overview
Purpose and Overview
This document contains a preliminary update of key bibliometric and opinion survey data comparable to that published in the 2012 Council of Canadian Academies assessment of the state of science and technology in Canada. This data update is part of a larger exercise to assess the state of research, development, and innovation in Canada. The purpose of the preliminary data release is to support ongoing efforts to inform federal science policy, such as those of the current Fundamental Science Review Panel. It does not identify Canada’s research strengths, as was done in the full 2012 report. The data presented will be subject to further review and analysis by this Expert Panel over the course of the next year. These data, as well as additional evidence on research performance, research and development expenditures, patents, highly qualified personnel, and business innovation, will inform the conclusions of the Panel’s final report, expected to be published in Fall 2017.
Data Highlights
Research Output and Collaboration•Canada ranks ninth in the world in research publication
output and accounts for 3.8% of the world’s output. •Canada’s research output is growing at a rate comparable
to that exhibited by most developed countries. Developed countries, however, are increasingly being overshadowed by the dramatic growth in research production in China and other emerging economies over the past decade.
•Canadian researchers continue to be highly collaborative internationally, working with international co-authors in nearly 46% of their publications.
Research Impact•Citation-based indicators show that Canadian research
continues to have relatively high levels of impact. By ARC score, Canada ranks sixth out of leading countries: its research is cited 43% more than the world average across all fields of study.
•The impact of Canada’s research, as reflected in citations (ARC, MRC, and HCP1%), has increased in recent years. However, these increases have been often matched or exceeded by other countries. Canada’s rank by ARC declined slightly in many fields as a result.
International Reputation and Stature•Canada’s research contributions continue to be well
regarded internationally according to a survey of top-cited researchers around the world. The share of top-cited researchers who rate Canada’s research as strong in their field of study rose from 68% in 2012 to 72% in 2016.
•Approximately 36% of surveyed top-cited researchers identify Canada as one of the top five countries in their research fields. As a result, Canada ranks fourth overall, behind the United States, United Kingdom, and Germany.
•The share of top-cited researchers who have worked or studied in Canada, or collaborated with Canadians, has increased since 2012.
Data by Field of Research• Preliminary analysis of Canadian research by field reveals
patterns similar to those presented in the 2012 S&T report. •All fields of research in Canada were cited at rates above
the world average in 2009–2014. Few fields in Canada have experienced major shifts in output or impact in recent years, though the specialization rate of Clinical Medicine gradually increased and that of Engineering decreased relative to other countries.
• Fields in which Canada has both a relatively high degree of specialization and a high impact (above the G7 average) include Clinical Medicine; Biology; Information and Communication Technologies; Agriculture, Fisheries and Forestry; Earth and Environmental Sciences; and Economics and Business.
•Canada’s research contributions in Physics and Astronomy continue to be highly cited despite a lower publication output than might be expected. Chemistry and Enabling and Strategic Technologies (Energy, Biotechnology, Bioinformatics, Nanoscience and Nanotechnology, Optoelectronics and Photonics) are other areas in which Canada’s research output is low relative to other countries.
•When analyzed by field of study, results from the international survey of top-cited researchers are consistent with those from the 2012 survey. Canada continues to rank among the top five countries in three-quarters of fields.
•Canada’s research reputation is the weakest in core fields of the natural sciences such as Mathematics and Statistics, Physics and Astronomy, Chemistry, Engineering, and in Enabling and Strategic Technologies.

vi Preliminary Data Update on Canadian Research Performance and International Reputation
Table of Contents
1 Introduction and Background ............................................... 1
2 Methodology, Data, and Limitations ................................... 22.1 Bibliometric Analysis .......................................................................22.2 International Survey of Top-Cited Researchers ..............................4
3 Canada’s Research Productivity ............................................. 53.1 Overall Research Output and Output Growth ...............................53.2 Research Output by Field ................................................................83.3 Global Research Collaboration .....................................................11
4 Canada’s Research Impact .................................................... 134.1 Overall Research Impact ...............................................................134.2 Research Impact by Field .............................................................164.3 Synthesizing Research Output and Impact ...................................18
5 Overview of the Canadian Regional Landscape ................. 205.1 Research Output and Impact by Province/Territory ...................205.2 Research Output and Impact by Field, by Province/Territory ....215.3 Interprovincial and International Collaborations ........................22
6 International Perceptions of Canadian Research ............... 236.1 Canada’s Overall Research Reputation .........................................236.2 International Reputation by Field of Study ..................................256.3 Researcher Familiarity with Canada ..............................................25
References ...................................................................................... 27

1Introduction and Background
1 Introduction and Background
In 2012, in response to a request from the Minister of Industry, the Council of Canadian Academies (CCA) published The State of Science and Technology in Canada, 2012 (“the 2012 S&T report”) (CCA, 2012a). This assessment provided a snapshot in time of Canadian S&T, building on the CCA’s 2006 inaugural S&T report. In this context, S&T is understood as encompassing all fields of research and technology development, including the natural sciences and mathematics, the health sciences, engineering, the social sciences, and the humanities and arts. Drawing on a range of evidence sources, including bibliometric and survey data, the 2012 analysis found that Canada’s S&T is highly competitive internationally, particularly among the six fields of research in which Canada excels: Clinical Medicine, Historical Studies, Information and Communication Technologies, Psychology and Cognitive Sciences, Physics and Astronomy, and Visual and Performing Arts (CCA, 2012a). In addition, in 2012, the Minister of Industry asked the CCA to respond to a question on the state of industrial research and development (i.e., R&D performed by the private sector) in Canada, which resulted in the release of The State of Industrial R&D in Canada in 2013 (“the 2013 IR&D report”) (CCA, 2013).
In June 2016, the Minister of Science asked the CCA to update its previous assessments on S&T and industrial R&D, combining the charges addressed in 2012 and 2013. To respond to the new charge, which encompasses the topics of research, development, and innovation in Canada, the CCA convened an expert panel (the Panel), which initially met in October 2016. Over the course of the next year, the Panel will hold a series of meetings and review a wide range of evidence on research, development, and innovation in Canada. The final report is expected to be released in Fall 2017.
In the interim, this preliminary data update provides a high-level overview of key research trends in Canada, drawing on bibliometric and survey evidence similar to that examined in the 2012 S&T report. The data are presented in a format consistent with that of the 2012 report with relatively minimal interpretation or commentary. The Panel is providing this update early in its process to inform ongoing policy development efforts related to federal science and innovation policy such as the current Fundamental Science Review Panel and consultations for a new federal Innovation Agenda. The data contained here illuminate key trends related to national research performance. Providing timely access to this data was viewed as critical to ensure that the federal government and the scientific community fully benefit from the evidence being developed, analyzed, and reviewed by the Panel.
The data presented in this document are preliminary. They pertain only to indicators featured in the 2012 S&T report and do not include data on industrial R&D. This update does not identify Canada’s S&T strengths as was done in the 2012 S&T report. Over the next year, the Panel will review additional data on research performance, R&D expenditures, patents, highly qualified personnel, and business innovation to fully respond to its charge. The Panel’s final report will incorporate these additional data sources and assess their collective implications for the current state of research, development, and innovation in Canada.

2 Preliminary Data Update on Canadian Research Performance and International Reputation
2 Methodology, Data, and Limitations
This data update presents evidence from two main sources: a bibliometric assessment of Canada’s academic publications and an international survey of top-cited researchers.
2.1 BIBLIOMETRIC ANALYSIS
Building on the 2012 S&T report, the CCA commissioned a comprehensive analysis of Canada’s research publications for 2003–2014. The data were extracted from Elsevier’s Scopus database and analyzed by Science-Metrix in July-August 2016. Scopus was selected as the source of data due to its extensive coverage of publications in the social sciences and humanities, including book chapters and book series.1 The analysis was based on a taxonomy of research fields developed by Science-Metrix, consisting of 22 fields and 176 sub-fields.2 To identify trends over time, the analysis was also designed to be comparable to that undertaken for the 2012 report. It relies on the same data source, the same taxonomy of fields and sub-fields, and many of the same indicators, though data for some new indicators were also developed. Table 2.1 describes key bibliometric indicators used in this data update.
Bibliometric data are a standard source of information on research performance and, at the level of nationally aggregated research fields and sub-fields, many bibliometric indicators are sufficiently reliable to provide useful insights.3 At the same time, bibliometric data and analysis are subject to well-documented limitations (CCA, 2012b).
Bibliometric indicators are more appropriate for the natural and health sciences, where peer-reviewed journal articles are the primary research output, than for the social sciences and humanities where research is more frequently published in non-indexed publication types such as books, book chapters, and other forms of output (Archambault et al., 2006). Bibliometric analysis is also biased towards English-language publications due to their more extensive coverage
1 The Scopus data used for this study include three publication types: peer-reviewed journal articles, conference proceedings, and book series. Journal articles account for 80% of the publications, conference proceedings 16%, and book series the remainder.
2 For the complete list of fields and sub-fields, see Appendix A.3 Bibliometric indicators are generally recognized to be more reliable
and informative in proportion to the number of publications for which an indicator is calculated (Moed, 2005). Using them in the evaluation of the research output of individual researchers or research labs is consequently more problematic. For this study, no indicators are computed unless they are based upon 30 or more publications, and scores based on 100 or fewer publications should be treated with caution. In addition, all indicators used here are field-normalized, to account for the variation in publication and citation practices across fields of research.
in the database, a fact that potentially disadvantages non-English-speaking countries or regions such as Quebec, particularly for research in the social sciences and humanities (Archambault et al., 2006). It is also less suitable for research with a regional or local focus (e.g., Canadian history and culture) because regionally specific research is less likely to be published in journals indexed in Scopus and more likely to attract a regional audience and proportionally fewer citations. Comparison with the analysis in the 2012 S&T report should be interpreted with caution: articles have had more time to accrue citations and more journals have been added to the Scopus database since the 2012 study.4
4 This study reports bibliometric data from two six-year periods, 2003–2008 and 2009–2014, allowing for a comparison of trends over time. Note that direct comparisons with results in the 2012 S&T report, which included data from the 1999–2004 and 2005–2010 periods, may be inappropriate given changes in the database over time. Due to the need for a three-year time lag between the year a study is undertaken (2016 in this case) and the latest year for which the impact measure can be calculated, impact indicators were calculated for publications for 2003–2013 rather than for 2003–2014.
Point to Consider
The structure of research fields and sub-fields can affect the outcome of bibliometric analysis. In some cases, a taxonomy of research fields may group together very distinct bodies of research, making the interpretation of results more challenging. In the Science-Metrix taxonomy used here, for example, the field Historical Studies includes the sub-field of History but also those of Anthropology, Archaeology, and Paleontology. Similarly the field Philosophy and Theology aggregates different strains of research that are not necessarily related. Such challenges occur with any taxonomy, however, and can partially be mitigated by analyzing data at the sub-field level. Standard taxonomies of research fields also sometimes obscure the importance of interdisciplinary and multidisciplinary research. Canada’s research output related to Arctic science, for example, is dispersed across many fields in a traditional taxonomy (e.g., environmental science, geography, meteorology, oceanography, ecology, anthropology), making it harder to analyze this cross-cutting area.

3Methodology, Data, and Limitations
Table 2.1 Bibliometric Indicators Used in this Data Update
Indicator Description
Number of Publications Number of publications measures the publication count for a given entity such as a country, a province, or a research field. Publication counts can be presented in whole and fractional counts. With whole counting, each publication is counted once for each unit with a participating author. For example, if a publication is co-authored by two researchers from different countries, the publication will be counted once for each country. With fractional counting, each co-author (and associated entity) is credited with a fraction of a publication corresponding to the number of authors. In the preceding example, each researcher (and country) would be allotted one-half of a publication. Unless otherwise indicated, the counts presented in this report are based on whole counts. However, some metrics use fractional counts.*
Specialization Index (SI) This indicator is a measure of the relative research intensity for an entity in a specific field of research. An SI score greater than 1 means that more publications were published in a given field or sub-field than would be expected based on world averages. For example, if publications in Physics and Astronomy account for 10% of a country’s total publications, but only 5% of total world publications, that country would have a high SI score in that field. Conversely, an SI score below 1 means that less research is produced than expected based on world averages.
Growth Index (GI) and Growth Rate (GR) GI score measures the growth of publications between two periods of time (i.e., 2003–2008 and 2009–2014) relative to the growth of a reference entity (e.g., the world) for the same period of time. For example, if Canada’s GI is above 1 for a specific field or sub-field, it means that Canada’s publication output in that field or sub-field is growing faster than the world average. The GR indicator simply corresponds to the percentage change in total publication output between the two periods; a GR score of 1.37, for example, indicates that output increased by 37% between the two periods.
Collaboration Index (CI) Based on publication co-authorships, the CI indicator measures the level of collaboration of a given entity with another entity in the context of the entity’s total publications (countries producing more publications tend to collaborate less internationally, given their increased potential for internal collaboration). A collaboration score over 1 means that the entity collaborates more than expected given its total publication output.
Average Relative Citation (ARC) This indicator measures the impact of publications produced by a given entity as reflected in citations. An ARC score over 1 indicates that the entity publishes publications that are more highly cited than the world average. ARC scores are normalized by publication type, year, and field of research. ARC scores (along with other measures of impact) are less reliable for fields or entities producing low numbers of publications, as the score can be driven by outliers.
Median Relative Citation (MRC) The MRC is similar to the ARC and is also a measure of research impact based on field-normalized citations. However, the MRC is calculated with reference to the median score rather than to the average. It is arguably a better measure of the central tendency in most areas of research given that citation distributions tend to be skewed, with a small number of publications attracting large numbers of citations.
Highly Cited Publications (HCP1%) HCP1% is a measure of research impact based on the upper tail of the distribution of normalized citation counts. The top-cited 1% of publications are identified by field or sub-field for a given period. A value above 1 indicates that the entity has more highly cited publications than expected based on its share of all publications in that field or sub-field. For example, if Paleontology in Canada represented 1% of global publications but 2% of highly cited publications, its HCP1% value would be 2.
* A complete description of the bibliometric methodology used to date, including the details on the construction of each indicator, is available upon request.
Finally, and most critically, bibliometric analysis captures only one form of research impact: effects on current and future knowledge generation as demonstrated through past publications. Research in some fields may accord a greater priority to other types of socially beneficial impacts. In applied research domains (e.g., engineering, computer science, design), publications may be less important when compared with technological advances and measures based on other outputs such as patents. Much social science and humanities research is also oriented towards other objectives. As one example, the activities of the Truth and Reconciliation
Commission of Canada used research methods from many humanities and social sciences disciplines, as well as oral testimony and Indigenous ways of knowing, to produce its report. This research prioritized informing public policy, contributing to cultural discussion and dialogue, and improving individual and social well-being in Canada’s Indigenous communities. Other examples could be drawn from legal scholarship and education research. Numbers of publications and citations will always be partial and insufficient measures of the impact and importance of research in such cases.

4 Preliminary Data Update on Canadian Research Performance and International Reputation
2.2 INTERNATIONAL SURVEY OF TOP-CITED RESEARCHERS
The second main source of evidence reported here is a survey of the world’s top-cited researchers. Again, similar to the 2012 assessment, the CCA developed and commissioned a survey of researchers’ perceptions of Canada’s research strength in their field or sub-field relative to that of other countries. In August 2016, with the assistance of EKOS Research, the survey was distributed to the authors of the top 1% of the most highly cited journal articles in their fields of study between 2004 and 2013 (referred to here as “top-cited researchers”). The survey was successfully sent to 41,470 researchers located in all countries and 5,547 completed responses were received.5
The primary limitation of the survey data is that they reflect the perceptions and opinions of top-cited researchers, which may be skewed by cognitive or personal biases. Such biases have been widely studied and discussed; see, for example,
5 The response rate was 13.4%, comparable to the response rate of the international survey undertaken for the 2012 assessment. The complete survey questionnaire is available upon request.
Tourangeau (2003) and Oskamp and Schultz (2005). Survey results may also suffer from non-response bias. Individuals more familiar with Canada may have been more likely to respond to the survey. However, the implications of this bias for survey results could be either positive or negative. Other potential biases also exist in the data but can be statistically controlled. For example, survey results are weighted in this analysis to ensure that certain countries are not over- or under-represented. The number of respondents also varies considerably by research field and sub-field. Results from fields with small numbers of respondents should be interpreted with caution. Fields in the humanities and arts, for example, attracted smaller numbers of respondents due to their proportionally smaller publication output. These limitations are discussed in more detail in the 2012 S&T report (CCA, 2012a).

5Canada’s Research Productivity
3 Canada’s Research Productivity
3.1 OVERALL RESEARCH OUTPUT AND OUTPUT GROWTH
Canada continues to rank within the top 10 countries in total output of research publications, but fell from seventh place to ninth between 2003–2008 and 2009–2014. Canada produces 3.8% of the world output.6 During the period, Canadian researchers produced about 496,696 publications (see Table 3.1).7 In the 2012 S&T report, Canada ranked seventh in 2005–2010 with roughly 395,000 scientific publications. Although India and Italy overtook Canada to reach the seventh and eighth positions, respectively, the distance separating Canada from Italy is negligible (over 2,000 publications). The United States continues to lead in number of publications, but the gap with China is rapidly narrowing.
This data update presents country rankings in a similar manner to the 2012 S&T report. Note that research output may be normalized by various measures to produce alternative rankings. For example, output can be examined relative to the size of the population or the economy of a country.
Figure 3.1 shows overall output of publications relative to a country’s population. By this measure, Canada ranks fifth with about 14 publications per 1,000 inhabitants in 2009–2014. This indicator shows China’s rank to be lower on a per capita basis; however, this could also indicate China’s potential for considerable future growth. For countries like Switzerland, high publication output reflects a high level of international collaboration and the presence of major scientific research facilities, such as CERN, which are associated with global networks of researchers.
6 Calculated from whole counts. As publications with co-authors in different countries are counted for each country, this should be interpreted as the share of world publications Canada participated in rather than as an exclusive share.
7 Unless otherwise noted, full counting is used in this data update.
Summary•Canada produced 3.8% of the world’s research
publications in 2009–2014, ranking ninth in the world in total research output.
•Canada’s share of world publications has decreased slightly since the 2012 report, primarily due to dramatic growth in publication output from emerging economies like China and India. The United States continues to lead in the number of publications produced, but the gap with China is narrowing.
•Canada’s growth in research output is slightly higher than that of many established world leaders such as the United States, United Kingdom, Germany, France, and Sweden.
•Canada’s publication output is particularly high in the fields of Clinical Medicine, Information and Communication Technologies, Engineering, Biomedical Research, Physics and Astronomy, and Enabling and Strategic Technologies.
•Research output in Canada grew faster than the world average in two fields: Visual and Performing Arts and Public Health and Health Services. It grew more slowly than the world average in the remaining fields, although Clinical Medicine is almost at world average.
•Compared with the world, Canada has a relatively high concentration of research in Psychology and Cognitive Sciences, Public Health and Health Services, and Philosophy and Theology. It has a relatively low concentration in Chemistry, Physics and Astronomy, and Enabling and Strategic Technologies.

6 Preliminary Data Update on Canadian Research Performance and International Reputation
Table 3.1 Top 20 Countries by Number of Scientific Publications Produced and Other Key Indicators, 2003–2008, 2009–2014, and 2003–2014
Rank (2009–2014)
Country
Number of PublicationsShare of World
Publications (%)CI GI GR
2009–2014 2003–2008 2009–2014 2003–2008 2009–2014 2003–2008 2003–2014
1 United States 3,136,910 2,633,098 24.3 29.2 1.00 0.89 0.80 1.15
2 China 2,600,858 1,207,471 20.1 13.4 0.48 0.46 1.50 2.15
3 United Kingdom 869,569 682,941 6.7 7.6 1.39 1.26 0.83 1.19
4 Germany 837,314 651,436 6.5 7.2 1.34 1.29 0.86 1.23
5 Japan 728,582 685,686 5.6 7.6 0.68 0.65 0.72 1.04
6 France 611,138 479,262 4.7 5.3 1.35 1.27 0.84 1.21
7 India 545,655 246,898 4.2 2.7 0.46 0.51 1.56 2.24
8 Italy 499,039 364,427 3.9 4.0 1.13 1.06 0.92 1.31
9 Canada 496,696 377,779 3.8 4.2 1.26 1.20 0.88 1.26
10 Spain 431,204 281,290 3.3 3.1 1.14 1.01 1.01 1.46
11 Australia 398,375 252,189 3.1 2.8 1.22 1.09 1.03 1.49
12 Republic of Korea
388,387 234,694 3.0 2.6 0.69 0.71 1.15 1.64
13 Brazil 321,960 177,451 2.5 2.0 0.65 0.71 1.28 1.84
14 Netherlands 280,459 201,344 2.2 2.2 1.37 1.28 0.91 1.30
15 Russia 256,825 208,439 2.0 2.3 0.74 0.91 0.89 1.27
16 Iran 211,646 63,321 1.6 0.7 0.46 0.49 2.37 3.41
17 Switzerland 207,018 146,791 1.6 1.6 1.59 1.53 0.91 1.31
18 Turkey 199,421 122,841 1.5 1.4 0.45 0.42 1.11 1.60
19 Poland 194,570 140,014 1.5 1.6 0.72 0.81 0.98 1.41
20 Sweden 180,825 137,728 1.4 1.5 1.38 1.28 0.83 1.19
World 12,935,138 9,006,984 100 100 1.00 1.44
Data Source: Calculated by Science-Metrix using Scopus database (Elsevier)
The share of world publication is calculated from whole counts. Each author receives full credit for the publication regardless of the number of authors. Using fractional publication counts, Canada’s share of world publications would be 2.8%. Countries are ranked by the total number of publications for the 2009–2014 period. Full counts overstate the output for countries with a higher propensity to collaborate and/or with more research in fields with a high propensity to collaborate. Canada ranks ninth both in full and fractional counts.
To get an idea of research efficiency, publication output can also be normalized by number of researchers. From 2009 to 2013, Canada produced on average about 52 publications per 100 researchers while the United States produced 41 publications.8 Italy ranks first with 76 publications per 100 researchers and Russia last with 9 publications.
8 Publication output by researchers (full-time equivalent) and HERD expenditure were calculated for the top 20 countries by output for 2009–2013 except for India, Brazil, Iran, Australia, and Switzerland (where data were not available or only partially available). Full-time equivalents for researchers and HERD expenditures were retrieved from the OECD (OECD, 2016).
Canada ranks 12th in overall output if output is normalized by gross domestic product (GDP), which is an indicator of the size of the national economy (see Figure 3.2). Iran ranks first by this measure, producing over 70 publications per billion dollars of GDP; in contrast Canada produces fewer than 50 publications. Although GDP may indicate a country’s capacity to invest in research, a normalization by higher education expenditure on research and development (HERD) may be more appropriate as a measure of the productivity of research investments. Canada publishes about 9 publications per $1 million investment in HERD. Japan has the lowest ratio with 6 publications per $1 million investment in HERD and China the highest with 22 publications.

7Canada’s Research Productivity
Switz
erland
Sweden
Australia
Netherla
nds
Canada
United K
ingdom
Germany
United St
ates
Spain
France
Italy
Rep. of K
orea
Japan
PolandIra
n
Turk
eyChina
Russia
Brazil
India0
5
10
15
20
25
Pub
licat
ion
s p
er 1
000
Inh
abit
ants
World Average
Data Source: Calculated by Science-Metrix using Scopus database (Elsevier) and World Bank (2016a)
Figure 3.1 Top 20 Countries by Number of Scientific Publications Produced per 1,000 Inhabitants, 2009–2014Data presented are based on whole counts.
Iran
Poland
Sweden
United K
ingdomChina
Rep. of K
orea
Netherla
nds
Switz
erland
IndiaSp
ain
Australia
Canada
Turk
eyIta
ly
Germany
France
United St
ates
Brazil
Russia
Japan
0
10
20
30
40
50
60
70
80
Pub
licat
ion
s p
er B
illio
n $
of
GD
P
Data Source: Calculated by Science-Metrix using Scopus database (Elsevier) and World Bank (2016b)
Figure 3.2 Top 20 Countries by Scientific Publications per Billion Dollars of GDP, 2009–2014Data presented are based on whole counts.

8 Preliminary Data Update on Canadian Research Performance and International Reputation
Growth in research output varies considerably for the 20 top countries by number of publications. Iran, China, India, Brazil, and the Republic of Korea show the most significant increase in publication output over the last 10 years. In particular, the dramatic increase in China’s output means that it is closing the gap with the United States. In 2014, China’s output was 95% of that of the United States, compared with 26% in 2003.
Table 3.1 shows the Growth Index (GI), a measure of the rate at which the research output for a given country changed between 2003 and 2014, normalized by the world growth rate. If a country’s growth in research output is higher than the world average, the GI score is greater than 1. For example, between 2003 and 2014, China’s GI score was 1.5 (i.e., 50% greater than the world average) compared with 0.88 and 0.80 for Canada and the United States, respectively.
3.2 RESEARCH OUTPUT BY FIELD
The ranking of Canadian fields by number of publications is similar to that in the 2012 S&T report. The 2009–2014 rankings of the six largest research fields by absolute count of publications (Clinical Medicine, Information and Communication Technologies, Engineering, Biomedical Research, Physics and Astronomy, and Enabling and Strategic Technologies9) are unchanged from 2005–2010, the latest period used in the 2012 report. Canada’s overall share of
9 This field encompasses sub-fields related to new or emerging technologies such as Energy, Biotechnology, Bioinformatics, Nanoscience and Nanotechnology, and Optoelectronics and Photonics.
publications produced globally decreased in most fields of research, with a few exceptions. For example, Canada’s share of publications increased in Public Health and Health Services (from 6.6% in 2003–2008 to 7.1% in 2009–2014) and in Visual and Performing Arts (from 3.4% to 5.5%) (see Table 3.2).
Production of publications in most fields of research in Canada grew more slowly than the world average in 2003–2014 (see Figure 3.3). This is a change from the 2012 report, which noted that half of the fields grew more quickly than the world average in 1999–2010. The fields with the lowest GI scores include Agriculture, Fisheries and Forestry, Engineering, and Communication and Textual Studies. However, Canada’s output grew faster than the world average in two fields: Visual and Performing Arts (note the small sample size) and Public Health and Health Services, which were two of the four fields that the 2012 report identified as growing. The other two fields were Philosophy and Theology and Physics and Astronomy.
Point to Consider
The dramatic increase in publication production of emerging economies such as China and India has had a negative impact on Canada’s rank and GI score. For example, China’s publication production more than doubled between 2003–2008 and 2009–2014. Since growth indices are relative, this increase has a negative impact on the GI scores of other countries. However, Canada’s GR, a metric that is not affected by relative outputs of other countries, is still higher than many other developed countries such as the United States, United Kingdom, Japan, and Germany (see Table 3.1).
Point to Consider
The metrics calculated for each specific entity (e.g., country, province) in each domain (e.g., field, sub-field) are sensitive to the number of publications on which the metrics are based. Metrics like the ARC and SI are less robust when the number of publications is low because individual publications can significantly skew the metrics and present a biased picture of a country’s impact in these fields. Low publication counts make it difficult to discern trends in the metrics for an entity (e.g., institution) over time, as the addition or subtraction of one or two high-impact publications per year can cause large year-to-year variations. The field of Visual and Performing Arts illustrates this phenomenon. Although worldwide the field has only a few hundred publications per year in academic journals covered by Scopus, it shares research through many other outlets such as exhibitions or performances.

9Canada’s Research Productivity
Compared with the world, Canada has a relatively high concentration of research in Psychology and Cognitive Sciences, Public Health and Health Services, and Philosophy and Theology. It also has a relatively low concentration in Chemistry, Physics and Astronomy, and Enabling and Strategic Technologies (see Figure 3.4). The Specialization Index (SI) is a measure of the level of research focus in
a particular field relative to the rest of the world. The SI score of a country for a field is the ratio of the share of publications for that country to the share of publications in the same field for the entire world. In other words, it measures how much more (or less) a country publishes in that field relative to the world, for a given time period.
Table 3.2 Total Publication Output, Share of World Publications, and Specialization Index by Field of Research in Canada, 2003–2008 and 2009–2014
Field
Number of Publications 2009–2014
Canada's Share of World Publications (%)
SI
Canada World 2009–2014 2003–2008 2009–2014 2003–2008
Clinical Medicine 106,899 2,584,581 4.1 3.9 1.05 0.94
Information & Communication Technologies
38,236 897,429 4.3 4.9 1.14 1.22
Engineering 37,902 1,156,209 3.3 4.2 0.90 1.06
Biomedical Research 35,337 730,600 4.8 4.9 1.19 1.11
Physics & Astronomy 33,783 1,102,228 3.1 3.0 0.65 0.60
Enabling & Strategic Technologies 32,006 1,227,152 2.6 3.1 0.71 0.76
Public Health & Health Services 20,872 292,529 7.1 6.6 2.02 1.69
Biology 20,364 431,532 4.7 5.4 1.14 1.21
Earth & Environmental Sciences 19,276 349,790 5.5 5.8 1.22 1.22
Chemistry 18,873 796,279 2.4 2.6 0.64 0.63
Social Sciences 17,351 367,697 4.7 4.9 1.46 1.35
Agriculture, Fisheries & Forestry 16,079 361,922 4.4 5.9 1.19 1.49
Psychology & Cognitive Sciences 15,322 203,231 7.5 7.7 2.05 1.88
Economics & Business 12,812 284,327 4.5 5.2 1.16 1.24
Mathematics & Statistics 10,249 286,853 3.6 4.2 0.85 0.91
General Science & Technology 9,722 230,907 4.2 2.9 0.87 0.48
Built Environment & Design 3,975 85,646 4.6 5.4 1.36 1.41
Communication & Textual Studies 3,751 83,407 4.5 5.6 1.51 1.66
Historical Studies 2,952 73,052 4.0 4.8 1.25 1.31
Philosophy & Theology 2,942 51,535 5.7 6.2 1.86 1.81
Visual & Performing Arts 664 12,138 5.5 3.4 1.84 0.98
General Arts, Humanities & Social Sciences
482 13,026 3.7 3.6 1.17 0.98
Total* 496,696 12,935,138 3.8 4.2
Data Source: Calculated by Science-Metrix using Scopus database (Elsevier)
Fields are ranked by number of Canadian publications, 2009–2014.* Total also includes unclassified publications

10 Preliminary Data Update on Canadian Research Performance and International Reputation
Agriculture,Fisheries &Forestry
Biology
Biomedical Research
Built Environment & Design
Chemistry
Clinical Medicine
Communication &Textual Studies
Earth & EnvironmentalSciences
Economics & Business
Enabling & StrategicTechnologiesEngineering
Historical Studies
Information &Communication Technologies
Mathematics & Statistics
Philosophy & Theology
Physics & Astronomy
Psychology &Cognitive Sciences
Public Health &Health Services
Social Sciences
Visual & Performing Arts
0.0
0.4
0.8
1.2
1.6
2.0
Canada World
Data Source: Calculated by Science-Metrix using Scopus database (Elsevier)
Figure 3.4 Specialization Index by Field of Research in Canada, 2009–2014 and 2003–2008The figure shows Canada’s SI scores by field of research relative to the world.
Agriculture,Fisheries &Forestry
Biology
Biomedical Research
Built Environment & Design
Chemistry
Clinical Medicine
Communication &Textual Studies
Earth & EnvironmentalSciences
Economics & Business
Enabling & StrategicTechnologiesEngineering
Historical Studies
Information &Communication Technologies
Mathematics & Statistics
Philosophy & Theology
Physics & Astronomy
Psychology &Cognitive Sciences
Public Health &Health Services
Social Sciences
Visual & Performing Arts
0.0
0.4
0.8
1.2
1.6
2.0
2003 2008 – 2009 2014 – World
Data Source: Calculated by Science-Metrix using Scopus database (Elsevier)
Figure 3.3 Growth Index by Field of Research in Canada and the World, 2003–2014The figure shows the GI scores for Canada by field of research relative to world GI score. The GI score is based on a comparison of growth between the 2008–2014 and 2003–2008 periods.
11Canada’s Research Productivity
Overall, Canada’s SI scores did not change dramatically between 2003–2008 and 2009–2014 (see Figure 3.4). The greatest variation is observed for Visual and Performing Arts, which increased from an SI score of 1.0 to about 1.8.10 Variations for such fields should be interpreted with caution given the limited number of publications produced. The SI score for Public Health and Health Services also increased while the score for Agriculture, Fisheries and Forestry decreased.
10 Both Canada and the world have experienced strong publication growth in this field in recent years, though from a relatively small initial base. World publication output in the Visual and Performing Arts roughly doubled between 2003 and 2014, rising to just over 2,000 publications. Canada’s output more than quadrupled, rising from 33 publications in 2003 to 136 publications in 2014. In both cases, however, publications in this field remain a very small fraction of total publications indexed in Scopus.
3.3 GLOBAL RESEARCH COLLABORATION
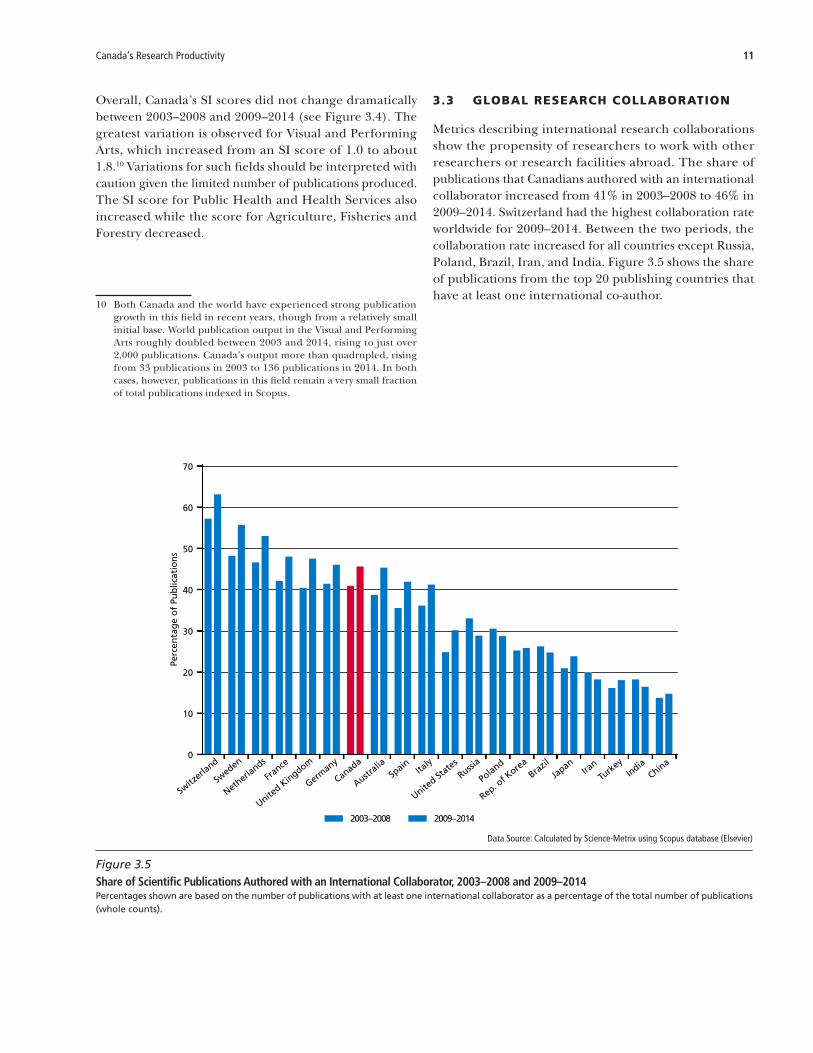
Metrics describing international research collaborations show the propensity of researchers to work with other researchers or research facilities abroad. The share of publications that Canadians authored with an international collaborator increased from 41% in 2003–2008 to 46% in 2009–2014. Switzerland had the highest collaboration rate worldwide for 2009–2014. Between the two periods, the collaboration rate increased for all countries except Russia, Poland, Brazil, Iran, and India. Figure 3.5 shows the share of publications from the top 20 publishing countries that have at least one international co-author.
Switz
erland
Sweden
Netherla
nds
France
United K
ingdom
Germany
Canada
Australia
Spain
Italy
United St
ates
Russia
Poland
Rep. of K
orea
Brazil
Japan
Iran
Turk
eyIndia
China0
10
20
30
40
50
60
70
Perc
enta
ge
of
Pub
licat
ion
s
2003 2008 – 2009 2014 –
Data Source: Calculated by Science-Metrix using Scopus database (Elsevier)
Figure 3.5 Share of Scientific Publications Authored with an International Collaborator, 2003–2008 and 2009–2014Percentages shown are based on the number of publications with at least one international collaborator as a percentage of the total number of publications (whole counts).

12 Preliminary Data Update on Canadian Research Performance and International Reputation
As noted in the 2012 S&T report, countries with larger populations tend to collaborate less than smaller countries because researchers have more opportunities to collaborate with domestic colleagues. The Collaboration Index (CI) overcomes this bias by taking into account the size of a country's research output. When the CI score is above 1, a country produces more collaborations than expected based on the number of publications it produces, while a score below 1 indicates the reverse.
In 2009–2014, Canada had a CI score of 1.26, which means that Canadian researchers collaborated 26% more than might be expected based on the total number of Canadian publications for the period. This is a slight increase from 1.21, the score noted by the 2012 report for 2005–2010. On this measure, Canada ranks 7th out of the top 20 countries by number of scientific publications produced. Switzerland, the United Kingdom, and Sweden are the top three countries (see Table 3.1).

13Canada’s Research Impact
4 Canada’s Research Impact
4.1 OVERALL RESEARCH IMPACT
Canada’s researchers and scientists produce publications with high levels of impact as reflected by citation rates. In the 2012 S&T report, Canada ranked sixth out of the top-producing scientific countries based on the Average Relative Citation (ARC) for publications with at least one Canadian author.11 According to the latest data, Canada maintained its rank for the 2009–2014 period as did the top three countries.12 However, United States fell from fourth to seventh place and Australia rose from seventh to fourth, tied with the United Kingdom (see Figure 4.1).
The impact of Canada’s research also continues to improve relative to the world average: Canada’s ARC score increased from 1.36 in 2003–2008 to 1.43 in 2009–2014. However, ARC scores for most advanced economies also increased between the two periods (see Table 4.1). The Median Relative Citation (MRC) indicator shows a similar pattern. With an MRC score of 1.50, Canada is tied in fifth place with the United Kingdom and United States. In comparison, some countries with high research output growth, such as China, Brazil, India, and Iran, have comparatively low citation levels. The Highly Cited Publications (HCP1%) indicator for each country is also shown in Table 4.1, corresponding to the extent of over- or under-representation in the top 1% of publications. Canada again ranks sixth in the world by this measure for 2009–2014, tying with the United States.
11 “Canadian author” in this case refers to a researcher based at a Canadian institution, and not to the author’s nationality or citizenship.
12 Note that the difference in ARC between Canada and the United States is marginal.
Summary•Citation-based indicators show that Canadian research
continues to have relatively high levels of impact. Canada ranks sixth out of top-producing scientific countries by ARC score, the same rank noted in the 2012 report. MRC scores reveal a similar pattern, but by this measure Canada is tied for fifth place with the United Kingdom and United States.
•All fields of research in Canada are cited above the world average. Clinical Medicine and Physics and Astronomy, identified as Canadian strengths in the 2012 report, have the highest ARC scores.
•Canada is also over-represented in the top-cited 1% of publications in all fields for the 2009–2014 period. Fields where Canada has particularly high levels of performance in the top-cited 1% of publications include Clinical Medicine, Biology, and Physics and Astronomy.
•ARC scores increased in virtually all Canadian fields between 2003–2008 and 2009–2014, except in Visual and Performing Arts and Built Environment and Design. (Public Health and Health Services also decreased but marginally.) However, the overall ranking of 13 of 22 fields by ARC decreased between 2003–2008 and 2009–2014, suggesting a minor erosion of Canada’s global competitiveness in most fields.

14 Preliminary Data Update on Canadian Research Performance and International Reputation
Switz
erland
Netherla
nds
Sweden
United K
ingdom
Australia
Canada
United St
ates
Italy
Germany
France
Spain
Rep. of K
orea
Iran
Japan
Poland
Turk
eyChina
Brazil India
Russia
0.0
0.2
0.4
0.6
0.8
1.0
1.2
1.4
1.6
1.8
2.0
AR
C World Average
2003 2008 – 2009 2014 –
Data Source: Calculated by Science-Metrix using Scopus database (Elsevier)
Figure 4.1 Average Relative Citation Scores for Top 20 Countries by Number of Publications, 2003–2008 and 2009–2014Countries are ranked by ARC score for the 2009–2014 period.

15Canada’s Research Impact
Table 4.1 Key Indicators of Research Impact for Top 20 Countries by Research Output, 2003–2008 and 2009–2014
Country2009–2014 2003–2008
ARC MRC HCP1% ARC MRC HCP1%
Switzerland 1.74 1.92 2.72 1.59 1.67 2.22
Netherlands 1.68 2.00 2.49 1.51 1.75 1.98
Sweden 1.54 1.67 2.06 1.39 1.60 1.63
Australia 1.48 1.56 2.01 1.30 1.47 1.51
United Kingdom 1.48 1.50 1.99 1.36 1.50 1.67
Canada 1.43 1.50 1.85 1.36 1.50 1.57
United States 1.40 1.50 1.85 1.38 1.47 1.76
Italy 1.34 1.43 1.57 1.14 1.20 1.16
Germany 1.32 1.33 1.68 1.18 1.20 1.30
France 1.25 1.22 1.52 1.12 1.08 1.19
Spain 1.25 1.25 1.44 1.09 1.13 1.06
Rep. of Korea 1.06 1.00 0.99 0.92 1.00 0.77
Iran 0.93 1.00 0.74 0.79 1.00 0.54
Japan 0.87 1.00 0.73 0.84 0.93 0.65
Poland 0.84 0.75 0.79 0.67 0.57 0.51
China 0.82 0.82 0.75 0.73 0.67 0.61
Turkey 0.82 0.75 0.73 0.83 0.83 0.60
India 0.79 0.67 0.58 0.80 0.79 0.63
Brazil 0.79 0.80 0.60 0.81 0.90 0.53
Russia 0.59 0.33 0.49 0.51 0.33 0.37
Data Source: Calculated by Science-Metrix using Scopus database (Elsevier)
Countries are ranked by ARC for the 2009–2014 period. Only the top 20 countries by total publications are used in this ranking. Including all countries would change this ranking.
Point to Consider
ARC, MRC, and HCP1% provide similar, though slightly different, measures of research impact. Citation distributions are often highly skewed. A small number of publications often receive large numbers of citations while many publications receive few or none. ARC scores, based on the average, are influenced by the highly cited papers at the top of the spectrum and potentially biased towards the upper end of the distribution. MRC scores, which are based on the median, can be a better measure of central tendency as a result. MRC scores, however, are less able
to differentiate between entities with similar levels of citations as they are always based on whole numbers (i.e., the actual number of citations garnered by the median publication). MRC scores are also undefinable when the median publication in a distribution has zero citations — a phenomenon that sometimes occurs even with relatively large numbers of publications. HCP1% directly measures performance at the top of the distribution, assessing the extent to which an entity has research in the top-cited 1% of all publications.

16 Preliminary Data Update on Canadian Research Performance and International Reputation
4.2 RESEARCH IMPACT BY FIELD
All research fields in Canada had ARC scores above 1 for the 2009–2014 period (see Figure 4.2), indicating citation levels above the world average. Fields with the highest ARC scores (above 1.50) include Clinical Medicine and Physics and Astronomy, both of which were identified as Canadian strengths in the 2012 S&T report.13 Fields with ARC scores between 1.30 and 1.50 (30-50% above the world average) include Agriculture, Fisheries and Forestry; Biology; Information and Communication Technologies; Engineering; Economics and Business; Enabling and Strategic Technologies; and Earth and Environmental Sciences.
13 Comparison with the 2012 S&T report analysis should be interpreted with caution. See Section 2.1 for a discussion of the limitations of bibliometric data.
At the domain level, the health sciences, natural sciences, and applied sciences all show citation levels above the world average. ARC scores for virtually all fields in Canada increased between 2003–2008 and 2009–2014. Visual and Performing Arts, Public Health and Health Services, and Built Environment and Design were the only exceptions and the decrease in the ARC score for Public Health and Health Services was small.
MRC scores reveal a different pattern in several cases. MRC scores for Information and Communication Technologies and Engineering, for example, significantly decreased over the period, indicating that, while some highly cited publications drove up the average, the impact of most publications, as reflected by citations, declined (see Table 4.2).
Table 4.2 Key Indicators of Research Impact for Canada by Field, 2003–2008 and 2009–2014
Field
2009-2014 2003-2008
Rank by ARC
ARC MRC HCP1%Rank by
ARCARC MRC HCP1%
General Arts, Humanities & Social Sciences 2 1.58 2.00 2.25 9 1.11 1.67 0.93
Psychology & Cognitive Sciences 4 1.16 1.22 1.34 3 1.12 1.22 0.92
Clinical Medicine 5 1.73 1.75 2.48 2 1.62 1.75 2.08
Physics & Astronomy 5 1.54 1.50 2.09 4 1.38 1.50 1.56
Historical Studies 5 1.28 2.00 1.81 4 1.21 1.50 1.27
Visual & Performing Arts 5 1.24 1.64 2 1.66 2.00 2.90
Information & Communication Technologies 6 1.42 1.00 1.61 5 1.36 1.67 1.40
Economics & Business 6 1.38 1.50 1.57 6 1.17 1.33 1.25
Chemistry 6 1.28 1.50 1.35 7 1.25 1.53 1.26
Philosophy & Theology 6 1.23 2.00 1.32 10 0.93 1.00 0.65
General Science & Technology 7 1.77 1.83 2.48 6 2.22 7.80 3.11
Agriculture, Fisheries & Forestry 7 1.44 1.67 1.88 8 1.25 1.38 1.68
Biology 7 1.43 1.60 2.31 8 1.32 1.45 1.70
Social Sciences 7 1.17 1.00 1.35 10 1.09 1.33 1.08
Engineering 8 1.38 1.60 1.65 8 1.37 2.00 1.47
Earth & Environmental Sciences 8 1.33 1.50 1.64 7 1.31 1.56 1.56
Public Health & Health Services 8 1.24 1.29 1.79 6 1.28 1.36 1.56
Enabling & Strategic Technologies 9 1.34 1.40 1.47 8 1.31 1.50 1.63
Biomedical Research 9 1.25 1.25 1.56 9 1.17 1.22 1.20
Mathematics & Statistics 9 1.14 1.00 1.07 8 1.13 1.29 1.08
Communication & Textual Studies 9 1.09 1.00 1.30 8 1.02 1.00 0.99
Built Environment & Design 14 1.01 1.00 1.05 10 1.16 1.22 1.28
Data Source: Calculated by Science-Metrix using Scopus database (Elsevier)
Rankings are based on ARC scores for 2009–2014 and 2003–2008 and the top 20 countries by total number of publications produced in that field.

17Canada’s Research Impact
Agriculture,Fisheries &Forestry Biology
Biomedical Research
Built Environment & Design
Chemistry
Clinical Medicine
Communication &Textual Studies
Earth & EnvironmentalSciences
Economics & Business
Enabling & StrategicTechnologiesEngineeringHistorical Studies
Information &Communication Technologies
Mathematics & Statistics
Philosophy & Theology
Physics & Astronomy
Psychology &Cognitive Sciences
Public Health &Health Services
Social Sciences
Visual & Performing Arts
0.0
0.4
0.8
1.2
1.6
2.0
2003 2008 – 2009 2014 – World
Data Source: Calculated by Science-Metrix using Scopus database (Elsevier)
Figure 4.2 Average Relative Citation Scores by Field of Research in Canada, 2003–2008 and 2009–2014The figure shows the ARC scores by field of research relative to the world.
In both the 2012 report (for the 2005–2010 period) and the 2009–2014 period, Canada ranked among the top five countries by ARC score in five fields (in addition to General Science and Technology and General Arts, Humanities and Social Sciences): Psychology and Cognitive Sciences, Clinical Medicine, Physics and Astronomy, Historical Studies, and Visual and Performing Arts.14 Canada is also over-represented in the top-cited 1% of publications for all fields in the 2009–2014 period. Fields with HCP1% scores over 2 include Clinical Medicine, Biology, and Physics and Astronomy, as well as General Science and Technology and General Arts, Humanities, and Social Sciences.
14 General Science and Technology and General Arts, Humanities and Social Sciences reflect publications in multidisciplinary journals, such as Science and Nature, which cannot be assigned a field based on the journal. Rankings here are out of the top 20 countries by total publications in that field of study. The inclusion of countries with fewer publications would result in changes in relative rankings. In the case of ties, countries with the same score are each given the same rank.
Canada’s rank by ARC improved between 2003–2008 and 2009–2014 in the following fields: Philosophy and Theology; Social Sciences; Agriculture, Fisheries, and Forestry; Biology; and Chemistry. Although Canada’s rank declined in 13 of 22 fields, many of the decreases were by only one place. Given that countries often have similar ARC scores, such changes may not be a meaningful indication of a change in status. Countries switch back and forth in rankings over time due to minor fluctuations. Nevertheless, the data suggest a minor erosion in Canada’s standing relative to other countries in most fields. Clinical Medicine and Public Health and Health Services both declined in rank by more than one place. In contrast, Chemistry rose from 10th to 6th place.

18 Preliminary Data Update on Canadian Research Performance and International Reputation
4.3 SYNTHESIZING RESEARCH OUTPUT AND IMPACT
Figure 4.3 plots indicators of research output and impact together to provide a composite picture of Canada’s research performance for two time periods, 2003–2008 and 2009–2014. SI scores are plotted along the x-axis and ARC scores are plotted along the y-axis, while the overall size of the research output (i.e., number of publications) is indicated by the area of the circle. Each diagram is divided into four quadrants to show relative positioning of research fields:
•The top-right quadrant contains fields that have both a high SI score (higher level of publication output for a specific field than expected, based on the world average) and a high impact.
•The top-left quadrant contains fields with a high impact but a lower level of publication output than would be expected based on the world average.
•The bottom-right quadrant contains fields with a higher level of publication output than expected but a low impact.
•The bottom-left quadrant contains fields where output is lower than expected and the impact is also low.
Fields below the x-axis represent areas with citation levels below the world average. Only one Canadian field (Philosophy and Theology) is located in this area, and only for 2003–2008. A more competitive standard, however, is the average ARC for G7 countries (i.e., Canada, France, Germany, Italy, Japan, United Kingdom, and United States), shown on the figure as a dashed line. Six fields in Canada have both a high SI score and a high impact (over the average ARC for G7 countries): Clinical Medicine; Biology; Information and Communication Technologies; Agriculture, Fisheries and Forestry; Earth and Environmental Science; and Economics and Business.
Some fields in Canada exhibit ARC scores below the G7 standard. The largest is Biomedical Research. Public Health and Health Services and Psychology and Cognitive Sciences are found here as well, though in case of the latter, Canada still ranks among the top five countries by ARC for 2009–2014.15 (ARC scores for fields in the social sciences and humanities should be interpreted cautiously, especially as these fields also tend to have fewer publications in each period.)
ARC scores for most fields of research in Canada have increased in recent years, represented here as a modest shift towards the top of the diagram. (Note that the G7 average ARC score also increased between the two periods, rising from 1.19 to 1.30.) Out of the fields showing increasing ARC scores between 2003–2008 and 2009–2014, two fields (Social Sciences and Information and Communication Technologies) experienced a significant drop in MRC. In particular, the MRC score for Information and Communication Technologies dropped from 1.67 to 1.00 between 2003–2008 and 2009–2014.
Fields in which Canada’s SI score is low have not changed significantly. For example, Canada’s research output in Physics and Astronomy continues to be lower than might be expected. One significant change is that Clinical Medicine has shifted across the y-axis, indicating a growing specialization in a field with a high research output and comparatively high impact. Conversely, Engineering has moved in the other direction, indicating Canada’s declining focus on research in this field relative to other countries.
15 See CCA (2012a) for further discussion of this effect. This tends to occur when research output is highly concentrated in several countries (e.g., the United States), which allows countries to rank highly despite comparatively low ARC scores (and in some cases below 1).

19Canada’s Research Impact
-0.4 -0.2 0.2 0.4 0.6
-0.1
0.1
0.2
0.3
0.4
0.5
250 publications
G7 Average ARC
2003 2008 –
Specialization Index (SI)
Less Specialized World Average More Specialized ← →Less
Imp
act
←W
orl
dA
vera
ge
→M
ore
Imp
act
Ave
rag
e R
elat
ive
Cit
atio
ns
(AR
C)
BiomedicalResearch
Biology
Information &CommunicationTechnologies
Psychology &Cognitive Sciences
Earth &Environmental
Sciences
Mathematics &Statistics
Built Environment & Design
Philosophy &Theology
Physics &Astronomy
SocialSciences
Chemistry
Agriculture,Fisheries &Forestry
Communication &Textual Studies
Enabling &Strategic
Technologies
Historical Studies
Economics &Business
Public Health &Health Services
Engineering
Visual &Performing
Arts
ClinicalMedicine
-0.4 -0.2 0.2 0.4 0.6
0.1
0.2
0.3
0.4
0.5
250 publications
G7 Average ARC
Specialization Index (SI)
Less Specialized World Average More Specialized ← →
Wo
rld
Ave
rag
e→
Mo
reIm
pac
t
Ave
rag
e R
elat
ive
Cit
atio
ns
(AR
C)
2009 2014 –
Agriculture,Fisheries &Forestry
Built Environment & Design
Historical Studies
Philosophy &TheologyMathematics &
Statistics
Physics &Astronomy
Psychology &Cognitive Sciences
Communication &Textual Studies
Information &CommunicationTechnologies
Biology
Earth &Environmental
Sciences
BiomedicalResearch
Enabling &Strategic
Technologies
Engineering
Visual &Performing
Arts
Economics &Business
Public Health &Health Services
Chemistry
SocialSciences
ClinicalMedicine
Data Source: Calculated by Science-Metrix using Scopus database (Elsevier)
Figure 4.3 Positional Analysis of Canada in 20 Fields of Research, 2009–2014 and 2003–2008The figure was designed with the same methodology used in the 2012 S&T report. The area of a bubble is proportional to the number of publications in that field, based on whole counts. For example, Mathematics and Statistics had 10,250 publications in 2009–2014, so the area of its bubble is 41 times the reference bubble of 250 publications. ARC and SI scores are transformed to the hyperbolic tangent of the natural logarithm of the indicators to improve readability and allow for a symmetrical representation of the data. Zero is equal to the world average for both axes.

20 Preliminary Data Update on Canadian Research Performance and International Reputation
5 Overview of the Canadian Regional Landscape
5.1 RESEARCH OUTPUT AND IMPACT BY PROVINCE/TERRITORY
Of the four most populous provinces, Ontario produces the greatest number of publications (226,000) followed by Quebec (110,000), British Columbia (74,000), and Alberta (65,000). On a per capita basis, Nova Scotia ranks first with 19.2 publications per 1,000 inhabitants, followed by Ontario (16.5) and British Columbia (16.0) (see Table 5.1).
All provinces and territories increased their publication output between 2003–2008 and 2009–2014. However, similar to Canada as a whole, all have GI scores below the world level. In terms of research impact, British Columbia has the highest score for the same periods (Table 5.1).
The impact of research produced by all Canadian provinces and territories increased between 2003–2008 and 2009–2014 (see Table 5.1). Both ARC and MRC scores show that all provinces and territories have a higher impact than the world average or median in 2009–2014. The three provinces with the greatest number of publications also have the highest average and median impact. For the 2009–2014 period, British Columbia had the highest ARC with a score of 1.69, followed by Ontario (1.54) and Quebec (1.51). The ranking is similar for 2003–2008. The MRC scores, however, place Quebec second (1.60) and Ontario third (1.57). Even the provinces and territories with the lowest ranks for research impact rank higher than the world average.
Table 5.1 Number of Publications, Average Relative Citation, Median Relative Citation, and Number of Publications per 1,000 Inhabitants by Canadian Province and Territory, 2003–2008 and 2009–2014
Province or TerritoryARC MRC Number of Publications
Publications per 1,000 Inhabitants
2009–2014 2003–2008 2009–2014 2003–2008 2009–2014 2003–2008 2009–2014 2003–2008
British Columbia 1.69 1.59 1.75 1.73 74,162 55,030 16.0 12.7
Ontario 1.54 1.46 1.57 1.64 226,470 170,341 16.5 13.2
Quebec 1.51 1.39 1.60 1.57 110,433 84,228 13.4 10.9
Alberta 1.46 1.35 1.50 1.50 65,037 48,425 15.8 13.5
Nova Scotia 1.37 1.22 1.50 1.40 18,119 14,673 19.2 15.7
Saskatchewan 1.36 1.19 1.50 1.44 17,321 12,957 15.4 12.7
Yukon 1.36 1.12 1.31 1.50 226 172 6.1 5.2
Manitoba 1.34 1.22 1.40 1.38 16,659 12,475 13.0 10.4
Nunavut 1.32 0.90 1.67 1.19 154 125 4.3 3.9
Newfoundland and Labrador
1.26 1.22 1.40 1.33 6,814 4,825 12.9 9.4
Northwest Territories 1.25 1.07 1.50 1.29 274 224 6.2 5.2
New Brunswick 1.10 1.02 1.14 1.14 7,213 6,185 9.6 8.3
Prince Edward Island 1.08 1.06 1.25 1.26 1,338 1,179 9.2 8.5
Canada 1.43 1.36 1.50 1.50 496,696 377,779 14.0 11.4
World 1 1 1 1 12,935,138 9,006,984 1.8 1.3
Data Source: Calculated by Science-Metrix using Scopus database (Elsevier)
Provinces and territories are ordered by ARC score for 2009–2014. 2003–2008 and 2009–2014 publications per capita data are based on population respectively in 2008 and 2014. Population data are based on Statistics Canada (2016) and World Bank (2016c).
Summary•Publication output increased in all provinces and
territories between 2003–2008 and 2009–2014. However, similar to Canada as a whole, all have GI scores below the world level. The research of all provinces and territories has a higher impact (by ARC) than the world average.
•Most populous provinces (i.e., British Columbia, Alberta, Ontario, and Quebec) tend to have higher international collaboration rates than smaller provinces but lower interprovincial collaboration rates.

21Overview of the Canadian Regional Landscape
5.2 RESEARCH OUTPUT AND IMPACT BY FIELD, BY PROVINCE/TERRITORY
A synthesis of provincial research output and impact is presented in the positional analyses in Appendix B. With very few exceptions, the publications produced by all provinces and territories in all fields of study are cited at or above the world level. Almost all of the fields of research in the four provinces with the highest publication outputs (British Columbia, Alberta, Ontario, and Quebec) are located in the upper right and the upper left quadrants of the positional analysis diagrams. With few exceptions, all provinces are specialized in Agriculture, Fisheries, and Forestry; Psychology and Cognitive Sciences; and Public Health and Health Services. Similarly, all provinces exhibit a production deficit in Physics and Astronomy and Chemistry, despite being generally well cited in those fields.
As the 2012 S&T report pointed out, the larger fields of research are mostly consistent across provinces although some differences appear. For example, although all provinces have a high publication output and impact in Clinical Medicine, British Columbia is less specialized in this field than Alberta, Ontario, and Quebec. Each province, however, also has its own distinctive pattern of research output and impact, some features of which are highlighted below. Note that the findings presented below are based on publications from the 2009–2014 period. For provinces with smaller numbers of publications, research impact can vary considerably depending on the time period selected.
• British Columbia has a high impact in all fields of study. Its highest ARC score is in Physics and Astronomy while its lowest scores are in Biomedical Research, Built Environment and Design, and Communication and Textual Studies. The province is both highly specialized and has a high impact in a number of fields, particularly in the Social Sciences. Fields in which it is below the world average in specialization include Chemistry and Enabling and Strategic Technologies.
• Alberta is both highly specialized and has a high impact in Public Health and Health Services; Philosophy and Theology; Agriculture, Fisheries and Forestry; and Communication and Textual Studies. It is least specialized in Physics and Astronomy, Mathematics and Statistics, and Chemistry. Alberta scores an ARC of at least 1 in all fields except Mathematics and Statistics and Built Environment and Design, and Visual and Performing Arts.
• Saskatchewan is both highly specialized and has a high impact in Agriculture, Fisheries and Forestry; Biology; and Earth and Environmental Sciences. Its strongest impact is in Physics and Astronomy, followed by Biology, and Engineering. Saskatchewan is not specialized in
Physics and Astronomy, Clinical Medicine, or Chemistry. Economics and Business is the field with the lowest impact in recent years.
• Manitoba is both highly specialized and has a high impact in Agriculture, Fisheries and Forestry; Biology; and Biomedical Research. The province has its highest ARC and MRC scores in Clinical Medicine and Information and Communication Technologies. Manitoba is not specialized in Chemistry, Physics and Astronomy, Enabling and Strategic Technologies, or Engineering. It has a comparatively low impact in Mathematics and Statistics.
• Ontario has ARC scores above the world average in all fields. No field stands out as being both highly specialized and having high impact, although many fields present a combination of high specialization and moderate impact (e.g., Psychology and Cognitive Sciences, Public Health and Health Services) or high impact and moderate specialization (e.g., Clinical Medicine, Information and Communication Technologies, Economics and Business). Ontario is most specialized in Psychology and Cognitive Sciences and Public Health and Health Services while its strongest impact is in Clinical Medicine. The province is least specialized in Chemistry, Physics and Astronomy, and Enabling and Strategic Technologies.
• Quebec exhibits its strongest combination of high specialization and high impact in the Visual and Performing Arts. Its strongest fields of specialization include Psychology and Cognitive Sciences and Philosophy and Theology while its highest impact is observed in Visual and Performing Arts, Physics and Astronomy, and Clinical Medicine. The province’s impact in all fields is either at or above the world average.
• New Brunswick’s highest specialization and impact levels are observed in Agriculture, Fisheries and Forestry. The province is not specialized in Clinical Medicine (note the absence of medical schools) though impact in that field is relatively high. It also has low specialization levels in Biomedical Research, Enabling and Strategic Technologies, and Physics and Astronomy.
• Newfoundland and Labrador is both highly specialized and has a high impact in Historical Studies; Mathematics and Statistics; Agriculture, Fisheries and Forestry; and Biology. Its highest impact is in Clinical Medicine despite its relative underproduction in this field. It is least specialized in Physics and Astronomy and Clinical Medicine, and its lowest impact is in the Social Sciences and Psychology and Cognitive Science.
• Nova Scotia is both highly specialized and has a high impact in Philosophy and Theology and Earth and Environmental Sciences. Its highest impact is in Clinical

22 Preliminary Data Update on Canadian Research Performance and International Reputation
Medicine. The province is not specialized in Physics and Astronomy, Engineering, or Chemistry. Only Built Environment and Design has an impact that is below the world average.
• Prince Edward Island is heavily specialized in Agriculture, Fisheries and Forestry, a field in which it also has a relatively high impact. The province also has a high impact in Chemistry and a low specialization level in Clinical Medicine and Physics and Astronomy. However, the performance statistics of Prince Edward Island’s publications are not calculated in many fields due to low output.
•The Territories individually do not publish enough articles to calculate bibliometric indicators in most fields of study. Nevertheless, all three territories are very highly specialized and score high on impact in Earth and Environmental Sciences.
5.3 INTERPROVINCIAL AND INTERNATIONAL COLLABORATIONS
The most populous provinces tend to have lower interprovincial rates of collaboration than smaller provinces, as the 2012 report pointed out. For example, Ontario and Quebec had the lowest rates in 2003–2014 (15% and 17%, respectively), followed by British Columbia (23%) and Alberta (25%). At the other end of the spectrum, Northwest Territories (87%), Nunavut (86%), and Yukon (79%) exhibit high interprovincial collaboration rates (see Table 5.2).
British Columbia has the highest international rate of collaboration. Between 2003 and 2014, it published 48% of its publications with an international collaborator, followed by Quebec (44%) and Ontario (43%).
Table 5.2 Proportion of Interprovincial and International Collaboration Rates by Canadian Province and Territory, 2003–2014
Province or TerritoryCollaboration Rates 2003–2014
Interprovincial International
Alberta 24.5 42.5
British Columbia 23.0 48.2
Manitoba 33.5 39.7
New Brunswick 35.7 38.0
Newfoundland and Labrador 33.6 38.7
Northwest Territories 86.9 32.5
Nova Scotia 34.7 40.9
Nunavut 85.7 34.5
Ontario 14.8 43.4
Prince Edward Island 46.7 40.6
Quebec 16.9 43.8
Saskatchewan 33.9 41.7
Yukon 79.4 39.0
Canada* 9.8 43.7
*The interprovincial collaboration rates (IPC) are computed on whole counts, not fractional counts. So, for example, a publication with authors from four provinces would count as one for Canada and one for each of the provinces. So the IPC for the whole of Canada would be 1 out of 874,475 (Canada’s whole publication count over 2003–2014) and the IPC for Ontario (for example) would be 1 out of 396,811 (the whole count for Ontario). Therefore the interprovincial collaboration rate would be lower for Canada than for Ontario.

23International Perceptions of Canadian Research
6 International Perceptions of Canadian Research
Qualitative evidence can be a useful complement to bibliometric data in assessing research performance, especially when drawing on the insights of researchers and scientists who are highly accomplished in their fields. Similar to the 2012 S&T report, a survey was sent to the top 1% of highly cited researchers by field worldwide, asking them to identify the leading countries in their areas of expertise. The results of this survey are comparable to those from 2012 and illustrate that Canada’s international research reputation remains strong across most fields of research.
6.1 CANADA’S OVERALL RESEARCH REPUTATION
Researchers were asked to identify the top five countries in their field and sub-field of expertise. As shown in Figure 6.1, 35.5% of respondents (compared with 37% in the 2012 survey) from across all fields of research rated Canada within the top five countries in their field. Canada ranks fourth out of all countries, behind the United States, United Kingdom, and Germany and ahead of France. This represents a change of about 1.5 percentage points from the overall results of the 2012 survey. There was a three percentage point decrease in how often France is ranked among the top five countries; the ordering of the top five countries, however, remains the same.
When asked to rate Canada’s research strength among other advanced countries in their field of expertise, 72% of respondents rated Canadian research as “strong” (corresponds to a score of 5 or higher on a 7-point scale), and 47% rated it as “very strong” (Figure 6.1 and Table 6.1). These ratings increased from 68% and 42%, respectively, in the 2012 report.16
16 Survey results are weighted by country of respondent to ensure that they accurately reflect the target population of researchers. Canadian researchers are slightly over-represented among survey respondents, while Chinese researchers are slightly under-represented. This weighting compensates for that fact.
Summary•Canada’s research contributions are highly regarded
internationally according to a survey of top-cited researchers around the world. Of survey respondents, 35.5% (compared with 37% in the 2012 survey) identified Canada as one of the top five countries in their field of study.
•The share of top-cited researchers who rate Canada’s research as strong in their field of study rose from 68% in 2012 to 72% in 2016.
•The largest share of respondents identified Canada as a leading country in Visual and Performing Arts; Philosophy and Theology; Public Health and Health Services; Economics and Business; Social Sciences; Agriculture, Fisheries and Forestry; and Built Environment and Design.
•Canada’s research reputation is the weakest in core fields of the natural sciences, such as Mathematics and Statistics, Physics and Astronomy, Chemistry, and Engineering, and in Enabling and Strategic Technologies.

24 Preliminary Data Update on Canadian Research Performance and International Reputation
0 20 40 60 80 100
Percentage of Respondents
United States 94.5%
United Kingdom 72.5%
Germany 63.1%
Canada 35.5%
France 32.0%
Weak7%
About the same20%
Strong72%
Don't know1%
Data Source: Calculated by Science-Metrix using Scopus database (Elsevier)
Figure 6.1 Survey Respondents’ Rating for Canada and Top-Five Countries RankingThe figure shows the five countries most frequently identified by survey respondents (right) as leading countries in their field of research and the breakdown of how respondents rated Canada’s research performance in their field (left). “Strong” corresponds to a score of 5 or higher on a 7-point scale and “weak” corresponds to a score of 3 or lower. See Table 6.1 for the wording associated with each rating.
Table 6.1 Breakdown of Survey Respondent Ratings for Canada
Rank Description Frequency Percentage
7 Widely acknowledged to be world-leading (very strong). 824 14.9
6 Above world standards but falls short of the highest standards. 1,746 31.5
5 Generally above world standards (strong). 1,435 25.9
4 At the level of world standards (about the same). 1,089 19.6
3 Below world standards (weak). 296 5.3
2 Generally acknowledged to be below world standards. 52 0.9
1 Widely acknowledged to be below world standards (very weak). 22 0.4
Don't know. 83 1.5
Survey question: What is your opinion of Canada’s research strength in your area of expertise? Please compare with other advanced countries. Please use the following scale when rating Canada’s relative strength. (See Figure 6.1 for the scale.)

25International Perceptions of Canadian Research
6.2 INTERNATIONAL REPUTATION BY FIELD OF STUDY
Table 6.2 shows the share of top-cited researchers who identified Canada as one of the top five countries in the world in their field of research. The results are highly consistent with the 2012 survey, showing only minor changes for most fields. Canada continues to rank among the top five countries in three-quarters of the fields. Fields with smaller numbers of respondents (e.g., Visual and Performing Arts, Communication and Textual Studies) exhibited greater volatility; results from these fields should thus be interpreted with caution.
6.3 RESEARCHER FAMILIARITY WITH CANADA
The survey also asked top-cited researchers about their familiarity with Canadian research institutions and Canadian researchers (see Table 6.3). Overall, top-cited researchers may be growing more acquainted with Canadian research. The share of researchers who have worked or studied in Canada, or collaborated with Canadians, has increased since 2012, while the share with no association or who have only visited has decreased.
Table 6.2 Survey Results by Field of Study, 2012 and 2016
Field2016
Number of Responses
2016 (%)
2016 Rank
2012 (%)
2012 Rank
Visual & Performing Arts 11 92 3 55 4
Philosophy & Theology 38 72 3 79 3
Public Health & Health Services 203 58 3 58 3
Economics & Business 191 56 3 63 3
Social Sciences 249 54 3 54 3
Agriculture, Fisheries & Forestry 224 49 3 57 2
Built Environment & Design 40 36 3 29 5
Psychology & Cognitive Sciences 256 61 4 69 3
Clinical Medicine 364 42 4 43 4
Information & Communication Technologies 387 41 4 42 4
Biology 284 39 4 37 5
Earth & Environmental Sciences 413 38 4 41 4
Biomedical Research 614 35 4 37 5
Communication & Textual Studies 53 42 5 58 4
Historical Studies 66 32 5 35 5
Mathematics & Statistics 220 28 6 27 5
Physics & Astronomy 447 24 7 19 7
Engineering 623 23 7 27 7
Enabling & Strategic Technologies 442 17 8 17 8
Chemistry 422 16 8 20 7
Field ranked by 2016 rank and then by 2016 percentage.

26 Preliminary Data Update on Canadian Research Performance and International Reputation
Table 6.3 Survey Respondents’ Association with Canada
Response 2016 Frequency 2016 PercentageChange from 2012
(in Percentage Points)
No, never 1,452 26.2 -1.8
Yes, I have worked as a researcher in a Canadian university, college or government laboratory
477 8.6 0.8
Yes, I have worked as a researcher in a Canadian business 8 0.1 0.0
Yes, I have studied in Canada 79 1.4 0.3
Yes, I have collaborated with Canadian researchers 1,146 20.7 1.4
Yes, I have visited 2,358 42.5 -0.8
Don't know / No response 27 0.5 0.0
Total 5,547 100.0
Survey question: In your research career, have you visited, worked, or studied at a Canadian university or research institution, or collaborated with Canadian researchers?

27References
References
Archambault, E., Vignola-Gagné, E., Côté, G., Larivière, V., & Gingras, Y. (2006). Benchmarking scientific output in the social sciences and humanities: the limits of existing databases. Scientometrics, 68(3), 329-342.
CCA (Council of Canadian Academies). (2012a). The State of Science and Technology in Canada, 2012. Ottawa (ON): Expert Panel on the State of Science and Technology in Canada, CCA.
CCA (Council of Canadian Academies). (2012b). Informing Research Choices: Indicators and Judgment. Ottawa (ON): Expert Panel on Science Performance and Research Funding, CCA.
CCA (Council of Canadian Academies). (2013). The State of Industrial R&D in Canada. Ottawa (ON): Expert Panel on the State of Industrial R&D in Canada, CCA.
Moed, H. F. (2005). Citation Analysis in Research Evaluation. Dordrecht, The Netherlands: Springer.
OECD (Organisation for Economic Co-Operation and Development). (2016). Main Science and Technology Indicators, OECD Science, Technology and R&D Statistics (database).
Oskamp, S. & Schultz, P. W. (2005). Attitudes and Opinions. New York (NY): Psychology Press.
Statistics Canada. (2016). CANSIM Table 051-0001. Ottawa (ON): Statistics Canada.
Tourangeau, R. (2003). Cognitive aspects of survey measurement and mismeasurement. International Journal of Public Opinion Research, 15(1), 3-7.
World Bank. (2016a). Population, Total. Retrieved November 2016, from http://data.worldbank.org/indicator/SP.POP.TOTL.
World Bank. (2016b). GDP (Current US$). Retrieved November 2016, from http://data.worldbank.org/indicator/NY.GDP.MKTP.CD.
World Bank. (2016c). World Development Indicators. Washington (DC): World Bank.

Council of Canadian Academies180 Elgin St., Suite 1401Ottawa, ON K2P 2K3Tel.: 613 567-5000www.scienceadvice.ca