ii - core.ac.uk 2.2 typical sulfur compounds and corresponding refinery streams for fuels .... 6...
TRANSCRIPT


II

iii
ABDULLAH FAISAL AL-AHMADI
2013

iv
Dedication
To
My beloved family for their prayers and support and to my thesis advisor Dr. Mohammed
Al-Daous

v
ACKNOWLEDGMENTS
First of All, All thanks to Allah for favors in helping me to complete this thesis.
My deep appreciation and acknowledgments goes to thesis committee Dr. Mohammed
Abdulmajeed Al-Daous for his gaudiness and tremendous support in carrying this work.
Many thanks to Dr.Mohammed Ali Morsy and Dr. Oki Muraza for their help and comments
that improved the thesis work.
I would like to thanks the center of research excellence in nano technology (CENT) for
providing analytical support in electron microscopy. Special thanks to Dr.Abbas Hakeem
from CENT for his dedication, support, and valuable comments that influence the research
work. Also I would like to thanks Dr. Khalid AL-Majnoni from Saudi Aramco for
providing us with analytical support.
I would like to thanks my family for their support and assistant that allowed me to
concentrate on the research work.
Finally I would like to thanks King Fahd University of Petroleum and Minerals and
chemistry department for providing me with the opportunity to study master degree in
chemistry. I would also like to acknowledge King Abdulaziz City for Science and
Technology (KACST) for the support provided through the Science and Technology Unit
at King Fahd University of Petroleum and Minerals (KFUPM) for funding the work
through project No. 10-PET1394-04 as part of the National Science, Technology and
Innovation Plan.
vi
TABLE OF CONTENTS
ACKNOWLEDGMENTS .......................................................................................................................... V
TABLE OF CONTENTS ......................................................................................................................... VI
LIST OF TABLES .................................................................................................................................... IX
LIST OF FIGURES .................................................................................................................................... X
LIST OF ABBREVIATIONS .................................................................................................................. XI
ABSTRACT ............................................................................................................................................ XIII
الرسالة ملخص ............................................................................................................................................ XIV
CHAPTER 1 ................................................................................................................................................ 1
INTRODUCTION ...................................................................................................................................... 1
1.1 Research Objectives: ..................................................................................................................... 3
2 CHAPTER 2 LITERATURE REVIEW ........................................................................................ 4
2.1 Review of Hydrodesulfurization Catalysis Technologies: ................................................................. 4
2.2 Sulfur Impurities in FCC Gasoline: ................................................................................................... 5
2.3 HDS Reactivity of Sulfur Compounds:.............................................................................................. 7
2.4 Mechanism of HDS reactions: ............................................................................................................. 8
2.5 Supported Catalysts: ........................................................................................................................ 10
2.6 Carbon Support: ............................................................................................................................... 11
2.6.1 Poly Methyl Methacrylate Latex Templates: ................................................................................... 11
2.6.2Tailoring the Diameter of the Product: ............................................................................................ 11
2.6.3 Carbon Spheres: .............................................................................................................................. 12
CHAPTER 3 EXPERIMENTAL .......................................................................................................... 14

vii
3.1 Synthesis of Polymethylmethacrylate (PMMA) Dispersion: .............................................................. 14
3.1.1 Apparatus: ....................................................................................................................................... 14
3.1.2 Synthesis: ......................................................................................................................................... 14
3.2 Synthesis of Carbon Latex Using Resorcinol- Formaldehyde Resin: .................................................. 17
3.3 Synthesis of Molybdenum Sulfide MoS2/C-Oxide: ............................................................................ 17
3.4 Synthesis of Molybdenum sulfide MoS2 /C-Citrate: .......................................................................... 18
3.5 Synthesis of Cobalt promoted Molybdenum sulfide CoMoS2 /C-Citrate: .......................................... 18
3.6 Synthesis of Cobalt promoted Molybdenum sulfide CoMoS2 /C-Oxide: ............................................ 19
3.7 Synthesis of Cobalt promoted Molybdenum sulfide CoMoS2 /C-oxide- Impregnation method: ........ 19
3.8 Synthesis of Cobalt promoted Molybdenum sulfide MoS2/C- Citrate .Impregnation method: .......... 20
3.9 Sample Characterization................................................................................................................... 20
3.10 Activation of the Catalysts .............................................................................................................. 21
3.11 Activity Measurement .................................................................................................................... 21
CHAPTER 4 ............................................................................................................................................. 22
RESULTS AND DISCUSSION ............................................................................................................. 22
4.1Elemental Analysis ............................................................................................................................ 22
4.2 Electron Microscopy: ........................................................................................................................ 24
4.3 X- Ray Diffraction: ............................................................................................................................ 30
4.4 Nitrogen Adsorption/ Desorption and BET: ...................................................................................... 32
4.5 Catalysts Activity .............................................................................................................................. 37
4.5.1 Catalytic Activity of MoS2/C-Oxide: ................................................................................................. 39
4.5.2 Catalytic Activity of MoS2/C-Cit: ...................................................................................................... 41
4.5.3 Catalytic Activity of (Co)MoS2/C-Oxide: ........................................................................................... 43
4.5.4 Catalytic Activity of (Co)MoS2/C-Cit:................................................................................................ 45
4.5.5 Catalytic Activity of (Co)MoS2/C-Cit -IMP: ....................................................................................... 47
4.5.6 Catalytic Activity of (Co)MoS2/C-Oxide -IMP: .................................................................................. 49
4.6 Kinetic Treatment ............................................................................................................................. 50
4.7 Model Reaction Fitting ..................................................................................................................... 56

viii
4.8 Catalyst evaluation by desulfurization of model FCC gasoline using microreactor: ........................... 60
CHAPTER 5 ............................................................................................................................................. 64
CONCLUSION AND RECOMMENDATIONS ................................................................................. 64
5.1 Conclusion ........................................................................................................................................ 64
5.2 Recommendations: .......................................................................................................................... 65
REFERENCES ......................................................................................................................................... 66
VITAE ........................................................................................................................................................ 70

ix
LIST OF TABLES
Table 2.2 Typical Sulfur Compounds and Corresponding Refinery Streams for Fuels .... 6
Table 4.1 Elemental analysis of the Synthesized Catalysts ............................................. 23
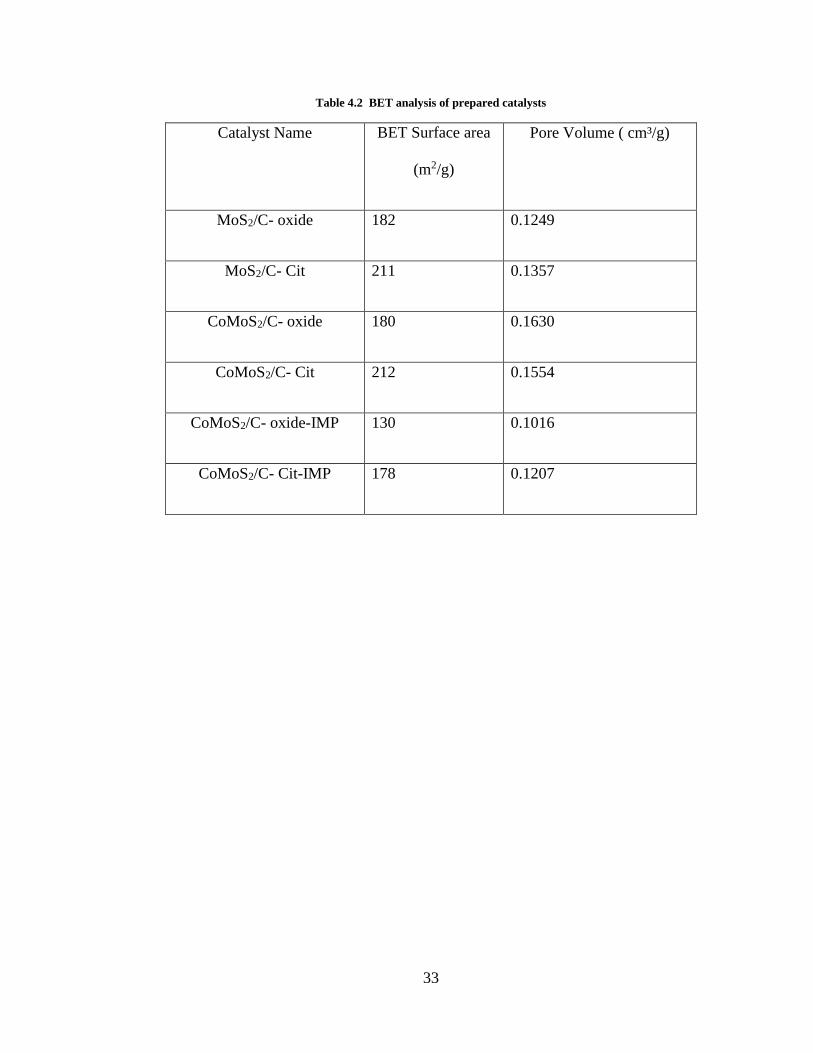
Table 4.2 BET analysis of prepared catalysts .................................................................. 33
Table 4.3 overall and individual apparent rate constants for the HDS of DBT at 320°C
(10-3/min) ......................................................................................................... 59

x
LIST OF FIGURES
Figure 2.1 Mechanism of Desulfurization of DBT and 2-Methyl Thiophene ................. 9
Figure 3.1 Five necks flask for PMMA Synthesis .......................................................... 16
Figure 4.1 PMMA Spheres ............................................................................................. 25
Figure 4.2 Hollow Carbon Sphere .................................................................................. 26
Figure 4.3 MoS2/ C- Oxide ............................................................................................. 27
Figure 4.4 MoS2C- Cit .................................................................................................... 28
Figure 4.5 TEM image of MoS2/ C- Oxide...................................................................... 29
Figure 4.6 XRD Pattern of Synthesized Catalysts ........................................................... 31
Figure 4.7 Nitrogen Adsorption/Desorption Isotherms of MoS2/C-Oxide and MoS2/C-Cit
......................................................................................................................... 34
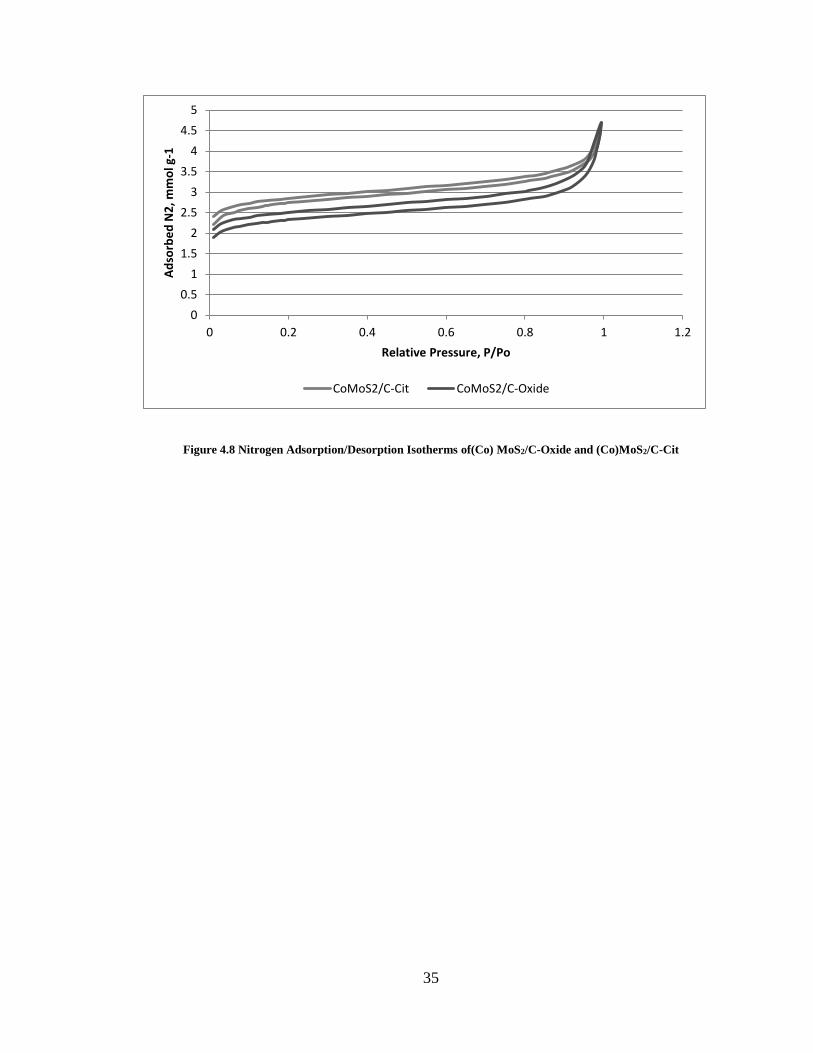
Figure 4.8 Nitrogen Adsorption/Desorption Isotherms of(Co) MoS2/C-Oxide and
(Co)MoS2/C-Cit ............................................................................................. 35
Figure 4.9 Nitrogen Adsorption/Desorption Isotherms of(Co) MoS2/C-Oxide-IMP and
(Co)MoS2/C-Cit-IMP ..................................................................................... 36
Figure 4.10 Products of HDS of DBT over MoS2/C oxide.............................................. 40
Figure 4.11 Products of HDS of DBT over MoS2/C oxide .............................................. 42
Figure 4.12 Products of HDS of DBT over (Co)MoS2/C Oxide ...................................... 44
Figure 4.13 Products of HDS of DBT over (Co)MoS2/C Oxide ...................................... 46
Figure 4.14 Products of HDS of DBT over (Co)MoS2/C-Cit-IMP .................................. 48
Figure 4.15 Proposed reaction network for the HDS of DBT .......................................... 52
Figure 4.16 Products of HDS of DBT over (Co)MoS2/C-Oxide-IMP .............................. 53
Figure 4.17 Product Selectivity vs. conversion of DBT at 320°C for CoMoS2/ C- Oxid-
IMP ............................................................................................................... 57
Figure 4.18 Pseudo-first order plot of the HDS of DBT over CoMoS2/ C- Oxide-IMP .. 58
Figure 4.19 Performance of Synthesized catalyst in hydrodesulfurization of 2-MT in
Model FCC-Gasoline .................................................................................... 62
Figure 4.20 Performance of Synthesized catalyst in hydrogenation of 2,3DM2B in Model
FCC-Gasoline ............................................................................................... 63

xi
LIST OF ABBREVIATIONS
BCH : Bicyclohexyl
BET : Brunauer–Emmett–Teller Theory
BP : Biphynel
CBCH : Concentration of BCH at a given reaction time
CBP : Concentration of BP at a given reaction time
CDBT : Concentration of DBT at a given reaction time
DBT : Dibenzothiophene
DDS : Direct Desulfurization
GC : Gas Chromatograph
HCS : Hollow Carbon Sphere
HDS : Hydrodesulfurization
HYD : Hydrogenation
k : Reaction rate constant
K : Equilibrium constant
MoSs : Molybdenum disulfide

xii
PPM : Parts Per Million
RDDS : Rate of direct desulfurization
RHYD : Rate of hydrogenation
SEM : Scanning Electron Microscopy
TEM : Transmission Electron Microscopy
THDBT : Tetra hydrogenated dibenzothiophene
XRD : X-ray diffraction

xiii
ABSTRACT
Full Name : [Abdullah Faisal Al-Ahmadi]
Thesis Title : [SYNTHESIS, CHARACTERIZATION AND EVALUATION OF
(Co)MoS2 HDS SUPPORTED ON HOLLOW CARBON SPHERE
FOR DESULFURIZATION OF THIOPHENE]
Major Field : [Chemistry]
Date of Degree : [May 2013]
Hollow carbon spheres containing varying amounts of molybdenum and cobalt with up to
18% molybdenum were synthesized. Materials were prepared using poly-
Methylmetacrylate templates to support the growth of resorcinol formaldehyde resin. The
resulting solid was calcined under nitrogen to produce hollow carbon spheres.
Supported cobalt promoted Molybdenum sulfides were synthesized using co-condensation
and impregnation of molybdenum and cobalt on the surface of hollow carbon spheres.
Scanning electron microscopy and transmission electron microscopy showed the
dispersion and of molybdenum on the surface of support and the stability of spherical
structure of hollow carbon spheres.
X-ray diffraction revealed the presence of molybdenum sulfide phase and cobalt sulfide
phase. All catalysts exhibited high activity in overall hydrodesulfurization (HDS) reaction
of dibenzothiophene (DBT). Kinetic analysis of the reaction data showed that the
contribution of direct desulfurization (DDS) route predominates over hydrogenation
(HYD) route in HDS of DBT for all catalysts.

xiv
ملخص الرسالة
عبدهللا فيصل األحمدي :االسم الكامل
تحضير و توصيف و دراسة الفاعلية تجاه اإلزالة الهيدروجينية للكبريت لحفازات كبريتيد :عنوان الرسالة الملوبدينوم المنشطة بالكوبالت و المدعومة على كريات الكربون المفرغة
الكيمياء التخصص:
3102-مايو :تاريخ الدرجة العلمية
بون الكروية المفرغة و التي تحتوي على كميات مختلفة من الملوبدينوم و تم في هذه الرسالة تحضير مركبات الكر
. تم التحضير بإستخدام البولي ميثيل ميثاكريالت كأساس لنمو مزيج %01الكوبالت بنسب وزنية مختلفة تصل إلى
ت الكربونالريسورسانول و الفورمالدهيد. تم حرق المزيج السابق في وجود غطاء من النيتروجين إلنتاج كريا
المفرغة.
تم اضافة المولبدينوم و الكوبالت على سطح كريات الكربون المفرغة بإستخدام طريقة التكثيف المشترك لمحاليل
الملوبدينوم و الكوبالت و كذلك طريقة الترسيب المباشر على سطح كريات الكربون المفرغة. تم توصيف المواد
الماسح و النفاذ و التي اظهرت توزيع المولبدينوم على السطح الداعم و كذلك المحضرة بإستخدام المجهر األلكتروني
ثبات الشكل الكروي للسطح الداعم. تم استخدام الحيود السيني الذي اثبت وجود المولبدينوم النشط و كذلك مركبات
ذج من بريت عند استخدام نموكبريتيد الكوبالت. جميع المواد الحفازة اظهرت نشاط عالي في اإلزالة الهيدروجينية للك
مركب ثنائي بنزين الكبريت. تحليل الحركية الكميائية اظهر ان ميكانيكية التفاعل يغلب عليه مسار اإلزالة المباشرة
للكبريت بدال من مسار الهدرجة في كل الحفازات المستخدمة في هذه الدراسة.
1
CHAPTER 1
INTRODUCTION
Crude oil is a complex mixture of hydrocarbons with different C/H ratio and molecular
structures. The main classes of hydrocarbon molecules are paraffins, olefins, cyclic
paraffins, aromatics, asphaltenes, and other poly-unsaturated molecules. In addition to
hydrocarbons, crude oils also contain some other compounds containing atoms other than
carbon and hydrogen (heteroatoms). Those compounds may contain sulfur, nitrogen,
oxygen, and heavy metals such as iron, nickel, and vanadium. Crude oil is usually classified
based on specific gravity as extra light, light, medium, heavy, and extra heavy. An
empirical set of units for the crude gravity, defined by the American Petroleum Institute
(API), is currently used in oil industry. Light crude oil has lower specific gravity and larger
API gravity, and the opposite for heavy crude oil. Also crude oil is classified based on the
sulfur content and composition. Sour crude oil indicates high sulfur content and sweet
crude oil indicates low sulfur content. Meanwhile, “paraffinic” crude oil is mainly
composed of paraffins, “naphthenic” for high content of cyclic paraffins, and “aromatic”
for high content of aromatic compounds [1-3].
Modern oil refinery is a complex and integrated plant. Its task is to produce more valuable
products from the supplied crude oil. The main products are liquefied petroleum gas,
transportation fuels, wax, lubricants and bitumen[1].
2
Compliance with the environmental regulations regarding the quality of transportation
fuels and emission is a major issue. The main objective of environmental regulations
proposed by environmental protection agency (EPA) and European Parliament is to reduce
the sulfur content of fuel to less than 10 ppm by 2009 and further to nearly zero in the
future. Since gasoline, diesel and non-transportation fuels represent 75-80% of overall
refinery products, these regulations will have significant impact on refinery operation.
Another major issue is the declining quality of crude oil supplies. Heavy and sour crude
became the dominant type in the crude oil market. This added more pressure on refineries
to meet the products specifications based on poor feedstock[1-3].
Hydrotreating and hydrodesulfurization (HDS) of middle distillate streams are required to
achieve the desired specifications. Among several approaches that have been made, the
development of more active and stable catalyst is favored. The typical catalyst used for
hydrodesulfurization in most refineries is based on transition metal sulfides supported on
alumina and it is known as conventional HDS. However conventional HDS ability to
remove sulfur from the least reactive thiophenes is limited. This issue derived the refiners
to implement more advanced hydrodesulufrization process and/or implement more
treatment processes[3-4].
A large number of researches in recent years focused on finding more effective catalysts
for desulfurization of least reactive sterically hindered alkylthiophene, dibenzothiophene
and alkylated dibenzothiophene. Interesting results regarding catalytic activity of new
phases such as carbides, phosphides and nitrides were observed. However, sulfide based
formulations consists of molybdenum sulfide with or without promoting metals, such as
cobalt, nickel, supported on alumina appear to be the most promising catalyst[5-6].

3
Gasoline is produced by blending the straight run naphtha from the distillation units and
naphtha from fluid catalytic cracking unit (FCC). Most sulfur come with FCC product
stream. So the treatment of FCC gasoline is critical. Another issue to considered regarding
FCC gasoline is the fact that olefins is the major contributor to the octane number of FCC
gasoline. However, desulfurization process leads also to reduction in olefins content and
lead to loss of octane number. For this reason, an effective catalyst for desulfurization of
FCC gasoline should exhibit a minimum hydrogenation of olefins[7].
1.1 Research Objectives:
The following are the objectives of the thesis:
1- To synthesize a supported (Co)MoS2 catalyst on hollow carbon spheres.
2- To characterize the catalyst in order to ascertain the chemical and morphological
properties.
3- To evaluate the activity of the catalyst on hydrodesulfurization (HDS) of
Dibenzothiophen(DBT) and 2-Methyl Thiophene
4
2 CHAPTER 2
LITERATURE REVIEW
2.1 Review of Hydrodesulfurization Catalysis Technologies:
In order to meet the growing demand for ultra-low sulfur fuel and comply with strict
environmental regulations, a number of new concepts and technologies have been
developed in the last 20 years in addition to the choice of revamping the conventional
hydrotreating units. It has reported that most of hydro treating units were installed to
meet the 1993 low sulfur content (500 ppm) can be revamped for ultra-low sulfur fuel (10
ppm) production with acceptable increase in operational cost. Several options such as
variation of process conditions and finding more soft oil feed have been explored. Also
the use of highly active new catalyst was given a lot of importance[7].The use of highly
active catalyst can improve the performance of existing hydrodesulfurization units.
New catalysts have been developed by major companies. Cosmo oil developed C-606A
with 3 times higher HDS activity compared to the conventional CoMo/Al2O3 [8].
Akzo Nobel came up with STARS catalyst series, which show almost double HDS rate.
In recent time, Akzo Nobel offered a new catalyst known as NEBula. It is made of
unsupported bulk sulfides of group VIII and VI metals and provided increased HDS
reactivity by four folds.

5
Topøse developed a series of catalyst , TK-573, TK-574, TK911 and TK-915, which not
only developed the desulfurization activity, but also talked density and aromatics reduction
Topøse also developed a new catalyst preparation technology BRIM, giving highly active
hydrogenation catalysts. BRIM not only optimize the hydrogenation site, but also increase
type II activity sites for direct desulfurization. The first two commercial catalysts based on
the BRIM technology were Topøse TK-558 BRIM (CoMo) and TK-559 BRIM ( NiMo)
for FCC pretreatment service. This was followed by a series of new high performance
catalysts TK-575 BRIM ( NiMo), TK-576 BRIM (CoMo), and TK-605 BRIM
catalyst for ultra-low sulfur diesel production and for hydrocracker feed pretreatment[9].
Research in developing high performance catalysts will continue to play a key role on
achieving the clean fuel requirements.
2.2 Sulfur Impurities in FCC Gasoline:
3 The main sulfur components of FCC gasoline are thiols, sulfides, thiophene and
alkylthiophenes, tetrahydrothiophene, thiophenols and benzothiophene
Alkylthiophenes which are typically in the boiling range of gasoline include three and
four carbon atoms-substituted thiophenes (C3- and C4-thiophenes). Recent data
reported by Xia and coworkers confirm that thiophene sulfur represents a large fraction
of the total sulfur content in FCC gasoline (60 wt.% and over). By using gas
chromatography they detected more than 20 different kinds of thiophenes among which
a certain number (di- and trimethyl-, ethyl-, ethylmethyl-, di- and triethyl-, iso-propyl-
, tertiobutyl-) could be identified by GC/MS analysis [3].

6
4
Table 2.1: Typical Sulfur Compounds and Corresponding Refinery Streams for Fuels
Sulfur compounds Refinery streams Corresponding fuels
Mercaptanes, RSH; sulfides, R2S;
disulfides,
RSSR; thiophene (T) and its alkylated
derivatives, benzothiophene
SR-naphtha; FCC
naphtha;
coker naphtha
Gasoline (BP range: 25–225 °C)
Mercaptanes, RSH; benzothiophene
(BT),
alkylated benzothiophenes
Kerosene; heavy
naphtha;
middle distillate
Jet fuel (BP range: 130–300 °C)
Alkylated benzothiophenes;
dibenzothiophene
(DBT); alkylated dibenzothiophenes
Middle distillate; FCC
LCO;
coker gas oil
Diesel fuel (BP range: 160–380
°C)
Greater than or equal to three-ring
polycyclic
sulfur compounds, including DBT,
benzonaphthothiophene (BNT),
phenanthro[4,5-b,c,d]thiophene (PT)
Heavy gas oils; vacuum
gas
oil; distillation resides
Fuel oils (non-road fuel and
heavy oils)
5

7
2.3 HDS Reactivity of Sulfur Compounds:
It has been established by several research studies that the relative reactivates of thiopene
based sulfur compounds are significantly different [10-12]. This could be attributed to the
conjugative interaction between the lone pair of electrons on sulfur atom and the π- system
of aromatic ring. The reactivity of sulfur compounds in HDS follows this order (from most
to least reactive): thiophene > alkylated thiophene > BT > alkylated BT > DBT and
alkylated DBT without substituents at the 4 and 6 positions > alkylated DBT with one
substituent at either the 4 or 6 position > alkylated DBT with alkyl substituents at the 4 and
6 positions. This trend has been attributed to the steric hindrance of the substituent alkyl
group which prevents interaction between sulfur atom and the catalytic active site[12]. Also
the electronic inductive effects between the alkyl groups on the ring and sulfur atom enrich
the electron density on the sulfur.
8
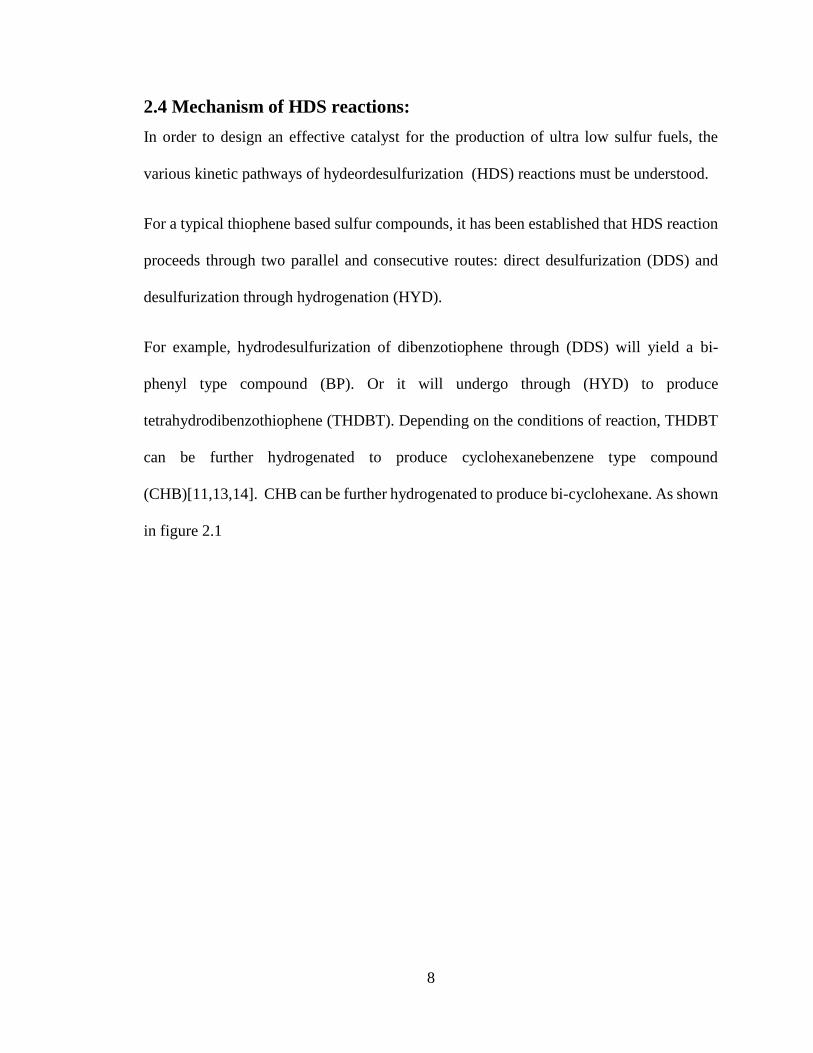
2.4 Mechanism of HDS reactions:
In order to design an effective catalyst for the production of ultra low sulfur fuels, the
various kinetic pathways of hydeordesulfurization (HDS) reactions must be understood.
For a typical thiophene based sulfur compounds, it has been established that HDS reaction
proceeds through two parallel and consecutive routes: direct desulfurization (DDS) and
desulfurization through hydrogenation (HYD).
For example, hydrodesulfurization of dibenzotiophene through (DDS) will yield a bi-
phenyl type compound (BP). Or it will undergo through (HYD) to produce
tetrahydrodibenzothiophene (THDBT). Depending on the conditions of reaction, THDBT
can be further hydrogenated to produce cyclohexanebenzene type compound
(CHB)[11,13,14]. CHB can be further hydrogenated to produce bi-cyclohexane. As shown
in figure 2.1
9
Figure 2.1 Mechanism of Desulfurization of DBT and 2-Methyl Thiophene

10
2.5 Supported Catalysts:
The active phase in a HDS catalyst is usually deposited on the surface of another martial
called support. The support material usually provides a high surface area to maximize the
active phase dispersion and to provide mechanical strength to the catalyst. Common
supports used are Al2O3 , ZrO2 ,TiO2, SiO2, Zeolites and carbon material. Alumina is the
most widely used support material in industry because of its favorable chemical, physical,
and mechanical properties on one hand and its availability and cost on the other hand[15].
For several decades, CoMo and NiMo/alumina have been used in industrial refining plants
as HDS catalyst. Since the proposal of Topsøe and coworkers, there has been a growing
interest in CoMoS and NiMoS phases, in which Co or Ni decorate the edge sites in CoMo
and NiMo sulfide catalysts and many spectroscopic aspects have been interpreted based on
this model. Topsøe differentiated between CoMoS phases, Type I and Type II, depending
on their HDS activity. CoMoS Type II, which formed by high temperature sulfidation 600-
1000 Co, was about twice as active as Type I, which formed by sulfidation at 400 Co[16]
It has also been reported by several authors that variation of the support influences the
electronic and catalytic properties of supported CoMo and NiMo sulfide catalysts. This is
because the changes in support lead to variation a in active phase support interaction that
influences the dispersion and morphology of active-phase components. The strength of
interaction between the active metals and support affects the reducibility and sulfidabilty
of active phase. For example, studies have shown strong interaction between molybdate
and the alumina support lead to formation of Mo-O-Al linkage after sulfidation. This mean
a further increase in HDS activity of supported sulfide catalysts can be achieved by
changing the support[17-20].

11
The development of new supports has received great attention because of the need to
develop better HDS catalysts .TiO2, ZrO2, SiO2, Zeolites, and carbon materials of high
surface area and good properties have been developed and tested. TiO2 and ZrO2 supported
MoS2 catalyst shown three to five times respectively higher hydrodesulfurization and
hydrogenation activity than alumina supported one with an equivalent Mo loading per
nm2[21].
2.6 Carbon Support:
2.6.1 Poly Methyl Methacrylate Latex Templates:
Poly(methyl methacrylate) used as sacrificial template to synthesis the carbon hollow
spheres. poly(methyl methacrylate) (PMMA) latex spheres were synthesized according to
published methods[22-23].
2.6.2Tailoring the Diameter of the Product:
Four factors influence the size of the latex spheres produced in this synthesis: the
concentration of the monomer, the concentration of the initiator, the ionic strength of the
reaction mixture, and the reaction temperature. Increasing the monomer concentration or
the ionic strength increases the diameter of the particles produced; increasing the
concentration of the initiator or the reaction temperature decreases the diameter.
The ionic strength is increased by adding a monovalent, water-soluble salt, most commonly
sodium chloride. The maximum ionic strength is about 2x10⁻². Increasing the ionic strength
further causes the latex to coagulate during the reaction. For potassium persulfate-initiated
polymerization, the effect of initiator concentration on particle size is effectively canceled
out by a concurrent increase in ionic strength of the reaction medium.

12
Goodwin et al. parameterized the relationship between size and reaction variables for the
formation of PS latex spheres A least-squares fit to the data given by Tanrisever et al.
allowed the parameters for PMMA spheres to be determined as well. The general
equation and parameters for PS and PMMA spheres predicts the final size of the spheres
within 10% error for PMMA. Based on experiment, the equation is valid for PMMA
sphere diameters between 80 nm and 450 nm. The range of temperature at which the
reaction has been carried out successfully (i.e., reactions that have produced uniform
sphere diameters) is 55-90 C. Attempts to produce spheres outside of these ranges
resulted in non-uniform diameters or coagulation of the mixture[22-24].
2.6.3 Carbon Spheres:
In the past decades, carbon materials experienced great development because of their
potential applications in energy storage and conversion, adsorption, catalysis, and other
applications. It has been possible to synthesize carbon materials with defined
nanostructure and morphology, tunable surface area, and pore volume. For convenience,
these materials are grouped into four categories: 0D quantum dots and spheres; 1D fiber,
tubes, and wires; 2D films and membranes; and 3D structure of Diamond. Carbon
spheres are usually prepared by carbonization of polymer precursors. In this case,
polymer precursors are required to be thermally stable and are able to form carbon
residue after a high-temperature pyrolysis. Phenolic resins, derived from the
polymerization of phenols (phenol, resorcinol,) with aldehyde (e.g., formaldehyde), are
attractive because of their excellent performance characteristics such as high-temperature
resistance, thermal abrasiveness, and high yield of carbon conversion [25].

13
Carbon spheres can be synthesized by different methods such as hydrothermal, self-
assembly and templating method. Templating is considered to be the most
straightforward way to create hollow sphere structure. Soft templating , using surfactant
or polymer precourceor, and hard templating, using different solid core such as silica or
iron, were used to synthesize hollow carbon spheres[25-26].

14
CHAPTER 3
Experimental
3.1 Synthesis of Polymethylmethacrylate (PMMA) Dispersion:
3.1.1 Apparatus:
A schematic of the apparatus used to make the latex is shown in Figure 3.1. It consisted of
a five-neck, 2-L round-bottom flask which sat in mantle heating well. A 44-cm long, 1-cm
wide, polished glass shaft supported by a lubricant-free Teflon Trubore bearing with a glass
thread adapter is fed through the center neck of the flask. Inside the reaction vessel, a 75-
mm long, crescent-shaped PTFE blade was attached to the shaft. A variable-speed motor
was coupled to the glass shaft through fitted rubber vacuum tubing and rotated the blade
assembly at rates up to 800 rpm. During a typical polymer synthesis, the mixing blade was
spun at 300-500 rpm. The rotational frequency was calibrated with a strobe light.
Nitrogen gas was bubbled through a Pasteur pipette. The pipette was held in place by a
rubber, one-hole stopper placed in one of the necks of the reaction flask. The tip of the
pipette was inserted below the surface of the liquid to displace dissolved oxygen in the
reaction mixture and to blanket the reaction in inert gas. A clean, new pipette was used for
each synthesis.
3.1.2 Synthesis:
Mono dispersed poly-methylmethacrylate spheres were synthesized via emulsifier-free
emulsion polymerization of methyl-methacrylate in water as solvent and under nitrogen
15
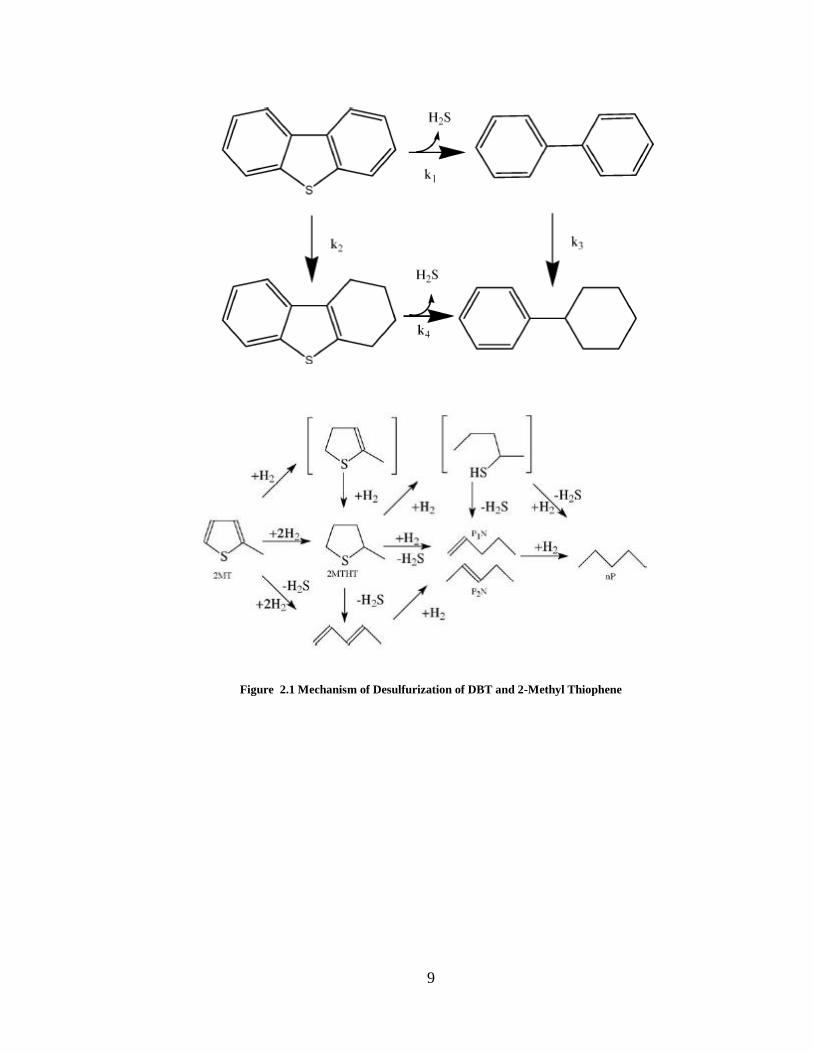
blanket to establish inert atmosphere. Four batches of PMMA prepared by adding a
measured volumes of MMA and double distilled water is added to prepare a 2000ml
solution. Initially, the solution is stirred and heated to 70Co under nitrogen atmosphere for
one hour to remove the inhibitor from commercial MMA. Then 0.5 g of initiator, (2.2-
Azobis(2-methyl) propionamidine) dihydrochloriden97%, was added to MMA solution.
The solution kept stirring at 70Co for three hours until the completion of polymerization
reaction.
Sample was taken from the polymerization product and dried to calculate the percentage
of solid in polymer solution. The resulted solid concentration were (4.367, 6.48, 8.96, 18.6
%) respectively.

16
Figure 3.1 Five necks flask for PMMA Synthesis

17
3.2 Synthesis of Carbon Latex Using Resorcinol- Formaldehyde Resin:
12.9 g of para-formaldehyde was dissolved in 100 ml water. Subsequently, 193 g of PMMA
latex dispersion (18.6%) was added. The mixture was stirred at 50Co for 24 hours. The
solution was then allowed to cool to room temperature and an extra 100 ml of distilled
water was added. Then 0.52g of diaminohexane was added to the previous solution and
stirred at room temperature for 15 min to reach pH 9.4. 22.5 g of resorcinol dissolved in
40 ml distilled water was added to the previous solution and stirred for 15 min at room
temperature. The dispersion sealed and stirred at 85 Co for 18 hours. The dispersion was
then allowed to cool to room temperature, filtered and dried at 100 Co for 24 hours. The
resulted solid was calcined under nitrogen at 330°C for 2 h using a ramp step of 5°C per
min, then increased to 500 Co for 4hou h using a ramp step of 5°C per min.
3.3 Synthesis of Molybdenum Sulfide MoS2/C-Oxide:
7.197 g of molybdenum oxide (MoO3) was dissolved in 15 ml 37% HCl and heated
overnight at 85Co in a sealed flask. The resulted solution allowed cooling to room
temperature. 25 ml of water and 10 ml of ethanol were added to the metal solution. 3.5 g
of PMMA- RF solid was socked with the above solution. Then filtered using vacuum
filtration and dried at 85Co for 24 hours. The dried sample then calcined under nitrogen at
330°C for 2 h using a ramp step of 2°C per min, then increased to 500 Co for 4hour using
a ramp step of 2°C per min.Then the sample was sulfided under 10%H2S balanced with
hydrogen at 375Co for 2 hours using a ramp step of 5 Co/ min. The molybdenum content
was 18.87wt% using EDS.

18
3.4 Synthesis of Molybdenum sulfide MoS2 /C-Citrate:
8.827 g of (NH4 )Mo7O24.6H2O) and 10.52 g of citric acid were dissolved in 50 ml solution
of 40 ml water and 10 ml ethanol. 3.5 g of PMMA- RF solid was soaked in the above
solution, filtered using vacuum filtration and dried at 85Co for 24 hours. The dried sample
was calcined under nitrogen at 330°C for 2 h using a ramp rate of 2°C per min, then
increased to 500 Co for 4hour using a ramp step of 2°C per min. The sample was then
sulfided under 10%H2S balanced with hydrogen at 375Co for 2 hours using a ramp step of
5 Co/ min. The molybdenum content was 12.05 wt% measured by EDS.
3.5 Synthesis of Cobalt promoted Molybdenum sulfide CoMoS2 /C-
Citrate:
6.7904 g of (NH4Mo7O24.6H2O) , 3.358g of Co(NO3)2.6 H2O, and 10.52 g of citric acid
were dissolved in 50 ml solution of 40 ml water and 10 ml ethanol. 3.5 g of PMMA- RF
solid was socked with the above solution. Then filtered using vacuum filtration and dried
at 85Co for 24 hours. The dried sample then calcined under nitrogen at 330°C for 2 h using
a ramp step of 2°C per min, and then increased to 500 Co for 4hour using a ramp step of
2°C per min. Then the sample was sulfided under 10%H2S balanced with hydrogen at
375Co for 2 hours using a ramp step of 5 Co/ min. The molybdenum and cobalt contents
were 4.78 wt% and 0.84 wt% respectively using EDS

19
3.6 Synthesis of Cobalt promoted Molybdenum sulfide CoMoS2 /C-
Oxide:
5.5362 g of molybdenum oxide (MoO3) was dissolved in 20 ml 37% HCl and heated
overnight at 85Co in a sealed flask. The resulted solution was allowed to cool to room
temperature. Adding 3.358 g of Co(NO3)2.6 H2O, to above molybdenum solution and
heated with stirring for 24 hours at 85 Co in a sealed flask . Once, allowed to cool to room
temperature, 20 ml of water and 10 ml of ethanol were added to the solution, followed by
soaking 3.5 g of PMMA- RF in the above solution. Then filtered using vacuum filtration
and dried at 85Co for 24 hours. The dried sample then calcined under nitrogen at 330°C for
2 h using a ramp rate of 2°C per min, and at 500 Co for 4hour using a ramp rate of 2°C per
min. The sample was then sulfided under 10%H2S balanced with hydrogen at 375Co for 2
hours using a ramp rate of 5 Co/ min. The molybdenum and cobalt contents were measured
to be14.32 wt% and 1.65wt% respectively using EDS.
3.7 Synthesis of Cobalt promoted Molybdenum sulfide CoMoS2 /C-oxide-
Impregnation method:
In order to achieve the targeted mole ratio of 1 mol Mo: 0.3 mol Cobalt, 1.202g of Co
(NO3)2.6 H2O was dissolved in a mixture of 5 ml water and 7 ml methanol. 7 g of MoS2/C-
oxide base was soaked in the cobalt solution, mixed well and dried at 100Co for 24 hours.
Then the dried sample was sulfided under 10%H2S balanced with hydrogen at 375Co for 2
hours using a heating rate of 5 Co/ min.

20
3.8 Synthesis of Cobalt promoted Molybdenum sulfide MoS2/C- Citrate
.Impregnation method:
In order to achieve the targeted mole ratio is 1 mol Mo: 0.3 mol Cobalt, 0.5483g of Co
(NO3)2.6 H2O was dissolved in a mixture of 5 ml water and 7 ml methanol. 5 g of
MoS2/C –Citrate was soaked in the cobalt solution, mixed well and dried at 100Co for 24
hours. Then the dried sample was sulfided under 10%H2S balanced with hydrogen at
375Co for 2 hours using a heating rate of 5 Co/ min.
3.9 Sample Characterization
Field Emission Scanning Electron Microscopy: The morphology of samples was
investigated using scanning electron microscopy. energy dispersive spectroscopy(EDS)
was used to determine the composition of samples for carbon, sulfur, cobalt and
molybdenum content.
N2 Adsorption/Desorption Isotherm and BET : Nitrogen adsorption/desorption
isotherms were acquired using Quantachrom Autosorb-1c . Specific surface area was
calculated using BET method and pore size distributions were calculated by BJH method
and using the desorption branch of the isotherm.
XRD: The x-ray powder diffraction patterns (XRD) were collected on a diffractometer
using the Cu Kα line for wide angle in the 2θ range. The XRD data were recorded in the
2θ range from 5 to 80 with a step size of 0.02 with nλ= 2dSinθ.

21
3.10 Activation of the Catalysts
Before the catalytic activity tests, the catalysts were sulfided ex situ in a tubular furnace at
375°C for 2 hours in a stream of 10% H2S in a balanced H2. The presulfiding step is
necessary to convert the catalyst from oxide form to sulfide form, which is the active phase
of the conventional reaction system. The sulfided catalyst was transferred quickly into the
batch reactor containing the feed.
3.11 Activity Measurement
Activity measurement was done by carrying out reactions in a 250ml autoclave stirred
batch reactor 320Co. In a typical reaction, 120ml of the feed (about 4000 ppm DBT in
decane) was charged into the reactor with 0.5g of the sulfided catalyst. The system was
pressurized with nitrogen in order to detect any leak and it was later purged three (3) times
with hydrogen. Subsequently, the hydrogen pressure was adjusted to 4MPa and the stirring
rate was 500rpm. The reaction system was heated to the desired temperature and allowed
to proceed for 3hours. During the reaction, liquid samples of 3-5ml were withdrawn at 15
minutes intervals for 2 hours, then every30 minute in the third hour. Liquid samples were
analyzed with Agilent gas chromatograph fitted with capillary HB1 column and fitted with
both FID and SCD detectors. These results were used in the kinetic study.
Also the activity measurement was done by carrying out reactions in microreactor with a
continuous flow of FCC model Gasoline. The FCC model Gasoline was formulated as
follow: ( 3% 2-Methyl Thiophene, 20% 2,3 di methyl but2-ene, 40% o-xylene 47% n-
heptane.

22
CHAPTER 4
Results and Discussion
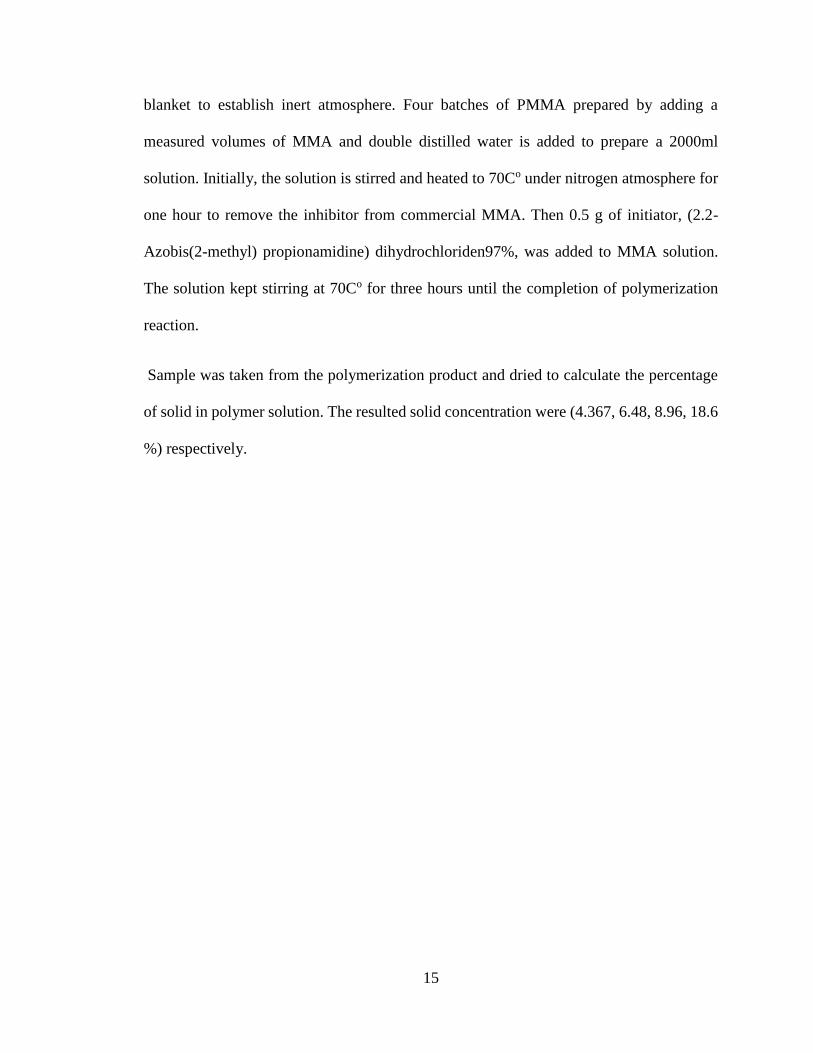
4.1Elemental Analysis
The samples were analyzed to determine the content of molybdenum, cobalt, sulfur, carbon
and oxygen. The higher loading of molybdenum is desired in order have a maximum
possibility of MoS2 active phase. Catalysts synthesized through oxide route exhibited a
higher metals loading than citrate route catalysts. These results are unexpected since citrate
complex tends to improve the wettability of metals and carbon surface[31]. But from the
SEM images, the citrate catalysts exhibited excessive nicking, which indicate that citric
acid worked also as carbon precursor and metals in citrate complex are buried under the
carbon layer formed by citrate complex. The elemental analysis results using Energy
Dispersal Spectroscopy (EDS) are listed in table 4.1.
23
Table 4.1 Elemental analysis of the Synthesized Catalysts
Catalyst Name C wt % O wt% S wt% Mo wt% Co
wt%
MoS2/C- oxide 60 13.96 7.70 18.34 0
MoS2/C- Cit 66.49 10.58 10.28 12.66 0
CoMoS2/C- oxide 56.89 9.93 10.98 17.51 4.68
CoMoS2/C- Cit 68.44 8.84 9.14 11.31 2.28
CoMoS2/C- oxide-
IMP
57.41 12.09 10.51 18.14 0.68
CoMoS2/C- Cit-IMP 58.32 9.64 10.01 11.85 2.81

24
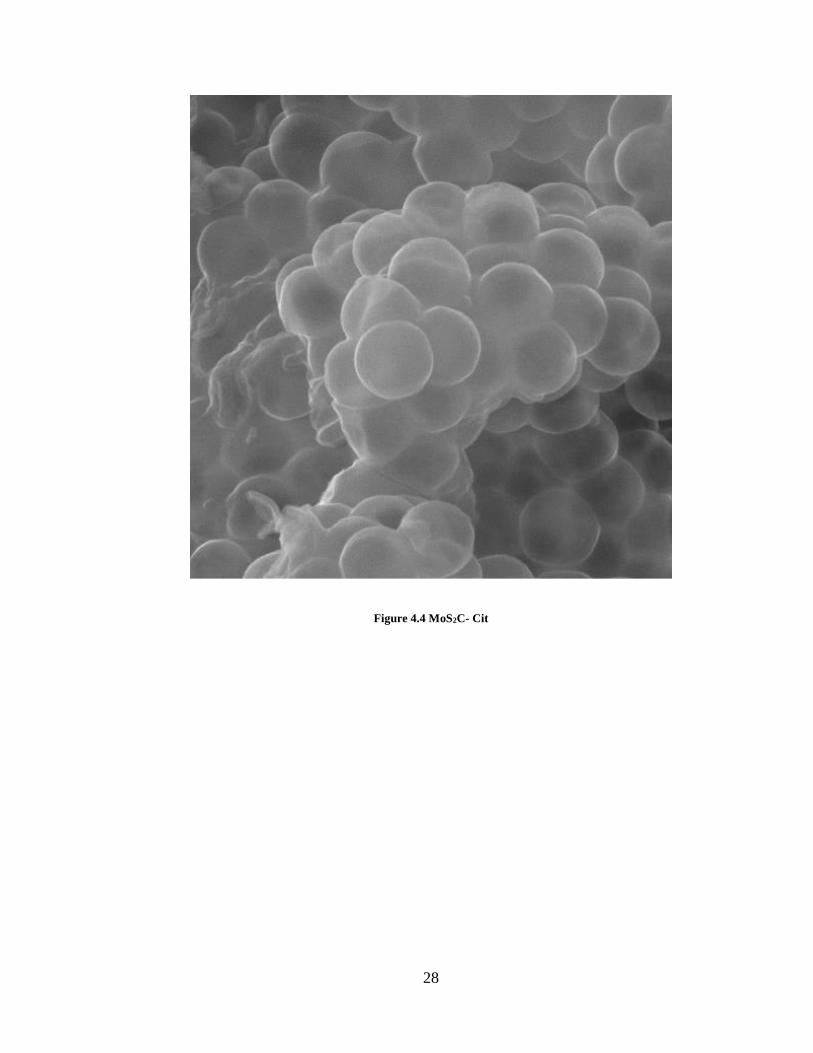
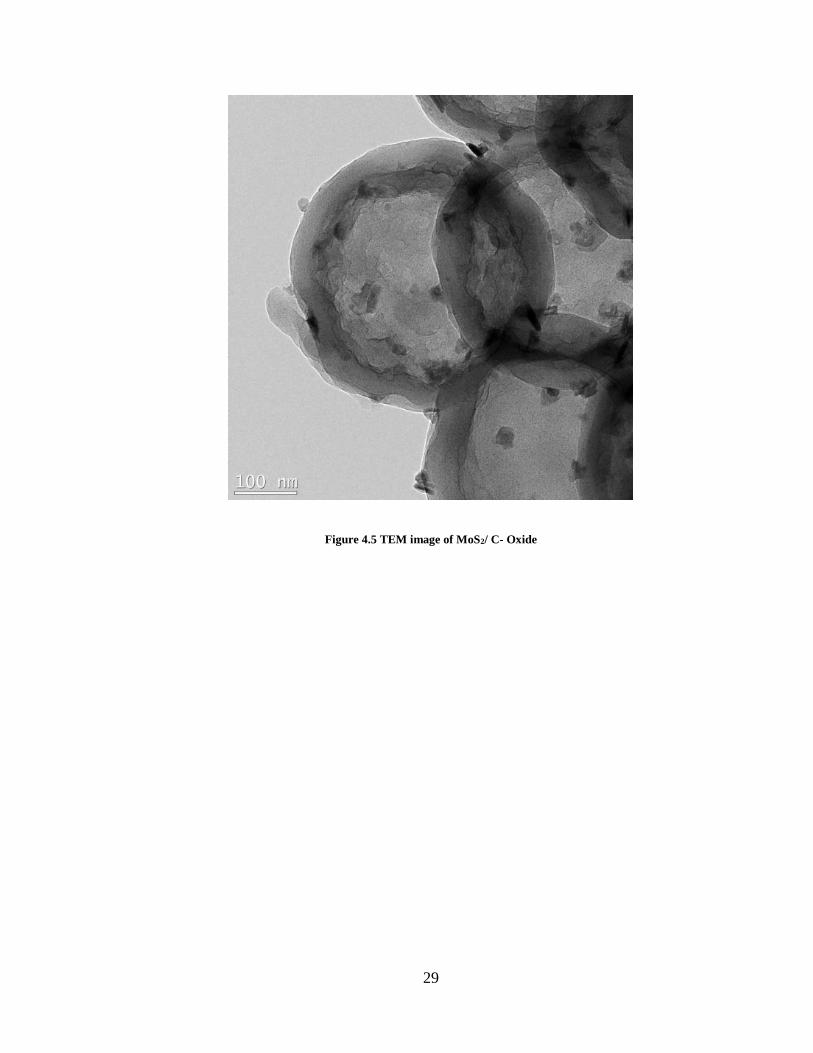
4.2 Electron Microscopy:
The purpose of pursing scanning Electron Microscopy (SEM) and transmission electron
microscopy (TEM) is to examine the morphology of the material. SEM analysis is
important to determine if there is a nicking between the carbon sphere or not. Also to find
the extent of deformation of the hollow carbon spheres. TEM used to observe the dispersion
and shape of active metals on the surface of carbon sphere.
The pure hollow carbon sphere showed a high degree of dispersion and undamaged
spherical structure and so on in case of MoS2/ C- Oxide, See figure 4.3. However, MoS2C-
Cit shows a high degree of nicking, see figure 4.4. This is evidence that citric acid is
absorbed between RF-PMMA sphere and act as additional source of carbon that lead to
excessive nicking.

25
Figure 4.1 PMMA Spheres

26
Figure 4.2 Hollow Carbon Sphere

27
Figure 4.3 MoS2/ C- Oxide
28
Figure 4.4 MoS2C- Cit
29
Figure 4.5 TEM image of MoS2/ C- Oxide

30
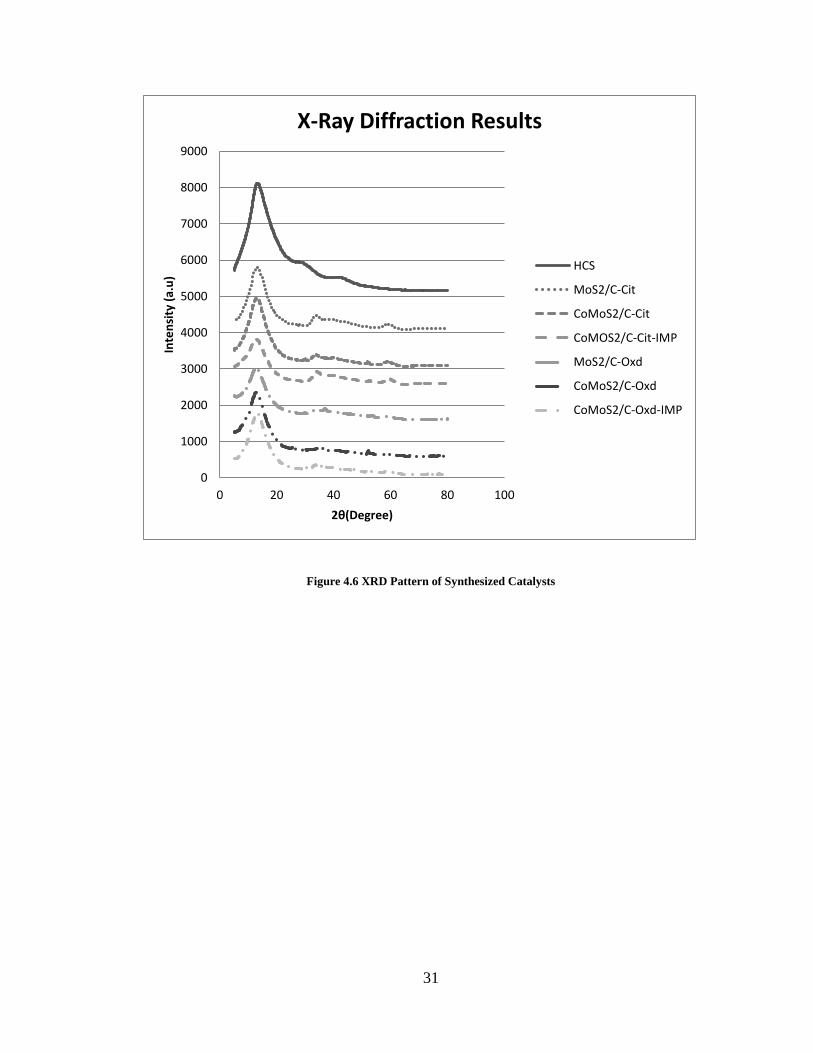
4.3 X- Ray Diffraction:
In the wide angle region where Mo sulfide peaks are expected, intense peak near 14 (2θ)
indicate the 002 plane, which is the active phase in hydrodesulphurization.
At 33, 40 and 56 there are peaks for 100, 103, and 110 plans that indicate stacking of MoS2
Layers. In promoted catalysts, there are additional peaks for Cobalt sulfide phases Co9S8 .
The peaks for Co9S8 indicate the phase separation of cobalt hence not promoted the
molybdenum sulfide phase. Catalysts synthesized through citrate route show broad and
larger peaks of molybdenum sulfide, which indicates larger crystal size and stacking. Also
the peaks of Co9S8 are less intense in citrate based catalysts. This indicates less phase
separation comparing with catalysts synthesized through oxide route [31]
31
Figure 4.6 XRD Pattern of Synthesized Catalysts
0
1000
2000
3000
4000
5000
6000
7000
8000
9000
0 20 40 60 80 100
Inte
nsi
ty (
a.u
)
2θ(Degree)
X-Ray Diffraction Results
HCS
MoS2/C-Cit
CoMoS2/C-Cit
CoMOS2/C-Cit-IMP
MoS2/C-Oxd
CoMoS2/C-Oxd
CoMoS2/C-Oxd-IMP
32
4.4 Nitrogen Adsorption/ Desorption and BET:
Nitrogen adsorption and desorption used to identify the porosity of sample and its size
distribution. BET aims to explain the physical adsorption of gas molecules on
a solid surface and serves as the basis for an important analysis technique for the
measurement of the specific surface area of a material. The nitrogen isotherm curve( See
Figures 4.7, 4.8 4.9) is a typical shape of type III isotherm that indicate a formation of
multilayers of adsorbed gas on the surface . All catalysts show same shape except the
(Co) MoS2/C-Oxide, which shows stronger adsorption capacity. The BET analysis (Table
4.2) show higher surface area for citrate based catalysts. This is an evidence of added
micro porosity because of nicking; also the results of pore volume are aligned with BET
trend.
33
Table 4.2 BET analysis of prepared catalysts
Catalyst Name BET Surface area
(m2/g)
Pore Volume ( cm³/g)
MoS2/C- oxide 182 0.1249
MoS2/C- Cit 211 0.1357
CoMoS2/C- oxide 180 0.1630
CoMoS2/C- Cit 212 0.1554
CoMoS2/C- oxide-IMP 130 0.1016
CoMoS2/C- Cit-IMP 178 0.1207

34
Figure 4.7 Nitrogen Adsorption/Desorption Isotherms of MoS2/C-Oxide and MoS2/C-Cit
0
0.5
1
1.5
2
2.5
3
3.5
4
4.5
0 0.2 0.4 0.6 0.8 1 1.2
Ad
sorb
ed
N2
, mm
ol g
-1
Relative Pressure, P/Po
MoS2/C-Oxd MoS2/C-Cit
35
Figure 4.8 Nitrogen Adsorption/Desorption Isotherms of(Co) MoS2/C-Oxide and (Co)MoS2/C-Cit
0
0.5
1
1.5
2
2.5
3
3.5
4
4.5
5
0 0.2 0.4 0.6 0.8 1 1.2
Ad
sorb
ed
N2
, mm
ol g
-1
Relative Pressure, P/Po
CoMoS2/C-Cit CoMoS2/C-Oxide

36
Figure 4.9 Nitrogen Adsorption/Desorption Isotherms of(Co) MoS2/C-Oxide-IMP and (Co)MoS2/C-Cit-IMP
0
0.5
1
1.5
2
2.5
3
3.5
4
0 0.2 0.4 0.6 0.8 1 1.2
Ad
sorb
ed
N2
, mm
ol g
-1
Relative Pressure, P/Po
CoMoS2/C-Cit-IMP CoMoS2/C-Oxide-IMP

37
4.5 Catalysts Activity
Six catalysts were synthesized using different precursors and synthesis routes in order to
find the optimum catalyst for HDS of thiophenes. The catalysts are :
MoS2 / C- Oxide
MoS2 / C- CIT
CoMoS2 / C- Oxide
CoMoS2 / C- CIT
CoMoS2 / C- Oxide- IMP
CoMoS2 / C- CIT- IMP
MoS2 / C were synthesized from molybdenum oxide or molybdenum citrate solutions. The
reason is that citrate complex is hydrophobic and it is favored for bimetal system [31]
Molybdenum sulfide catalysts were promoted with cobalt because it enhance the HDS
activity of molybdenum sulfide catalysts by modifying the structure of active site and
reduction in the required binding energy of thiophenes with active sites [32]. The activity
of synthesized catalysts in the hydrodesulfurization (HDS) of dibenzothiophene (DBT) was
studied using 4000ppm DBT dissolved in decane. The reaction was carried out at 320°C
in stirred autoclave reactor at 4 MP pressure of Hydrogen for 3 hours. The yield versus
percent of conversion of each catalyst in the hydrodesulfurization (HDS) of
dibenzothiophene (DBT) are shown in figures 4.8 and 4.9. The reactions products are
cyclohexylbenzene (CHB), biphenyl (BP) and tetrahydrodibenzothiophene (THDBT). In
all the catalysts the yield of BP is generally higher than that of the CHB. Since it has already
been established that BP is usually a product of direct desulfurization of DBT while CHB
results from subsequent hydrogenation of partially hydrogenated DBT or BP, the

38
preponderance of BP over CHB is an early hint for the preference of these catalysts for
DDS route. The yield of THDBT is generally increases to maximum and then decrease
with reaction time indicating its intermediate.
0.02-0.03 g of elemental copper was added to the reaction vessel in order to scavenge H2S
and to minimize the inhibition effect of hydrogen sulfide (H2S) because it found to suppress
the reaction apparent rate of DDS route in the HDS of DBT [33].
39
4.5.1 Catalytic Activity of MoS2/C-Oxide:
0.505g of MoS2/C-Oxide and 0.029g of copper were add to 120 ml of decane solution
containing 4000ppm DBT. The reaction mixture was pressurized to 4 MP and then heated
to 320 oC. Samples were collected every 15 minutes in first two hours then every 30
minutes in the 3rd hour. The solution started with almost 100% DBT, 0.022164 M, and after
3 hours test the conversion of DBT found to be 68.44%. The products of reaction and DBT
conversion are shown in fig 4.10. The composition of final mixture, according to Figure
4.10, was as follow: Cyclohexane (CyIH) 0.693%, Bicyclohexane (BCHY) 1.68%
,Cyclohexane-Benzene (CHB) 24.87%, Biphenyl (BP) 39.09%, Tetra and dihydrogenated
dibenzothiophene (T+DHDBT) 2.31%, and dibenzothiophene (DBT) 31.36%
.Concentration of BP, which is the product of DDS, is 1.57 times the concentration of
CHB, which is the product of HYD route. This indicates the favoring of HDS through DDS
route over HYD route. Same observation was reported in other literatures [34] that DDS is
more favored when carbon is used as support. The concentration of benzene and
cyclohexane are very small, this indicates that cracking and hydrogenation of HDS
products is very small as a result of inert property of carbon support. Concentration of
THDBT found to increase to maximum, 8.78x10⁻⁴ M, and then decrease with reaction time
to 5.15x10⁻⁴M. This behavior indicates that TDHDBT is an intermediate product of HDS
of DBT also the amount of TDHDBT is related to the activity of HYD route in the HDS of
DBT [35].

40
Figure 4.10 Products of HDS of DBT over MoS2/C oxide.
0
0.001
0.002
0.003
0.004
0.005
0.006
0.007
0.008
0.009
0.01
0 10 20 30 40 50 60 70 80
[M]
Conversion% DBT
MoS2/C Oxide
T+DHDBT
BP
CHB
BCHY
CylH
Bz

41
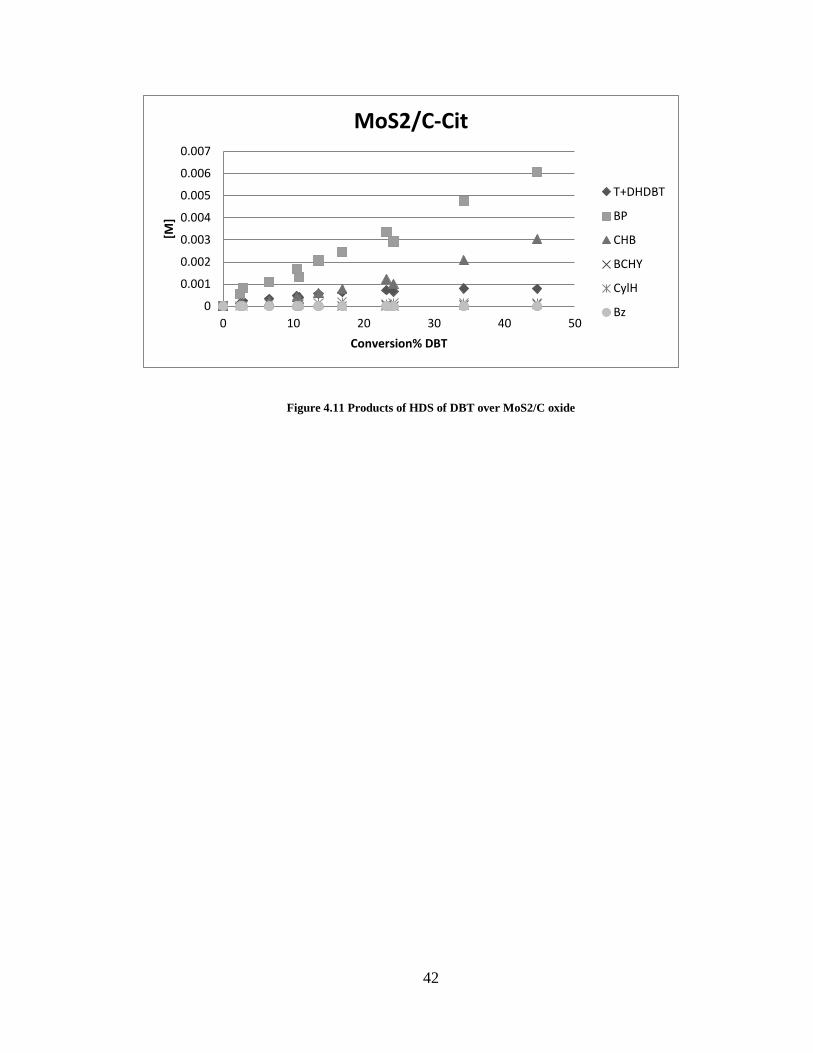
4.5.2 Catalytic Activity of MoS2/C-Cit:
0.51g of MoS2/C-Oxide and 0.025g of copper were add to 120 ml of decane solution
containing 4000ppm DBT. Once the reaction temperature reached, samples were collected
every 15 minutes in first two hours then every 30 minutes in the 3rd hour. The solution
started with almost 100% DBT, 0.02217 M, and after 3 hours test the conversion of DBT
found to be 44.63%. The products of reaction and DBT conversion are shown in fig 4.11.
The composition of final mixture, according to Figure 4.11, was as follows: Cyclohexane
(CyIH) 0.541%, Bicyclohexane (BCHY) 0.461% ,Cyclohexane-Benzene (CHB) 13.53%,
BiPhenyl (BP) 27.09%,Tetra and dihydrogenated dibenzothiophene (T+DHDBT) 3.51%,
and dibenzothiophene (DBT)54.86% .Concentration of BP, which is the product of DDS,
is 2.00 times the concentration of CHB, which is the product of HYD route. This indicates
the favoring of HDS through DDS route over HYD route. Also the selectivity toward DDS
is higher than MoS2/C-Oxide, and it was noticed that conversion of DBT was slow in the
first 2 hours but increased rapidly in the last hour of the test and over all conversion of
DBT is less than MoS2/C-Oxide. The reason for less DBT conversion is direct related to
the lower molybdenum content in MoS2/C-Cit compared to MoS2/C-Oxide, 12.6 and
18.3% respectively. The slower conversion of DBT in the early stage of the reaction was
due to hydrogen sulfide inhibition effect and the influence of this inhibition was higher
when compared to MoS2/C-Oxide but the selectivity of DDS is higher than one of MoS2/C-
Oxide. These two observations are related to the structure of molybdenum sulfide crystals.
It is suggested that molybdenum sulfide crystals in MoS2/C-Cit have more stacking layers
comparing with MoS2/C-Oxide. This leads to more edge sites where the DDS takes place
[ 36].
42
Figure 4.11 Products of HDS of DBT over MoS2/C oxide
0
0.001
0.002
0.003
0.004
0.005
0.006
0.007
0 10 20 30 40 50
[M]
Conversion% DBT
MoS2/C-Cit
T+DHDBT
BP
CHB
BCHY
CylH
Bz

43
4.5.3 Catalytic Activity of (Co)MoS2/C-Oxide:
0.258g of (Co)MoS2/C-Oxide and 0.032g of copper were add to 120 ml of decane solution
containing 4000ppm DBT. Once the reaction temperature reached, samples were collected
every 15 minutes in first two hours then every 30 minutes in the 3rd hour. The solution
started with almost 100% DBT, 0.02159 M, and after 3 hours test the conversion of DBT
found to be 54.89%. The products of reaction and DBT conversion are shown in fig 4.12.
The composition of final mixture, according to Figure 4.12, was as follow: Cyclohexane
(CyIH) 0.566%, Bicyclohexane (BCHY) 0.727% ,Cyclohexane-Benzene (CHB) 14.30%,
Biphenyl (BP) 37.79%, Tetra and dihydrogenated dibenzothiophene (T+DHDBT) 1.93%,
and dibenzothiophene (DBT)44.66%. Concentration of BP, which is the product of DDS,
is 2.64 times the concentration of CHB, which is the product of HYD route. This indicates
the favoring of HDS through DDS route over HYD route. Also it is more selective toward
DDS than unprompted MoS2/C-Oxide. (Co)MoS2/C-Oxide was less influenced by
hydrogen sulfide inhibition; this is because of availability of sulfur vacancies formed by
coordination of Co-Mo-S and make the HDS reaction more rapid [32]. The less conversion
of DBT in (Co) MoS2/C-Oxide is because of using lower amount of catalyst compared
with unprompted MoS2/C-Oxide.

44
Figure 4.12 Products of HDS of DBT over (Co)MoS2/C Oxide
0
0.001
0.002
0.003
0.004
0.005
0.006
0.007
0.008
0.009
0 10 20 30 40 50 60
[M]
Conversion% of DBT
(Co)MoS2/C-Oxide
T+DHDBT
BP
CHB
BCHY
CylH
Bz

45
4.5.4 Catalytic Activity of (Co)MoS2/C-Cit:
0.256g of (Co)MoS2/C-Cit and 0.032g of copper were add to 120 ml of decane solution
containing 4000ppm DBT. Once the reaction temperature reached, samples were collected
every 15 minutes in first two hours then every 30 minutes in the 3rd hour. The solution
started with almost 100% DBT, 0.02159 M, and after 3 hours test the conversion of DBT
found to be 54.89%. The products of reaction and DBT conversion are shown in figure
4.13. The composition of final mixture, according to Figure 4.12, was as follow:
Cyclohexane (CyIH) 1.04%, Bicyclohexane (BCHY) 0.60% ,Cyclohexane-Benzene
(CHB) 11.74%, Biphenyl (BP) 37.22%,Tetra and dihydrogenated dibenzothiophene
(T+DHDBT) 1.95%, and dibenzothiophene (DBT)48.67% .Concentration of BP, which is
the product of DDS, is 3.17 times the concentration of CHB, which is the product of HYD
route. This indicates the favoring of HDS through DDS route over HYD route. Also it is
more selective toward DDS than unprompted MoS2/C-Cit. Concentration of THDBT is
found to increase to maximum and then decrease with reaction time indicating its
intermediate nature. Hydrogen sulfide inhibition effect was observed, however to lesser
extent compared to MoS2/C-Cit but still higher when compared to (Co)MoS2/C-Oxide. It
is following the same trend as catalyst synthesized with Citric acid. This indicates that
stacking of molybdenum sulfide edge layers is higher in the catalyst than (Co)MoS2/C-
Oxide. This is confirmed by the products of HDS of DBT and the XRD pattern. The
conversion of DBT in (Co)MoS2/C-Cit more than (Co)MoS2/C-Oxide. This is consistent
with the elemental analysis results in Table 4.1, where the (Co)MoS2/C-Oxide have higher
metals loading than (Co)MoS2/C-Cit.

46
Figure 4.13 Products of HDS of DBT over (Co)MoS2/C Oxide
0
0.001
0.002
0.003
0.004
0.005
0.006
0.007
0.008
0.009
0 10 20 30 40 50 60
[M]
Conversion% of DBT
(Co)MoS2/C-Cit
T+DHDBT
BP
CHB
BCHY
CylH
Bz
47
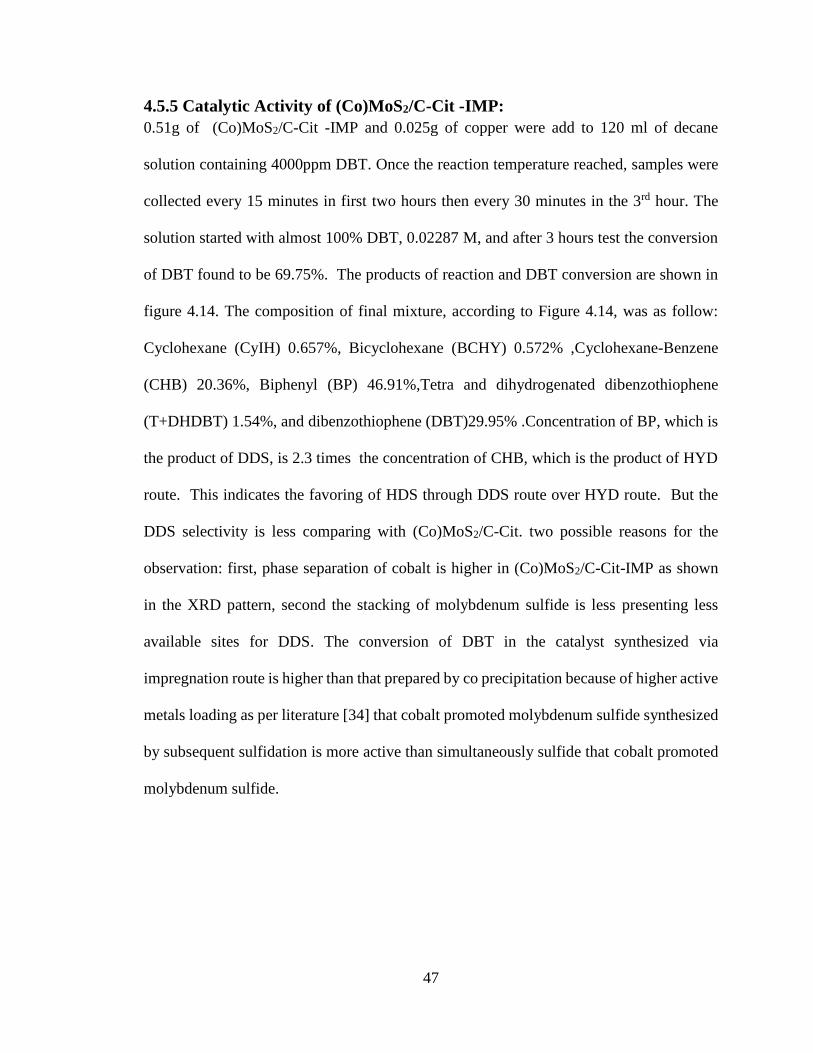
4.5.5 Catalytic Activity of (Co)MoS2/C-Cit -IMP:
0.51g of (Co)MoS2/C-Cit -IMP and 0.025g of copper were add to 120 ml of decane
solution containing 4000ppm DBT. Once the reaction temperature reached, samples were
collected every 15 minutes in first two hours then every 30 minutes in the 3rd hour. The
solution started with almost 100% DBT, 0.02287 M, and after 3 hours test the conversion
of DBT found to be 69.75%. The products of reaction and DBT conversion are shown in
figure 4.14. The composition of final mixture, according to Figure 4.14, was as follow:
Cyclohexane (CyIH) 0.657%, Bicyclohexane (BCHY) 0.572% ,Cyclohexane-Benzene
(CHB) 20.36%, Biphenyl (BP) 46.91%,Tetra and dihydrogenated dibenzothiophene
(T+DHDBT) 1.54%, and dibenzothiophene (DBT)29.95% .Concentration of BP, which is
the product of DDS, is 2.3 times the concentration of CHB, which is the product of HYD
route. This indicates the favoring of HDS through DDS route over HYD route. But the
DDS selectivity is less comparing with (Co)MoS2/C-Cit. two possible reasons for the
observation: first, phase separation of cobalt is higher in (Co)MoS2/C-Cit-IMP as shown
in the XRD pattern, second the stacking of molybdenum sulfide is less presenting less
available sites for DDS. The conversion of DBT in the catalyst synthesized via
impregnation route is higher than that prepared by co precipitation because of higher active
metals loading as per literature [34] that cobalt promoted molybdenum sulfide synthesized
by subsequent sulfidation is more active than simultaneously sulfide that cobalt promoted
molybdenum sulfide.
48
Figure 4.14 Products of HDS of DBT over (Co)MoS2/C-Cit-IMP
0
0.002
0.004
0.006
0.008
0.01
0.012
0 20 40 60 80
[M]
Conversion% of DBT
(Co)MoS2/C-Cit -IMP
T+DHDBT
BP
CHB
BCHY
CylH
Bz

49
4.5.6 Catalytic Activity of (Co)MoS2/C-Oxide -IMP:
0.51g (Co)MoS2/C-Oxide -IMP and 0.025g of copper were add to 120 ml of decane
solution containing 4000ppm DBT. Once the reaction temperature reached, samples were
collected every 15 minutes in first two hours then every 30 minutes in the 3rd hour. The
solution started with almost 100% DBT, 0.02287 M, and after 3 hours test the conversion
of DBT found to be 69.75%. The products of reaction and DBT conversion are shown in
figure 4.15. The composition of final mixture, according to Figure 4.15, was as follows:
Cyclohexane (CyIH) 0.657%, Bicyclohexane (BCHY) 0.572% ,Cyclohexane-Benzene
(CHB) 20.36%, Biphenyl (BP) 46.91%,Tetra and dihydrogenated dibenzothiophene
(T+DHDBT) 1.54%, and dibenzothiophene (DBT)29.95% .Concentration of BP, which is
the product of DDS, is 2.08 times the concentration of CHB, which is the product of HYD
route. It is less selective toward DDS than (Co) MoS2/C-Oxide and (Co)MoS2/C-Cit-IMP.
Also the effect of Hydrogen Sulfide inhibition is less compared to both (Co) MoS2/C-Oxide
and (Co)MoS2/C-Cit-IMP and it is consistent with observations form previous catalysts.
The conversion of DBT over the catalyst synthesized via the impregnation route is higher
than that prepared via co precipitation because of higher active metals loading. Also the
inhibition effect of hydrogen sulfide is less compared to that of (Co)MoS2/C-Cit –IMP[34].
Unlike previous catalysts, (Co)MoS2/C-Cit-IMP and (Co)MoS2/C-Oxide-IMP show same
conversion of DBT. Although that molybdenum content is much less in (Co)MoS2/C-Cit-
IMP compared to (Co)MoS2/C-Oxide-IMP, the cobalt content in (Co)MoS2/C-Cit-IMP is
4 times higher than (Co)MoS2/C-Oxide-IMP, see table 4.1. It is obvious that cobalt in
(Co)MoS2/C-Cit-IMP decorated in the molybdenum sulfide structure and exhibited less
phase separation. This observation reflects the role of citric acid in shaping the structure of
cobalt promoted molybdenum sulfide and increase the formation of Co-Mo-S phase [31].

50
4.6 Kinetic Treatment
Based on the results obtained from the reaction analyses in section 4.5, the proposed
reaction mechanism and network for the hydrodesulfurization (HDS) of dibenzothiophene

51
(DBT) is given in Figure 4.16. According to the scheme, HDS of DBT may occur via two
parallel paths: initially it may be hydrogenated to yield THDBT which is then desulfurized
to CHB and subsequently hydrogenated further to BCH. The other route is the direct
desulfurization to produce BP, which could then be hydrogenated to CHB.
Cyclohexylbeneze (CHB) is then hydrogenated to produce BCH.

52
Figure 4.15 Proposed reaction network for the HDS of DBT

53
Figure 4.16 Products of HDS of DBT over (Co)MoS2/C-Oxide-IMP
0
0.002
0.004
0.006
0.008
0.01
0.012
0 10 20 30 40 50 60 70 80
[M]
Conversion % of DBT
(Co)MoS2/C-Oxide -IMP
T+DHDBT
BP
CHB
BCHY
CylH
Bz

54
Considering the hydrodesulfurization reaction conditions used in this study, the following
assumptions have been made [35]:
1. The hydrogen concentration remains constant throughout the reaction since it was
fed in excess.
2. HDS of individual sulfur compounds follow pseudo-first order kinetics
3. The inhibition effect of the products of HDS of DBT is considered negligible except
the effect of H2S inhibition.
4. The effect of H2S was neutralized by addition of Cu powder to the reaction
mixture.
In order to verify the proposed mechanism presented in Figure 4.16, the kinetic equations
that fit the experimental data obtained in HDS of DBT based on Langmuir-Hinshelwood
(L-H) type equation with two kinds of catalytic active sites were developed.
Accordingly, the overall rate can be expressed by two parts:
𝑅𝐷𝐷𝑆 = 𝑘1𝐾1𝐶𝐷𝐵𝑇
1+ 𝐾1𝐶𝐷𝐵𝑇+⋯ (1)
𝑅𝐻𝑌𝐷 = 𝑘2𝐾2𝐶𝐷𝐵𝑇
1+ 𝐾1𝐶𝐷𝐵𝑇+⋯ (2)
Here, RDDS and RHYD are the rate of direct desulfurization (DDS) and the rate of
hydrogenation (HYD) of DBT, respectively. K1, k1 and K2, k2 are the equilibrium
adsorption constants of DBT over the catalytic active sites and the reaction rate constants
for DDS and HYD, respectively, as shown in Figure 4.16. CDBT is the concentration of
DBT at a given reaction time.
Under the reaction conditions used, the rate equations (1and 2) reduce to pseudo-first order
equations where the overall rate, Rtotal can be taken as the sum of the rate of direct
desulfurization (DDS) and the rate of hydrogenation (HYD):
55
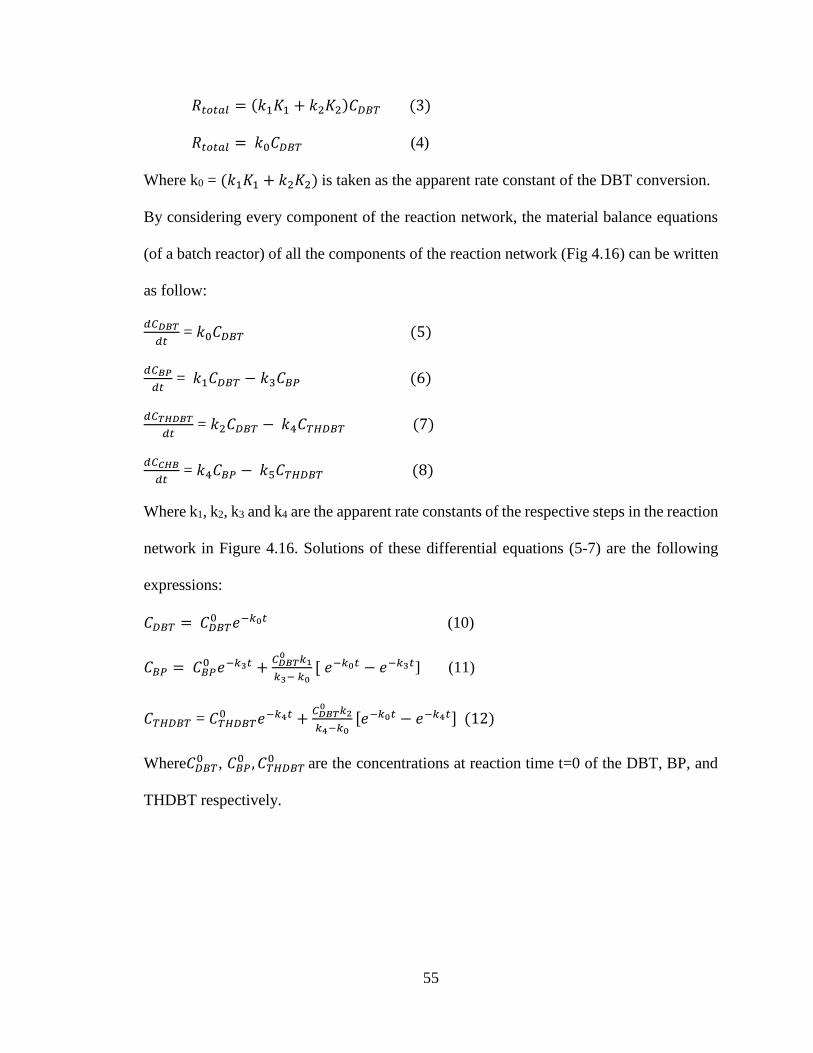
𝑅𝑡𝑜𝑡𝑎𝑙 = (𝑘1𝐾1 + 𝑘2𝐾2)𝐶𝐷𝐵𝑇 (3)
𝑅𝑡𝑜𝑡𝑎𝑙 = 𝑘0𝐶𝐷𝐵𝑇 (4)
Where k0 = (𝑘1𝐾1 + 𝑘2𝐾2) is taken as the apparent rate constant of the DBT conversion.
By considering every component of the reaction network, the material balance equations
(of a batch reactor) of all the components of the reaction network (Fig 4.16) can be written
as follow:
𝑑𝐶𝐷𝐵𝑇
𝑑𝑡 = 𝑘0𝐶𝐷𝐵𝑇 (5)
𝑑𝐶𝐵𝑃
𝑑𝑡 = 𝑘1𝐶𝐷𝐵𝑇 − 𝑘3𝐶𝐵𝑃 (6)
𝑑𝐶𝑇𝐻𝐷𝐵𝑇
𝑑𝑡 = 𝑘2𝐶𝐷𝐵𝑇 − 𝑘4𝐶𝑇𝐻𝐷𝐵𝑇 (7)
𝑑𝐶𝐶𝐻𝐵
𝑑𝑡 = 𝑘4𝐶𝐵𝑃 − 𝑘5𝐶𝑇𝐻𝐷𝐵𝑇 (8)
Where k1, k2, k3 and k4 are the apparent rate constants of the respective steps in the reaction
network in Figure 4.16. Solutions of these differential equations (5-7) are the following
expressions:
𝐶𝐷𝐵𝑇 = 𝐶𝐷𝐵𝑇0 𝑒−𝑘0𝑡 (10)
𝐶𝐵𝑃 = 𝐶𝐵𝑃0 𝑒−𝑘3𝑡 +
𝐶𝐷𝐵𝑇0 𝑘1
𝑘3− 𝑘0[ 𝑒−𝑘0𝑡 − 𝑒−𝑘3𝑡] (11)
𝐶𝑇𝐻𝐷𝐵𝑇 = 𝐶𝑇𝐻𝐷𝐵𝑇0 𝑒−𝑘4𝑡 +
𝐶𝐷𝐵𝑇0 𝑘2
𝑘4−𝑘0[𝑒−𝑘0𝑡 − 𝑒−𝑘4𝑡] (12)
Where𝐶𝐷𝐵𝑇0 , 𝐶𝐵𝑃
0 , 𝐶𝑇𝐻𝐷𝐵𝑇 0 are the concentrations at reaction time t=0 of the DBT, BP, and
THDBT respectively.
56
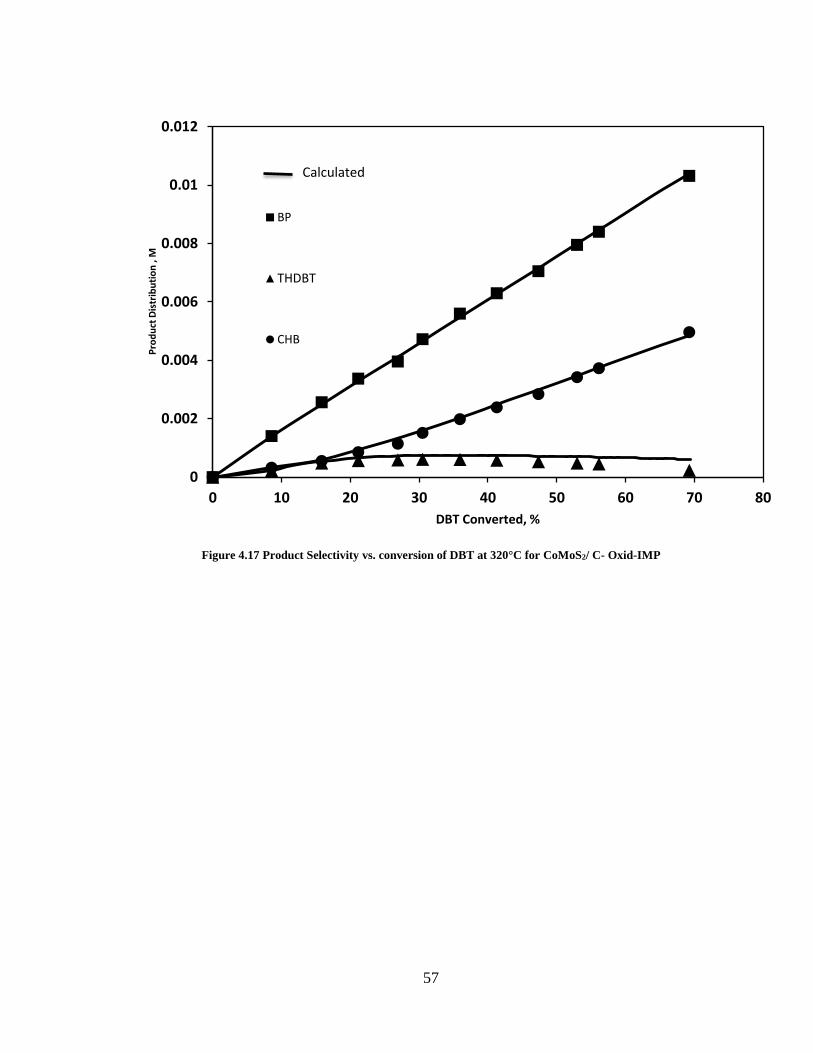
4.7 Model Reaction Fitting
Computational analyses were carried out using Mathematica 5.0 to fit the experimental
data with Langmuir-Hinshelwood (L-H) equations. Kinetic parameters were generated at
a correlation factor of greater than 95% between experimental and calculated data. Figures
4.19 show the comparisons between experimental and calculated concentrations for the
reaction at 320°C over catalyst with CoMoS2/ C- Oxide-IMP. Interestingly, in all the
fittings, we obtained very good correlation between the experimental and theortical data.
For the DBT curve, Figure 4.18 , the concentration of DBT decreases exponentionally with
reaction time in accordance with kientic of pusedo-first order conversion. Figures 4.17 also
displays the fitting curves for the other products. Although, in all, there are good
agreements between experimental and the calculated data, a slight deviation is noticed for
the THDBT curve[33]. The reactions’ rate constants for all catalysts are shown in table 4.3.
It’s noticed that CoMo/C-Oxd-Imp catalysts has exhibited the highest acivity among the
set of catalysts used where, according to Table 4.3, the CoMo/C-Oxd-Imp catalysts had
the largest rate constants for all of the reaction steps shown in Fighure 4.18. In addition,
the addition of Co has increased the rate of direct desulfurization relative to that of the
hydrogenation route, where k1/k2 values were nearly similar for all Co containig samples
and larger than that of samples containing MoS2 only. Moreover, the sample CoMo/C-Cit-
Imp exhibited the largest k1/k2 ratio, which according to the rim-edge model, must have the
largest crystals and number of stacks, which is also in line with the XRD results.
57
Figure 4.17 Product Selectivity vs. conversion of DBT at 320°C for CoMoS2/ C- Oxid-IMP
0
0.002
0.004
0.006
0.008
0.01
0.012
0 10 20 30 40 50 60 70 80
Pro
du
ct D
istr
ibu
tio
n ,
M
DBT Converted, %
BP
THDBT
CHB
Calculated

58
Figure 4.18 Pseudo-first order plot of the HDS of DBT over CoMoS2/ C- Oxide-IMP
0
0.2
0.4
0.6
0.8
1
1.2
1.4
0 50 100 150 200
-Ln
(1-C
on
v)
TOS, min

59
Table 4.3 overall and individual apparent rate constants for the HDS of DBT at 320°C (10-3/min)
Sample ko/min k1/min k2/min k3/min k4/min k5/min k1/k2
CoMo/C-Cit-
Imp
2.812 2.042 0.77 0 20.495 13.265 2.653799
CoMo/C-
Oxd-Imp
5.217 3.385 1.832 0 46.125 49.025 1.847917
CoMo/C-Cit 2.926 1.92 1.006 0 16.129 10.748 1.907824
CoMo/C-Oxd 2.952 2.006 0.946 0 22.106 18.601 2.120776
MoS2/C-Cit 1.952 1.07 0.882 0 14.361 12.558 1.213413
MoS2/C-Oxd 3.607 2.035 1.572 0 18.725 11.209 1.294991

60
4.8 Catalyst evaluation by desulfurization of model FCC gasoline using
microreactor:
The above catalysts were also evaluated for desulfurization of thiophene in FCC model
gasoline stream. The composition of FCC model gasoline was as follow: ( 3% 2-Methyl
Thiophene, 20% 2,3 di methyl but2-ene, 40% o-xylene 47% n-heptane). Figure 4.19 and
Figure 4.20 show the results of Model FCC Gasoline desulfurization. The prepered
catalysts show lower Hydrodesulfurization performance comparing with standard cobalt
molymbdenum supported on alumina.Also the rate of hydrogenation was lower but it is an
advantage because the olefin content is higer in the product, hence higher ocatne number.
The results of HDS of model FCC gasoline are not consistent with avilable litrautres where
the carbon supported (Co)MoS2 show better performance than commercial (Co)MoS2
supported on alumina [ 34] . The main reason is that catalyst were partially promoted by
cobalt and some of cobalt formed separate sulfide phase of Co9S8 , which is not active in
HDS. The curves of reaction rate are consistent with the amount of active metals. Also
citrate based catalyst showed lower performance than oxide based catalysts in HDS of 2-
MT . like the HDS of DBT, citrate based catalysts were more affected by hydreogen sulfide
inhibition than oxide based catalysts. But is show similar perofrmance in hydrogenation of
2,3 DM2B because brim sites are less affected by hydrogen sulfide inhibition[33].

61
The condtions of reaction were as follow:
Catalyst weight= 1.49 g
Reaction temp= 225 C
Reaction Pressure = 20 bar
H2 Flow rate = 20 ml/min
WHSV=3 /h
HC Feed flow = 0.1 ml/min
H2/HC= 200 l/l

62
Figure 4.19 Performance of Synthesized catalyst in hydrodesulfurization of 2-MT in Model FCC-Gasoline
5
7
9
11
13
15
17
19
21
23
25
0 2 4 6 8
Co
nve
rsio
n 2
-MT
(mm
ol g
-1 c
at h
-1)
TOS, h
Rate of 2-MT Conversion
Co Mo C Cit
Co Mo C Cit IMP
Co Mo C Oxide
Co Mo C Oxide IMP
Co Mo / ALO3

63
Figure 4.20 Performance of Synthesized catalyst in hydrogenation of 2,3DM2B in Model FCC-Gasoline
70.0
90.0
110.0
130.0
150.0
170.0
190.0
0 1 2 3 4 5 6 7 8
Co
nve
rsio
n 2
3D
M2
B (
mm
ol g
-1 c
at h
-1)
TOS, h
Rate of 2,3DM2B Conversion
Co Mo C Cit
Co Mo C Cit IMP
Co Mo C Oxide
Co Mo C Oxid IMP
Co Mo/ AlO3

64
CHAPTER 5
Conclusion and Recommendations
5.1 Conclusion:
The (Co)MoS2 HDS catalysts supported on hollow carbon sphere were synthesized
successfully. The following are the summery of our investigation:
1- The catalysts showed higher selectivity of DDS route over HYD route in HDS of
DBT.
2- Oxide based catalyst showed better performance comparing with Citrate based.
This due to higher loading capacity of active metal on oxide base route.
3- Citrate based catalysts show higher selectivity of DDS route in HDS of DBT
because of larger stacking of molybdenum sulfide.
4- The activity of catalysts in overall HDS reactions was less than commercial
CoMoS2/ Alumina. This is because of low loading of active metals.
5- Catalysts synthesized by simultaneous precipitation show the highest conversion
per unit mass of catalyst and highest selectivity of DDS in HDS of DBT.

65
5.2 Recommendations:
1- Optimize the ratio of resorcinol and formaldehyde to avoid excessive nicking in
hollow carbon sphere.
2- Study the effect of citric acid and the structure of molybdenum sulfide crystals.
3- Optimize the required amount of citric acid in order to minimize the excessive
carbon in formation of hollow carbon spheres
4- Study the catalyst with XPS and TEM to build better understanding of the structure.
5- Use different promoting metals to enhance the catalysts performance.

66
References
[1] M. Breysse, G. Djega-Mariadassou, S. Pessayre, C. Geantet, M. Vrinat,
G. Perot, M. Lemaire, Deep desulfurization: reactions, catalysts and
technological challenges, Catal. Today 84 (2003) 129.
[2] I.V. Babich, J.A. Moulijn, Science and technology of novel processes
for deep desulfurization of oil refinery streams: a review, Fuel 82
(2003) 607.
[3] (a) C. Song, An overview of new approaches to deep desulfurization
for ultra-clean gasoline, diesel fuel and jet fuel, Catal. Today 86 (2003)
211-263.
(b) C. Song, X. Ma, New design approaches to ultra-clean diesel fuels
by deep desulfurization and deep dearomatization, Appl. Catal. B:
Environ. 41 (2003) 207.
[4] I. Vergov, I. Shishkova, Catalyst advances promote production of near
zero sulphur diesel, Petrol. Coal 51 (2009) 136–139.
[5] Whitehurst, D.D., Isoda, T., & Mochida, I., Present state of the art an future challenges
in the hydrodesulfurization of polyaromatic sulfur compounds (1998). Adv. Catal.
42, 345-471.
[6] A. Stanislaus, A. Marafi, M. S. Rana, Recent advances in the science
and technology of ultra low sulfur diesel (ULSD) production, Catalysis
Today 153 (2010) 1-68.
[7] Fusheng Ouyang, Xu Pei, Xuhong Zhao, & Huixin Weng, Effect of Operation
Conditions on the Composition and Octane Number of Gasoline in
the Process of Reducing the Content of Olefins in Fluid Catalytic Cracking (FCC)
Gasoline, Energy& Fuels 24 (2010) 475-482
[8] T. Fujikawa, H. Kimura, K. Kiriyama, K. Hagiwara, Development of
ultra-deep HDS catalyst for production of clean diesel fuels, Catal.
Today 111 (2006) 188–193.
[9] Topsoe hydrotreating catalysts: http://www.topsoe.com/products/
CatalystPortfolio.aspx.

67
[10] S. Torrisi, The challenging chemistry of ultra-low sulfur diesel. Process
Technology, Catalysis, World Refining. December, 2002
(http://www.shell.com/static/criterion-gb/downloads/pdf/trade pub reprints/wr
1201reprinttorrisi ulsd.pdf).
[11] R. Shafi, G.J. Hutchings, Hydrodesulfurization of hindered dibenzothiophenes: an
overview, Catal. Today 59 (2000) 423–442.
[12] T. Kabe, A. Ishihara, Q. Zang, Deep desulfurization of light oil. Part 2:
hydrodesulfurization of dibenzothiophene, 4-methyldibenzothiophene and 4,6-
dimethyldibenzothiophene, Appl. Catal. A 97 (1993) L1–L9.
[13] M. J. Girgis, B.C. Gates, Reactivities, reaction networks and kinetics in high
pressure catalytic hydroprocessing, Ind. Eng. Chem. Res. 30 (1991) 2021–2058.
[14] B.C. Gates, H. Topsoe, Reactivities in deep catalytic hydrodesulfurization:
challenges, opportunities, and the importance of 4-methyldibenzothiophene and 4,6
dimethyldibenzothiophene, Polyhedron 16 (1997) 3213–3217.
[15 ] K. P. de Jonge (editor), Synthesis of solid catalysts, Wiley publication, pp. 301-328.
[16] Candia, R., Sorensen, O., Villadsen, J., Topsoe, N., Clausen, B.S., & Topsoe, H.
(1984). Bull. Soc. Chim. Belg. 93, 763.
[17] B. Shen, H. Li, W. Zhang, Y. Zhao, Z. Zhang, X. Wang, S. Shen, A novel composite
support for hydrotreating catalyst aimed at ultra-clean fuels, Catal. Today 106
(2005) 206–210.
[18] M. J. Vissenberg, Y. van der Meer, E.J.M. Hensen, V.R.J. de Beer, A.M. van der
kraan, R.A. van Santen, J.A.R. van veen, The effect of support interaction on the
sulfidability of Al2O3 and TiO2 supported CoW and NiW hydrodesulfurization
catalysts, J. Catal. 198 (2001) 151–163.
[19] J. P. R. Vissers, B. Scheffer, J.H.J. de Beer, J.A. Moulijh, R. Prins, Effect of the
support on the structure of Mo-based hydrodesulfurization catalysts activated
carbon versus alumina, J. Catal. 105 (1987) 277-284.
[20] R. G. Lehveld, A.J. van Dillen, J.W. Geus, D.C. Komgsberger, A Mo–K edge
XAFS study of the metal sulfide–support interaction in (Co)Mo supported alumina
and titania catalysts, J. Catal. 165 (1997) 184–196.
[21] Breysse, M., Portefaix, J.-L., & Varinat, M. (1991). Catal. Today 10, 489.
[22] Hubert-pfalzgraf, L. G. New J. of Chem. 1987, 11, 663.
[23] Guglielmi, M.; Carturan, G. J. Non-Cryst. Solids 1988, 100, 16.

68
[24] Vikreva, O.; Kalinina, O.; Kumacheva, E. Adv. Mater. 2000, 12, 110.
[25] An-Hui Lu, Guang-Ping Hao, Qiang Sun, Xiang-Qian Zhang, Wen-Cui Li,
Chemical Synthesis of Carbon Materials With Intriguing Nanostructure and
Morphology, Macromol. Chem. Phys. 2012, 213, 1107−1131
[26] Neil J. Coville , Sabelo D. Mhlanga Edward N. Nxumalo, Ahmed Shaikjee, A
review of shaped carbon nanomaterials, S Afr J Sci 2011; 107(3/4)
[27] William S. Cooke, Eckhardt Schmidt, Chunshan Song, and Harold H. Schobert,
Reactions of Dibenzothiophene with Hydrogen in the Presence of Selected
Molybdenum, Iron, and Cobalt Compounds, Energy & Fuels 1996, 10, 591-596
[28] Fusheng Ouyang, Xu Pei, Xuhong Zhao, and Huixin Weng, Effect of Operation
Conditions on the Composition and Octane Number of Gasoline in
the Process of Reducing the Content of Olefins in Fluid Catalytic Cracking (FCC)
Gasoline, Energy Fuels 2010, 24, 475–482
[29] Hamdy Farag, Kinetic Analysis of the Hydrodesulfurization of Dibenzothiophene
Approach Solution to the Reaction Network, Energy & Fuels 2006, 20, 1815-1821
[30] E. J. M. Hensen, M. J. Vissenberg, V. H. J. de Beer, J. A. R. van Veen, and R. A.
van Santen, Kinetics and Mechanism of Thiophene Hydrodesulfurization
over Carbon-Supported Transition Metal Sulfides, Journal of Catalysis (1996)163,
429–435
[31] Nino Rinaldi, Tekeshi Kubota, and Yasuaki Okamoto, Effect of Citric Acid
Addition on Co-Mo/B2O3/Al2O3 Catalysts Prepared by a Post-Treatment Method.
Ind. Eng. Chem. Res. 2009, 48, 10414–10424
[32] Poul Georg Moses , Berit Hinnemann , Henrik TopsØe , Jens K. NorskØv, The effect of Co-promotion on MoS2 catalysts for hydrodesulfurization of thiophene:
A density functional study, Journal of Catalysis (2009) 268, 201–208
[33] Hamdy Farag, Investigation of the Influence of H2S on Hydrodesulfurization of
Dibenzothiophene over a Bulk MoS2 Catalyst, Ind. Eng. Chem. Res., 2003, 42 (2), pp
306–310
[34] Hamdy Farag, D. D. Whitehurst, and Isao Mochida, Synthesis of Active
Hydrodesulfurization Carbon-Supported Co−Mo Catalysts. Relationships between
Preparation Methods and Activity/Selectivity, Ind. Eng. Chem. Res. 1998, 37, 3533-3539
[35] Hamdy Farag, Kinetic Analysis of the Hydrodesulfurization of Dibenzothiophene:
Approach Solution to the Reaction Network, Energy & Fuels 2006, 20, 1815-1821

69
[36] M Daage, R . R Chainelli, Structure- Function relations in Molybdenum Sulfide
Catalysts: "The Rim-Edge" Model. Journal of Catalysis 1994, 149, 414-427.
70
Vitae
Name :Abdullah Faisal Abdullah Al-Ahmadi
Nationality :Saudi
Date of Birth :4/30/1984
Email :[email protected]
Address :KFUPM P.O.Box 1951 Postal code 31261
Academic Background :January ,2007 , BS in Chemistry from King Fahd
University of Petroleum & Minerals
May 2013, MS in BS in Chemistry from King Fahd
University of Petroleum & Minerals