igf-1 receptor antagonism inhibits autophagy - human molecular
TRANSCRIPT
IGF-1 receptor antagonism inhibits autophagy
Maurizio Renna1, Carla F. Bento1,{, Angeleen Fleming1,2,{, Fiona M. Menzies1,
Farah H. Siddiqi1, Brinda Ravikumar1, Claudia Puri1, Moises Garcia-Arencibia1,
Oana Sadiq1, Silvia Corrochano3, Sarah Carter3, Steve D.M. Brown3, Abraham Acevedo-Arozena3
and David C. Rubinsztein1,∗
1Department of Medical Genetics, Cambridge Institute for Medical Research, University of Cambridge, Wellcome/MRC
Building, Addenbrooke’s Hospital, Hills Road, Cambridge CB2 0XY, UK, 2Department of Physiology, Development
and Neuroscience, University of Cambridge, Cambridge, UK and 3Mammalian Genetics Unit, Medical Research Council,
Harwell, UK
Received May 24, 2013; Revised and Accepted June 20, 2013
Inhibition of the insulin/insulin-like growth factor signalling pathway increases lifespan and protects againstneurodegeneration in model organisms, and has been considered as a potential therapeutic target. This path-way is upstream of mTORC1, a negative regulator of autophagy. Thus, we expected autophagy to be activatedby insulin-like growth factor-1 (IGF-1) inhibition, which could account for many of its beneficial effects.Paradoxically, we found that IGF-1 inhibition attenuates autophagosome formation. The reduced amount ofautophagosomes present in IGF-1R depleted cells can be, at least in part, explained by a reduced formation ofautophagosomal precursors at the plasma membrane. In particular, IGF-1R depletion inhibits mTORC2,which, in turn, reduces the activity of protein kinase C (PKCa/b). This perturbs the actin cytoskeleton dynamicsand decreases the rate of clathrin-dependent endocytosis, which impacts autophagosome precursor formation.Finally, with important implications for human diseases, we demonstrate that pharmacological inhibition of theIGF-1R signalling cascade reduces autophagy also in zebrafish and mice models. The novel link we describehere has important consequences for the interpretation of genetic experiments in mammalian systems andfor evaluating the potential of targeting the IGF-1R receptor or modulating its signalling through the downstreampathway for therapeutic purposes under clinically relevant conditions, such as neurodegenerative diseases,where autophagy stimulation is considered beneficial.
INTRODUCTION
The insulin-like growth factor (IGF-1) binds to extracellularinsulin-like growth factor receptors, such as the insulin-likegrowth factor-1 receptor (IGF-1R), resulting in their activationand phosphorylation. The tyrosine kinase activities of thesereceptors phosphorylate signalling molecules, including theinsulin receptor substrate (IRS) protein family. Once phosphory-lated, the IRS proteins act as molecular adaptors to facilitatedownstream signalling pathways via AKT, which serves as amajor effector. Inhibition of insulin/IGF-1 signalling is consid-ered an exciting therapeutic target, as this modulation increaseslifespan in worms, flies and mice, and also protects model organ-isms from neurodegenerative insults (1–4).
Autophagy, a critical cytoprotective pathway, involves theformation of double-membrane autophagosomes that captureportions of cytoplasm before fusing with lysosomes wheretheir contents are ultimately degraded (5). Autophagy is a criticalpathway that regulates the accumulation of such cytoplasmicaggregate-prone proteins, such as mutant huntingtin, associatedwith neurodegenerative diseases. Autophagy-inducing drugsand genes can alleviate the toxicity of mutant huntingtin andrelated proteins in cell and animal models of disease (6). Further-more, autophagy up-regulation in model organisms increaseslongevity (7). In mammalian cells, autophagosomes areformed from precursor membrane structures that include acomplex of the autophagic proteins Atg5, Atg12 and Atg16L1.
†The authors wish it to be known that, in their opinion, the second and third authors should be regarded as joint Second Authors.
∗To whom correspondence should be addressed at: Cambridge Institute for Medical Research, Wellcome/MRC Building, Addenbrooke’s Hospital,Hills Road, Cambridge CB2 0XY, England, UK. Tel: +44 1223762608; Fax: +44 1223331206; E-mail: [email protected]
# The Author 2013. Published by Oxford University Press.This is an Open Access article distributed under the terms of the Creative Commons Attribution License (http://creativecommons.org/licenses/by/3.0/),which permits unrestricted reuse, distribution, and reproduction in any medium, provided the original work is properly cited.
Human Molecular Genetics, 2013, Vol. 22, No. 22 4528–4544doi:10.1093/hmg/ddt300Advance Access published on June 25, 2013
Dow
nloaded from https://academ
ic.oup.com/hm
g/article/22/22/4528/581741 by guest on 30 Decem
ber 2021

These precursors have been proposed to originate from a varietyof sources, including the plasma membrane, the endoplasmic re-ticulum and mitochondria (8). These sources may not be mutu-ally exclusive; although the endoplasmic reticulum andmitochondria appear only to be relevant under starvation condi-tions when autophagy is induced, while the plasma membranecontributes to autophagosome precursors under both inducedand basal autophagy conditions (9). The plasma membrane isrecruited to autophagosome precursors as a result of Atg16L1binding to clathrin-coated pits (9). After endocytosis, which isrequired for autophagosome formation, the autophagosome pre-cursors undergo homotypic fusion, which increases their size.This appears to be a prerequisite for recruiting the proteinLC3-II, and the transition to a phagophore, which starts toengulf cytoplasmic contents before its edges fuse to become acompleted autophagosome (10). At this stage, theAtg5-12-16L1 complex dissociates from the autophagosome.LC3-II is the only known protein that specifically associateswith autophagosomes and not with other vesicular structures(11), and a standard way of measuring autophagosome numberis by assaying LC3-II levels (as a function of actin/tubulin) orby counting the number of LC3-positive vesicles (11).
It has been reported that both IGF-1 inhibition and autophagyactivation have beneficial effects on lifespan (1–4) and neurode-generative insults (6,7). Since IGF-1 has been reported to blockautophagy through AKT inhibition, which would be expected tooccur via AKT activation of the direct autophagy inhibitor rapa-mycin complex 1 (mTORC1) (12,13), we anticipated chronicIGF-1 pathway inhibition to induce autophagy, which couldaccount for many of its beneficial properties.
RESULTS
IGF-1R depletion decreases autophagy
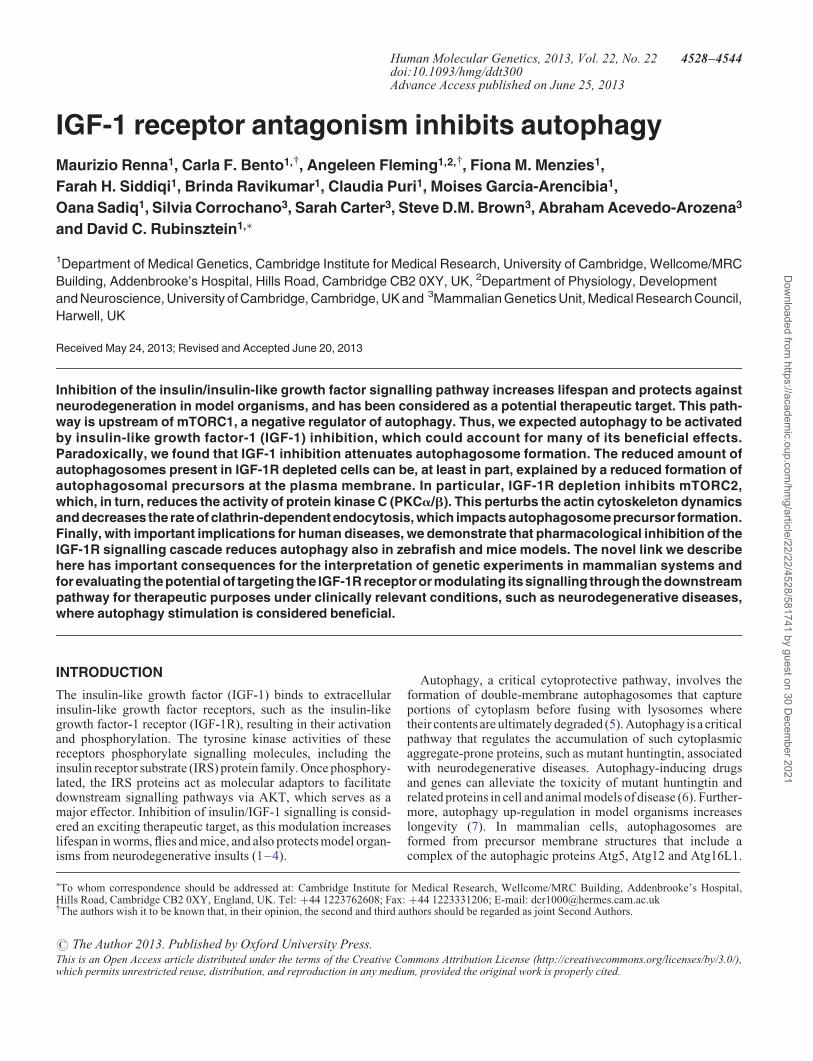
In order to mimic the potential therapeutic strategies of chronicinhibition of IGF-1 signalling based on the in vivo knockout lit-erature (1–4), we initially investigated the effects of knockingdown IGF-1R in cell culture systems. Contrary to expectations,IGF-1R knockdown decreased LC3-II levels in HeLa cellsgrown in a normal medium, as well as in cells treated with satur-ating levels of bafilomycin A1, which blocks LC3-II degradation,thereby allowing one to infer LC3-II formation rates (11), sug-gesting that LC3-II/autophagosome formation was reduced(Fig. 1A and B). Furthermore, IGF-1R depletion also decreasedautophagosome formation in mouse embryonic fibroblasts(MEFs) derived from IGF-1R hemizygous mice (SupplementaryMaterial, Fig. S1A and B).
The endogenous autophagy substrate p62/sequestosome 1(14) was increased in cells where IGF-1R was knocked down(Fig. 1C). Interestingly, the accumulation of p62 was autophagydependent, since this effect was abrogated in the presence of bafi-lomycin A1 (Fig. 1A–C). Another well-known and character-ized autophagy substrate is mutant huntingtin with anexpanded polyQ tract, associated with Huntington’s disease.The percentage of cells with mutant huntingtin aggregatesincreases linearly as a function of its expression and is increasedby autophagy inhibitors (15). Such an effect also occurred uponIGF-1R knockdown (Fig. 1D).
In order to corroborate the effects of IGF-1R inhibition onautophagy, we used a monoclonal antibody (MAB391) thatinduces time-dependent degradation of the human IGF-1R re-ceptor (16). LC3-II levels in the presence of bafilomycin A1
were significantly reduced after 8 h treatment with this antibodyand to a greater extent at 24 h (Fig. 1E and F), as were thenumbers of GFP-LC3 vesicles (Supplementary Material,Fig. S1C). Note worthily, the reduction in autophagosome for-mation observed in these experiments is as large as we seewhen we knockdown key autophagy genes (10). Likewise,MAB391-driven IGF-1R depletion enhanced the accumulationof GFP-Q74 (Supplementary Material, Fig. S1D). Interestingly,we also found that a long-term serum deprivation (8 and 24 h)also reduced autophagosome formation (Supplementary Mater-ial, Fig. S1E and F), even though it has been previously describedhow, under certain metabolic conditions, a short-term serum de-privation can induce autophagy (17,18). This might be compat-ible with the IGF-1R depletion, since both the strategies wouldinhibit growth factor-mediated signalling.
We then tested whether medium-term IGF-1R stimulationwould modulate LC3-II accumulation in the presence of bafilo-mycin A1 (11), when IGF-1 was added back to cells that had beenserum starved for the previous 24 h (since serum starvationdepletes cells of growth factors). Importantly, this strategyenables kinetic experiments that are not possible with the knock-down and antibody approaches we used above. While 8 h ofIGF-1 supplementation had no clear effects on autophagy(Fig. 1G–I), prolonged (24 h) IGF-1 stimulation resulted ina dramatic increase in LC3-II formation in serum-starvedcells, much above the levels observed in serum-starved,non-IGF-1-treated cells (Fig. 1H and I). This effect was compat-ible with the decreased autophagy we observed upon long-termIGF-1R inhibition (Supplementary Material, Fig. S1E and F).Moreover, we also reproduced this phenomenon in mouseprimary cortical neurons (Supplementary Material, Fig. S1Gand H).
Signalling consequences of IGF-1R depletion
We expected IGF-1R inhibition to reduce downstream mTORactivity. mTOR activity resides in two kinase complexes, themTORC1 and mTORC2. The mTORC1 complex that negativelyregulates autophagy also phosphorylates protein p70S6Kinase,and its phosphorylation is widely used to infer mTORC1 activity(19). Surprisingly, IGF-1R siRNA resulted in no obvious effectson either AKT phosphorylation at T308, which correlates with thedownstream mTOR activation (20), FOXO-3A phosphoryl-ation, which has been reported to transcriptionally modulateautophagy (21), or the phosphorylation of p70S6 K, a direct sub-strate of the mTORC1 complex (Fig. 1J and Supplementary Ma-terial, Fig. S1I). As we observed with IGF-1R siRNA, MAB391did not decrease p70S6 K phosphorylation, and had no discern-ible effect on AKT T308 phosphorylation (Fig. 1K and Supple-mentary Material, Fig. S1J). In view of the intimate connectionbetween lysosomes and mTOR signalling (17,22), we alsoassessed whether lysosomal positioning might be altered inIGF-1R depleted cells, but without observing any significantvariation in the intracellular localization of lysosomes (Fig. 1Land M). Furthermore, IGF-1R inhibition did not influenceeither lysosomal pH (Fig. 1N and O) or the degradation activity
Human Molecular Genetics, 2013, Vol. 22, No. 22 4529
Dow
nloaded from https://academ
ic.oup.com/hm
g/article/22/22/4528/581741 by guest on 30 Decem
ber 2021

Figure 1. IGF1-R inhibition decreases autophagy. (A–C) HeLa cells were transfected for 72 h with 50 nM of either control or anti-IGF-1R siRNA. For the assessmentof autophagy by LC3-II levels, bafilomycin A1 was added to the cells in the last 4 h before harvesting. The western blot panels are representative of at least threeindependent experiments performed in triplicate. The graphs in (B) and (C) report the IGF-1R, LC3-II and p62 levels relative to actin. The P-values were determined
4530 Human Molecular Genetics, 2013, Vol. 22, No. 22
Dow
nloaded from https://academ
ic.oup.com/hm
g/article/22/22/4528/581741 by guest on 30 Decem
ber 2021
of the lysosomal compartment (Supplementary Material,Fig. S1K and L).
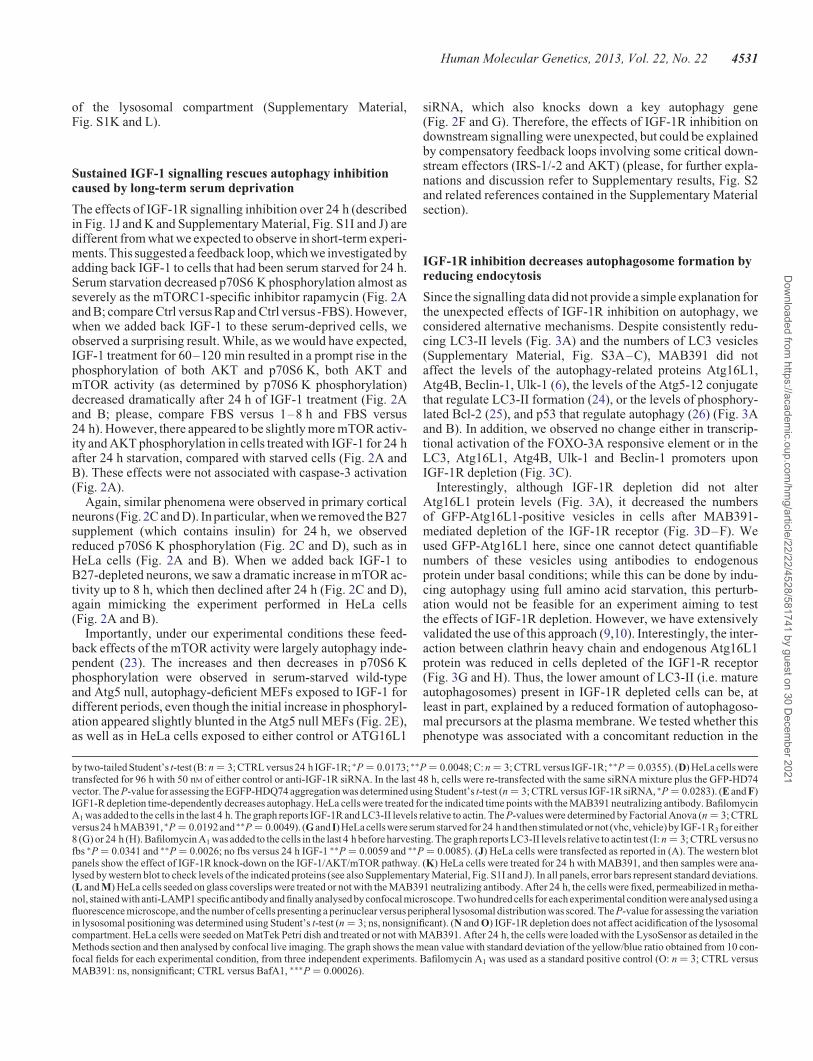
Sustained IGF-1 signalling rescues autophagy inhibitioncaused by long-term serum deprivation
The effects of IGF-1R signalling inhibition over 24 h (describedin Fig. 1J and K and Supplementary Material, Fig. S1I and J) aredifferent from what we expected to observe in short-term experi-ments. This suggested a feedback loop, which we investigated byadding back IGF-1 to cells that had been serum starved for 24 h.Serum starvation decreased p70S6 K phosphorylation almost asseverely as the mTORC1-specific inhibitor rapamycin (Fig. 2Aand B; compare Ctrl versus Rap and Ctrl versus -FBS). However,when we added back IGF-1 to these serum-deprived cells, weobserved a surprising result. While, as we would have expected,IGF-1 treatment for 60–120 min resulted in a prompt rise in thephosphorylation of both AKT and p70S6 K, both AKT andmTOR activity (as determined by p70S6 K phosphorylation)decreased dramatically after 24 h of IGF-1 treatment (Fig. 2Aand B; please, compare FBS versus 1–8 h and FBS versus24 h). However, there appeared to be slightly more mTOR activ-ity and AKT phosphorylation in cells treated with IGF-1 for 24 hafter 24 h starvation, compared with starved cells (Fig. 2A andB). These effects were not associated with caspase-3 activation(Fig. 2A).
Again, similar phenomena were observed in primary corticalneurons (Fig. 2C and D). In particular, when we removed the B27supplement (which contains insulin) for 24 h, we observedreduced p70S6 K phosphorylation (Fig. 2C and D), such as inHeLa cells (Fig. 2A and B). When we added back IGF-1 toB27-depleted neurons, we saw a dramatic increase in mTOR ac-tivity up to 8 h, which then declined after 24 h (Fig. 2C and D),again mimicking the experiment performed in HeLa cells(Fig. 2A and B).
Importantly, under our experimental conditions these feed-back effects of the mTOR activity were largely autophagy inde-pendent (23). The increases and then decreases in p70S6 Kphosphorylation were observed in serum-starved wild-typeand Atg5 null, autophagy-deficient MEFs exposed to IGF-1 fordifferent periods, even though the initial increase in phosphoryl-ation appeared slightly blunted in the Atg5 null MEFs (Fig. 2E),as well as in HeLa cells exposed to either control or ATG16L1
siRNA, which also knocks down a key autophagy gene(Fig. 2F and G). Therefore, the effects of IGF-1R inhibition ondownstream signalling were unexpected, but could be explainedby compensatory feedback loops involving some critical down-stream effectors (IRS-1/-2 and AKT) (please, for further expla-nations and discussion refer to Supplementary results, Fig. S2and related references contained in the Supplementary Materialsection).
IGF-1R inhibition decreases autophagosome formation byreducing endocytosis
Since the signalling data did not provide a simple explanation forthe unexpected effects of IGF-1R inhibition on autophagy, weconsidered alternative mechanisms. Despite consistently redu-cing LC3-II levels (Fig. 3A) and the numbers of LC3 vesicles(Supplementary Material, Fig. S3A–C), MAB391 did notaffect the levels of the autophagy-related proteins Atg16L1,Atg4B, Beclin-1, Ulk-1 (6), the levels of the Atg5-12 conjugatethat regulate LC3-II formation (24), or the levels of phosphory-lated Bcl-2 (25), and p53 that regulate autophagy (26) (Fig. 3Aand B). In addition, we observed no change either in transcrip-tional activation of the FOXO-3A responsive element or in theLC3, Atg16L1, Atg4B, Ulk-1 and Beclin-1 promoters uponIGF-1R depletion (Fig. 3C).
Interestingly, although IGF-1R depletion did not alterAtg16L1 protein levels (Fig. 3A), it decreased the numbersof GFP-Atg16L1-positive vesicles in cells after MAB391-mediated depletion of the IGF-1R receptor (Fig. 3D–F). Weused GFP-Atg16L1 here, since one cannot detect quantifiablenumbers of these vesicles using antibodies to endogenousprotein under basal conditions; while this can be done by indu-cing autophagy using full amino acid starvation, this perturb-ation would not be feasible for an experiment aiming to testthe effects of IGF-1R depletion. However, we have extensivelyvalidated the use of this approach (9,10). Interestingly, the inter-action between clathrin heavy chain and endogenous Atg16L1protein was reduced in cells depleted of the IGF1-R receptor(Fig. 3G and H). Thus, the lower amount of LC3-II (i.e. matureautophagosomes) present in IGF-1R depleted cells can be, atleast in part, explained by a reduced formation of autophagoso-mal precursors at the plasma membrane. We tested whether thisphenotype was associated with a concomitant reduction in the
by two-tailed Student’s t-test (B: n ¼ 3; CTRL versus 24 h IGF-1R; ∗P ¼ 0.0173; ∗∗P ¼ 0.0048; C: n ¼ 3; CTRL versus IGF-1R; ∗∗P ¼ 0.0355). (D) HeLa cells weretransfected for 96 h with 50 nM of either control or anti-IGF-1R siRNA. In the last 48 h, cells were re-transfected with the same siRNA mixture plus the GFP-HD74vector. The P-value for assessing the EGFP-HDQ74 aggregation was determined using Student’s t-test (n ¼ 3; CTRL versus IGF-1R siRNA, ∗P ¼ 0.0283). (E and F)IGF1-R depletion time-dependently decreases autophagy. HeLa cells were treated for the indicated time points with the MAB391 neutralizing antibody. BafilomycinA1 was added to the cells in the last 4 h. The graph reports IGF-1R and LC3-II levels relative to actin. The P-values were determined by Factorial Anova (n ¼ 3; CTRLversus24 hMAB391, ∗P ¼ 0.0192 and ∗∗P ¼ 0.0049). (G and I) HeLa cells were serum starved for24 h and then stimulated or not (vhc,vehicle)by IGF-1R3 for either8 (G) or 24 h (H). Bafilomycin A1 was added to the cells in the last 4 h before harvesting. The graph reports LC3-II levels relative to actin test (I: n ¼ 3; CTRL versus nofbs ∗P ¼ 0.0341 and ∗∗P ¼ 0.0026; no fbs versus 24 h IGF-1 ∗∗P ¼ 0.0059 and ∗∗P ¼ 0.0085). (J) HeLa cells were transfected as reported in (A). The western blotpanels show the effect of IGF-1R knock-down on the IGF-1/AKT/mTOR pathway. (K) HeLa cells were treated for 24 h with MAB391, and then samples were ana-lysed by western blot to check levels of the indicated proteins (see also Supplementary Material, Fig. S1I and J). In all panels, error bars represent standard deviations.(L and M) HeLa cells seeded on glass coverslips were treated or not with the MAB391 neutralizing antibody. After 24 h, the cells were fixed, permeabilized in metha-nol, stainedwith anti-LAMP1 specificantibody and finallyanalysed by confocalmicroscope. Twohundredcells for each experimental condition wereanalysed usingafluorescence microscope, and the number of cells presenting a perinuclear versus peripheral lysosomal distribution was scored. The P-value for assessing the variationin lysosomal positioning was determined using Student’s t-test (n ¼ 3; ns, nonsignificant). (N and O) IGF-1R depletion does not affect acidification of the lysosomalcompartment. HeLa cells were seeded on MatTek Petri dish and treated or not with MAB391. After 24 h, the cells were loaded with the LysoSensor as detailed in theMethods section and then analysed by confocal live imaging. The graph shows the mean value with standard deviation of the yellow/blue ratio obtained from 10 con-focal fields for each experimental condition, from three independent experiments. Bafilomycin A1 was used as a standard positive control (O: n ¼ 3; CTRL versusMAB391: ns, nonsignificant; CTRL versus BafA1, ∗∗∗P ¼ 0.00026).
Human Molecular Genetics, 2013, Vol. 22, No. 22 4531
Dow
nloaded from https://academ
ic.oup.com/hm
g/article/22/22/4528/581741 by guest on 30 Decem
ber 2021

Figure 2. Sustained IGF-1 signalling rescues autophagy inhibition by long-term serum deprivation. (A and B) HeLa cells were serum starved for 24 h and then sti-mulated by 200 ng/ml of the IGF-1 R3 analogue for the indicated time points. Cells treated with rapamycin (200 nM for 24 h) were included as a positive control for themTOR inhibition. The western blot panels reporting the effect of serum deprivation and IGF-1 add-back protocol on phospho/total AKT, phospho/total p70S6Kinaselevels and caspase-3 cleavage are representative of at least three independent experiments performed in triplicate. The P-values of the densitometric analysis weredetermined by Factorial Anova (n ¼ 3; ∗P , 0.05; ∗∗∗P , 0.001; ns ¼ nonsignificant). Please note that the serum deprivation (or B27, in the case of primary neuronalcultures) approach we have used in the experiments described in this figure as well as in Supplementary Material, Figure S2, should not be considered as a standardstarvation protocol (such as incubation with HBSS or EBSS medium), as the media contains L-glutamine, which would promote autophagy. (C and D) Mouse primary
4532 Human Molecular Genetics, 2013, Vol. 22, No. 22
Dow
nloaded from https://academ
ic.oup.com/hm
g/article/22/22/4528/581741 by guest on 30 Decem
ber 2021
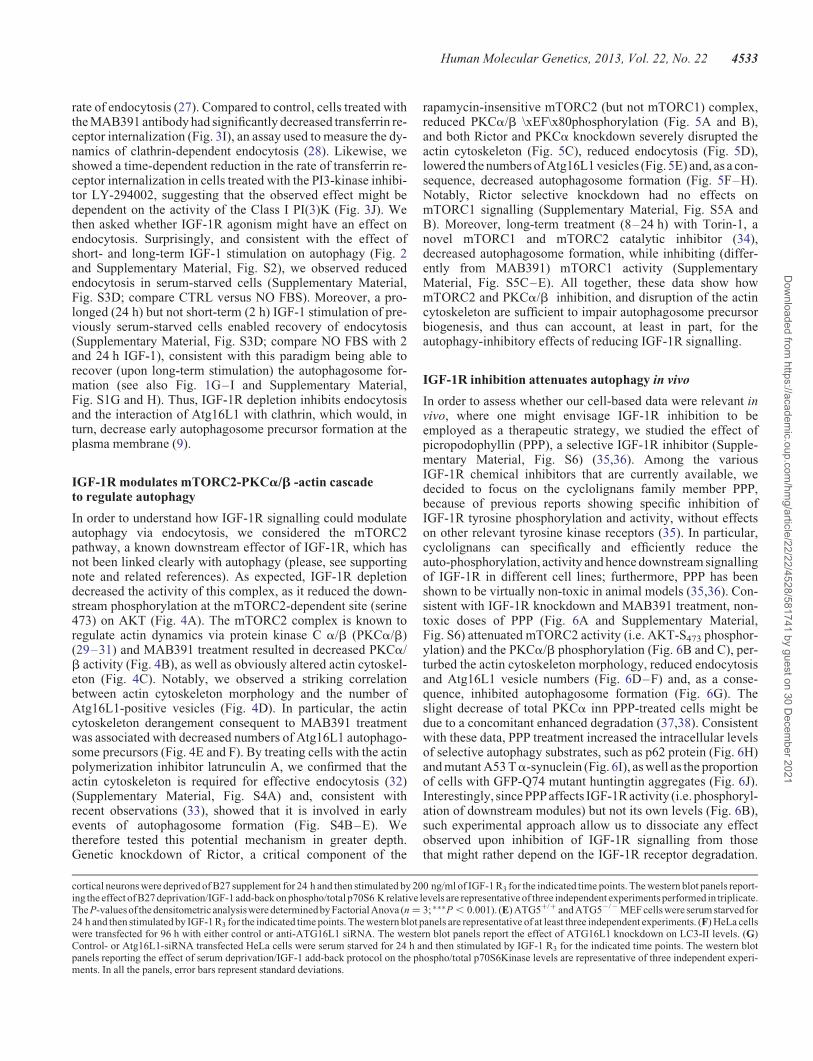
rate of endocytosis (27). Compared to control, cells treated withthe MAB391 antibody had significantly decreased transferrin re-ceptor internalization (Fig. 3I), an assay used to measure the dy-namics of clathrin-dependent endocytosis (28). Likewise, weshowed a time-dependent reduction in the rate of transferrin re-ceptor internalization in cells treated with the PI3-kinase inhibi-tor LY-294002, suggesting that the observed effect might bedependent on the activity of the Class I PI(3)K (Fig. 3J). Wethen asked whether IGF-1R agonism might have an effect onendocytosis. Surprisingly, and consistent with the effect ofshort- and long-term IGF-1 stimulation on autophagy (Fig. 2and Supplementary Material, Fig. S2), we observed reducedendocytosis in serum-starved cells (Supplementary Material,Fig. S3D; compare CTRL versus NO FBS). Moreover, a pro-longed (24 h) but not short-term (2 h) IGF-1 stimulation of pre-viously serum-starved cells enabled recovery of endocytosis(Supplementary Material, Fig. S3D; compare NO FBS with 2and 24 h IGF-1), consistent with this paradigm being able torecover (upon long-term stimulation) the autophagosome for-mation (see also Fig. 1G–I and Supplementary Material,Fig. S1G and H). Thus, IGF-1R depletion inhibits endocytosisand the interaction of Atg16L1 with clathrin, which would, inturn, decrease early autophagosome precursor formation at theplasma membrane (9).
IGF-1R modulates mTORC2-PKCa/b -actin cascadeto regulate autophagy
In order to understand how IGF-1R signalling could modulateautophagy via endocytosis, we considered the mTORC2pathway, a known downstream effector of IGF-1R, which hasnot been linked clearly with autophagy (please, see supportingnote and related references). As expected, IGF-1R depletiondecreased the activity of this complex, as it reduced the down-stream phosphorylation at the mTORC2-dependent site (serine473) on AKT (Fig. 4A). The mTORC2 complex is known toregulate actin dynamics via protein kinase C a/b (PKCa/b)(29–31) and MAB391 treatment resulted in decreased PKCa/b activity (Fig. 4B), as well as obviously altered actin cytoskel-eton (Fig. 4C). Notably, we observed a striking correlationbetween actin cytoskeleton morphology and the number ofAtg16L1-positive vesicles (Fig. 4D). In particular, the actincytoskeleton derangement consequent to MAB391 treatmentwas associated with decreased numbers of Atg16L1 autophago-some precursors (Fig. 4E and F). By treating cells with the actinpolymerization inhibitor latrunculin A, we confirmed that theactin cytoskeleton is required for effective endocytosis (32)(Supplementary Material, Fig. S4A) and, consistent withrecent observations (33), showed that it is involved in earlyevents of autophagosome formation (Fig. S4B–E). Wetherefore tested this potential mechanism in greater depth.Genetic knockdown of Rictor, a critical component of the
rapamycin-insensitive mTORC2 (but not mTORC1) complex,reduced PKCa/b \xEF\x80phosphorylation (Fig. 5A and B),and both Rictor and PKCa knockdown severely disrupted theactin cytoskeleton (Fig. 5C), reduced endocytosis (Fig. 5D),lowered the numbers of Atg16L1 vesicles (Fig. 5E) and, as a con-sequence, decreased autophagosome formation (Fig. 5F–H).Notably, Rictor selective knockdown had no effects onmTORC1 signalling (Supplementary Material, Fig. S5A andB). Moreover, long-term treatment (8–24 h) with Torin-1, anovel mTORC1 and mTORC2 catalytic inhibitor (34),decreased autophagosome formation, while inhibiting (differ-ently from MAB391) mTORC1 activity (SupplementaryMaterial, Fig. S5C–E). All together, these data show howmTORC2 and PKCa/b inhibition, and disruption of the actincytoskeleton are sufficient to impair autophagosome precursorbiogenesis, and thus can account, at least in part, for theautophagy-inhibitory effects of reducing IGF-1R signalling.
IGF-1R inhibition attenuates autophagy in vivo
In order to assess whether our cell-based data were relevant invivo, where one might envisage IGF-1R inhibition to beemployed as a therapeutic strategy, we studied the effect ofpicropodophyllin (PPP), a selective IGF-1R inhibitor (Supple-mentary Material, Fig. S6) (35,36). Among the variousIGF-1R chemical inhibitors that are currently available, wedecided to focus on the cyclolignans family member PPP,because of previous reports showing specific inhibition ofIGF-1R tyrosine phosphorylation and activity, without effectson other relevant tyrosine kinase receptors (35). In particular,cyclolignans can specifically and efficiently reduce theauto-phosphorylation, activity and hence downstream signallingof IGF-1R in different cell lines; furthermore, PPP has beenshown to be virtually non-toxic in animal models (35,36). Con-sistent with IGF-1R knockdown and MAB391 treatment, non-toxic doses of PPP (Fig. 6A and Supplementary Material,Fig. S6) attenuated mTORC2 activity (i.e. AKT-S473 phosphor-ylation) and the PKCa/b phosphorylation (Fig. 6B and C), per-turbed the actin cytoskeleton morphology, reduced endocytosisand Atg16L1 vesicle numbers (Fig. 6D–F) and, as a conse-quence, inhibited autophagosome formation (Fig. 6G). Theslight decrease of total PKCa inn PPP-treated cells might bedue to a concomitant enhanced degradation (37,38). Consistentwith these data, PPP treatment increased the intracellular levelsof selective autophagy substrates, such as p62 protein (Fig. 6H)and mutant A53 Ta-synuclein (Fig. 6I), as well as the proportionof cells with GFP-Q74 mutant huntingtin aggregates (Fig. 6J).Interestingly, since PPP affects IGF-1R activity (i.e. phosphoryl-ation of downstream modules) but not its own levels (Fig. 6B),such experimental approach allow us to dissociate any effectobserved upon inhibition of IGF-1R signalling from thosethat might rather depend on the IGF-1R receptor degradation.
cortical neurons were deprived of B27 supplement for 24 h and then stimulated by 200 ng/ml of IGF-1 R3 for the indicated time points. The western blot panels report-ing the effect of B27 deprivation/IGF-1 add-back on phospho/total p70S6 K relative levels are representative of three independent experiments performed in triplicate.The P-values of the densitometric analysiswere determinedby FactorialAnova (n ¼ 3; ∗∗∗P , 0.001). (E) ATG5+/+ and ATG52/2 MEF cells were serum starved for24 h and then stimulated by IGF-1 R3 for the indicated time points. The western blot panels are representative of at least three independent experiments. (F) HeLa cellswere transfected for 96 h with either control or anti-ATG16L1 siRNA. The western blot panels report the effect of ATG16L1 knockdown on LC3-II levels. (G)Control- or Atg16L1-siRNA transfected HeLa cells were serum starved for 24 h and then stimulated by IGF-1 R3 for the indicated time points. The western blotpanels reporting the effect of serum deprivation/IGF-1 add-back protocol on the phospho/total p70S6Kinase levels are representative of three independent experi-ments. In all the panels, error bars represent standard deviations.
Human Molecular Genetics, 2013, Vol. 22, No. 22 4533
Dow
nloaded from https://academ
ic.oup.com/hm
g/article/22/22/4528/581741 by guest on 30 Decem
ber 2021

Figure 3. IGF1-R inhibition decreases autophagosome precursor formation by reducing clathrin-dependent endocytosis. (A and B) HeLa cells were treated for 24 hwith the MAB391 antibody to evaluate the effect of the IGF-1R depletion on the levels of the indicated autophagy-related proteins. The western blots are representativeof experimentsperformed in triplicate. (C) HeLa cells were transfected with 0.5 mg firefly luciferase reporter plasmids containing the FOXO-3A responsive element orthe indicatedAtg gene promotersplus0.05 mgof the Renilla luciferase reporter controlplasmid. After24 h, the cells were treated for a further 24 hwith MAB391.RLUvalues are reported as the average and standard deviations of at least three independent experiments carried out in triplicate. Statistical analysis was performed usingStudent’s t test (n ¼ 3; CTRL versus 24 h MAB391, FOXO-3A: P ¼ 0.2825, LC3: P ¼ 0.1707, ATG16L1: P ¼ 0.2268, ATG4B: P ¼ 0.0672, ULK-1: P ¼ 0.0768,
4534 Human Molecular Genetics, 2013, Vol. 22, No. 22
Dow
nloaded from https://academ
ic.oup.com/hm
g/article/22/22/4528/581741 by guest on 30 Decem
ber 2021

Nonetheless, the PPP data are entirely consistent with whatwe have reported above with either genetic knockdown of thereceptor or MAB391 treatments in terms of modulation ofmTORC2-related signalling and autophagy.
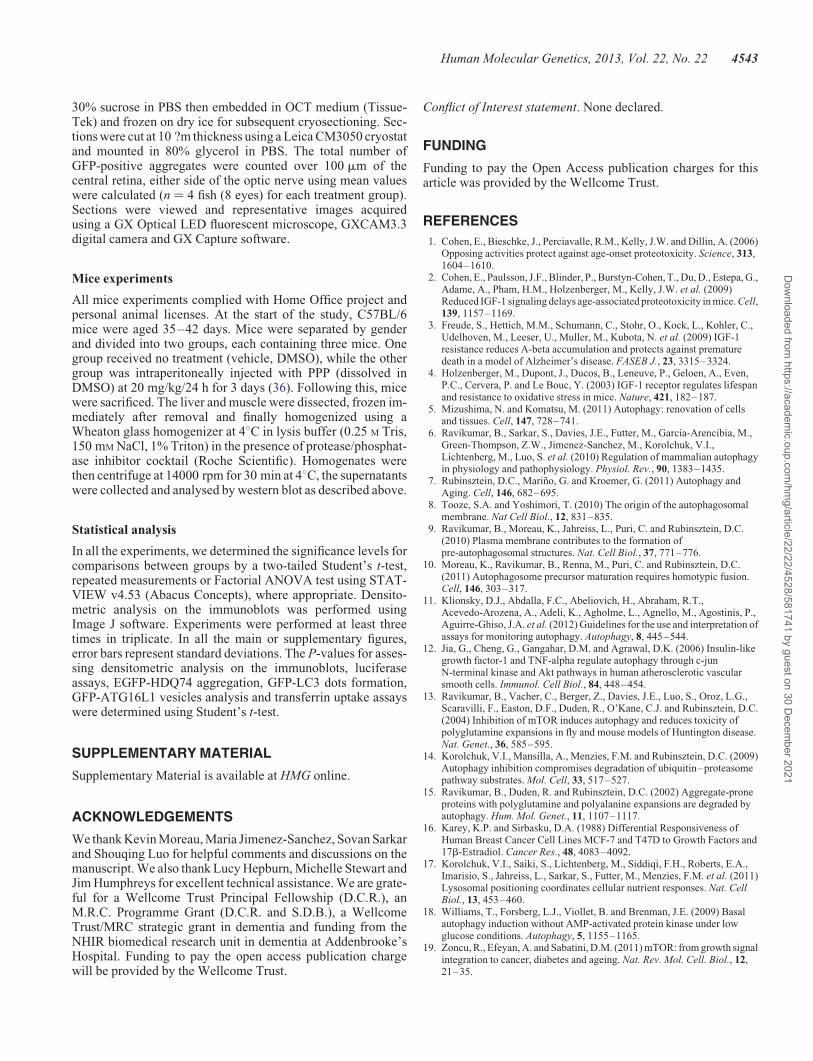
We initially assessed the effects of PPP in vivo in a zebrafishmodel, where we have previously optimised the use of NH4Clas an autophagosome degradation blocker analogous to bafilo-mycin A1 (39). PPP decreased autophagosome formation in zeb-rafish larvae (Fig. 7A and B). Consistent with these data, PPPtreatment increased the number of aggregates of mutant hunting-tin expressed in the zebrafish rod photoreceptors (Fig. 7C and D),in a manner similar to what we previously observed with otherautophagy inhibitors (39,40). This also contrasts with the reduc-tion in aggregate numbers in this model seen with autophagyinducers, as we have observed previously (41), and as shownhere with clonidine (Fig. 7C and D). In mice, intra-peritoneal ad-ministration of PPP effectively decreased AKT phosphorylation(S473) as well as PKCa/b phosphorylation, and reduced LC3-IIlevels in mouse liver (Fig. 7E) and muscle (Fig. 7F). Overall, theeffects exerted by PPP in vivo appear to be biologically signifi-cant—for instance, in the zebrafish the huntingtin aggregatecounts increased by 30% (Fig. 7D) whereas in the mousemuscle, there appeared to be a reduction of LC3 by �50%(Fig. 7F). Hence, IGF-1R antagonism can effectively downmodulate the activity of the autophagic pathway in vivo.
DISCUSSION
The IGF-1R pathway has received extensive attention as its in-hibition increases lifespan and ameliorates neurodegenerativediseases in a range of model organisms (1–4). Furthermore,the potential druggability of the receptor suggests that it maybe suitable for therapeutic targeting. Nonetheless, our datasuggest that serious caution is warranted with this approach.IGF-1R inhibition decreases mTORC2, which, in turn, reducesthe activity of PKCa/b. This perturbs the actin cytoskeletonand decreases the rate of endocytosis, which impacts autophago-some precursor formation (summarized in Fig. 7G). Thus, con-trary to expectations, IGF-1R inhibition has liabilities withregard to autophagy. These data are consistent with a studyfrom Yamamoto et al., who showed that IRS2 positively regu-lates mutant huntingtin clearance in an autophagy-dependentmanner, although this study did not make connections withIGF-1R or mTORC2 signalling (42). Our findings have import-ant consequences for the interpretation of genetic experiments inmammalian systems and for evaluating the potential of targetingthe receptor and/or modulating signalling through the
downstream pathway for therapeutic purposes. For instance,this additional mechanism would likely have impact on theoverall efficacy of IGF-1R down-modulation with respect to neu-rodegenerative diseases, where autophagy is beneficial(7,13,15,41–43). This may even be relevant in terms of longevity,since IGF-1R signalling inhibition does not appear to have cleareffects on lifespan in male mice (44), leading these authors tosuggest that the effects of inhibiting this pathway in mammalsmay not be as straightforward as has been predicted by inverte-brate studies (44). One may be able to bypass this additionaleffect by targeting downstream effectors of the IGF-1Rpathway, although these should also be tested for unforeseenside effects. Moreover, from a pharmacological point of view,such modules could result more challenging to be targeted thanthe receptor itself. Indeed, it is tempting to speculate that onemay be able to achieve synergistic benefits by inhibiting the keyeffectors of the IGF-1R pathway, alongside pharmacologicalstimulation of the autophagic pathway. Finally, our data alsosuggest that there may be benefits in using dual mTORC1/2 cata-lytic inhibitors if administered over longer periods, as these mayresult in inhibiting autophagy, which may decrease viability ofat least some types of cancers (43,45,46).
MATERIALS AND METHODS
Antibodies
The following antibodies have been used in this work: anti-LC3(Novus Biological); anti-human IGF-1R neutralizing antibody(MAB391, R&D Systems); mouse monoclonal anti-LC3(Nanotools); mouse monoclonal anti-LAMP1 (clone H4A3,obtained from Developmental Studies Hybridoma Bank,University of Iowa); anti-IGF-1R, anti-IRS-1, anti-IRS-2,anti-bcl2, anti-p53, anti-phospho(T308)-AKT (SantaCruz)anti-Beclin-1, anti-phospho-Bcl2, anti-Ulk1, anti-caspase-3,anti-phospho(T389) and total-p70S6kinase, anti-phospho(S473) and total-AKT, anti-phospho-PKC(a/b) andtotal-PKCa; anti-Rictor, anti-phospho- and total-FOXO3A(Cell Signal); anti-human sestrin-1 antibody (Abnova);anti-clathrin heavy chain and anti-p62 (BD Bioscience); anti-Atg16L1 (MBL); anti-Atg5 and anti-actin (Sigma); anti-Atg4B(AbCam); anti-HA antibody (Covance); anti-mouse and anti-rabbit HRP-conjugated secondary antibodies (GE Healthcare),AlexaFluor594- and AlexaFluor488-conjugated goat anti-mouse; AlexaFluor488-conjugated goat anti-rabbit secondaryantibodies, AlexaFluor647-conjugated human transferrin andAlexaFluor594-conjugated phalloidin were from MolecularProbes (Invitrogen).
BECLIN-1: P ¼ 0.1769). (D–F) HeLa cells were transfected with 0.5 mg of the GFP-Atg16L1 construct. After 24 h, the cells were treated for 24 h with MAB391,fixed and analysed under fluorescence microscope. The P-values for assessing the percentage of cells showing≥20 GFP-Atg16-positive vesicles as well as the numberof GFP-Atg16 vesicles/cell were determined by Student’s t-test (E: n ¼ 3; CTRL versus 24 h MAB391, P ¼ 0.00272; F: n ¼ 3; CTRL versus 24 h MAB391, P ¼0.00496). (G and H) HeLa cells were treated for 24 h with MAB391 and then lysed as detailed in the Methods section. Equal amounts of total protein were immu-noprecipitated with the anti-ATG16L1 antibody and the amount of interacting clathrin heavy chains assessed by western blot analysis. The graph in (H) shows thequantitative analysis of endogenous clathrin heavy chain co-immunoprecipitated by Atg16L1. The P-value of the densitometric analysis was determined by Student’st-test on three independent experiments (G: n ¼ 3; CTRL versus 24 h MAB391, P ¼ 0.0223). (I and J) HeLa cells were treated for 24 h with 10 mg/ml MAB391 orLY294002 (10 mM) for the indicated times. The binding and internalization assays for the fluorochrome-conjugated human transferrin were then performed asdescribed in the Methods section. The amount of internalized ligand was measured by FACS analysis. The graphs report the total amount of internalized transferrin(Tf) at different time points (as indicated), and normalized to the amount of Tf bound to the cognate receptor at the cell surface at Time 0 (i.e. before the temperatureshift). The P-values to assess the differences in the rate of internalization of transferrin receptor were determined by Student’s t-test on five independent experiments (I:n ¼ 5, P-values are shown in the figure; J: n ¼ 5; CTRL versus 8 h LY294002, T10, P ¼ 0.0012; T15, P ¼ 0.0017; CTRL versus 24 h LY294002, T10, P ¼ 0.00022,T15, P ¼ 0.00031). In all the panels, error bars represent standard deviations.
Human Molecular Genetics, 2013, Vol. 22, No. 22 4535
Dow
nloaded from https://academ
ic.oup.com/hm
g/article/22/22/4528/581741 by guest on 30 Decem
ber 2021

Figure 4. IGF-1R depletion reduces Atg16L1 vesicles formation by impairing the actin cytoskeleton dynamics. (A and B) HeLa cells were treated for the indicatedtime points with MAB391. Samples were then assayed for evaluating the effect of IGF-1R depletion on the levels of the indicated proteins. The western blots arerepresentative of experimentsperformed in triplicate. The graphs in (A) and (B) report the IGF-1Rto actin, phospho(S473)/total AKT and phospho/totalPKCa relativelevels, respectively. The P-values were determined by two-tailed Student’s t-test (A: n ¼ 3; CTRL versus 24 h MAB391; IGF-1R ∗∗P ¼ 0.00378; P-AKT ∗∗P ¼0.00586) (B: p-PKCa n ¼ 3; CTRL versus 4 h MAB391 P ¼ 0.43301; CTRL versus 8 h MAB391 P ¼ 0.14323; CTRL versus 2 h MAB391 ∗P ¼ 0.02914).(C) HeLa cellswere treated or not with MAB391. After 24 h, the cells werefixed, permeabilized, stainedwith phalloidin and finallyanalysed by a confocalmicroscope.(D–F) HeLa cells seeded on glass coverslips were transfected with the 0.5 mg of GFP-ATG16 vector and treated or not with 10 mg/ml of the MAB391 neutralizingantibody. After 24 h, the cells were fixed, permeabilized, stained with phalloidin and finally analysed by a confocal microscope. The P-values for assessing thenumber of GFP-ATG16 vesicles, the percentage of cells showing ≥20 GFP-Atg16 vesicles and the actin cytoskeleton derangement were determined by Student’st-test (F: n ¼ 3, CTRL versus 24 h MAB391, actin derangement: ∗∗P ¼ 0.00244; percentage of cells with ≥20 ATG16 vesicles/cell: #P ¼ 0.00228; number ofGFP-ATG16 vesicles/cell: §P ¼ 0.00336). In all the panels, error bars represent standard deviations.
4536 Human Molecular Genetics, 2013, Vol. 22, No. 22
Dow
nloaded from https://academ
ic.oup.com/hm
g/article/22/22/4528/581741 by guest on 30 Decem
ber 2021

Constructs
The EGFP-HDQ74 vector was characterized previously (47);the EGFP-LC3 and EGFP-ATG16L1 were kind gifts fromYoshimori. The luciferase reporter construct under thecontrol of the synthetic Forkhead promoter (FOXO-3A luci-ferase) was a kind gift of Brunet (48). The luciferase vectorcontaining the human Beclin-1 promoter region has beendescribed elsewhere (49). The human LC3, Atg16L1, Atg4Band Ulk-1 promoter vectors were obtained from Yoshida(50). The Renilla luciferase vector was purchased from
Promega. The chimeric immunoglobulin receptor expressionvector (Fcg-RI-g) has been described previously (51).
Chemicals
The human IGF-1R, Rictor, PKCa and ATG16L1 SMART poolsiRNA reagent (Dharmacon) were used at a final concentrationof 50 nM. The anti-human IGF-1R MAB391 antibody (16) wasused at a final concentration of 10 mg/ml. The IGF-1 R3 analogue(Sigma) was used at a final concentration of 200 ng/ml. Bafilo-mycin A1 (Millipore) and rapamycin (Sigma) were used at a
Figure 5. The Rictor/PKCa cascade controls the autophagosome formation by regulating the rate of endocytosis. (A and B) HeLa cells were transfected with control,Rictor, or PKCa siRNA. After 96 h, the cells were lysed and the samples subjected to western blot analysis to evaluate the effect of knockdown on the indicated pro-teins. The western blots are representative of experiments performed in triplicate. The graph in (B) reports the rictor/actin, and phospho/total PKCa relative levels,respectively. The P-values were determined by two-tailed Student’s t-test (B: n ¼ 3; CTRL versus Rictor kd; Rictor ∗∗∗P ¼ 0.00089; p-PKC ∗∗P ¼ 0.01225)(C) HeLa cells seeded on glass coverslips were transfected as indicated in A. After 96, cells were fixed, permeabilized, stained with phalloidin and finally analysedby a confocal microscope. (D) HeLa cells were transfected with control, rictor, or PKCa siRNA. After 96 h, the binding and internalization assays of the fluorochrome-conjugated human transferrin were then performed. The P-values to assess differences in the internalization of transferrin receptor were determined by Student’s t-teston six independent experiments (n ¼ 6, P-values relative to T15 are shown in the figure). (E) The P-values for assessing the number of GFP-Atg16 vesicles, the per-centage of cells showing ≥20 GFP-Atg16 vesicles and the actin cytoskeleton derangement were determined by Student’s t-test (n ¼ 3; actin derangement: Rictor kd,P ¼ 0.0015, PKCa kd, P ¼ 0.0049; percentage of cells with ≥20 ATG16 vesicles: rictor kd, P ¼ 0.0136, PKCa kd, P ¼ 0.0231; number of ATG16 vesicles: Rictorkd, P ¼ 0.00122, PKCa kd, P ¼ 0.00421). (F–H) HeLa cells were transfected for 96 h with 50 nM of control, rictor or PKCa siRNA. Bafilomycin A1 was added to thecells in the last 4 h before harvesting. The graph shows the LC3-II levels relative to actin panels, error bars represent standard deviations (n ¼ 3; Ctrl versus Rictor kd:P ¼ 0.0279 and P ¼ 0.0079 in the presence of BafA1; Ctrl versus PKCa kd: P ¼ 0.0145 and P ¼ 0.0005, respectively).
Human Molecular Genetics, 2013, Vol. 22, No. 22 4537
Dow
nloaded from https://academ
ic.oup.com/hm
g/article/22/22/4528/581741 by guest on 30 Decem
ber 2021

Figure 6. Chemical inhibition of IGF-1R signalling inhibits autophagy. (A) PPP toxicity assessment. The orally active IGF-1R selective inhibitor PPP was dissolved indimethyl sulfoxide (DMSO) and added to normally growing HeLa cells for 24 h at the indicated dosages. Cells were then lysed and analysed by western blot for thecaspase-3 cleavage. In these experiments, staurosporine (8 h at 1 mM) was included as a positive control for the activationof the apoptoticcascade. (B and C) HeLa cellswere treated for 24 h with the indicatedconcentrations of the selective IGF-1RinhibitorPPP. Sampleswere then subjected to western blot analysis to evaluate the effectof PPP on the indicated proteins. The western blots are representative of experiments performed in triplicate. The graph in (C) reports the phospho(S473)/total AKTand phospho/total PKCa relative levels, respectively. The P-values were determined by a two-tailed Student’s t-test (n ¼ 3; CTRL versus 100 nM PPP, p-AKT ∗P ¼0.03099; p-PKCa ∗P ¼ 0.04724; CTRL versus 200 nM PPP p-AKT ∗∗∗P ¼ 0.00019; p-PKCa ∗P ¼ 0.02037). (D) HeLa cells were treated for 24 h with the indicatedconcentrations of PPPand endocytosis of transferrin receptor analysed. The P-values to assessdifferences in the internalization of transferrin receptor were determinedby Student’s t-test (n ¼ 5, P-values relative for transferrin uptake at T15 in PPP-treated, compared with control cells, are shown in the main figure). (E and F) HeLa
4538 Human Molecular Genetics, 2013, Vol. 22, No. 22
Dow
nloaded from https://academ
ic.oup.com/hm
g/article/22/22/4528/581741 by guest on 30 Decem
ber 2021

final concentration of 400 and 200 nM, respectively. Torin1 (kindly provided by Gray and Sabatini) was dissolvedin dimethyl sulfoxide (DMSO) and used at 200 nM. LY294002and Latrunculin A (Sigma) were used at final concentrations of10 and 1 mM, respectively. MG132 (Sigma) was used at 10 mM.The IGF-1R selective inhibitor picropodophyllotoxin (PPP,Tocris) was dissolved in DMSO and used at the indicated con-centrations. Clonidine (Sigma) was dissolved in DMSO andused at 30 mM. LysoSensor Yellow/Blue DND-160 was fromMolecular Probes (Invitrogen).
Cell culture
HeLa, ATG5+/+ and ATG5– /2 MEF, IGF-1R+/+ andIGF-1R+/2 MEF cells were grown at 378C in 10% FBS, 2 mM
L-glutamine, pen/strep supplemented Dulbecco’s modifiedEagle’s medium (DMEM). For the IGF-1 forward signallingexperiments, HeLa and MEF cells were serum-deprived for24 h, and then the IGF-1 R3 was added under the same mediaconditions, for different time points ranging from 1 to 24 h, asdetailed in the Results section.
Isolation and culture of mouse primary cortical neurons
Primary cortical neurons were isolated from C57BL/6 miceembryos at E16.5 (Jackson Laboratories). Briefly, pup brainswere harvested and placed in ice-cold DMEM where the menin-ges were removed and the cerebral cortices were dissected andincubated in DMEM. After mechanical dissociation usingsterile micropipette tips, dissociated neurons were resuspendedin DMEM and centrifuged. Cell count and viability assay wereperformed using the trypan blue exclusion test. Viable cellswere seeded on poly-D-lysine and laminin-coated 6-multiwellplates (7.5 × 10⁵ cells per well). Cells were cultured inDMEM supplemented with 2 mM glutamine, 2% B27 supple-ment and 1% Penicillin-Streptomycin-Fungizone (PSF; Invitro-gen) at 378C in a humidified incubator with 5% CO2 and 95% O2.One half of the culturing medium was changed every two daysuntil treatment. After 7 days of culturing in vitro, differentiatedcortical neurons were B27-deprived for 24 h and then stimulatedwith the IGF-1 R3 analogue as indicated in the relevant figurelegends. For the assessment of autophagy by LC3-II levels, a sat-urating concentration (400 nM) of bafilomycin A1 was added tothe cells in the last 4 h before harvesting.
Transfection
In all the RNA interference experiments, HeLa cells were trans-fected 24 h after seeding with a 50 nM final concentration of theindicated SMARTpool siRNAs using Lipofectamine 2000,according to the manufacturer’s instructions (Invitrogen).Cells were then cultured in a full medium for 72–96 h. For theassessment of autophagy by LC3-II levels, a saturating concen-tration (400 nM) of bafilomycin A1 was added to the cells in thelast 4 h before harvesting (52). For the EGFP-HD74 aggregationexperiments upon IGF-1R knockdown, HeLa cells were firsttransfected as above reported. Forty-four hours after the firstround of transfection, the cells were re-transfected with the fol-lowing combination: EGFP-HDQ74 plus either control or spe-cific siRNA (2 mg: 50 nM) and kept in culture for the next 48 h.To assess the effect of the neutralizing antibody, HeLa cellswere transfected with 2 mg of the EGFP-HD74 for 48 h andthen challenged or not with MAB391 for 24 h. Cells werefinally washed and fixed with 4% paraformaldehyde (Sigma),mounted in ProLong Antifade (Invitrogen) and observed witha fluorescence microscope. For the GFP-LC3 dots experiments,HeLa cells were transfected with 0.5 mg of the EGFP-LC3 for24 h, challenged or not with MAB391 for the following 24 hand then fixed, mounted on coverslips and analysed with a fluor-escence microscope.
IGF-1R knockdown and depletion experiments
In all the RNA interference experiments, cells were transfectedwith a 50 nM final concentration of the SMART pool siRNAs(Dharmacon) using Lipofectamine 2000 (Invitrogen). For theIGF-1R depletion experiments, HeLa cells were treated at differ-ent time points with the anti-human IGF-1R MAB391 at a finalconcentration of 10 mg/ml.
Transfection experiments for luciferase reporter assays
HeLa cells were seeded in six multiwells and transfected with0.5 mg of the indicated luciferase reporter vectors plus 0.05 mgof the renilla luciferase and cultured in a full medium for 24 h.Cells were then treated or not with the MAB391 neutralizingantibody for 24 h and finally lysed in reporter lysis buffer(Promega). Firefly and Renilla luciferase activities were mea-sured in a luminometer using the Dual-Glo luciferase assay kit(Promega). The relative luciferase activity (RLU) is defined asthe firefly-to-renilla luciferase activity ratio and normalized forthe protein concentration of each sample. In all experiments,
cells transfected with the GFP-ATG16 vector were treated or not with 200 nM of PPP. After 24 h, the cells were fixed, permeabilized in 0.1% Triton X-100, stained withphalloidin and finally analysed by confocal microscopy. The P-values for assessing the number of GFP-ATG16 vesicles, the percentage of cells showing ≥20GFP-Atg16 vesicles and the actin cytoskeleton derangement were determined using Student’s t-test (n ¼ 3; actin derangement: Ctrl versus PPP, P ¼ 0.0013; percent-age ofcells showing≥20 GFP-Atg16vesicles:Ctrl versusPPP, P ¼ 0.0121;number of GFP-ATG16 vesicles/cell: §P ¼ 0.00629) (G) HeLa cells were treated for 24 hwith the indicated concentrations of PPP. Bafilomycin A1 was added to the cells in the last 4 h before harvesting. The graph shows the LC3-II levels relative to actin(n ¼ 3; 100 nM PPP: P ¼ 0.0081; 200 nM PPP: P ¼ 0.0062, in the absence of BafA1; 100 nM PPP: P ¼ 0.0031; 200 nM PPP: P ¼ 0.0005, in the presence of BafA1). Inall the panels, error bars represent standard deviations. (H) HeLa cells were treated as already described in (B). The graph in (I) reports the p62 levels relative to actin.The P-values were determined by two-tailed Student’s t-test (n ¼ 3; CTRL versus 100 nM PPP; ∗P ¼ 0.0279; ∗∗∗P ¼ 0.00086). (I) PPP impairs clearance of mutant(A53 T) a-synuclein in stable inducible PC12 cells. The A53 T a-synuclein transgene was induced with doxycycline for 48 h and then switched off (by antibioticremoval) before the cells were treated with the vehicle alone (DMSO), rapamycin (200 nM) or PPP at the indicated concentrations for a further 24 h. The graph in(I) reports the A53T-synuclein levels relative to actin. The P-values were determined by a two-tailed Student’s t-test (n ¼ 3; CTRL versus rapamycin ∗∗P ¼0.0087; CTRL versus 100 nM PPP ∗P ¼ 0.0469; CTRL versus 200 nM PPP ∗P ¼ 0.0122). (J) HeLa cells were transfected with 2 mg of the GFP-HD74 vector for48 h. In the last 24 h, the cells were treated or not with the indicated concentrations of PPP. The P-value for assessing the EGFP-HDQ74 aggregation was determinedusing Student’s t-test (n ¼ 3; CTRL versus 100 nM PPP, ∗∗∗P ¼ 0.00073; CTRL versus 200 nM PPP, ∗∗∗P ¼ 0.00019).
Human Molecular Genetics, 2013, Vol. 22, No. 22 4539
Dow
nloaded from https://academ
ic.oup.com/hm
g/article/22/22/4528/581741 by guest on 30 Decem
ber 2021

Figure 7. IGF-1R signalling perturbation reduces autophagy in vivo. (A and B) PPP inhibits autophagic flux in zebrafish larvae. Ammonium chloride (NH4Cl) causessignificant increases in levels of LC3-II in zebrafish larvae, consistent with an ability to block autophagosome/lysosome fusion. Co-treatment with PPP significantlydecreases the levels of LC3-II in the presence of ammonium chloride. The panel shows western blots for IGF-1R and LC3-II against actin, used as loading control. Thegraphs represent densitometric analyses of three independent experiments (n ¼ 3; P ¼ 0.0349). (C and D) Aggregate counting was performed using the heterozygouslarvae from the transgenic (rho:EGFP-HTT71Q)cu5 zebrafish line. From3 d.p.f. to 7 d.p.f., transgenicHD zebrafish larvaewere dark-reared in embryo mediumalone orembryo medium containing either DMSO, 30 mM clonidine or 100 mM PPP. At 7 d.p.f., larvae were anaesthetized and fixed in 4% paraformaldehyde (PFA). Larvaewere washed, embedded in OCT medium and frozen on dry ice for subsequent cryosectioning. The total number of GFP-positive aggregates was counted over 100 mm
4540 Human Molecular Genetics, 2013, Vol. 22, No. 22
Dow
nloaded from https://academ
ic.oup.com/hm
g/article/22/22/4528/581741 by guest on 30 Decem
ber 2021

the values are reported as the average and standard deviations ofat least three independent experiments carried out in triplicate.Statistical analysis was performed using Student’s t-test.
Western blot analysis
Cells were washed and harvested in ice-cold PBS and pelletswere lysed on ice in Laemmli buffer for 30 min, in the presenceof a protease/phosphatase inhibitors mix (Roche). Proteinsamples were boiled for 5–7 min at 1008C, separated bySDS–PAGE, and then subjected to western blot analysis.
Co-immunoprecipitation assays
To analyse the ATG16L1/clathrin heavy-chain interaction,HeLa cells were lysed on ice for 30 min in Buffer B (10 mM
Tris–HCl, 150 mM NaCl, 1 mM EDTA, pH: 8.0), supplementedwith protease and phosphatase inhibitors mix, in the presence of1% Triton X-100. Lysate were then cleared by centrifugation andequal amounts (1.5 mg) of total protein were incubated for 16 hwith the anti-ATG16L1 antibody (1 : 200) on a rotating wheel.Immunocomplexes were isolated with protein G-sepharose(GE-Healthcare Amersham), extensively washed, resuspendedand boiled in Laemmli sample buffer, separated by SDS–PAGE and then subjected to western blot analysis.
Analysis of autophagy
Assessment of autophagic flux by endogenous LC3-II levels orvesicles, eGFP-LC3 or eGFP-ATG16L1 vesicles and the clear-ance of exogenous autophagy substrates (A53 T a-synucleinand GFP-HDQ74 exon 1 huntingtin) were performed as detailedbelow.
Quantification of poly-Q74 huntingtin aggregatesformation, LC3-positive and Atg16L1-positive vesicles
Quantification of aggregate formation and LC3 dots wereassessed as already previously described (16,52). Two hundredEGFP-HDQ74 transfected cells were selected and the numberof cells with aggregates counted using a fluorescence micro-scope. For quantification of LC3-II dots upon transfection, 200EGFP-LC3 positive HeLa cells were selected and cells with�20 or more LC3-labelled vesicles were counted. Quantifica-tion of cells showing GFP-Atg16L1 vesicles was performed aspreviously described (9,10). Briefly, the number ofGFP-ATG16L1 per transfected cell was scored, and then the per-centage of cells showing at ≥20 GFP-ATG16L1-positive
vesicles was also calculated and plotted. The identity of theslides was unavailable to the observer until all slides had beenstudied. The experiments were performed in triplicate andrepeated at least three times. Quantification of endogenousLC3-II dots was performed as previously described (53). Twohundred cells for each experimental condition were analysedby fluorescence microscopy and number of endogenous LC3dots were scored in a blinded fashion. The P-values for assessingthe number of LC3 dots/cell were determined using Student’st-test.
Clearance of mutant A53 T a-synuclein
As previously described (54), stable inducible PC12 cell linesexpressing A53 Ta-synuclein were induced with 1 mg/ml doxy-cycline for 48 h. Transgene expression was switched off by re-moving the antibiotic from the medium and then the cells weretreated for 24 h with the vehicle alone (DMSO), rapamycin(200 nM) or PPP at the indicated concentrations for a further24 h. The levels of A53 T transgene were then assessed bywestern blot analysis. Experiments were performed in triplicateand on at least three different occasions and quantified by densi-tometry normalized to actin.
Ovoalbumin degradation assay
HeLa cells were seeded in six-well plates and transiently trans-fected with 1 mg of a phagocytosis-competent, chimeric im-munoglobulin receptor expression vector (Fcg-RI-g) (50) andcultured in full medium for 24 h. To allow phagocytosis of IgG-coated beads, HeLa cells were incubated (2 h; 378C) with fluor-escent beads (Polysciences) covalently conjugated with humanpolyclonal IgG and ovalbumin (OVA), thoroughly washed andthen incubated for a further 24 h to permit degradation of inter-nalized beads in the presence or absence of the anti-humanIGF-1R monoclonal antibody (MAB391). The cells were thenplaced at 48C to prevent bead internalization, stained with ahuman IgG-specific antibody (Jackson ImmunoResearch) tomark non-internalized beads and then fixed. Internalized beadswere subsequently recovered by cell disruption (lysis with 1%Triton X-100 for 30 min followed by homogenization bypassage through a hypodermic needle in the presence of pro-teases inhibitors) and then incubated with an OVA-specificFITC-conjugated antibody (Abcam) to detect remainingbead-associated OVA, which was quantified by flow cytometryon a FACSCalibur apparatus (Becton Dickinson), as previouslyreported (53).
of the central retina, either side of the optic nerve. Sections were viewed and representative images acquired using a GX Optical LED fluorescent microscope. Numbersof positive aggregates were scored and mean values were calculated for each treatment group (n ¼ 4 fish/8 eyes; DMSO versus PPP: P ¼ 0.00317). (E and F) PPPinhibits autophagy and reduces steady-state levels of LC3-II in mice. Mice were subjected to intra-peritoneal injection with either PPP (20 mg/kg/24 h) for 3 days.Following sacrifice, the liver and muscle were homogenized and samples analysed by western blotting for levels of the indicated proteins. The graphs represent themean results of the phospho/total PKCa and LC3-II levels relative to actin from three mice per group (E: liver, n ¼ 3; p-PKCa P ¼ 0.03178, LC3-II P ¼ 0.02726) (F:muscle, n ¼ 3; p-PKCa P ¼ 0.02523, LC3-II P ¼ 0.01843). In all the panels, error bars represent standard deviations. (G) Proposed model for the IGF-1R signalling-dependent modulation of the autophagic pathway. IGF-1R depletion reduces autophagy and has no effect on the canonical mTORC1 complex-mediated signallingpathway. The reduced amount of autophagosomes present in IGF-1R depleted cells can be, at least in part, explained by a reduced formation of autophagosomal pre-cursors at the plasma membrane. In particular, IGF-1R depletion inhibits mTORC2, which in turn reduces the activity of PKCa/b. This perturbs the actin cytoskeletondynamics and decreases the rate of clathrin-dependent endocytosis, which negatively impacts autophagosome precursor formation. This has important consequencesfor the interpretation of genetic experiments in mammalian systems and for evaluating the potential of modulating the signalling through this pathway for therapeuticpurposes.
Human Molecular Genetics, 2013, Vol. 22, No. 22 4541
Dow
nloaded from https://academ
ic.oup.com/hm
g/article/22/22/4528/581741 by guest on 30 Decem
ber 2021

Transferrin uptake and internalization assay
In order to measure clathrin-dependent endocytosis, internaliza-tion assays of fluorochrome-conjugated human transferrin (Tf)were performed using Alexa 647-conjugated Tf (50 mg/ml) at378C for 0 up to 15 min as previously described (28). Briefly,HeLa cells were washed once with serum-free medium, trypsi-nized, collected in Eppendorf tubes, chilled on ice for 15 minto arrest endocytosis and finally loaded with transferrin toallow the binding to the tranferrin receptor (20 min on ice).After binding, the cells were shifted back to 378C and the trans-ferrin internalization chased at different time points up to15 min. The amount of internalized ligands was measured byFACS analysis (FacsCalibur, Becton&Dickinson). The graphsreport the total amount of internalized transferrin at differenttime points (as indicated), and normalized to the amount of trans-ferrin bound to the cognate receptor at the cell surface at Time 0(i.e. before the temperature shift).
Immunofluorescence, live imaging and confocal microscopy
Cells grown on glass coverslips were fixed in 4% paraformalde-hyde for 10 min and then permeabilized with either pre-chilledmethanol (5 min at 2208C) or 0.1% Triton X-100 (for the phal-loidin and GFP-ATG16L1/phalloidin co-staining). 4% goatserum (Sigma) in 1× PBS was used for blocking (2 h at roomtemperature) and for the incubation with the appropriateprimary and secondary antibodies, when necessary. For theendogenous LC3 and LAMP-1 staining, the cells grown onglass coverslips were fixed and permeabilized with pre-chilledmethanol (5 min at 2208C). Four percent goat serum (Sigma)in 1× PBS was used for blocking (2 h at room temperature)and for the incubation with the appropriate primary and second-ary antibodies. Coverslips were left in the primary antibodyovernight at 48C. Secondary antibodies were Alexa Fluor-conjugated antibodies (Molecular Probes, Invitrogen). A ZeissAxiovert 200 M microscope with a LSM510 confocal attachment(63 × NA 1.4 Plan-Apochromat oil-immersion lens LSM510META, Carl Zeiss) along with the LSM510 Image analyser soft-ware (version 3.2, Carl Zeiss) was used for fluorescent confocalmicroscopy involving immunofluorescent staining with Alexa-Fluor-conjugated secondary antibodies or fluorescently taggedproteins. All confocal images were taken with a 63×oil-immersion lens. Microscopy was performed on cells fixedon coverslips. Coverslips were mounted in Prolong Gold Anti-fade reagent with 4′,6-diamidino-2-phenylindole (MolecularProbes, Invitrogen). ImageJ and Photoshop (Adobe) were usedfor further analysis and processing of confocal images.
For the pH determination of acidic organelles, LysoSensorYellow/Blue DND-160, which produces blue fluorescence in aneutral environment but shifts to yellow fluorescence in moreacidic compartments (pKa ≈4.2), was used according to themanufacturer’s instruction (Molecular Probes, Invitrogen).Briefly, cells were seeded on a MatTek Petri dish (MatTek,Ashland MA USA) at a density of �1.5 × 10⁵ cells per dish.The cells were treated or not for 24 h with MAB391, loadedwith the LysoSensor tracer for 1 h at 378C, washed twice withmedium and imaged immediately at 378C. At least 10 picturesof live cells were taken for each experimental condition. Liveimaging was performed on an Axiovert 200 M microscope
with a LSM 710 confocal attachment using a 63× 1.4 NA PlanApochromat oil-immersion lens (Carl Zeiss). In particular, thecells were excited at 365 nm and images were taken at 450 and510 nm of emission, respectively. ImageJ and Photoshop(Adobe) were used for the analysis and processing of confocalimages.
In vivo experimentsMaintenance of zebrafish stocks and collection of embryos
All zebrafish husbandry and experiments were performed in ac-cordance with UK legislation under a license granted by theHome Office and with local ethical approval. Zebrafish werereared under standard conditions on a 14 h light/10 h darkcycle. Embryos were collected from natural spawnings, stagedaccording to the established criteria (55) and reared in embryomedium (5 mM NaCl, 0.17 mM KCl, 0.33 mM CaCl2, 0.33 mM
Mg2SO4, 5 mM HEPES).
Determination of the maximum-tolerated concentrationof compounds in larval zebrafish
Compound exposure experiments were performed on wild-typelarvae (TL strain) from 2 to 3 days post-fertilization (d.p.f.). Con-centration response assays were performed over log intervals,namely from 1 nM to 100 mM for PPP, in order to determine themaximum non-toxic concentration (MTC) for subsequentautophagy assay experiments (n ¼ 30 larvae per concentration).The MTC for ammonium chloride (NH4Cl) was previouslydetermined as 100 mM (39,40). Compound exposure experi-ments were performed in the dark at 28.58C.
Measuring endogenous LC3-II in larval zebrafish
LC3-II assays were performed at the following concentrations:ammonium chloride at 100 mM, PPP at 100 mM for 24 h. Wild-type larvae (n ¼ 30 per treatment group) at 2 d.p.f. wereexposed to PPP or embryo medium (untreated control) for 24 hwith or without the addition of ammonium chloride (39).Larvae were then transferred to chilled tubes, homogenized inlysis buffer and finally processed for western blotting asdescribed above.
Aggregate analysis in the transgenic HD zebrafish
Aggregate counting was performed using the heterozygouslarvae from the Tg(rho:EGFP-HTT71Q)cu5 zebrafish (41) (here-after referred to as transgenic HD zebrafish). Embryos from out-crossed transgenic HD zebrafish were raised in 0.2 mM 1--phenyl-2-thiourea (PTU) from 1 to 3 d.p.f. in order to inhibitpigment formation, screened for transgene expression usingEGFP fluorescence then washed twice in the embryo mediumto remove PTU. From 3 to 7 d.p.f., transgenic HD zebrafishlarvae were dark-reared in embryo medium alone or embryomedium contain containing either DMSO, 30 mM clonidine or100 mM PPP. Embryo medium and compounds were replenisheddaily. At 7 d.p.f., larvae were anaesthetized by immersion in0.2 mg/ml 3-amino benzoic acid ethylester (MS222), thenfixed using 4% paraformaldehyde (PFA) in PBS at 48C.Larvae were washed briefly in PBS, allowed to equilibrate in
4542 Human Molecular Genetics, 2013, Vol. 22, No. 22
Dow
nloaded from https://academ
ic.oup.com/hm
g/article/22/22/4528/581741 by guest on 30 Decem
ber 2021
30% sucrose in PBS then embedded in OCT medium (Tissue-Tek) and frozen on dry ice for subsequent cryosectioning. Sec-tions were cut at 10 ?m thickness using a Leica CM3050 cryostatand mounted in 80% glycerol in PBS. The total number ofGFP-positive aggregates were counted over 100 mm of thecentral retina, either side of the optic nerve using mean valueswere calculated (n ¼ 4 fish (8 eyes) for each treatment group).Sections were viewed and representative images acquiredusing a GX Optical LED fluorescent microscope, GXCAM3.3digital camera and GX Capture software.
Mice experiments
All mice experiments complied with Home Office project andpersonal animal licenses. At the start of the study, C57BL/6mice were aged 35–42 days. Mice were separated by genderand divided into two groups, each containing three mice. Onegroup received no treatment (vehicle, DMSO), while the othergroup was intraperitoneally injected with PPP (dissolved inDMSO) at 20 mg/kg/24 h for 3 days (36). Following this, micewere sacrificed. The liver and muscle were dissected, frozen im-mediately after removal and finally homogenized using aWheaton glass homogenizer at 48C in lysis buffer (0.25 M Tris,150 mM NaCl, 1% Triton) in the presence of protease/phosphat-ase inhibitor cocktail (Roche Scientific). Homogenates werethen centrifuge at 14000 rpm for 30 min at 48C, the supernatantswere collected and analysed by western blot as described above.
Statistical analysis
In all the experiments, we determined the significance levels forcomparisons between groups by a two-tailed Student’s t-test,repeated measurements or Factorial ANOVA test using STAT-VIEW v4.53 (Abacus Concepts), where appropriate. Densito-metric analysis on the immunoblots was performed usingImage J software. Experiments were performed at least threetimes in triplicate. In all the main or supplementary figures,error bars represent standard deviations. The P-values for asses-sing densitometric analysis on the immunoblots, luciferaseassays, EGFP-HDQ74 aggregation, GFP-LC3 dots formation,GFP-ATG16L1 vesicles analysis and transferrin uptake assayswere determined using Student’s t-test.
SUPPLEMENTARY MATERIAL
Supplementary Material is available at HMG online.
ACKNOWLEDGEMENTS
We thank Kevin Moreau, Maria Jimenez-Sanchez, Sovan Sarkarand Shouqing Luo for helpful comments and discussions on themanuscript. We also thank Lucy Hepburn, Michelle Stewart andJim Humphreys for excellent technical assistance. We are grate-ful for a Wellcome Trust Principal Fellowship (D.C.R.), anM.R.C. Programme Grant (D.C.R. and S.D.B.), a WellcomeTrust/MRC strategic grant in dementia and funding from theNHIR biomedical research unit in dementia at Addenbrooke’sHospital. Funding to pay the open access publication chargewill be provided by the Wellcome Trust.
Conflict of Interest statement. None declared.
FUNDING
Funding to pay the Open Access publication charges for thisarticle was provided by the Wellcome Trust.
REFERENCES
1. Cohen, E., Bieschke, J., Perciavalle, R.M., Kelly, J.W. and Dillin, A. (2006)Opposing activities protect against age-onset proteotoxicity. Science, 313,1604–1610.
2. Cohen, E., Paulsson, J.F., Blinder, P., Burstyn-Cohen, T., Du, D., Estepa, G.,Adame, A., Pham, H.M., Holzenberger, M., Kelly, J.W. et al. (2009)Reduced IGF-1 signaling delays age-associated proteotoxicity in mice. Cell,139, 1157–1169.
3. Freude, S., Hettich, M.M., Schumann, C., Stohr, O., Kock, L., Kohler, C.,Udelhoven, M., Leeser, U., Muller, M., Kubota, N. et al. (2009) IGF-1resistance reduces A-beta accumulation and protects against prematuredeath in a model of Alzheimer’s disease. FASEB J., 23, 3315–3324.
4. Holzenberger, M., Dupont, J., Ducos, B., Leneuve, P., Geloen, A., Even,P.C., Cervera, P. and Le Bouc, Y. (2003) IGF-1 receptor regulates lifespanand resistance to oxidative stress in mice. Nature, 421, 182–187.
5. Mizushima, N. and Komatsu, M. (2011) Autophagy: renovation of cellsand tissues. Cell, 147, 728–741.
6. Ravikumar, B., Sarkar, S., Davies, J.E., Futter, M., Garcia-Arencibia, M.,Green-Thompson, Z.W., Jimenez-Sanchez, M., Korolchuk, V.I.,Lichtenberg, M., Luo, S. et al. (2010) Regulation of mammalian autophagyin physiology and pathophysiology. Physiol. Rev., 90, 1383–1435.
7. Rubinsztein, D.C., Marino, G. and Kroemer, G. (2011) Autophagy andAging. Cell, 146, 682–695.
8. Tooze, S.A. and Yoshimori, T. (2010) The origin of the autophagosomalmembrane. Nat Cell Biol., 12, 831–835.
9. Ravikumar, B., Moreau, K., Jahreiss, L., Puri, C. and Rubinsztein, D.C.(2010) Plasma membrane contributes to the formation ofpre-autophagosomal structures. Nat. Cell Biol., 37, 771–776.
10. Moreau, K., Ravikumar, B., Renna, M., Puri, C. and Rubinsztein, D.C.(2011) Autophagosome precursor maturation requires homotypic fusion.Cell, 146, 303–317.
11. Klionsky, D.J., Abdalla, F.C., Abeliovich, H., Abraham, R.T.,Acevedo-Arozena, A., Adeli, K., Agholme, L., Agnello, M., Agostinis, P.,Aguirre-Ghiso, J.A. et al. (2012) Guidelines for the use and interpretation ofassays for monitoring autophagy. Autophagy, 8, 445–544.
12. Jia, G., Cheng, G., Gangahar, D.M. and Agrawal, D.K. (2006) Insulin-likegrowth factor-1 and TNF-alpha regulate autophagy through c-junN-terminal kinase and Akt pathways in human atherosclerotic vascularsmooth cells. Immunol. Cell Biol., 84, 448–454.
13. Ravikumar, B., Vacher, C., Berger, Z., Davies, J.E., Luo, S., Oroz, L.G.,Scaravilli, F., Easton, D.F., Duden, R., O’Kane, C.J. and Rubinsztein, D.C.(2004) Inhibition of mTOR induces autophagy and reduces toxicity ofpolyglutamine expansions in fly and mouse models of Huntington disease.Nat. Genet., 36, 585–595.
14. Korolchuk, V.I., Mansilla, A., Menzies, F.M. and Rubinsztein, D.C. (2009)Autophagy inhibition compromises degradation of ubiquitin–proteasomepathway substrates. Mol. Cell, 33, 517–527.
15. Ravikumar, B., Duden, R. and Rubinsztein, D.C. (2002) Aggregate-proneproteins with polyglutamine and polyalanine expansions are degraded byautophagy. Hum. Mol. Genet., 11, 1107–1117.
16. Karey, K.P. and Sirbasku, D.A. (1988) Differential Responsiveness ofHuman Breast Cancer Cell Lines MCF-7 and T47D to Growth Factors and17b-Estradiol. Cancer Res., 48, 4083–4092.
17. Korolchuk, V.I., Saiki, S., Lichtenberg, M., Siddiqi, F.H., Roberts, E.A.,Imarisio, S., Jahreiss, L., Sarkar, S., Futter, M., Menzies, F.M. et al. (2011)Lysosomal positioning coordinates cellular nutrient responses. Nat. CellBiol., 13, 453–460.
18. Williams, T., Forsberg, L.J., Viollet, B. and Brenman, J.E. (2009) Basalautophagy induction without AMP-activated protein kinase under lowglucose conditions. Autophagy, 5, 1155–1165.
19. Zoncu, R., Efeyan, A. and Sabatini, D.M. (2011) mTOR: from growth signalintegration to cancer, diabetes and ageing. Nat. Rev. Mol. Cell. Biol., 12,21–35.
Human Molecular Genetics, 2013, Vol. 22, No. 22 4543
Dow
nloaded from https://academ
ic.oup.com/hm
g/article/22/22/4528/581741 by guest on 30 Decem
ber 2021

20. Jacinto, E., Facchinetti, V., Liu, D., Soto, N., Wei, S., Jung, S.Y., Huang, Q.,Qin, J. and Su, B. (2006) SIN1/MIP1 maintains rictor-mTOR complexintegrity and regulates Akt phosphorylation and substrate specificity. Cell,127, 125–137.
21. Zhao, J., Brault, J.J., Schild, A., Cao, P., Sandri, M., Schiaffino, S., Lecker,S.H. and Goldberg, A.L. (2007) FoxO3 coordinately activates proteindegradation by the autophagic/lysosomal and proteasomal pathways inatrophying muscle cells. Cell Metab., 6, 472–483.
22. Sancak, Y., Bar-Peled, L., Zoncu, R., Markhard, A.L., Nada, S. and Sabatini,D.M. (2009) Ragulator-Rag complex targets mTORC1 to the lysosomalsurface and is necessary for its activation by amino acids. Cell, 141,290–303.
23. Yu, L., McPhee, C.K., Zheng, L., Mardones, G.A., Rong, Y., Peng, J., Mi, N.,Zhao, Y., Liu, Z., Wan, F. et al. (2010) Termination of autophagy andreformation of lysosomes regulated by mTOR. Nature, 465, 942–946.
24. Hanada, T., Noda, N.N., Satomi, Y., Ichimura, Y., Fujioka, Y., Takao, T.,Inagaki, F. and Ohsumi, Y. (2007) The Atg12-Atg5 conjugate has a novelE3-like activity for protein lipidation in autophagy. J. Biol. Chem., 282,37298–37302.
25. Pattingre, S., Tassa, A., Qu, X., Garuti, R., Liang, X.H., Mizushima, N.,Packer, M., Schneider, M.D. and Levine, B. (2005) Bcl-2 antiapoptoticproteins inhibit Beclin 1-dependent autophagy. Cell, 122, 927–939.
26. Tasdemir, E., Maiuri, M.C., Galluzzi, L., Vitale, I., Djavaheri-Mergny, M.,D’Amelio, M., Criollo, A., Morselli, E., Zhu, C., Harper, F. et al. (2008)Regulation of autophagy by cytoplasmic p53. Nat. Cell Biol., 10, 676–687.
27. Doherty, G.J. and McMahon, H.T. (2009) Mechanisms of endocytosis.Annu. Rev. Biochem., 78, 857–902.
28. Tosoni, D., Puri, C., Confalonieri, S., Salcini, A.E., De Camilli, P., Tacchetti,C. and Di Fiore, P.P. (2005) TPP specifically regulates the internalization ofthe transferrin receptor. Cell, 123, 875–888.
29. Larsson, C. (2006) Protein kinase C and the regulation of the actincytoskeleton. Cell Signal., 18, 276–284.
30. Oh, W.J. and Jacinto, E. (2011) mTOR complex 2 signaling and functions.Cell Cycle, 10, 2305–2316.
31. Sarbassov, D.D., Ali, S.M., Kim, D.H., Guertin, D.A., Latek, R.R.,Erdjument-Bromage, H., Tempst, P. and Sabatini, D.M. (2004) Rictor, anovel binding partner of mTOR, defines a rapamycin-insensitive andraptor-independent pathway that regulates the cytoskeleton. Curr. Biol., 14,1296–1302.
32. Mooren, O.L., Galletta, B.J. and Cooper, J.A. (2012) Roles for actinassembly in endocytosis. Annu. Rev. Biochem., 81, 661–686.
33. Aguileira, M.O., Beron, W. and Colombo, M.I. (2012) The actincytoskeleton participates in the early events of autophagosome formationupon starvation-induced autophagy. Autophagy, 8, 1590–1603.
34. Thoreen, C.C., Kang, S.A., Chang, J.W., Liu, Q., Zhang, J., Gao, Y.,Reichling, L.J., Sim, T., Sabatini, D.M. and Gray, N.S. (2009) AnATP-competitive mammalian target of rapamycin inhibitor revealsrapamycin-resistant functions of mTORC1. J. Biol. Chem., 284,8023–8032.
35. Girnita, A., Girnita, L., Del Prete, F., Bartolazzi, A., Larsson, O. andAxelson, M. (2004) Cyclolignans as inhibitors of the insulin-like growthfactor-1 receptor and malignant cell growth. Cancer Res., 64, 236–242.
36. Economou, M.A., Wu, J., Vasilcanu, D., Rosengren, L., All-Ericsson, C.,van der Ploeg, I., Menu, E., Girnita, L., Axelson, M., Larsson, O. et al. (2008)Inhibition of VEGF secretion and experimental choroidalneovascularization by picropodophyllin (PPP), an inhibitor of theinsulin-like growth factor-1 receptor. Invest. Ophthalmol. Vis. Sci.,49, 2620–2626.
37. Lee, H.V., Smith, L., Pettit, G.R., Vinitsky, A. and Smith, J.B. (1996)Ubiquitination of protein kinase C-alpha and degradation by the proteasome.J. Biol. Chem., 271, 20973–20976.
38. Lu, Z., Liu, D., Hornia, A., Devonish, W., Pagano, M. and Foster, D.A.(1998) Activation of Protein kinase C triggers its ubiquitination anddegradation. Mol. Cell. Biol., 18, 839–845.
39. Underwood, B.R., Imarisio, S., Fleming, A., Rose, C., Krishna, G., Heard, P.,Quick, M., Korolchuk, V.I., Renna, M., Sarkar, S. et al. (2010) Antioxidantscan inhibit basal autophagy and enhance neurodegeneration in models ofpolyglutamine disease. Hum. Mol. Genet., 19, 3413–3429.
40. Sarkar, S., Korolchukm, V.I., Renna, M., Imarisio, S., Fleming, A.,Williams, A., Garcia-Arencibia, M., Rose, C., Luo, S., Underwood, B.R.et al. (2011) Complex inhibitory effects of nitric oxide on autophagy. Mol.Cell., 43, 19–32.
41. Williams, A., Sarkar, S., Cuddon, P., Ttofi, E.K., Saiki, S., Siddiqi, F.H.,Jahreiss, L., Fleming, A., Pask, D., Goldsmith, P. et al. (2008) Novel targetsfor Huntington’s disease in an mTOR-independent autophagy pathway. Nat.Chem. Biol., 4, 295–305.
42. Yamamoto, A., Cremona, M.L. and Rothman, J.E. (2006)Autophagy-mediated clearance of huntingtin aggregates triggered by theinsulin-signaling pathway. J. Cell Biol., 172, 719–731.
43. Rubinsztein, D.C., Codogno, P. and Levine, B. (2012) Autophagymodulation as a potential therapeutic target for diverse diseases. Nat. Rev.Drug Discov., 11, 709–730.
44. Bokov, A.F., Garg, N., Ikeno, Y., Thakur, S., Musi, N., DeFronzo, R.A.,Zhang, N., Erickson, R.C., Gelfond, J., Hubbard, G.B. et al. (2011) Doesreduced IGF-1R signaling in Igf1r+/- mice alter aging?. PLoS One, 6,e26891; .
45. Wang, R.C., Wei, Y., An, Z., Zou, Z., Xiao, G., Bhagat, G., White, M.,Reichelt, J. and Levine, B. (2012) Akt-mediated regulation of autophagy andtumorigenesis through Beclin 1 phosphorylation. Science, 338, 956–959.
46. Choi, A.M., Ryter, S.W. and Levine, B. (2013) Autophagy in human healthand disease. N. Engl. J. Med., 368, 651–662.
47. Narain, Y., Wyttenbach, A., Rankin, J., Furlong, R.A. and Rubinsztein, D.C.(1999) A molecular investigation of true dominance in Huntington’s disease.J. Med. Genet., 36, 739–746.
48. Brunet, A., Bonni, A., Zigmond, M.J., Lin, M.Z., Juo, P., Hum, L.S.,Anderson, M.J., Arden, K.C., Blenis, J. and Greenberg, M.E. (1999)Akt promotes cell survival by phosphorylating and inhibiting a Forkheadtranscription factor. Cell, 96, 857–868.
49. Tang, H., Da, L., Mao, Y., Li, Y., Li, D., Xu, Z., Li, F., Wang, Y., Tiollais, P.,Li, T. and Zhao, M. (2010) Hepatitis B virus X protein sensitizes cells tostarvation-induced autophagy via up-regulation of beclin 1 expression.Hepatology, 49, 60–71.
50. Kusama, Y., Sato, K., Kimura, N., Mitamura, J., Ohdaira, H. and Yoshida, K.(2009) Comprehensive analysis of expression pattern and promoterregulation of human autophagy-related genes. Apoptosis, 14, 1165–1175.
51. Hutchinson, M.J., Harrison, P.T., Floto, R.A. and Allen, J.M. (1995) Fcgamma receptor-mediated phagocytosis requires tyrosine kinase activityand is ligand independent. Eur. J. Immunol., 25, 481–487.
52. Sarkar, S., Krishna, G., Imarisio, S., Saiki, S., O’Kane, C.J. and Rubinsztein,D.C. (2008) A rationale mechanism for combination treatment ofHuntington’s disease using lithium and rapamycin. Hum. Mol. Genet.,17, 170–178.
53. Renna, M., Schaffner, C., Winslow, A.R., Menzies, F.M., Peden, A.A.,Floto, R.A. and Rubinsztein, D.C. (2011) Autophagic substrate clearancerequires activity of the syntaxin-5 SNARE complex. J. Cell Sci., 124,469–482.
54. Webb, J.L., Ravikumar, B., Atkins, J., Skepper, J.N. and Rubinsztein, D.C.(2003) Alpha-synuclein is degraded by both autophagy and the proteasome.J. Biol. Chem., 278, 25009–25013.
55. Kimmel, C.B., Ballard, W.W., Kimmel, S.R., Ullmann, B. and Schilling,T.F. (1995) Stages of embryonic development of the zebrafish. Dev. Dyn.,203, 253–310.
4544 Human Molecular Genetics, 2013, Vol. 22, No. 22
Dow
nloaded from https://academ
ic.oup.com/hm
g/article/22/22/4528/581741 by guest on 30 Decem
ber 2021