ifpri discussion paper 00831 - international food policy
TRANSCRIPT
IFPRI Discussion Paper 00831 December 2008
Anatomy of a Crisis The Causes and Consequences of Surging Food Prices
Derek Heady
Shenggen Fan
Development Strategy and Governance Division
INTERNATIONAL FOOD POLICY RESEARCH INSTITUTE
The International Food Policy Research Institute (IFPRI) was established in 1975. IFPRI is one of 15 agricultural research centers that receive principal funding from governments, private foundations, and international and regional organizations, most of which are members of the Consultative Group on International Agricultural Research (CGIAR).
FINANCIAL CONTRIBUTORS AND PARTNERS IFPRI’s research, capacity strengthening, and communications work is made possible by its financial contributors and partners. IFPRI receives its principal funding from governments, private foundations, and international and regional organizations, most of which are members of the Consultative Group on International Agricultural Research (CGIAR). IFPRI gratefully acknowledges the generous unrestricted funding from Australia, Canada, China, Finland, France, Germany, India, Ireland, Italy, Japan, Netherlands, Norway, South Africa, Sweden, Switzerland, United Kingdom, United States, and World Bank.
AUTHORS Derek Heady, International Food Policy Research Institute Postdoctoral Fellow, Development Strategy and Governance Division Correspondence may be sent to [email protected] Shenggen Fan, International Food Policy Research Institute Division Director, Development Strategy and Governance Division
Notices 1 Effective January 2007, the Discussion Paper series within each division and the Director General’s Office of IFPRI were merged into one IFPRI–wide Discussion Paper series. The new series begins with number 00689, reflecting the prior publication of 688 discussion papers within the dispersed series. The earlier series are available on IFPRI’s website at www.ifpri.org/pubs/otherpubs.htm#dp. 2 IFPRI Discussion Papers contain preliminary material and research results. They have not been subject to formal external reviews managed by IFPRI’s Publications Review Committee but have been reviewed by at least one internal and/or external reviewer. They are circulated in order to stimulate discussion and critical comment.
Copyright 2008 International Food Policy Research Institute. All rights reserved. Sections of this material may be reproduced for personal and not-for-profit use without the express written permission of but with acknowledgment to IFPRI. To reproduce the material contained herein for profit or commercial use requires express written permission. To obtain permission, contact the Communications Division at [email protected]
iii
Contents
Acknowledgements v
Abstract vi
1. Introduction 1
2. The Causes of the Crisis 2
3. The Consequences of the crisis 12
4. Knowledge of the Past and Expectations of the Future 20
Appendix A: Additional Data 21
References 23
iv
List of Tables
1. Percentage changes of prices across commodity groups in the 1974 crisis and today (2000 USD) 3
2. Proposed explanations for the 2005-2008 global food crisis, and their strengths and weaknesses 4
3. The estimated impact of fuel-related costs on US farming costs, 2001-2007 9
4. Number of countries affected by food and oil price increases 13
5. Food inflation, total inflation and estimates of trends in the terms of trade: 2007/08 16
A.1. Trends in stocks relative to domestic consumption plus exports among major exporters and consumers 21
A.2. Dependency on US imports and exchange rate appreciation 22
List of Figures
1. Trends in real international prices of key cereals: 1960 to May 2008 2
2. The effect of export restrictions on rice prices 7
3. A summary model of the principal causes of the crisis: a near-perfect storm 11
4. The transmission from international markets to household welfare 12
5. Exchange rate appreciations against the US dollar: Q1-2002 to Q2-2008 14
6. Average annual CPI inflation from January 2005 to July 2008 16
v
ACKNOWLEDGEMENTS
We would like to thank Nurul Islam, Marc Cohen, Dennis Petrie, David Orden, Xinshen Diao, the participants of a seminar given at IFPRI’s Washington DC headquarters, and a wide range of colleagues, for their very insightful comments and suggestions.
vi
ABSTRACT
Although the potential causes and consequences of recent increases in international food prices have attracted widespread attention, many existing appraisals are superficial and/or piecemeal. This paper attempts to provide a more comprehensive review of these issues based on the best and most recent research, and includes fresh theoretical and empirical analysis. We first analyze the causes of the current crisis by considering how well standard explanations hold up against relevant economic theory and important stylized facts. Some explanations, especially rising oil prices, the depreciation of the US dollar, biofuel demand, and some commodity-specific explanations, hold up much better than some others. We then provide an appraisal of the likely macro- and microeconomic impacts of the crisis in developing countries. We observe a large gap in the effects of macro and micro factors, and note that when these factors are used to identify the most vulnerable countries, the results often point in different directions. We conclude with a brief discussion of what ought to be learned from this crisis.
Keywords: food prices, global food crisis, oil prices, biofuels, poverty impacts, macroeconomic impacts JEL Codes: O13; O12; O11; N50
1
1. INTRODUCTION
Since 2003, the international prices of a wide range of commodities have surged upwards in dramatic fashion, often more than doubling within a few years, in some cases even within a few months. A surge in the price of food is of special concern to the world’s poor. Many impoverished people depend upon food production for their livelihood, and virtually all poor people spend large portions of their household income on food. Sharply rising prices offer few means of substitution and adjustment, especially for the urban poor. There are justifiable concerns that this crisis may plunge millions of people into poverty, with those who are already poor suffering still more through increased hunger and malnutrition. There are equally grave concerns regarding the impacts that food and fuel inflation may have on macroeconomic stability and economic growth, given that the first global commodity crisis of 1974 coincided with an end to the “Golden Age” of post-war economic growth. Since the current crisis most likely involves a more persistent rise in commodity prices, there is considerable uncertainty about how well the world economy in general, and developing economies in particular, will be able to effectively respond to these challenges.
The first objective of this paper is to provide a comprehensive assessment of the potential causes of recent food price surges. The second objective is to review the potential consequences on the poor, either directly through increased costs of living, or indirectly through changes in macroeconomic conditions. We address these objectives by reviewing the most credible and recent literature on the issue, augmenting the existing evidence where necessary and feasible (a fuller working paper version of this report includes the bulk of this analysis). We also highlight research questions that remain largely unanswered, and comment briefly upon the central challenges facing policymakers in the midst of the crisis.
2
2. THE CAUSES OF THE CRISIS
A wide range of research has attempted to identify the factors that might have caused the recent surge in food prices (Abbott et al., 2008; Baltzer et al., 2008; Helbling et al., 2008; Schnepf, 2008; Trostle, 2008; von Braun, 2008), but only one paper to date has attempted to add explicit orders of magnitude to different factors (Mitchell, 2008). In this section we review, reassess and extend the evidence on this issue. The current crisis is a global phenomenon, and one that is regarded by many as a distinct event. This means that some of the usual tools favored by economists for uncovering causality (e.g. regression analysis) are quite limited in the crisis context. Instead, the most appropriate research relies on less formal detective work, involving a mix of economic theory, reasoning and history, combined with rudimentary statistical analysis. The most important question we must ask is which of the proposed explanations for the crisis are consistent with the stylized facts. To begin addressing this, we first ask: What are the facts?
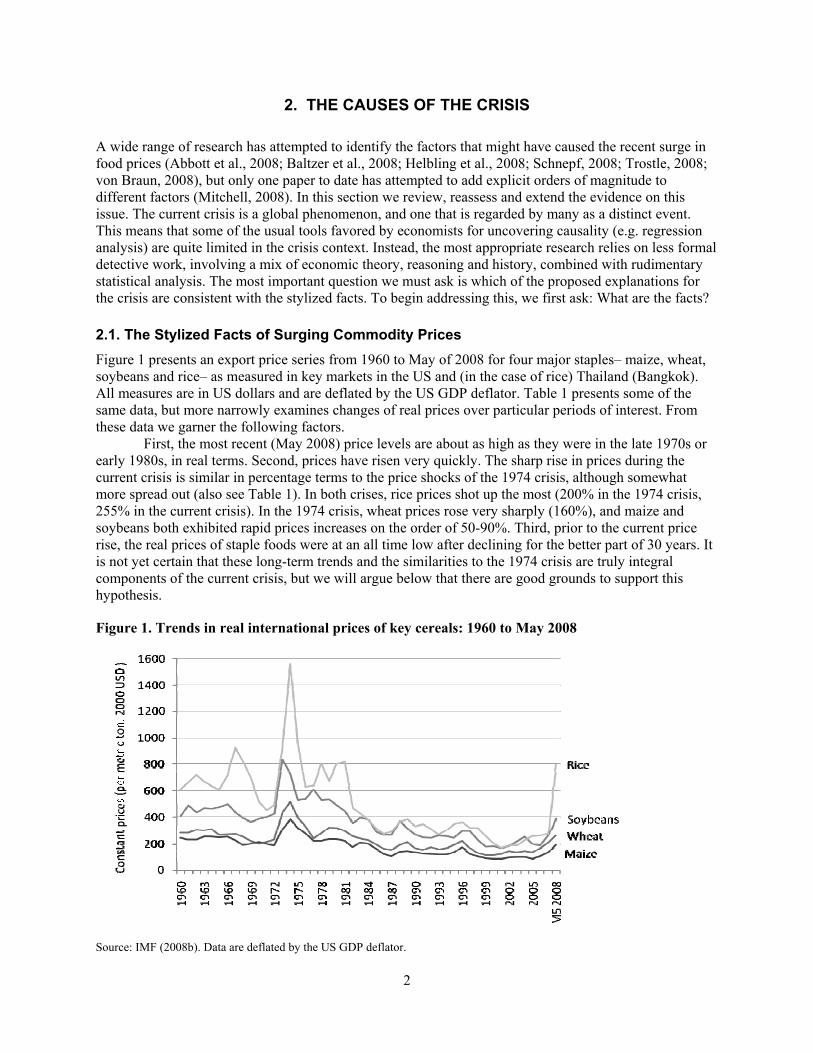
2.1. The Stylized Facts of Surging Commodity Prices Figure 1 presents an export price series from 1960 to May of 2008 for four major staples– maize, wheat, soybeans and rice– as measured in key markets in the US and (in the case of rice) Thailand (Bangkok). All measures are in US dollars and are deflated by the US GDP deflator. Table 1 presents some of the same data, but more narrowly examines changes of real prices over particular periods of interest. From these data we garner the following factors.
First, the most recent (May 2008) price levels are about as high as they were in the late 1970s or early 1980s, in real terms. Second, prices have risen very quickly. The sharp rise in prices during the current crisis is similar in percentage terms to the price shocks of the 1974 crisis, although somewhat more spread out (also see Table 1). In both crises, rice prices shot up the most (200% in the 1974 crisis, 255% in the current crisis). In the 1974 crisis, wheat prices rose very sharply (160%), and maize and soybeans both exhibited rapid prices increases on the order of 50-90%. Third, prior to the current price rise, the real prices of staple foods were at an all time low after declining for the better part of 30 years. It is not yet certain that these long-term trends and the similarities to the 1974 crisis are truly integral components of the current crisis, but we will argue below that there are good grounds to support this hypothesis.
Figure 1. Trends in real international prices of key cereals: 1960 to May 2008
Source: IMF (2008b). Data are deflated by the US GDP deflator.
3
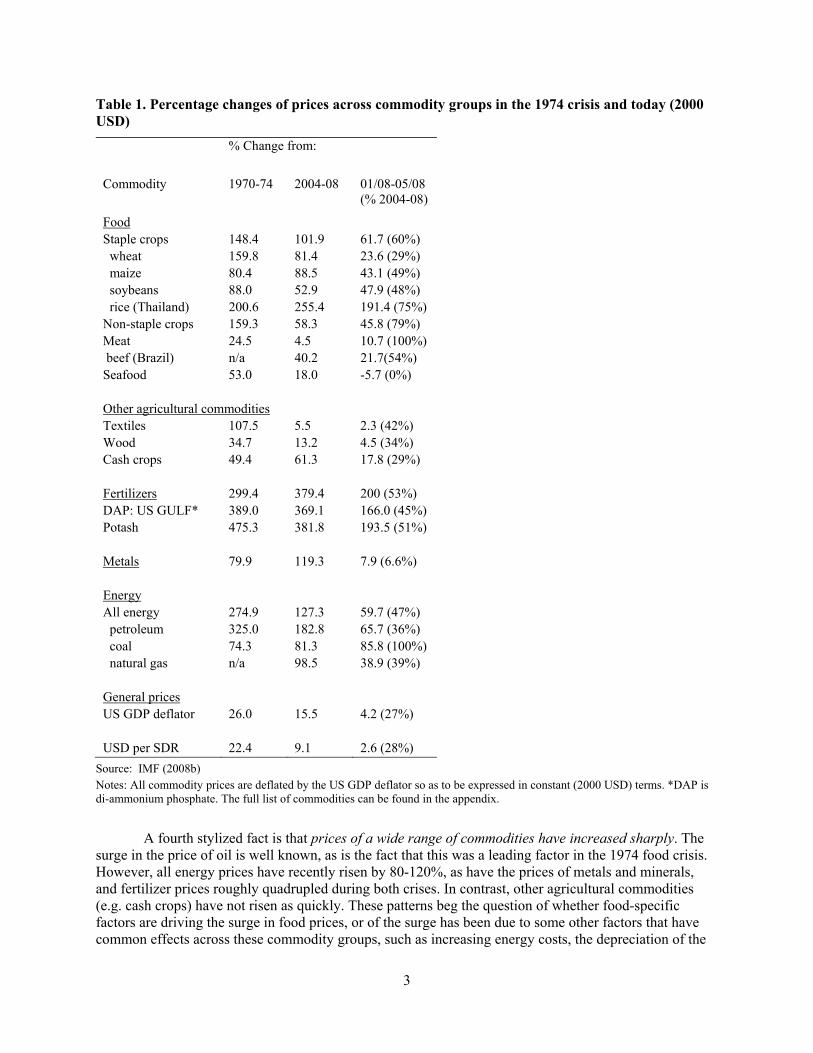
Table 1. Percentage changes of prices across commodity groups in the 1974 crisis and today (2000 USD)
% Change from:
Commodity 1970-74 2004-08 01/08-05/08 (% 2004-08)
Food Staple crops 148.4 101.9 61.7 (60%) wheat 159.8 81.4 23.6 (29%) maize 80.4 88.5 43.1 (49%) soybeans 88.0 52.9 47.9 (48%) rice (Thailand) 200.6 255.4 191.4 (75%) Non-staple crops 159.3 58.3 45.8 (79%) Meat 24.5 4.5 10.7 (100%) beef (Brazil) n/a 40.2 21.7(54%) Seafood 53.0 18.0 -5.7 (0%) Other agricultural commodities Textiles 107.5 5.5 2.3 (42%) Wood 34.7 13.2 4.5 (34%) Cash crops 49.4 61.3 17.8 (29%) Fertilizers 299.4 379.4 200 (53%) DAP: US GULF* 389.0 369.1 166.0 (45%) Potash 475.3 381.8 193.5 (51%) Metals 79.9 119.3 7.9 (6.6%) Energy All energy 274.9 127.3 59.7 (47%) petroleum 325.0 182.8 65.7 (36%) coal 74.3 81.3 85.8 (100%) natural gas n/a 98.5 38.9 (39%) General prices US GDP deflator 26.0 15.5 4.2 (27%) USD per SDR 22.4 9.1 2.6 (28%)
Source: IMF (2008b) Notes: All commodity prices are deflated by the US GDP deflator so as to be expressed in constant (2000 USD) terms. *DAP is di-ammonium phosphate. The full list of commodities can be found in the appendix.
A fourth stylized fact is that prices of a wide range of commodities have increased sharply. The surge in the price of oil is well known, as is the fact that this was a leading factor in the 1974 food crisis. However, all energy prices have recently risen by 80-120%, as have the prices of metals and minerals, and fertilizer prices roughly quadrupled during both crises. In contrast, other agricultural commodities (e.g. cash crops) have not risen as quickly. These patterns beg the question of whether food-specific factors are driving the surge in food prices, or of the surge has been due to some other factors that have common effects across these commodity groups, such as increasing energy costs, the depreciation of the
4
US dollar, growing commodity demand from China and India, and/or investment portfolio adjustments related to low interest rates and the bursting of the US real estate bubble.
A fifth stylized fact is that the timing of price rises has differed somewhat across commodities, and even across staple foods. Most of the price increases in wheat and maize occurred prior to 2008, whereas three-quarters of the increase in the price of rice occurred in 2008. A sixth stylized fact is that the US dollar (USD) has depreciated against a wide range of currencies. Against the other SDR currencies (the UK pound, Euro and Japanese yen), the USD has depreciated some 30% since the start of 2002. Since all of the commodities in Table 1 are expressed in USD, the price increases are much less sharp when measured in Euros, for example, than in USD. The increase in the nominal prices of key staples is around 25% less when measured in Euros, somewhat less than that when measured against the USDA trade-weighted agricultural exchange index, and roughly the same as that measured against the pound and the yen. Some authors also consider USD depreciation to be a causal factor, an issue we discuss further below.
In addition to these stylized facts, we might posit one additional criterion that any plausible explanation of the crisis must satisfy: a potential determinant of the crisis must either precede the crisis, or at least distribute its effects contemporaneous to the rise in prices. Thus, a factor that emerged long before the crisis (e.g. ten years), or only emerged very late in the game (e.g. 2008), is unlikely to be a significant determinant of price rises.
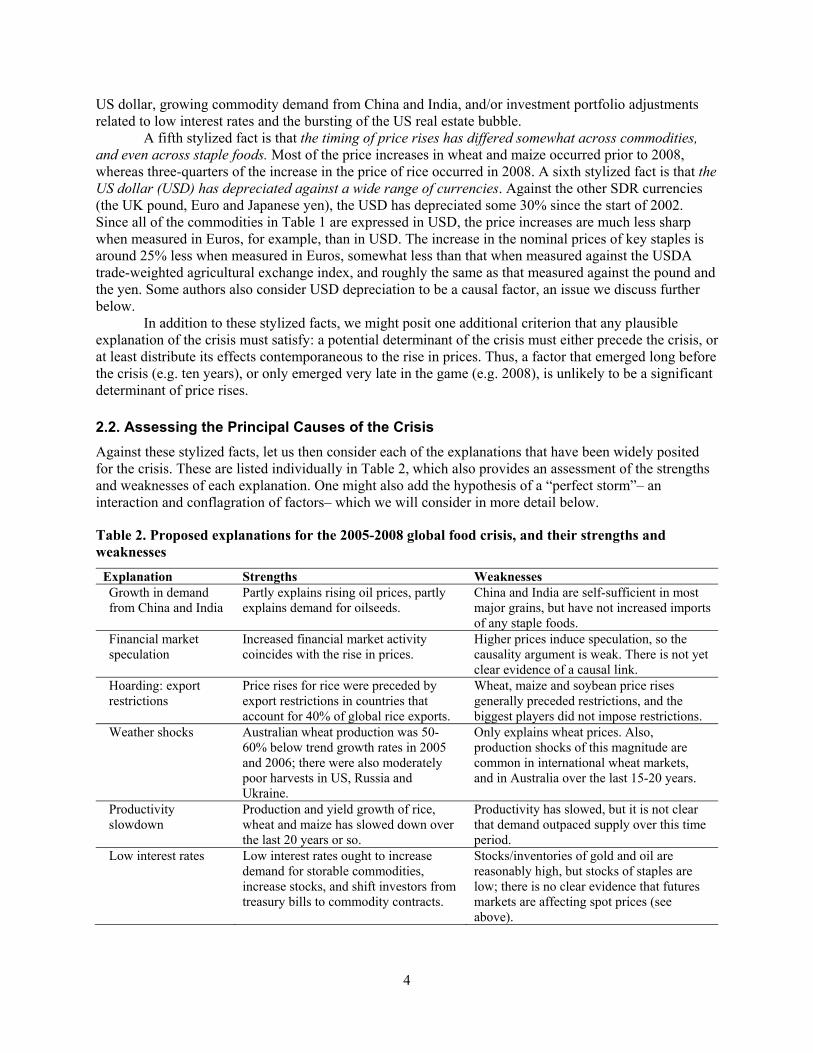
2.2. Assessing the Principal Causes of the Crisis Against these stylized facts, let us then consider each of the explanations that have been widely posited for the crisis. These are listed individually in Table 2, which also provides an assessment of the strengths and weaknesses of each explanation. One might also add the hypothesis of a “perfect storm”– an interaction and conflagration of factors– which we will consider in more detail below.
Table 2. Proposed explanations for the 2005-2008 global food crisis, and their strengths and weaknesses
Explanation Strengths Weaknesses Growth in demand from China and India
Partly explains rising oil prices, partly explains demand for oilseeds.
China and India are self-sufficient in most major grains, but have not increased imports of any staple foods.
Financial market speculation
Increased financial market activity coincides with the rise in prices.
Higher prices induce speculation, so the causality argument is weak. There is not yet clear evidence of a causal link.
Hoarding: export restrictions
Price rises for rice were preceded by export restrictions in countries that account for 40% of global rice exports.
Wheat, maize and soybean price rises generally preceded restrictions, and the biggest players did not impose restrictions.
Weather shocks
Australian wheat production was 50-60% below trend growth rates in 2005 and 2006; there were also moderately poor harvests in US, Russia and Ukraine.
Only explains wheat prices. Also, production shocks of this magnitude are common in international wheat markets, and in Australia over the last 15-20 years.
Productivity slowdown
Production and yield growth of rice, wheat and maize has slowed down over the last 20 years or so.
Productivity has slowed, but it is not clear that demand outpaced supply over this time period.
Low interest rates Low interest rates ought to increase demand for storable commodities, increase stocks, and shift investors from treasury bills to commodity contracts.
Stocks/inventories of gold and oil are reasonably high, but stocks of staples are low; there is no clear evidence that futures markets are affecting spot prices (see above).
5
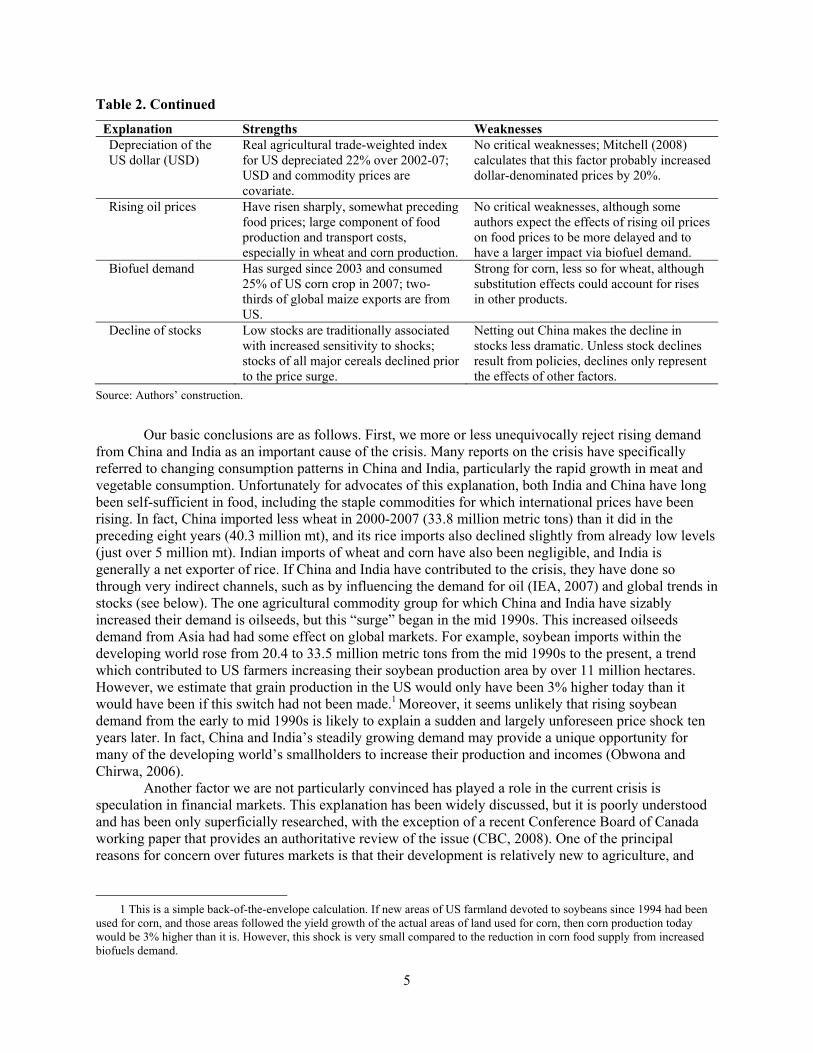
Table 2. Continued
Explanation Strengths Weaknesses Depreciation of the US dollar (USD)
Real agricultural trade-weighted index for US depreciated 22% over 2002-07; USD and commodity prices are covariate.
No critical weaknesses; Mitchell (2008) calculates that this factor probably increased dollar-denominated prices by 20%.
Rising oil prices
Have risen sharply, somewhat preceding food prices; large component of food production and transport costs, especially in wheat and corn production.
No critical weaknesses, although some authors expect the effects of rising oil prices on food prices to be more delayed and to have a larger impact via biofuel demand.
Biofuel demand
Has surged since 2003 and consumed 25% of US corn crop in 2007; two-thirds of global maize exports are from US.
Strong for corn, less so for wheat, although substitution effects could account for rises in other products.
Decline of stocks
Low stocks are traditionally associated with increased sensitivity to shocks; stocks of all major cereals declined prior to the price surge.
Netting out China makes the decline in stocks less dramatic. Unless stock declines result from policies, declines only represent the effects of other factors.
Source: Authors’ construction.
Our basic conclusions are as follows. First, we more or less unequivocally reject rising demand from China and India as an important cause of the crisis. Many reports on the crisis have specifically referred to changing consumption patterns in China and India, particularly the rapid growth in meat and vegetable consumption. Unfortunately for advocates of this explanation, both India and China have long been self-sufficient in food, including the staple commodities for which international prices have been rising. In fact, China imported less wheat in 2000-2007 (33.8 million metric tons) than it did in the preceding eight years (40.3 million mt), and its rice imports also declined slightly from already low levels (just over 5 million mt). Indian imports of wheat and corn have also been negligible, and India is generally a net exporter of rice. If China and India have contributed to the crisis, they have done so through very indirect channels, such as by influencing the demand for oil (IEA, 2007) and global trends in stocks (see below). The one agricultural commodity group for which China and India have sizably increased their demand is oilseeds, but this “surge” began in the mid 1990s. This increased oilseeds demand from Asia had had some effect on global markets. For example, soybean imports within the developing world rose from 20.4 to 33.5 million metric tons from the mid 1990s to the present, a trend which contributed to US farmers increasing their soybean production area by over 11 million hectares. However, we estimate that grain production in the US would only have been 3% higher today than it would have been if this switch had not been made.1 Moreover, it seems unlikely that rising soybean demand from the early to mid 1990s is likely to explain a sudden and largely unforeseen price shock ten years later. In fact, China and India’s steadily growing demand may provide a unique opportunity for many of the developing world’s smallholders to increase their production and incomes (Obwona and Chirwa, 2006).
Another factor we are not particularly convinced has played a role in the current crisis is speculation in financial markets. This explanation has been widely discussed, but it is poorly understood and has been only superficially researched, with the exception of a recent Conference Board of Canada working paper that provides an authoritative review of the issue (CBC, 2008). One of the principal reasons for concern over futures markets is that their development is relatively new to agriculture, and
1 This is a simple back-of-the-envelope calculation. If new areas of US farmland devoted to soybeans since 1994 had been
used for corn, and those areas followed the yield growth of the actual areas of land used for corn, then corn production today would be 3% higher than it is. However, this shock is very small compared to the reduction in corn food supply from increased biofuels demand.
6
there has been increased participation of “non-commercial” participants, or speculators.2 However, the potential causal linkages between futures and spot prices are unclear. Some of the recent co-movements between rising spot and futures prices are related the fact that financial speculation through securitization is most profitable when there is substantial volatility in the underlying markets. Thus, when markets are in turmoil, expectations of future prices may vary considerably (CBC, 2008). This suggests that speculation may be more a symptom of underlying volatility rather than a cause of that volatility. Also, many of the charges made against financial markets relate to the efficiency of their functioning rather than their effect on spot prices per se.3
Finally, the evidence supporting the potential impacts of securitization on spot prices is largely anecdotal and rarely indicative of causality. The contract price volatilities of the corn and wheat futures price indexes have increased from 19.7% and 22.2% in 1980, respectively, to 28.8% and 31.4% in 2006-07, respectively (Schnepf, 2008), and both the price level and volatility for most agricultural commodities continued to rise in 2008. However, a study of the emerging lack of convergence between cash and futures prices did not identify any significant causal factor (Irwin et al., 2007). Other analysts have suggested that agricultural commodity markets are now playing a role traditionally reserved for gold and other precious metals– that of a safe haven for investors– but data from the US Commodity Futures Trading Commission (CFTC) suggest that the balance between long (non-commercial) and short (commercial) positions has been more or less maintained. Another charge is that securitized foods have experienced more price volatility than non-securitized foods (van Ark, 2008). However, several non-securitized foods have indeed experienced rapid price increases,4 and the fact that the securitized commodities may have been selected for futures markets precisely because of some distinguishing characteristics (e.g. rising or less-elastic demand, greater volatility, larger US production) suggests that simple comparisons of securitized and non-securitized futures prices may not be valid in any case. In summary, we conclude that although futures markets may have exacerbated the volatility in agricultural markets, they are unlikely to be a leading cause of the overall price surge, since there is little evidence that these markets significantly influence “real” supply and demand factors.
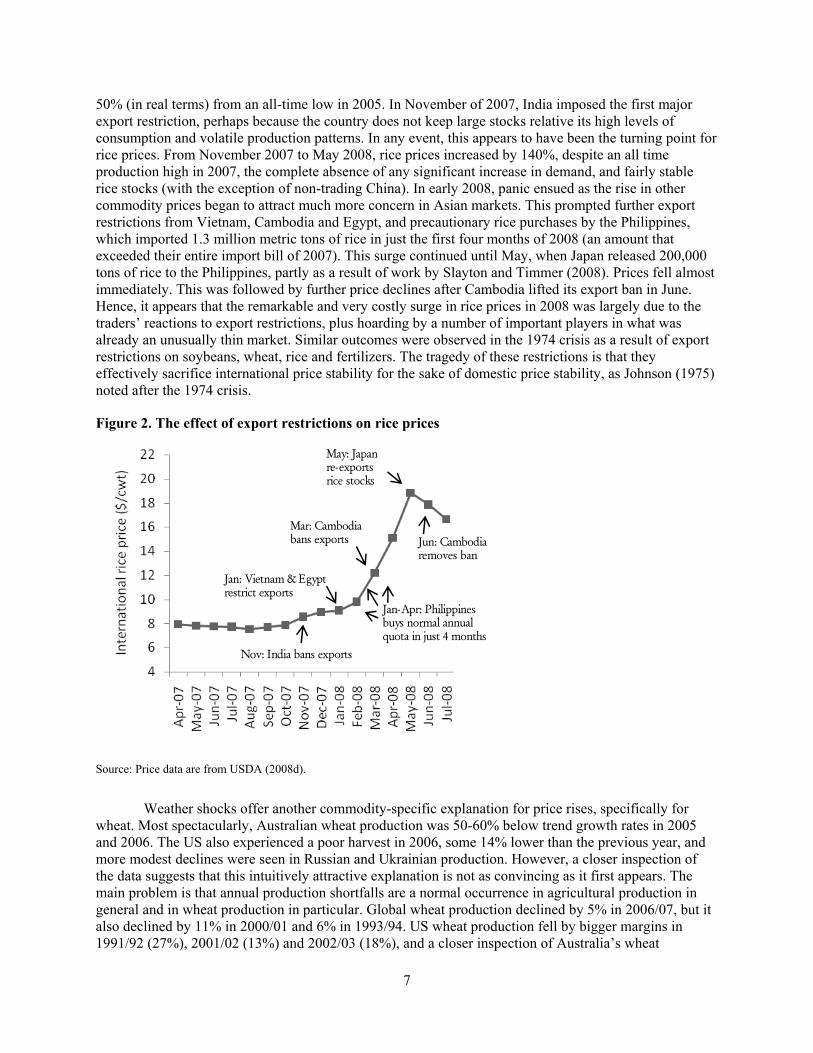
Next we examine a series of commodity-specific factors that probably played some role in increasing the prices of the commodities in question (rice, wheat, maize, soybeans). For rice, in particular, export restrictions are a very compelling explanation, first because a number of important exporting countries that imposed restrictions, and second because rice is much more thinly traded relatively to other staples, with only around 7% of global production being traded over the last five years (USDA, 2008c).5 A closer look at the timing of export restrictions and rice price increases also suggests causality (Figure 2). From August 2005 until November 2007, rice prices increased steadily and significantly, by about
2 The US Commodity Futures Trading Commission (CFTC) has gradually loosened the rules regarding who may trade in agricultural futures markets, to the point that by 2008, index funds (for example) accounted for about 40 per cent of the futures contract trading in wheat. Non-traditional participants can now speculate on food price trends, since the value of a futures contract varies in relationship to the commodity prices in the current spot market, much as bond prices vary in response to changing interest rates. The further out the futures contracts are set for, the more they are likely to reflect expectations of future prices as opposed to the actual prices existing today. This affords speculators an opportunity to bet on futures contracts as a separate asset class quite apart from the spot prices of agricultural commodities in today’s market.
3 Since 2006, the convergence between futures contracts and spot prices has been incomplete, perhaps indicating that the price discovery mechanism of futures markets has been compromised by speculative activity. Second, hedging against risk may become more complex for producers if the futures market is driven less by agricultural fundamentals of supply and demand and more by the speculative activity of uninformed non-commercial investors. Third, since futures contract market participants are required to sustain a maintenance margin of around 75 per cent of the initial margin position, speculation and exaggerated reaction to markets news (“animal spirits”) could induce excessive volatility in the market. This could lead to margin calls, which can significantly impinge on the working capital of smaller agricultural players.
4 For example, some non-securitized commodities have experienced considerable price increases, including rubber, onions, and a wide range of metal and energy commodities (e.g. coal, iron ore, minor metals, and steel) (Gilbert, 2008).
5 Export bans for other commodities probably also made matters worse (e.g. soybeans in Argentina and wheat in Kazakhstan), but the prices of these commodities had already risen significantly before the bans were in place, and the largest producers of other important grains did not engage in export bans. Moreover, whereas only about 7% of rice production is traded, over 12% of corn production is traded, and over 18% of wheat production is traded, so the markets for these commodities are much thicker.
7
50% (in real terms) from an all-time low in 2005. In November of 2007, India imposed the first major export restriction, perhaps because the country does not keep large stocks relative its high levels of consumption and volatile production patterns. In any event, this appears to have been the turning point for rice prices. From November 2007 to May 2008, rice prices increased by 140%, despite an all time production high in 2007, the complete absence of any significant increase in demand, and fairly stable rice stocks (with the exception of non-trading China). In early 2008, panic ensued as the rise in other commodity prices began to attract much more concern in Asian markets. This prompted further export restrictions from Vietnam, Cambodia and Egypt, and precautionary rice purchases by the Philippines, which imported 1.3 million metric tons of rice in just the first four months of 2008 (an amount that exceeded their entire import bill of 2007). This surge continued until May, when Japan released 200,000 tons of rice to the Philippines, partly as a result of work by Slayton and Timmer (2008). Prices fell almost immediately. This was followed by further price declines after Cambodia lifted its export ban in June. Hence, it appears that the remarkable and very costly surge in rice prices in 2008 was largely due to the traders’ reactions to export restrictions, plus hoarding by a number of important players in what was already an unusually thin market. Similar outcomes were observed in the 1974 crisis as a result of export restrictions on soybeans, wheat, rice and fertilizers. The tragedy of these restrictions is that they effectively sacrifice international price stability for the sake of domestic price stability, as Johnson (1975) noted after the 1974 crisis.
Figure 2. The effect of export restrictions on rice prices
May: Japan re-exports rice stocks
Jan-Apr: Philippines buys normal annual quota in just 4 months
Mar: Cambodia bans exports
Jan: Vietnam & Egypt restrict exports
Jun: Cambodia removes ban
Nov: India bans exports
Source: Price data are from USDA (2008d).
Weather shocks offer another commodity-specific explanation for price rises, specifically for wheat. Most spectacularly, Australian wheat production was 50-60% below trend growth rates in 2005 and 2006. The US also experienced a poor harvest in 2006, some 14% lower than the previous year, and more modest declines were seen in Russian and Ukrainian production. However, a closer inspection of the data suggests that this intuitively attractive explanation is not as convincing as it first appears. The main problem is that annual production shortfalls are a normal occurrence in agricultural production in general and in wheat production in particular. Global wheat production declined by 5% in 2006/07, but it also declined by 11% in 2000/01 and 6% in 1993/94. US wheat production fell by bigger margins in 1991/92 (27%), 2001/02 (13%) and 2002/03 (18%), and a closer inspection of Australia’s wheat
8
production since 1990 shows other years when harvests were well below trend: by 51% in 2002, and by 50-100% from 1993 to 1995. Moreover, the output declines seen in several countries in 2007 were offset by large crops in Argentina, Kazakhstan, Russia and the US, whose wheat exports increased by around 13% (or an additional 7.5 million mt) compared to those in 2006. Therefore, while overall global grain production declined by 1.3% in 2006, it then increased 4.7% in 2007. At best, then, these rather minimal shocks must have significantly interacted with other events, such as much lower buffer stocks (see below) or increased market sensitivity. Thus, it appears that the deeper causes ultimately do not lie in the vagaries of the weather.
Increases in biofuel production offer a strong explanation for rapidly increasing prices across a number of different commodities (e.g. maize, some oilseeds, and soybeans), especially when one considers substitution effects. Once oil prices topped $60 a barrel biofuels became substantially more competitive against oil, such that the surge in oil prices appears to have prompted the surge in biofuel demand (Schmidhuber, 2006). Moreover, most analyses to date have concluded that diversion of the US corn crop to biofuels is the largest biofuel demand and the largest demand-induced price pressure (Abbott et al., 2008; Mitchell, 2008; Schnepf, 2008; von Braun, et al., 2008). This is because: (a) the use of maize for ethanol grew especially rapidly from 2004 to 2007, such that the ethanol industry absorbed 70% of the increase in global maize production over that period; (b) the US, which is the largest producer of ethanol from maize, is expected to use about 81 million metric tons for ethanol in the 2007/08 crop year (USDA, 2008a); (c) the US accounts for about one-third of global maize production and two-thirds of global exports (Mitchell, 2008); (d) European biofuel production has largely concentrated on biodiesels, which use about 7% of global vegetable oil supplies (amounting to about one-third of the increase in vegetable oil consumption from 2004 to 2007); and (e) biofuel production in other parts of the world is either relatively small, or uses different crops that have not experienced price surges (e.g. sugarcane in Brazil). As for impacts, increased maize production (and to a less extent oilseed production) has had strong knock-on effects to other foods. In the US, rapid expansion of maize area by 23% in 2007 resulted in a 16% decline in soybean area, which reduced soybean production and contributed to the 75% rise in soybean prices from April 2007 to April 2008 (Mitchell, 2008). In Europe, other oilseeds displaced wheat for the same reason. Another knock-on effect of significant concern is that biofuels have contributed to substantially depleting grain stocks, especially in the US (see Figure 4 in Helbling et al., 2008).6
A range of more formal modeling exercises also suggest that biofuels have had significant impacts on grain prices, although these simulations vary substantially in terms of the time periods considered, the prices used (export, import, wholesale, or retail), the coverage of food products, the currency in which prices are expressed, and whether prices are real or nominal (Schnepf, 2008).7 The results from the more rigorous methodologies suggest that biofuels account for 60-70% of the increase in corn prices and maybe 40% of soybean price increases (Lipsky, 2008; Collins, 2008). Rosegrant et al. (2008) find that the long-term impact of accelerated biofuel production on maize prices is about 47%. The latter model also finds strong substitution effects on wheat and rice prices, with price increases of 26 and 25%, respectively (using Schnepf’s conversion from the real price estimates of the model); this is on a similar order of magnitude to the results from the World Bank’s linkages model (World Bank, 2008).8
Therefore, biofuels not only strongly account for maize price increases, they also help explain price rises
6 Mitchell estimates that if vegetable oil areas used for biodiesel had been used for wheat production, then European wheat
stocks would have been almost as large in 2007 as they were in 2001, rather than lower by almost half (although it is not clear that in the absence of biofuel production farmers would increased harvest areas devoted to wheat).
7 General equilibrium models generate long-term price impacts resulting from specific shocks by factoring in interactions between markets, but their ability to capture short-term price dynamics is highly constrained. Conversely, detailed studies of specific crops may include short-term dynamics, but often exclude impacts on other markets. There are also issues as to whether shocks should be considered independent (Schnepf, 2008).
8 The role of biofuel policies is beyond the scope of this review; see the reviews by Schnepf (2008) and Abbott et al. (2008). The latter offers a critical appraisal of some of these simulations. However, shocks of this magnitude are a compelling explanation for the rapid price rises in several commodities, and reasonably significant substitution effects across others.

9
in other staples (although doubts have been expressed about how realistic these sizeable substation effects are; see Abbott et al., 2008).
The remaining explanations– oil prices, global macroeconomic phenomena, and declining stocks– are even less crop-specific. Relative to its output, agriculture does not use that much energy; however, several lines of reasoning suggest that oil prices probably have a large impact on the costs of agricultural production (see Table 3, and Appendix A in Headey and Fan, 2008). First, the energy used in agricultural production is mostly oil-related, and oil prices have risen faster than the prices of other energy sources (Table 1). Moreover, US food production– which dominates world food production and export markets– is especially oil-intensive. Second, oil prices affect the prices of fertilizers and other chemicals used in crop production. For wheat and corn, fertilizer prices alone account for over a third of total operating costs and 15-20% of total costs. Factoring in the rising costs of fuel, fertilizers and other oil-related farm productions, we estimate that oil prices increased the costs of US production of corn, wheat and soybeans by 30-40% over 2001-2007 relative to a baseline scenario in which oil-related prices only increased by the inflation of the US GDP deflator (Table 3).9 These fuel-based cost increases correspond to about 8% of the observed corn price increases, 11% of soybean price increases, and about 20% of wheat price increases. Finally, oil prices also affect transport costs, such that the margin between domestic and export prices has added as much as 10.2% to the export prices of corn and wheat (Mitchell, 2008). Hence, the combined increase in production and transport costs for the major US food commodities– corn, soybeans and wheat– could account for 20-30% of the increase in US export prices (Mitchell, 2008).10
Table 3. The estimated impact of fuel-related costs on US farming costs, 2001-2007
Corn Soybeans Wheat (1) Yield gap, 2001-2007 0.9 0.9 1.0
(2) Projected costs in 2007 with 2001 cost levels extrapolated to 2007 via the US GDP deflator
325.1 225.6 180.1
(3) Actual total costs in 2007 453.5 295.4 235.7
(4) Difference = (3)-(2) 39.5 30.9 30.9
(5) Difference deflated by yield growth = (4)*(1) 35.5 27.8 27.8
(6) Percentage change in prices received by farmers* 132.6 99.0 101.7
(7) Oil-related cost increase as percentage of total price increase paid to farmers = (5)/(6)
8.0 11.0 20.3
Source: Authors’ calculations from USDA data (2008b). Notes: *The percentage change in prices uses actual prices received by farmers for 2000/2001, and actual prices received by farmers in 2006 multiplied by the percentage change in US export prices, since actual prices received by farmers in 2007 are not yet available. If farmers received less than the full US export price change from 2006 to 2007, then row (7) is underestimated.
A second commodity-wide explanation of surging prices is the depreciation of the US dollar (USD) over the last six years, especially against the Euro. The depreciation of the USD can clearly account for the rise in dollar-denominated food prices in an arithmetical sense, cutting off 20-30% of the nominal dollar increase in the case of conversion from USD to Euros. But as Abbott et al. (2008) discuss, when the dollar weakens, agricultural exports (particularly grain and oilseeds) also increase, ceteris
9 Mitchell (2008) uses different assumptions to find that the production-weighted average increase in the cost of production
due to these energy-intensive inputs for maize, wheat and soybeans was 11.5% between 2002 and 2007. However, he deflates 2008 yields by 2002 yields, which was a poor harvest in the US, and does not distinguish among total costs. See Headey and Fan (2008).
10 Of course, these are not very sophisticated estimates, as they do not utilize supply and demand elasticities, which influence the degree to which increased production costs affect supply responses and market prices.
10
paribus. Using the USDA’s agricultural trade-weighted index of real foreign currency per unit of deflated dollars, Abbott et al. find that from 2002 to 2007, the dollar depreciated 22% and the value of agricultural exports increased 54%. Assuming that the US is a large country in international agricultural markets– which is certainly true in the case of wheat, corn and soybeans– depreciation of the USD should lead to higher prices in the US, but lower prices in the rest of the world. Previous research has indicated that depreciation of the dollar increases dollar-denominated commodity prices with an elasticity of between 0.5 and 1.0 (Gilbert, 1989). Mitchell (2008) therefore calculates that the depreciation of the dollar has increased food prices by around 20%, assuming an elasticity of 0.75. Abbott et al. also show that in the current crisis the divergence between the dollar and many (but not all) other currencies has been quite stark compared to previous increases in nominal dollar-denominated food prices (e.g. 1995/96).
Another theory that has been advanced in some quarters is that low real interest rates, especially in the US, have caused a general price increase in a wide range of commodities (for a discussion of this theory, see Frankel, 1984).11 Low interest rates increase the demand for storable commodities, increase the desires of firms to carry inventories, and encourage speculators to shift out of treasury bills and into commodity contracts. All three of these mechanisms work to increase the market price of commodities, in what is often known as “carry trade.” It is questionable, however, whether this explanation is actually consistent with the evidence. One inconsistency is that agricultural inventories are low rather than high (see below for further discussion). Moreover, the diversion of assets from treasury bills and the like to commodities may have influenced agricultural futures prices, but as we noted above, the jury is still out as to whether this has had a substantial effect on spot prices.
We next turn to stock declines, which could influence price volatility by determining the stability of supply. This might constitute a crop-specific explanation, especially given that stocks have declined for maize, wheat and rice, often below the FAO (1983) benchmark of 17-18% of total consumption that is predicted to substantially stabilize prices and consumption (see Table A.1 in our Appendix).12 Therefore, recent data and strong historical covariance between prices and stocks superficially suggest that stock declines could substantially account for recent price movements. However, there are some significant caveats to this conclusion. Most importantly, declining stocks might simply reflect increased demand or reduced production levels. Biofuel production offers a promising explanation for declines in maize stocks (see above), and bad weather, stagnating production growth and low prices seem to account for the almost pervasive decline in wheat stocks (although unexpectedly, wheat stocks have risen in Australia). For stock declines to be causally related to the current crisis, they must therefore be associated with exogenous policy decisions, or other forces.
We see three such policy decisions that could support a causal relationship. First, it may be that stocks were so high and prices were so low prior to 2000 that there appeared to be a need to reduce stocks. Second, the increasing use of just-in-time inventory systems may have led to lower stocks. These two explanations are plausible but generally difficult to prove. is the explicit policy decision made by China to reduce stocks of major cereals, which were inefficiently high in the 1990s. But it is difficult to fathom why China’s stocks should have any direct effect on international prices unless market actors irrationally took heed of these declines, since China is self-sufficient in major grains. Indeed, netting out China from global stocks trends turns out to be very important (see Appendix Table A.1). World stocks for maize, for example, declined from 26% of usage over 1990-2000 to just 14% of consumption from 2005-2008, but excluding China from the global figures suggests that world stocks remained the same over the two periods, at just 12%. Nevertheless, a large number of major producing and exporting countries have incurred substantial stock declines in recent years.
All in all, we conclude that stock declines are consistent with rising prices but not as causally convincing as it might appear at first glance, partly because they are a symptom of deeper causes, and
11 Frankel is also the main proponent of this theory as an explanation of the current crisis. Several discussions can be found on his website at: http://content.ksg.harvard.edu/blog/jeff_frankels_weblog/.
12 However, one clearly needs to distinguish between optimal stocks for countries that predominantly consume staples versus those that predominantly export staples. The latter type of country generally has little interest in keeping reserves in excess of the “carryover” stocks designed to ensure a steady supply of staples to its export destinations.
11
partly because their effects on prices are enacted through interactions with other factors (e.g. exacerbating shocks). It is also possible that excessively high stocks in the 1990s (and before the 1974 crisis) were actually an underlying cause of the crisis: The use of stocks to satisfy increasing demand may have delayed price rises that would otherwise have provided a stronger signal of rising demand. In terms of policy implications, it is therefore not altogether clear that increasing stocks once more would prevent further food crises.
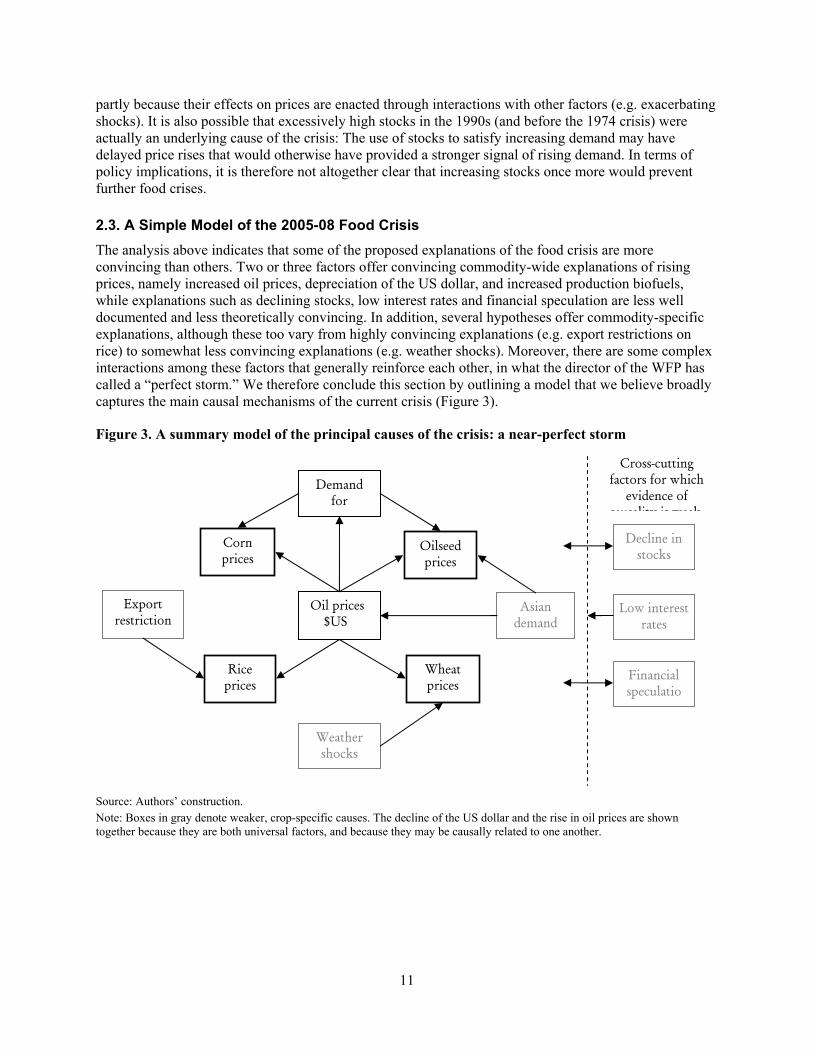
2.3. A Simple Model of the 2005-08 Food Crisis The analysis above indicates that some of the proposed explanations of the food crisis are more convincing than others. Two or three factors offer convincing commodity-wide explanations of rising prices, namely increased oil prices, depreciation of the US dollar, and increased production biofuels, while explanations such as declining stocks, low interest rates and financial speculation are less well documented and less theoretically convincing. In addition, several hypotheses offer commodity-specific explanations, although these too vary from highly convincing explanations (e.g. export restrictions on rice) to somewhat less convincing explanations (e.g. weather shocks). Moreover, there are some complex interactions among these factors that generally reinforce each other, in what the director of the WFP has called a “perfect storm.” We therefore conclude this section by outlining a model that we believe broadly captures the main causal mechanisms of the current crisis (Figure 3).
Figure 3. A summary model of the principal causes of the crisis: a near-perfect storm
Source: Authors’ construction. Note: Boxes in gray denote weaker, crop-specific causes. The decline of the US dollar and the rise in oil prices are shown together because they are both universal factors, and because they may be causally related to one another.
Corn prices
Oilseed prices
Rice prices
Wheat prices
Oil prices� $US �
Export restriction
Asian demand
Demand for
Weather shocks
Cross-cutting factors for which
evidence of causality is weak:
Decline in stocks
Financial speculatio
Low interest rates
12
3. THE CONSEQUENCES OF THE CRISIS
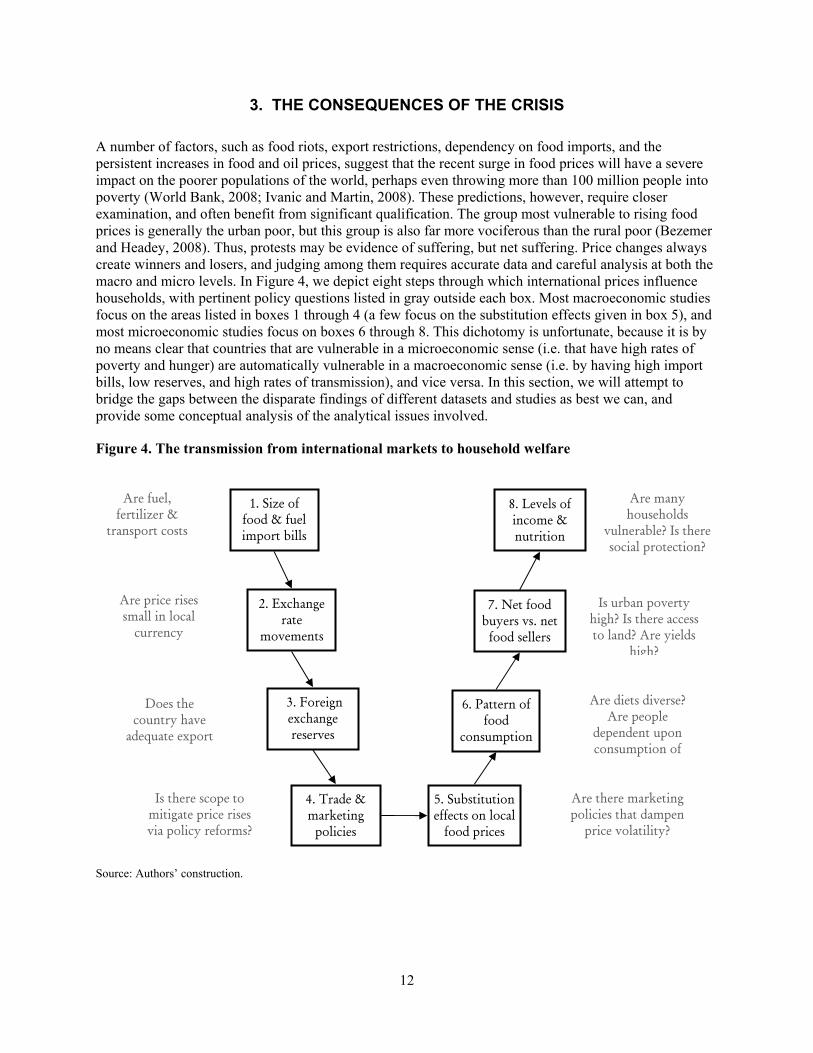
A number of factors, such as food riots, export restrictions, dependency on food imports, and the persistent increases in food and oil prices, suggest that the recent surge in food prices will have a severe impact on the poorer populations of the world, perhaps even throwing more than 100 million people into poverty (World Bank, 2008; Ivanic and Martin, 2008). These predictions, however, require closer examination, and often benefit from significant qualification. The group most vulnerable to rising food prices is generally the urban poor, but this group is also far more vociferous than the rural poor (Bezemer and Headey, 2008). Thus, protests may be evidence of suffering, but net suffering. Price changes always create winners and losers, and judging among them requires accurate data and careful analysis at both the macro and micro levels. In Figure 4, we depict eight steps through which international prices influence households, with pertinent policy questions listed in gray outside each box. Most macroeconomic studies focus on the areas listed in boxes 1 through 4 (a few focus on the substitution effects given in box 5), and most microeconomic studies focus on boxes 6 through 8. This dichotomy is unfortunate, because it is by no means clear that countries that are vulnerable in a microeconomic sense (i.e. that have high rates of poverty and hunger) are automatically vulnerable in a macroeconomic sense (i.e. by having high import bills, low reserves, and high rates of transmission), and vice versa. In this section, we will attempt to bridge the gaps between the disparate findings of different datasets and studies as best we can, and provide some conceptual analysis of the analytical issues involved.
Figure 4. The transmission from international markets to household welfare
Source: Authors’ construction.
2. Exchange rate
movements
1. Size of food & fuel import bills
6. Pattern of food
consumption
4. Trade & marketing
policies
3. Foreign exchange reserves
5. Substitution effects on local
food prices
7. Net food buyers vs. net
food sellers
Are price rises small in local
currency ?
Are fuel, fertilizer &
transport costs l b d ?
Is there scope to mitigate price rises via policy reforms?
Are there marketing policies that dampen
price volatility?
Is urban poverty high? Is there access to land? Are yields
high?
Does the country have
adequate export i ?
Are many households
vulnerable? Is there social protection?
Are diets diverse? Are people
dependent upon consumption of
8. Levels of income & nutrition
13
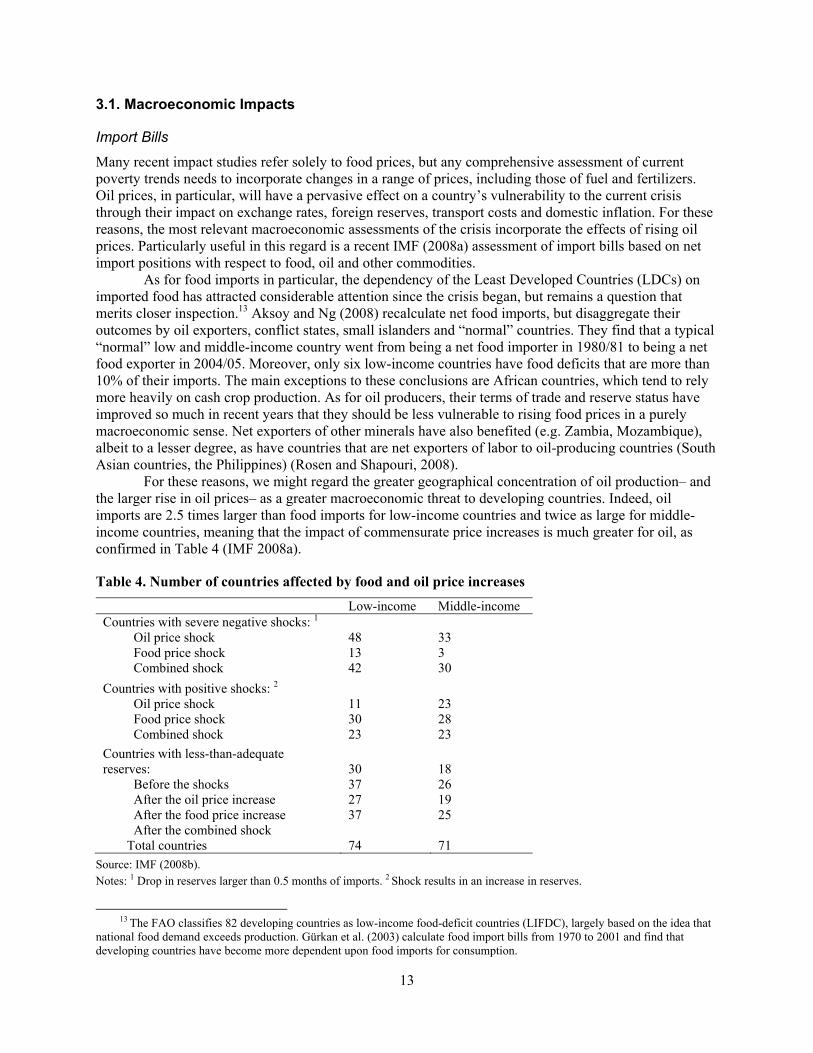
3.1. Macroeconomic Impacts
Import Bills
Many recent impact studies refer solely to food prices, but any comprehensive assessment of current poverty trends needs to incorporate changes in a range of prices, including those of fuel and fertilizers. Oil prices, in particular, will have a pervasive effect on a country’s vulnerability to the current crisis through their impact on exchange rates, foreign reserves, transport costs and domestic inflation. For these reasons, the most relevant macroeconomic assessments of the crisis incorporate the effects of rising oil prices. Particularly useful in this regard is a recent IMF (2008a) assessment of import bills based on net import positions with respect to food, oil and other commodities.
As for food imports in particular, the dependency of the Least Developed Countries (LDCs) on imported food has attracted considerable attention since the crisis began, but remains a question that merits closer inspection.13 Aksoy and Ng (2008) recalculate net food imports, but disaggregate their outcomes by oil exporters, conflict states, small islanders and “normal” countries. They find that a typical “normal” low and middle-income country went from being a net food importer in 1980/81 to being a net food exporter in 2004/05. Moreover, only six low-income countries have food deficits that are more than 10% of their imports. The main exceptions to these conclusions are African countries, which tend to rely more heavily on cash crop production. As for oil producers, their terms of trade and reserve status have improved so much in recent years that they should be less vulnerable to rising food prices in a purely macroeconomic sense. Net exporters of other minerals have also benefited (e.g. Zambia, Mozambique), albeit to a lesser degree, as have countries that are net exporters of labor to oil-producing countries (South Asian countries, the Philippines) (Rosen and Shapouri, 2008).
For these reasons, we might regard the greater geographical concentration of oil production– and the larger rise in oil prices– as a greater macroeconomic threat to developing countries. Indeed, oil imports are 2.5 times larger than food imports for low-income countries and twice as large for middle-income countries, meaning that the impact of commensurate price increases is much greater for oil, as confirmed in Table 4 (IMF 2008a).
Table 4. Number of countries affected by food and oil price increases
Low-income Middle-income Countries with severe negative shocks: 1
Oil price shock Food price shock Combined shock
48 13 42
33 3 30
Countries with positive shocks: 2 Oil price shock Food price shock Combined shock
11 30 23
23 28 23
Countries with less-than-adequate reserves:
Before the shocks After the oil price increase After the food price increase After the combined shock
30 37 27 37
18 26 19 25
Total countries 74 71 Source: IMF (2008b). Notes: 1 Drop in reserves larger than 0.5 months of imports. 2 Shock results in an increase in reserves.
13 The FAO classifies 82 developing countries as low-income food-deficit countries (LIFDC), largely based on the idea that
national food demand exceeds production. Gürkan et al. (2003) calculate food import bills from 1970 to 2001 and find that developing countries have become more dependent upon food imports for consumption.
14
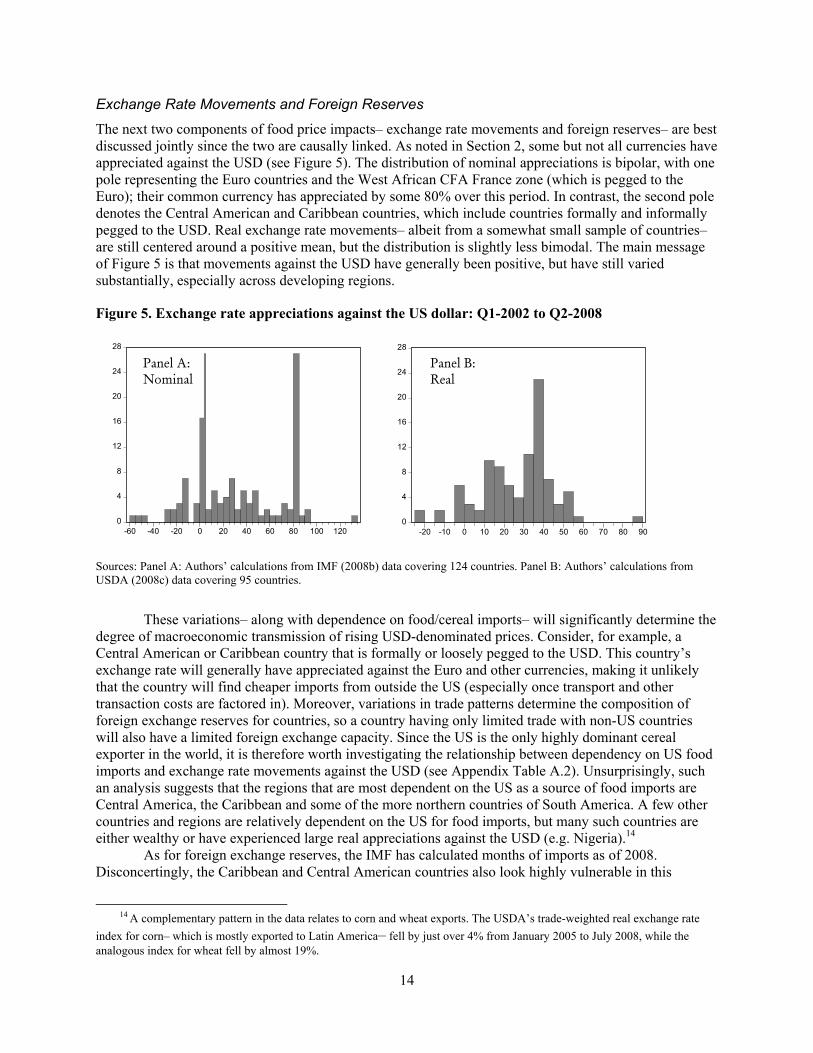
Exchange Rate Movements and Foreign Reserves
The next two components of food price impacts– exchange rate movements and foreign reserves– are best discussed jointly since the two are causally linked. As noted in Section 2, some but not all currencies have appreciated against the USD (see Figure 5). The distribution of nominal appreciations is bipolar, with one pole representing the Euro countries and the West African CFA France zone (which is pegged to the Euro); their common currency has appreciated by some 80% over this period. In contrast, the second pole denotes the Central American and Caribbean countries, which include countries formally and informally pegged to the USD. Real exchange rate movements– albeit from a somewhat small sample of countries– are still centered around a positive mean, but the distribution is slightly less bimodal. The main message of Figure 5 is that movements against the USD have generally been positive, but have still varied substantially, especially across developing regions.
Figure 5. Exchange rate appreciations against the US dollar: Q1-2002 to Q2-2008
0
4
8
12
16
20
24
28
-60 -40 -20 0 20 40 60 80 100 120
0
4
8
12
16
20
24
28
-20 -10 0 10 20 30 40 50 60 70 80 90
Sources: Panel A: Authors’ calculations from IMF (2008b) data covering 124 countries. Panel B: Authors’ calculations from USDA (2008c) data covering 95 countries.
These variations– along with dependence on food/cereal imports– will significantly determine the degree of macroeconomic transmission of rising USD-denominated prices. Consider, for example, a Central American or Caribbean country that is formally or loosely pegged to the USD. This country’s exchange rate will generally have appreciated against the Euro and other currencies, making it unlikely that the country will find cheaper imports from outside the US (especially once transport and other transaction costs are factored in). Moreover, variations in trade patterns determine the composition of foreign exchange reserves for countries, so a country having only limited trade with non-US countries will also have a limited foreign exchange capacity. Since the US is the only highly dominant cereal exporter in the world, it is therefore worth investigating the relationship between dependency on US food imports and exchange rate movements against the USD (see Appendix Table A.2). Unsurprisingly, such an analysis suggests that the regions that are most dependent on the US as a source of food imports are Central America, the Caribbean and some of the more northern countries of South America. A few other countries and regions are relatively dependent on the US for food imports, but many such countries are either wealthy or have experienced large real appreciations against the USD (e.g. Nigeria).14
As for foreign exchange reserves, the IMF has calculated months of imports as of 2008. Disconcertingly, the Caribbean and Central American countries also look highly vulnerable in this
14 A complementary pattern in the data relates to corn and wheat exports. The USDA’s trade-weighted real exchange rate
index for corn– which is mostly exported to Latin America– fell by just over 4% from January 2005 to July 2008, while the analogous index for wheat fell by almost 19%.
Panel B: Real
Panel A: Nominal
15
dimension, although the South American countries seem somewhat better off. In Africa, there is some discrepancy between oil exporters (generally with large reserves) and non-oil exporters (with smaller reserves), so few generalizations can be made; however, many countries have sufficiently low reserves to warrant concern. The same is true of Asia. Of greatest concern is the notion that rising oil prices will eat up foreign exchange reserves (Table 3), leaving only scarce reserves left for food imports.
Transmission in Domestic Markets and the Impact on Inflation
Despite reasonable data on export prices, exchange rates and import dependency, very little up-to-date data are available on food prices in developing countries. A few recent studies have examined price transmission in selected countries or regions, but a big picture overview has proven elusive so far.15 One recent FAO study on the current crisis re-analyzes the extent of price transmission in seven large Asian countries from the fourth quarter of 2003 to the fourth quarter of 2007 (Dawe, 2008), a period which admittedly does not capture the full international price increase, especially in rice. Overall transmission– measured as the ratio of LCU-denominated retail price changes to USD-denominated export prices– varies considerably among the seven countries studied. In India, the Philippines and Vietnam the pass-through is just 6-11%, while it is 41-65% in the remaining countries. Interestingly, movements in the real exchange rate explain more than half of the price difference between USD-denominated export prices and local currency-denominated (LCU) local currencies, with the main exception of Bangladesh.16 Dawe also found that wheat prices appeared to be partially transmitted in India and Indonesia, but fully transmitted in Bangladesh. Some of the impacts of food price increases on inflation in Asian countries are also estimated by the Asian Development Bank (ADB, 2008), while some recent data on international price changes (US, Thai and South African markets) and domestic price changes for African countries are presented in Appendix C of Headey and Fan (2008). While these data should be interpreted with great care because of the lack of a suitable price deflator, the findings generally suggest that commodity-specific price transmission in Africa has been limited thus far, except in Ethiopia (see Ulimwengu et al., 2008).17
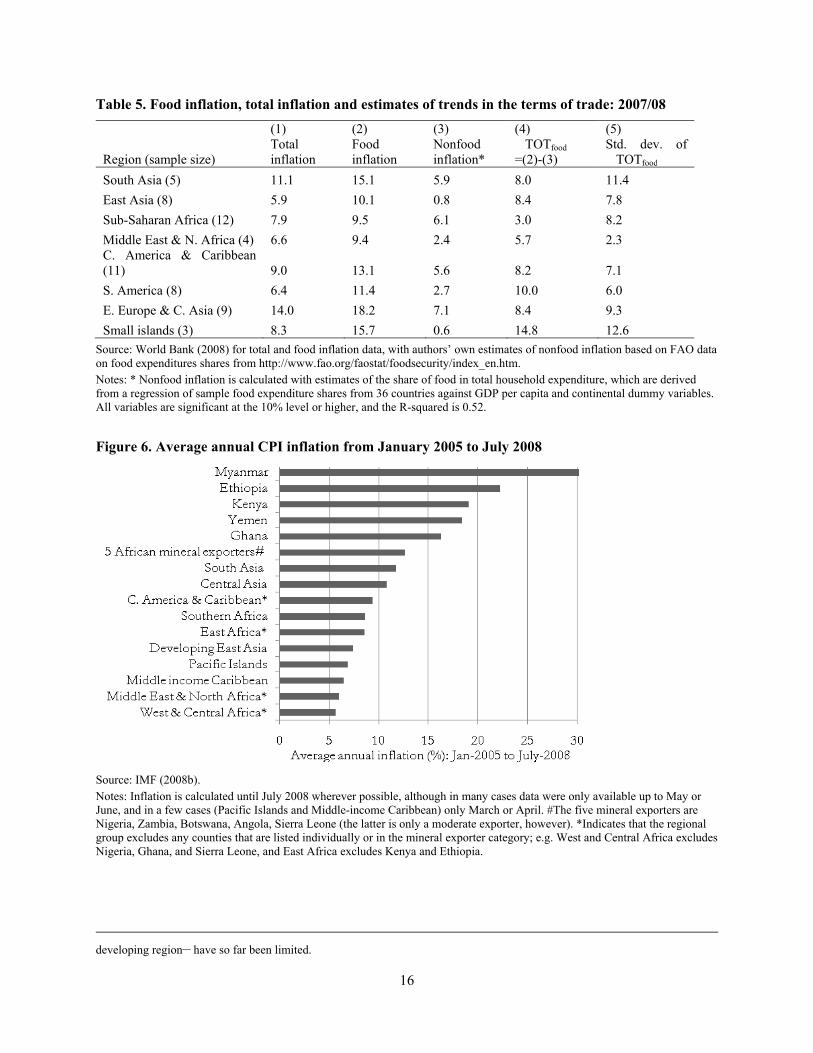
In terms of a broader picture of price changes, more comprehensive but less detailed data can be obtained by examining recent inflation trend datasets, such as those on food inflation and total inflation available from the World Bank (2008) for 2007 and early 2008. In Table 4, we present these data by region and use it to calculate nonfood inflation based on estimates of household food expenditure shares (Column 3). We then calculate the difference between food and nonfood inflation as a measure of relative price change (Column 4). Among these patterns, we find that food inflation is high in all regions, varying from around 9.5 to 18%. However, this in itself is not indicative of real or relative prices changes. Column 4 shows the differential, which can be thought of as the change in the terms of trade (TOT) for food. On average, food inflation has outpaced nonfood inflation at a faster rate outside of Africa than it has within Africa.18
15 In terms of commodity-specific price transmission, historical evidence certainly suggests that these will probably vary
considerably over commodities, regions and times, but are generally lower than one might expect a priori (see Conforti, 2004; Baffes and Gardner, 2003; Sharma, 1996, 2002). However, the previous studies offer little specific guidance as to the overall transmission of international prices to particular countries, due to the effects of context-specific circumstances (e.g. exchange rate movements and rising oil prices).
16 In an update for 2008, Dawe also found that Bangladeshi wholesale prices rose by 29% from December 2007 to March 2008, Philippino prices increased by 25% from February to early April 2008, Indian prices rose 18% from October 2007 to March 2008, and Thai prices increased by 17% from January to February 2008. As of the middle of March, wholesale prices in both China and Indonesia had remained relatively stable.
17 Ethiopia’s example is instructive, however, because it illustrates that the term “transmission” can be somewhat misleading insofar as domestic factors can not only depress transmission (as with rice in Asia), but also accelerate domestic price changes. Quite rapid price accelerations in Ethiopia and Kenya were largely a consequence of domestic factors (drought and domestic policies in Ethiopia, drought and conflict in Kenya).
18 We have confirmed the statistical significance of the difference between Africa TOT trends and those of other regions, using t-tests for differences in means. However, it is important to note that there is substantial variation within this African sample, which is also relatively small (12 countries). So we might cautiously say that the effects within Africa– easily the poorest
16
Table 5. Food inflation, total inflation and estimates of trends in the terms of trade: 2007/08
Region (sample size)
(1) Total inflation
(2) Food inflation
(3) Nonfood inflation*
(4) �TOTfood =(2)-(3)
(5) Std. dev. of �TOTfood
South Asia (5) 11.1 15.1 5.9 8.0 11.4 East Asia (8) 5.9 10.1 0.8 8.4 7.8 Sub-Saharan Africa (12) 7.9 9.5 6.1 3.0 8.2 Middle East & N. Africa (4) 6.6 9.4 2.4 5.7 2.3 C. America & Caribbean (11) 9.0 13.1 5.6 8.2 7.1 S. America (8) 6.4 11.4 2.7 10.0 6.0 E. Europe & C. Asia (9) 14.0 18.2 7.1 8.4 9.3 Small islands (3) 8.3 15.7 0.6 14.8 12.6
Source: World Bank (2008) for total and food inflation data, with authors’ own estimates of nonfood inflation based on FAO data on food expenditures shares from http://www.fao.org/faostat/foodsecurity/index_en.htm. Notes: * Nonfood inflation is calculated with estimates of the share of food in total household expenditure, which are derived from a regression of sample food expenditure shares from 36 countries against GDP per capita and continental dummy variables. All variables are significant at the 10% level or higher, and the R-squared is 0.52.
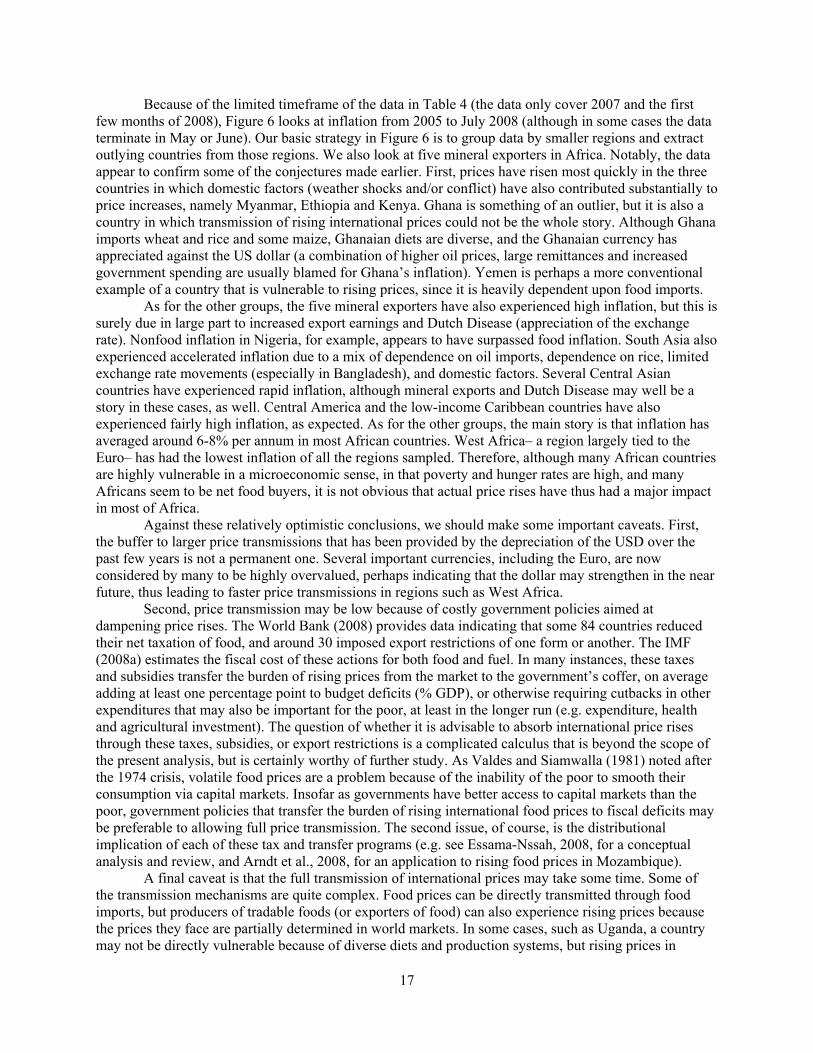
Figure 6. Average annual CPI inflation from January 2005 to July 2008
Source: IMF (2008b). Notes: Inflation is calculated until July 2008 wherever possible, although in many cases data were only available up to May or June, and in a few cases (Pacific Islands and Middle-income Caribbean) only March or April. #The five mineral exporters are Nigeria, Zambia, Botswana, Angola, Sierra Leone (the latter is only a moderate exporter, however). *Indicates that the regional group excludes any counties that are listed individually or in the mineral exporter category; e.g. West and Central Africa excludes Nigeria, Ghana, and Sierra Leone, and East Africa excludes Kenya and Ethiopia.
developing region– have so far been limited.
17
Because of the limited timeframe of the data in Table 4 (the data only cover 2007 and the first few months of 2008), Figure 6 looks at inflation from 2005 to July 2008 (although in some cases the data terminate in May or June). Our basic strategy in Figure 6 is to group data by smaller regions and extract outlying countries from those regions. We also look at five mineral exporters in Africa. Notably, the data appear to confirm some of the conjectures made earlier. First, prices have risen most quickly in the three countries in which domestic factors (weather shocks and/or conflict) have also contributed substantially to price increases, namely Myanmar, Ethiopia and Kenya. Ghana is something of an outlier, but it is also a country in which transmission of rising international prices could not be the whole story. Although Ghana imports wheat and rice and some maize, Ghanaian diets are diverse, and the Ghanaian currency has appreciated against the US dollar (a combination of higher oil prices, large remittances and increased government spending are usually blamed for Ghana’s inflation). Yemen is perhaps a more conventional example of a country that is vulnerable to rising prices, since it is heavily dependent upon food imports.
As for the other groups, the five mineral exporters have also experienced high inflation, but this is surely due in large part to increased export earnings and Dutch Disease (appreciation of the exchange rate). Nonfood inflation in Nigeria, for example, appears to have surpassed food inflation. South Asia also experienced accelerated inflation due to a mix of dependence on oil imports, dependence on rice, limited exchange rate movements (especially in Bangladesh), and domestic factors. Several Central Asian countries have experienced rapid inflation, although mineral exports and Dutch Disease may well be a story in these cases, as well. Central America and the low-income Caribbean countries have also experienced fairly high inflation, as expected. As for the other groups, the main story is that inflation has averaged around 6-8% per annum in most African countries. West Africa– a region largely tied to the Euro– has had the lowest inflation of all the regions sampled. Therefore, although many African countries are highly vulnerable in a microeconomic sense, in that poverty and hunger rates are high, and many Africans seem to be net food buyers, it is not obvious that actual price rises have thus had a major impact in most of Africa.
Against these relatively optimistic conclusions, we should make some important caveats. First, the buffer to larger price transmissions that has been provided by the depreciation of the USD over the past few years is not a permanent one. Several important currencies, including the Euro, are now considered by many to be highly overvalued, perhaps indicating that the dollar may strengthen in the near future, thus leading to faster price transmissions in regions such as West Africa.
Second, price transmission may be low because of costly government policies aimed at dampening price rises. The World Bank (2008) provides data indicating that some 84 countries reduced their net taxation of food, and around 30 imposed export restrictions of one form or another. The IMF (2008a) estimates the fiscal cost of these actions for both food and fuel. In many instances, these taxes and subsidies transfer the burden of rising prices from the market to the government’s coffer, on average adding at least one percentage point to budget deficits (% GDP), or otherwise requiring cutbacks in other expenditures that may also be important for the poor, at least in the longer run (e.g. expenditure, health and agricultural investment). The question of whether it is advisable to absorb international price rises through these taxes, subsidies, or export restrictions is a complicated calculus that is beyond the scope of the present analysis, but is certainly worthy of further study. As Valdes and Siamwalla (1981) noted after the 1974 crisis, volatile food prices are a problem because of the inability of the poor to smooth their consumption via capital markets. Insofar as governments have better access to capital markets than the poor, government policies that transfer the burden of rising international food prices to fiscal deficits may be preferable to allowing full price transmission. The second issue, of course, is the distributional implication of each of these tax and transfer programs (e.g. see Essama-Nssah, 2008, for a conceptual analysis and review, and Arndt et al., 2008, for an application to rising food prices in Mozambique).
A final caveat is that the full transmission of international prices may take some time. Some of the transmission mechanisms are quite complex. Food prices can be directly transmitted through food imports, but producers of tradable foods (or exporters of food) can also experience rising prices because the prices they face are partially determined in world markets. In some cases, such as Uganda, a country may not be directly vulnerable because of diverse diets and production systems, but rising prices in
18
neighboring countries (e.g. Kenya) can create trade opportunities that put pressure on domestic prices (Benson, 2008). Moreover, some regions within a country– especially rural regions– may be more isolated from international price increases compared to urban areas, due to high transport costs (Ulimwengu et al., 2008; Codjoe et al., 2008). All of these complexities point to the need for research that combines detailed macro- and microeconomic analyses (e.g. Arndt et al., 2008).
3.2. Microeconomic Vulnerability to Rising Food Prices Given that we know so little, at least at a cross-country level, about the extent of food price changes or the costliness of policies aimed at mitigating price increases, it should be no surprise that we know even less about the impacts of rising prices on poverty. The cross-country poverty simulations performed to date, namely Ivanic and Martin’s (2008) nine-country study, Zezza et al.’s (2008) 11-country study, Wodon et al.’s (2008) study of 12 West African countries, and Dessus et al.’s (2008) study of the urban sector of 73 developing countries, show us the likely impacts on poverty in response to given price changes. Because none of these experiments incorporate actual price changes, the simulations tell us who would be vulnerable to rising prices, but not which populations are actually experiencing hardship as a result of rising food prices. Furthermore, these studies assume common price changes across countries, even though (as seen above) changes in food prices are likely to vary substantially across countries. Nevertheless, these studies are methodologically insightful, and empirically useful for identifying vulnerability to price changes across countries and subnational groups (e.g. rural and urban). All four studies can also tell us about the incidence of poverty changes (poverty headcounts) as well the extent of changes (e.g. poverty gaps). Indeed, the Wodon et al. (2008) and Ivanic and Martin (2008) studies have been particularly influential in framing World Bank responses to the crisis (World Bank, 2008) and catalyzing support from other institutions.
These studies also make a useful comparison, because all four use quite recent microeconomic surveys and similar simulation methods. Such a comparison reveals the following similarities: First, all four papers look at real food price changes, but not all examine oil or fertilizer prices, even though rising oil prices in particular could have a larger effect on poverty than food prices.19 Second, each study focuses on short-run impacts by precluding significant behavioral responses by producers and consumers of food, or significant partial or general equilibrium effects on prices in other sectors. All four studies explicitly acknowledge this, and the Martin and Ivanic and Zezza et al. studies also calculate some partial equilibrium effects on household income as robustness tests (their findings except for some redistribution of negative impacts from rural to urban households in the case of Ivanic and Martin’s unskilled wage effects. Nevertheless, there could be other behavioral responses to rising food prices, even in the short run. For example, many poor households have diversified income sources and may have substantial scope to increase farm-based activities as food prices rise.
Finally, the main methodological framework of each study is relatively similar, in that they all follow Deaton’s (1989) approach, which essentially the welfare effect of rising food prices at the urban, rural or country level depends upon the number of people who are poor and vulnerable (just above the poverty line), whether those people are net buyers or net sellers of food, and whether they are marginal or significant net sellers/buyers. This calculation leads to some nuanced expectations of which groups might be expected to suffer most from rising prices. On one hand, urban populations have large numbers of net food buyers, but they also tend to be better off than the rural population. Moreover, rural populations might also contain surprisingly large numbers of net food buyers due to the prevalence of nonfarm workers, cash crop production, low-productivity food production or landlessness (Ahmed et al., 2007). A somewhat surprising insight of Ivanic and Martin’s study, is that rural poverty increases by more than urban poverty in two of the three African countries surveyed. In Zambia, rural poverty increases by three
19 Arndt et al.’s (2008) study of Mozambique, for example, finds that rising fuel prices lead to much larger increases in poverty than rising food prices, and Passa Orio and Wodon (2008) estimate the longer-term impact of specific commodity price spikes on the price of other commodities through a social accounting matrix multiplier approach, and find that indirect effects are significantly larger for oil than for food in three of eight countries sampled.
19
times as much as urban poverty, even though initial poverty rates were roughly the same in the rural and urban areas (of course, poverty rates do not capture the number of people who are vulnerable).
The large effects on rural poverty that result from these simulations seem somewhat at odds with both prior intuitions and other evidence on these issues. Aksoy and Isik-Dikmelik (2008), for example, analyze some of the same surveys as Ivanic and Martin, but conclude that: (a) although most poor households are net food buyers, almost 50% are marginal net buyers; and (b) net buyers typically have higher average incomes than net food sellers in eight of the nine countries studied. Another partial explanation of large changes in rural poverty may be that household surveys have some tendency to underestimate the degree to which households are net sellers of food, because the consumption side of household accounts is generally better measured than the production side.20 For similar reasons, household incomes in rural regions may not be measured as well as they are in urban regions. Thus, it is possible that certain survey biases are also influencing the outcomes of these simulations, although we do not have any clear idea of the strength of these biases.
A final issue relates to the diversity of microeconomic vulnerability across countries. Clearly, a range of factors influence the vulnerability of households to rising food prices within and across countries (Figure 4). Zezza et al. (2008) go further than the other simulation studies by disaggregating vulnerability across groups and explaining vulnerability measures OLS regressions. Across 13 developing countries around the developing world, the authors find that the most vulnerable households have the following characteristics: they are urban or rural non-farm; larger, and less educated; more dependent on female labor; less well served by infrastructure; and, within the rural sector, have limited access to land and modern agricultural inputs. All of these findings are fairly intuitive, but it is still useful to see microeconomic evidence confirming these intuitions and offering orders of magnitude and insight into which household attributes matter most.
To summarize, these studies suggest that poverty (including rural poverty) will generally increase in the short run if food prices rise substantially, and Zezza et al.’s (2008) study also offers insights into which types of households are most vulnerable to rising food prices. At the same time, it is important to remember the limitations of these simulations. Ultimately, we still need to learn much more about actual price changes, the additional impacts of increased fuel and fertilizer prices, the short term behavioral responses to rising food prices, and about how government policies can influence these outcomes.
20 We thank Xinshen Diao for this astute comment. The specific argument is that the consumption side of micro surveys is
more regularly updated, whereas production, being largely seasonal, is only measured at distant intervals. It is sometimes argued that household income is also underestimated in these surveys.
20
4. KNOWLEDGE OF THE PAST AND EXPECTATIONS OF THE FUTURE
The recent surge in food prices has been widely termed a crisis, and not without justification. A conflagration of factors has caused food prices to rise much more quickly than is desirable (Section 2), and whatever the precise impacts so far (Section 3), it is clear that many of the world’s poor have already experienced the harsh reality of more costly sustenance. Moreover, although food prices have probably already peaked, food prices are (in real terms) expected to stay high for several years to come (USDA, 2008a), especially if oil prices remain high and demand for biofuels persists. On this basis, it would be premature to conclude that the crisis is over.
However, despite the acute problems that rising food prices have caused, this crisis also presents opportunities for positive change. As was the case in 1974, the current crisis has made the weaknesses of the global food system transparent to a broader audience, and has focused considerable attention back onto the fundamental roles played by food production and food security both in current welfare and in the longer-run process of development. Despite the political constraints of the time, the 1974 crisis produced and bolstered a number of new institutions, such as the WFP, IFAD, CGIAR and the Global Information and Early Warning System (GIIEWS); these have been mostly successful in improving food security and raising agricultural productivity (Headey and Raszap Skorbiansky, 2008). At the same time, however, international policymakers (both then and now) have failed to address the most fundamental deficiencies of the global food system, including low levels of agricultural investment and aid (Bezemer and Headey, 2008), and excessive reliance on the reserve systems of major grain producers as a distant Second Best alternative to freer trade.
The international policymaking community has an obligation and a mandate to redress a thirty-year complacency towards these issues (von Braun et al., 2008), but progress so far has been uneven, especially with respect to subsidies and trade. One part of the challenge at the national level is to ensure that the poor and vulnerable (i.e. the non-marginal net buyers of food) do not slip further into poverty. Macroeconomic policies can buffer the rise in food prices to some extent, while microeconomic social protection programs can more aptly target the most vulnerable populations. A second challenge, however, is to use this crisis to permanently lift poor food producers, who comprise some 60-70% of the world’s poor, out of poverty. Even prior to the current crisis, many development specialists had called for renewed efforts to invoke a Green Revolution in Africa (see Diao et al., 2008), and the recent price surge has clearly brought renewed attention to agricultural development issues. The challenge, however, will be to sustain these efforts once prices have fallen, grain stocks have been rebuilt, and the crisis atmosphere has abated.21 After all, for the 800 million hungry people of the world, food crises are not a one-off event . . . they are a daily reality.
21 Here we are paraphrasing Valdes and Siamwalla (1981), who came to the following conclusion in the years following the
1972-74 crisis: “International prices of cereals have fallen in real terms, grain stocks have been rebuilt, and the crisis atmosphere has abated. World food security has ceased to be a major concern for the press and for the general public. Yet, the underlying causes of food crises such as the one in 1972-74 have not disappeared . . . on the international scene only limited progress has been made to help them in these efforts.”
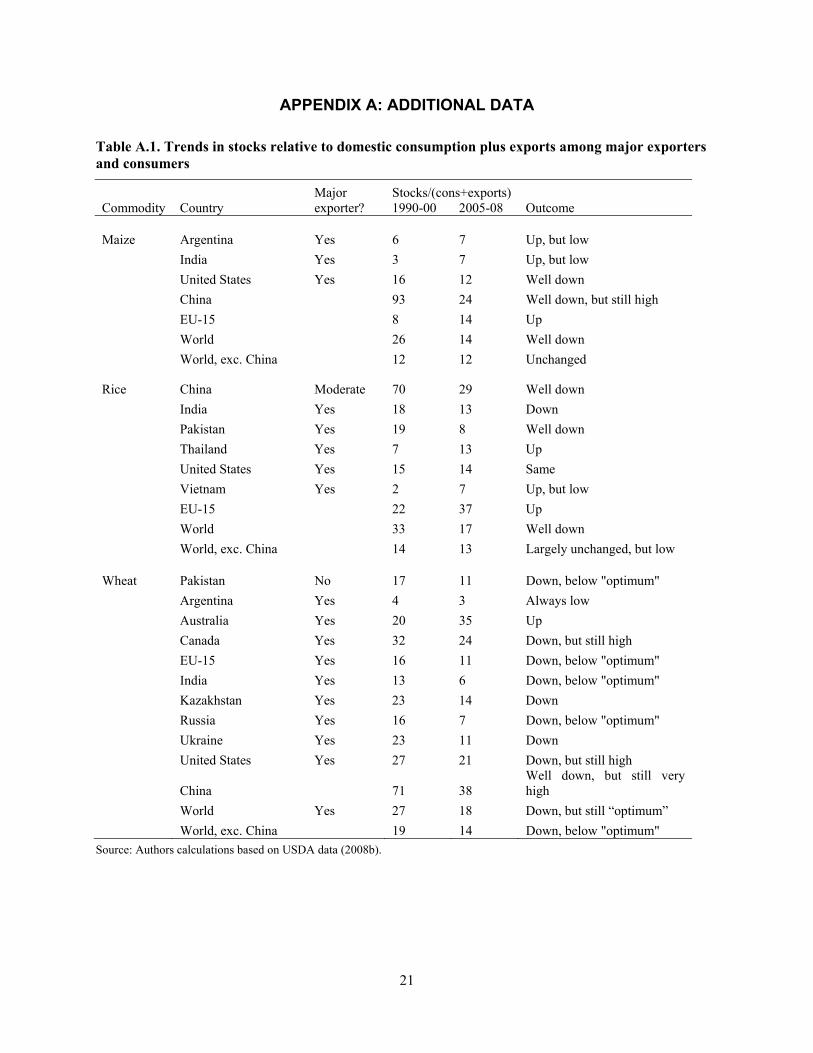
21
APPENDIX A: ADDITIONAL DATA
Table A.1. Trends in stocks relative to domestic consumption plus exports among major exporters and consumers
Major Stocks/(cons+exports) Commodity Country exporter? 1990-00 2005-08 Outcome
Maize Argentina Yes 6 7 Up, but low India Yes 3 7 Up, but low United States Yes 16 12 Well down China 93 24 Well down, but still high EU-15 8 14 Up World 26 14 Well down World, exc. China 12 12 Unchanged
Rice China Moderate 70 29 Well down India Yes 18 13 Down Pakistan Yes 19 8 Well down Thailand Yes 7 13 Up United States Yes 15 14 Same Vietnam Yes 2 7 Up, but low EU-15 22 37 Up World 33 17 Well down World, exc. China 14 13 Largely unchanged, but low
Wheat Pakistan No 17 11 Down, below "optimum" Argentina Yes 4 3 Always low Australia Yes 20 35 Up Canada Yes 32 24 Down, but still high EU-15 Yes 16 11 Down, below "optimum" India Yes 13 6 Down, below "optimum" Kazakhstan Yes 23 14 Down Russia Yes 16 7 Down, below "optimum" Ukraine Yes 23 11 Down United States Yes 27 21 Down, but still high
China 71 38 Well down, but still very high
World Yes 27 18 Down, but still “optimum” World, exc. China 19 14 Down, below "optimum"
Source: Authors calculations based on USDA data (2008b).
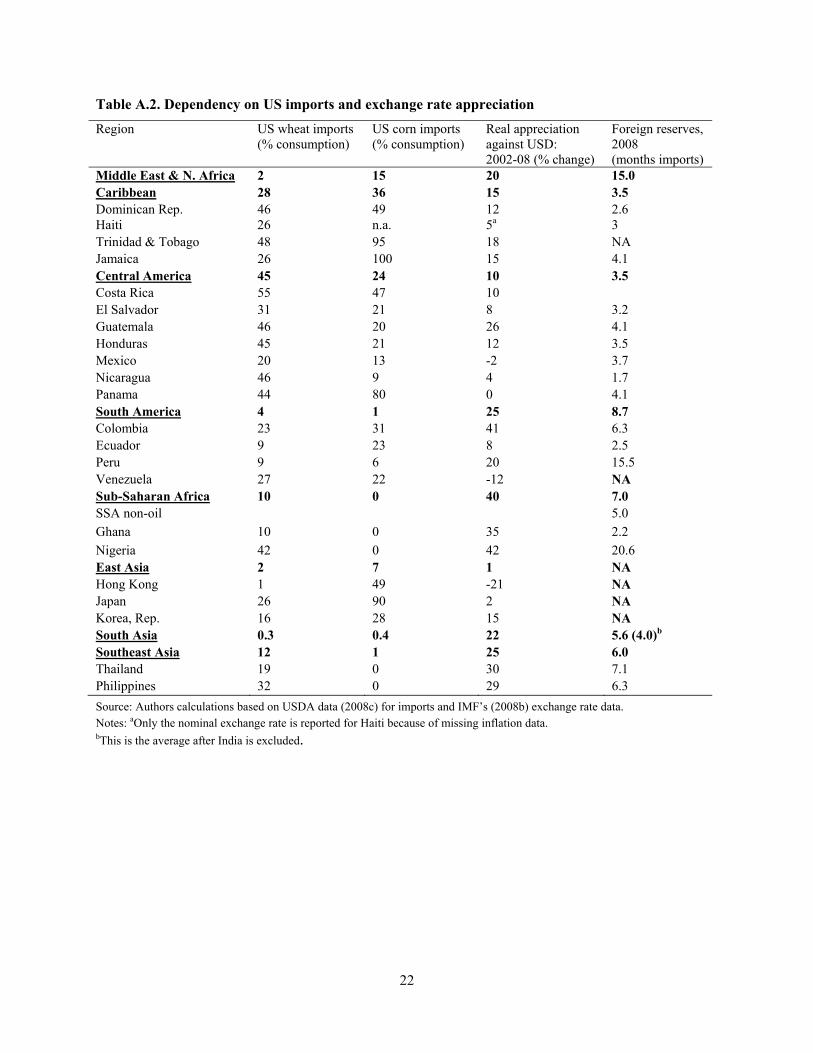
22
Table A.2. Dependency on US imports and exchange rate appreciation
Region US wheat imports (% consumption)
US corn imports (% consumption)
Real appreciation against USD: 2002-08 (% change)
Foreign reserves, 2008 (months imports)
Middle East & N. Africa 2 15 20 15.0 Caribbean 28 36 15 3.5 Dominican Rep. 46 49 12 2.6 Haiti 26 n.a. 5a 3 Trinidad & Tobago 48 95 18 NA Jamaica 26 100 15 4.1 Central America 45 24 10 3.5 Costa Rica 55 47 10 El Salvador 31 21 8 3.2 Guatemala 46 20 26 4.1 Honduras 45 21 12 3.5 Mexico 20 13 -2 3.7 Nicaragua 46 9 4 1.7 Panama 44 80 0 4.1 South America 4 1 25 8.7 Colombia 23 31 41 6.3 Ecuador 9 23 8 2.5 Peru 9 6 20 15.5 Venezuela 27 22 -12 NA Sub-Saharan Africa 10 0 40 7.0 SSA non-oil 5.0 Ghana 10 0 35 2.2 Nigeria 42 0 42 20.6 East Asia 2 7 1 NA Hong Kong 1 49 -21 NA Japan 26 90 2 NA Korea, Rep. 16 28 15 NA South Asia 0.3 0.4 22 5.6 (4.0)b Southeast Asia 12 1 25 6.0 Thailand 19 0 30 7.1 Philippines 32 0 29 6.3 Source: Authors calculations based on USDA data (2008c) for imports and IMF’s (2008b) exchange rate data. Notes: aOnly the nominal exchange rate is reported for Haiti because of missing inflation data. bThis is the average after India is excluded.
23
REFERENCES
Abbott, P. C., Hurt, C., Tyner, W. E., 2008. What's driving food prices? Issue Report. Farm Foundation. http://www.farmfoundation.org/.
ADB, 2008. Food Prices and Inflation in Developing Asia: Is Poverty Reduction Coming to an End? Asian Development Bank, Manila.
Ahmed, A. U., Vargas Hill, R., Smith, L. C., Wiesmann, D., Frankenberger, T., 2007. The World’s Most Deprived: Characteristics and Causes of Extreme Poverty and Hunger. 2020 Discussion Paper 43. International Food Policy Research Institute (IFPRI), Washington DC.
Aksoy, M. A., Isik-Dikmelik, A., 2008. Are Low Food Prices Pro-Poor? Net Food Buyers and Sellers in Low-Income Countries. Policy Research Working Paper 4642. The World Bank, Washington DC.
Aksoy, M. A., Ng, F., 2008. Who are the net food importing countries ? Policy Research Working Paper Series No. 4457. The World Bank, Washington DC.
Arndt, C., Benfica, R., Nucifora, A., Thurlow, J., 2008. Higher fuel and food prices: Impacts and responses for Mozambique. Unpublished manuscript. Development Economics Research Group, University of Copenhagen.
Baffes, J., Gardner, B., 2003. The transmission of world commodity prices to domestic markets under policy reforms in developing countries. Journal of Economic Policy Reform. 6, 159 -180.
Baltzer, K., Hansen, H., Lind, K. M., 2008. A note on the causes and consequences of the rapidly increasing international food prices. Research Report. Institute of Food and Resource Economics, University of Copenhagen. http://www.danidadevforum.um.dk/en/servicemenu/news/theglobalfoodsituation.htm
Benson, T., 2008. An assessment of the likely impact on Ugandan households of rising global food prices: A secondary data analysis. International Food Policy Research Institute Kampala office, Kampala.
Bezemer, D., Headey, D. D., 2008. Agriculture, development and urban bias. World Development. 34, 1342-1364.
CBC, 2008. Is Food Commodity Securitization Worsening the World’s Food Problem? Policy Brief. Conference Board of Canada. http://www.conferenceboard.ca/documents.asp?rnext=2662.
Codjoe, G., Breisinger, C., Diao, X., 2008. Local impacts of a global crisis: Food price transmission and poverty impacts in Ghana. Unpublished manuscript. International Food Policy Research Institute (IFPRI), Washington DC.
Collins, K., 2008. The Role of Biofuels and Other Factors in Increasing Farm and Food Prices: A Review of Recent Development with a Focus on Feed Grain Markets and Market Prospects. Report commissioned by Kraft Food Global, June 19, 2008. http://www.foodbeforefuel.org/files/Role%20of%20Biofuels%206-19-08.pdf.
Conforti, P., 2004. Price Transmission in Selected Agricultural Markets. FAO Commodity and Trade Policy Research Working Paper No. 7. Food and Agriculture Organization (FAO), Rome.
Dawe, D., 2008. Have Recent Increases in International Cereal Prices Been Transmitted to Domestic Economies? The experience in seven large Asian countries. ESA Working Paper No. 08-03. Agricultural Development Economics Division, Food and Agriculture Organization of the United Nations (FAO), Rome.
Deaton, A., 1989. Rice prices and income distribution in Thailand: a non-parametric analysis. Economic Journal. 99, 1-37.
Dessus, S., Herrera, S., de Hoyos, R., 2008. The Impact of Food Inflation on Urban Poverty and Its Monetary Cost: Some Back-of-the-Envelope Calculations. Policy Research Working Paper 4666. The World Bank, Washington DC.
Diao, X., Headey, D., Johnson, M., 2008. Toward a green revolution in Africa: what would it achieve, and what would it require? Agric. Econ. 39 (Suppl), 539–550.
Essama-Nssah, B., 2008. Assessing the redistributive effect of fiscal policy. Policy Research working paper No. WPS 4592 The World Bank, Washington DC.
24
FAO, 1983. Approaches to World Food Security. Economic and Social Development Paper No. 32. Food and Agricultural Organization, Rome.
Frankel, J. A., 1984. Commodity Prices and Money: Lessons from International Finance. American Journal of Agricultural Economics. 66, 560-566.
Gilbert, C., 1989. The Impact of Exchange Rate Changes and Developing Country Debt on Commodity Prices. Economic Journal. 99, 773-784.
Gilbert, C., 2008. How Should Governments React to High Food Prices? Unpublished manuscript.
Gürkan, A. A., Balcombe, K., Prakash, A., 2003. Food Import Bills: Experiences, Factors Underpinning Changes And Policy Implications For Food Security Of Least Developed And Net Food-Importing Developing Countries. Commodity Market Review 2003-2004. Commodities and Trade Division Food and Agriculture Organization of The United Nations.
Headey, D., Fan, S., 2008. Anatomy of a crisis: The causes and consequences of surging food prices. Forthcoming IFPRI Discussion Paper. International Food Policy Research Institute (IFPRI), Washington DC.
Headey, D., Raszap Skorbiansky, S., 2008. International Food Crises, Past and Present: A Comparison of Causes and Consequences Unpublished Manuscript. International Food Policy Research Institute (IFPRI), Washington DC.
Helbling, T., Mercer-Blackman, V., Cheng, K., 2008. Commodities Boom: Riding a Wave. Finance & Development. 45.
IEA, 2007. World Energy Outlook 2007 Edition: China and India Insights. OECD and International Energy Agency (IEA), Paris.
IMF, 2008a. Food and fuel prices: Recent developments, macroeconomic impact, and policy responses. Fiscal Affairs, Policy Development and Review, and Research Departments, International Monetary Fund, Washington DC.
IMF, 2008b. International Financial Statistics (IFS). International Monetary Fund, Washington DC.
Irwin, S. H., Garcia, P., Good, D. L., 2007. The Performance of Chicago Board of Trade Corn, Soybean, and Wheat Futures Contracts After Recent Changes in Speculative Limits. Unpublished manuscript, May 2007. Department of Agricultural and Consumer Economics, University of Illinois. http://www.farmdoc.uiuc.edu/irwin/research/CBOTFuturesPerformance.pdf.
Ivanic, M., Martin, W., 2008. Implications of higher global food prices for poverty in low-income countries. Agric. Econ. 39 (Suppl), 405–416.
Johnson, D. G., 1975. World Agriculture, Commodity Policy, and Price Variability. American Journal of Agricultural Economics. 57, 823-828.
Lipsky, J., 2008. Commodity Prices and Global Inflation. Remarks by the First Deputy Managing Director of the IMF at the Council on Foreign Relations, New York City, May 8, 2008.
Mitchell, D., 2008. A Note on Rising Food Prices. Policy Research Working Paper No. 4682. The World Bank, Washington DC.
Obwona, M., Chirwa, E., 2006. Impact of Asian Drivers on SSA agriculture and food security: Issues and challenges. AERC Paper No. ADWP 09 African Economic Research Consortium. http://www.aercafrica.org/publications/category.asp.
Passa Orio, J. C., Wodon, Q., 2008. Impact of higher food prices on cost of living: assessing multiplier effects using social accounting matrices. mimeo. The World Bank, Washington DC.
Rosegrant, M. W., Zhu, T., Msangi, S., Sulser, T., 2008. The Impact of Biofuel Production on World Cereal Prices. Unpublished paper. International Food Policy Research Institute, Washington, DC.
Rosen, S., Shapouri, S., 2008. Rising Food Prices Intensify Food Insecurity in Developing Countries. Amber Waves. 6. http://www.ers.usda.gov/AmberWaves/February08.
25
Schnepf, 2008. High Agricultural Commodity Prices: What Are the Issues? CRS Report for Congress. Congressional Research Service, Washington DC. http://assets.opencrs.com/rpts/RL34474_20080506.pdf.
Schmidhuber, J., 2006. Impact of an increased biomass use on agricultural markets, prices and food security: A longer-term perspective. International symposium of Notre Europe, Paris, 2006.
Sharma, R., 1996. Review of Cereal Price Situation in Selected Developing Countries in 1995-96 and Policy Measures to Offset the Price Rise. Occasional paper Number 1. Commodities and Trade Division, Food and Agriculture Organization, Rome.
Sharma, R., 2002. The transmission of world price signals: concepts, issues and some evidence from Asian cereal markets. OECD Global Forum on Agriculture, Rome, 2002.
Slayton, T., Timmer, C. P., 2008. Japan, China and Thailand can solve the rice crisis - but US leadership is needed. CGD Notes. Centre for Global Development, Washington DC. http://www.cgdev.org/content/publications/detail/16028.
Trostle, R., 2008. Global Agricultural Supply and Demand: Factors Contributing to the Recent Increase in Food Commodity Prices. ERS Report WRS-0801. Economic Research Service, US Department of Agriculture (USDA). http://www.ers.usda.gov/publications/wrs0801/.
Ulimwengu, J., Workne, S., Aklilu, Z. P., 2008. Impact of Soaring Food Price in Ethiopia: Does Location Matter? Unpublished manuscript. International Food Policy Institute (IFPRI), Washington DC.
USDA, 2008a. Agricultural Projections to 2017. US Department of Agriculture, Washington DC. http://www.ers.usda.gov/Publications/OCE081/OCE20081.pdf.
USDA, 2008b. Cost-of-Production Forecasts, Data Sets. Accessed July. http://www.ers.usda.gov/Data/CostsAndReturns/.
USDA, 2008c. PS&D online database. Accessed July. http://www.fas.usda.gov/psdonline/psdQuery.aspx.
USDA, 2008. USDA Feed Grains Database. Accessed July. http://www.ers.usda.gov/Data/feedgrains/.
Valdes Siamwalla, A., 1981. Food Security for Developing Countries: Introduction. In: A.Valdes, (Ed.), Food Security for Developing Countries. Westview Press, Boulder, Colorado.
van Ark, B., 2008. Response to "Food Crisis is a chance to reform global agriculture" by Martin Wolf. Financial Times, 2008. http://blogs.ft.com/wolfforum/2008/04/food-crisis-is-a-chance-to-reform-global-agriculture/.
von Braun, J., 2008. Rising Food Prices: What Should Be Done? IFPRI Policy Brief. International Food Policy Research Institute, Washington, D.C. www.ifpri.org/pubs/bp/bp001.asp
von Braun, J., Akhter , A., Asenso-Okyere, K., Fan, S., Gulati, A., Hoddinott, J., Pandya-Lorch, R., Rosegrant, M. W., Ruel, M., Torero, M., van Rheenen, T., von Grebmer, K., 2008. High Food Prices: The What, Who, and How of Proposed Policy Actions. IFPRI Policy Brief. International Food Policy Research Institute (IFPRI), Washington DC. www.ifpri.org/PUBS/ib/foodprices.asp.
Wodon, Q., C. , Tsimpo, P. , Backiny-Yetna, G. , Joseph, F. Adoho and Coulombe, H. (2008). Potential impact of higher food prices on poverty : summary estimates for a dozen west and central African countries. Policy Research Working Paper Series 4745, The World Bank, Washington DC
World Bank, 2008. Addressing the Food Crisis: The Need for Rapid and Coordinated Action. Background paper for the Group of Eight Meeting of Finance Ministers, Osaka, June 13-14, 2008. The World Bank, Washington DC. http://www.worldbank.org/html/extdr/foodprices/pdf/G8_food%20price%20paper.pdf.
Zezza, A., Davis, B., Azzarri, C., Covarrubias, K., Tasciotti, L., Anriquez, G., 2008. The Impact of Rising Food Prices on the Poor. Unpublished manuscript. Food and Agriculture Organization, Rome.


RECENT IFPRI DISCUSSION PAPERS
For earlier discussion papers, please go to www.ifpri.org/pubs/pubs.htm#dp. All discussion papers can be downloaded free of charge.
830. Credit constraints, organizational choice, and returns to capital: Evidence from a rural industrial cluster in China. Jianqing Ruan and Xiaobo Zhang, 2008.
829. The future of global sugar markets: Policies, reforms, and impact. Proceedings of a public conference. Jean-Christophe Bureau, Alexandre Gohin, Loïc Guindé, Guy Millet, Antônio Salazar P. Brandão, Stephen Haley, Owen Wagner, David Orden, Ron Sandrey and Nick Vink, 2008.
828. The impact of climate change and adaptation on food production in low-income countries: Evidence from the Nile Basin, Ethiopia. Mahmud Yesuf, Salvatore Di Falco, Claudia Ringler, and Gunnar Kohlin, 2008.
827. The Philippines: Shadow WTO agricultural domestic support notifications. Caesar Cororaton, 2008.
826. What determines adult cognitive skills?: Impacts of preschooling, schooling, and post-schooling experiences in Guatemala. Jere R. Behrman, John Hoddinott, John A. Maluccio, Erica Soler-Hampejsek, Emily L. Behrman, Reynaldo Martorell, Manuel Ramírez-Zea, andAryeh D. Stein, 2008.
825. Accelerating Africa’s food production in response to rising food prices: Impacts and requisite actions. Xinshen Diao, Shenggen Fan, Derek Headey, Michael Johnson, Alejandro Nin Pratt, Bingxin Yu, 2008.
824. The effects of alternative free trade agreements on Peru: Evidence from a global computable general equilibrium model. Antoine Bouët, Simon Mevel, and Marcelle Thomas, 2008.
823. It’s a small world after all. Defining smallholder agriculture in Ghana. Jordan Chamberlin, 2008
822. Japan: Shadow WTO agricultural domestic support notifications. Yoshihisa Godo and Daisuke Takahashi, 2008.
821. United States: Shadow WTO agricultural domestic support notifications. David Blandford and David Orden, 2008.
820. Information flow and acquisition of knowledge in water governance in the Upper East Region of Ghana. Eva Schiffer, Nancy McCarthy, Regina Birner, Douglas Waale, and Felix Asante, 2008.
819. Supply of pigeonpea genetic resources in local markets of Eastern Kenya. , Patrick Audi, and Richard Jones, 2008.
818. Persistent poverty and welfare programs in the United States. John M. Ulimwengu, 2008.
817. Social learning, selection, and HIV infection: Evidence from Malawi. Futoshi Yamauchi and Mika Ueyama, 2008.
816. Evaluating the impact of social networks in rural innovation systems: An overview. Ira Matuschke, 2008.
815. Migration and technical efficiency in cereal production: Evidence from Burkina Faso. Fleur S. Wouterse, 2008.
814. Improving farm-to-market linkages through contract farming: A case study of smallholder dairying in India. Pratap S. Birthal, Awadhesh K. Jha, Marites M. Tiongco, and Clare Narrod, 2008.
813. Policy options and their potential effects on Moroccan small farmers and the poor facing increased world food prices: A general equilibrium model analysis. 2008. Xinshen Diao, Rachid Doukkali, Bingxin Yu, 2008.
812. Norway: Shadow WTO agricultural domestic support notifications. Ivar Gaasland, Robert Garcia, and Erling Vårdal, 2008.
811. Reaching middle-income status in Ghana by 2015: Public expenditures and agricultural growth. Samuel Benin, Tewodaj Mogues, Godsway Cudjoe, and Josee Randriamamonjy, 2008.
810. Integrating survey and ethnographic methods to evaluate conditional cash transfer programs. Michelle Adato, 2008.
809. European Union: Shadow WTO agricultural domestic support notifications. Tim Josling and Alan Swinbank, 2008.
808. Bt Cotton and farmer suicides in India: Reviewing the evidence. Guillaume P. Gruère, Purvi Mehta-Bhatt, and Debdatta Sengupta, 2008.
807. Gender, caste, and public goods provision in Indian village governments. Kiran Gajwani and Xiaobo Zhang, 2008.
806. Measuring Ethiopian farmers’ vulnerability to climate change across regional states. Temesgen Deressa, Rashid M. Hassan, and Claudia Ringler, 2008.
INTERNATIONAL FOOD POLICY RESEARCH INSTITUTE
www.ifpri.org
IFPRI HEADQUARTERS
2033 K Street, NW Washington, DC 20006-1002 USA Tel.: +1-202-862-5600 Fax: +1-202-467-4439 Email: [email protected]
IFPRI ADDIS ABABA
P. O. Box 5689 Addis Ababa, Ethiopia Tel.: +251 11 6463215 Fax: +251 11 6462927 Email: [email protected]
IFPRI NEW DELHI
CG Block, NASC Complex, PUSA New Delhi 110-012 India Tel.: 91 11 2584-6565 Fax: 91 11 2584-8008 / 2584-6572 Email: [email protected]