ifc advisory services in eastern europe and ... - kpi.ua
TRANSCRIPT

IFC Advisory Services in Eastern Europe and Central Asia
in partnership with:The Free State of Saxony (Germany)The Ministry of Employment and the Economy of Finlandthe Netherlands’ Agency for International Business and Cooperation
Benchmarking study
Resource Efficiency in the Ferrous Foundry Industry in Russia

This report was prepared by International Finance Corporation (IFC, World Bank Group) in close cooperation with GEMCO Engineers B.V. and Knight Wendling GmbH.
The content of this report is protected by copyright.
Neither this report, nor any component part, may be reproduced, copied, or distributed in any form without reference to the IFC Resource Efficiency in the Ferrous Foundry Industry in Russia: Benchmarking Study. It may not be sold, re-sold, leased, or distributed by any means on a commercial basis without the prior approval of IFC or the World Bank Group.
The findings, interpretations, and conclusions expressed in this report are entirely those of the project team and should not be attributed in any manner to the World Bank or IFC, to its affiliated organizations, or to members of its Board of Executive Directors or the countries they represent. The material in this report is owned by the World Bank Group and IFC. Dissemination of this report is encouraged and the World Bank Group and IFC will normally grant permission promptly. This report was issued in English and in Russian. Questions regarding this report, including permission to reproduce any part, or information on ordering additional copies, should be directed to the addresses below.
international Finance corporation iFc advisory services in russia
36/1 Bolshaya Molchanovka 121069 MoscowPhone: +(7 495) 411 7555Fax: +(7 495) 411 7572E-mail: [email protected]/rcpp
international Finance corporationiFc advisory services in eastern europe and central asia
2121 Pennsylvania Avenue, NWWashington, DC 20433 USATel: +(1202) 458-0917Fax: +(1202) 974-4312www.ifc.org
ResouRce efficiency in the feRRous foundRy industRy in Russia
Benchmarking Study

2 resource efficiency in the Ferrous Foundry industry in russia: Benchmarking study
acKnoWLedGMents
this report was prepared by an ifc team led by Kristina turilova, Maria sigutina, and Boris nekrasov, in close cooperation with GeMco engineers B.V./Knight Wendling Gmbh, as part of the ifc Resource efficiency in the ferrous foundry industry in Russia: Benchmarking study, under the ifc cleaner Production Program in eastern europe and central asia. the authors wish to express their gratitude to all those directors and chief metallurgists, at machine building plants and foundries throughout Russia, who participated in this project: their cooperation and assistance were essential in the compilation of this report. in order to streamline work on the project, industry leaders were invited to form an advisory Board, the core function of which was to provide advice and support during the drafting, implementation, and review of the study. the authors would like to thank the chairman of this advisory Board, alexey rakhmanov (head of the automobile and agricultural engineering department at the Ministry for trade and industry of the Russian federation), and all board members, including (in alphabetical order):
– yakov akimov (deputy General director, Managing company ooo RKtM);
– Vladimir Belov (head of the department of foundry technology, national university of science and technology (Misis));
– Viktor Beresnev (chief Metallurgist, ooo uraltrac (chelyabinsk tractor Plant));
– ivan dibrov (President of the Russian foundry association);
– sergei efimov (General director, ooo Metaplast (Zlatoust foundry Plant));
– nina efimova (finance director, ooo Metaplast (Zlatoust foundry Plant))
– Victor egolayev (director, ooo Petrozavodskmash);
– nelia egorenkova (chief Metallurgist, cJsc Krontif-center);
– sergei ertman (chief engineer, cJsc Krontif-center);
– nikolay Golubev (chief Metallurgist, oJsc RuMo);
– Vladimir Kiselev (technical director, ooo VKM-steel);
– alexey Kolpakov (chief Metallurgist, GaZ Group);
– Valery Lobashov (chief Metallurgist, oJsc Vladimir electric Motor Plant);
– Viktor Matveyev (director, cJsc Petrostal);
– Valery nasupkin (General director, cJsc Machine Building engineering and technology center Metallurg);
– evgeny sosenushkin (head of Plastic deformation systems department, Moscow state technical university);
– artem sychev (deputy General director, cJsc Krontif-center);
– anatoly Volkomich (General director, cJsc Litaform);
– Boris Zamsky (development director, automotive components division, ooo GaZ Group);
– dmitry Zhdanovsky (General director, ooo uaZ Metallurgy); and
– sergei Zheltikov, (advisor to the Managing director, oJsc ulan-ude aviation Plant).

3resource efficiency in the Ferrous Foundry industry in russia: Benchmarking study
Particular gratitude is due to the management and staff of GeMco engineers B.V./Knight Wendling Gmbh, whose experience and expertise ensured the fulfillment of the project to the highest professional standards. the authors would like to thank:
– Klaus schmitz-Kohnen (director, GeMco engineers B.V./Knight Wendling Gmbh);
– alphons Wijnen (area director, central & eastern europe, GeMco engineers B.V./Knight Wendling Gmbh);
– Georg Winkler (Lead specialist, GeMco engineers B.V./Knight Wendling Gmbh);
– Mike Braun (technical specialist, GeMco engineers B.V./Knight Wendling Gmbh);
– Lothar spang (technical specialist, GeMco engineers B.V./Knight Wendling Gmbh);
– Marina Bogdanova (Representative, GeMco engineers B.V./Knight Wendling Gmbh, Russia); and
– anna savenkova (Personal assistant, GeMco engineers B.V./Knight Wendling Gmbh).
the authors also wish to thank giovanni mazzarelli, giuseppe mazzarelli, and alexey Belyakov of ООО «МеталлЛитМаш» (Jsc MetallLitMash) for their assistance in hosting a conference in support of the project, held at Jsc MetallLitMash facilities in december 2009.
the authors are grateful to the following newspapers, magazines, web sites, and other media outlets for their support: expert; Litejnoye Proizvodstvo (foundry Production); Metallurgiya Mashinostroeniya (Metallurgy of Machine Building); www.i-mash.ru; and www.ruscastings.ru. in particular, they would like to thank inna yaskevich and olga drobitskaya (chief editor and art director at publishers Litejnoye Proizvodstvo); alexander Bogatyrev and andrei Minakov (General director and strategic development director at www.i-mash.ru); and Mikhail Vainmakher (editor in chief at www.ruscastings.ru).
the authors also thank alexander filatov (Managing director of the independent directors association) and Mikhail Kuznetsov (General director of the corporate development center under the independent directors association) for their support in raising awareness of the study.
the Resource efficiency in the ferrous foundry industry in Russia: Benchmarking study was financed by the free state of saxony (Germany); the netherlands’ agency for international Business and cooperation (eVd, a branch of the Ministry of economic affairs of the netherlands); the Ministry of employment and the economy of finland; and ifc.

4 resource efficiency in the Ferrous Foundry industry in russia: Benchmarking study
contents
executive summary ......................................................................................................6
1. introduction ...........................................................................................................15
2. Benchmarking study: methodology .......................................................................19
3. Benchmarking study: key findings .........................................................................26
3.1 analysis of aggregated data .............................................................................26
3.2 comparison of KPis for Russia and europe........................................................31
3.2.1 Process yield .............................................................................................31
3.2.2 Production efficiency (“overall equipment efficiency (oee)) ....................42
3.2.3 total effective equipment performance (teeP, “capacity utilisation”) ........50
3.2.4 energy consumption ................................................................................53
3.2.5 fresh sand consumption ...........................................................................59
3.2.6 fresh water consumption .........................................................................63
3.2.7 Labour productivity ...................................................................................66
3.3 the bottom-line benefits of better resource efficiency .......................................69
3.4 techniques and technologies used in Russian ferrous foundries ........................75
4. Recommendations .................................................................................................78

5resource efficiency in the Ferrous Foundry industry in russia: Benchmarking study
rerg Resource efficiency Reference Guidedg diagnostics GuideBPg Best Practice Guide Bat best available techniques
eBP europe – best practice performanceeaV europe – average performancerBP Russia – best practice performance raV Russia – average performanceBP best practice av average
ruS Russiaeu europe (excluding the commonwealth of independent
states (cis))ger Germany
Oee overall equipment effectivenessteeP total effective equipment productivity
kg kilogramt, to, tonne metric tonnektonnes thousand metric tonnes m3 cubic metermm3 million cubic metreskWh kilowatt hourgWh Gigawatt hour ruB Russian rubleeur euro $ us dollarbln billion
caeF the european foundry associationimd international institute for Management development
(iMd), Lausanne, switzerland Wcy World competitiveness yearbook 2009
aBBReViations

resource efficiency in the Ferrous Foundry industry in russia: Benchmarking study 6
executiVe suMMaRy Russia’s ferrous foundry industry could save up to RuB100 billion ($3.3 billion) annually, and improve individual foundry profitability by up to 15 percent, by matching european union (eu) standards in the more efficient use of natural resources.
the first ever cross-sector benchmarking study undertaken in Russia, this Resource efficiency in the ferrous foundry industry: case study report compares the Russian and european foundry sectors, showcasing efficiency potential and providing practical guidelines to individual foundries as well as to the broader sector.
the results of this research will enable financial institutions (particularly banks and leasing companies) to develop specialist financial products to support improved resource efficiency in Russian enterprises, as well as helping suppliers, service companies, and engineering firms to identify and develop technical solutions to meet the most immediate needs of the sector. Policymakers and senior management involved in the strategic development of the sector will also find the study helpful in identifying those areas in most urgent need of reform, and in developing the strategies necessary to support this.

executive summary
7resource efficiency in the Ferrous Foundry industry in russia: Benchmarking study
given the low costs of labour, energy, and raw materials, russia’s ferrous foundry industry should benefit from a theoretical cost advantage of around 36 percent. however, poor resource efficiency means this advantage is almost entirely lost. thus far, Russian foundries have enjoyed highly competitive cost advantages in comparison with countries in Western europe (for example, Germany):
�energy costs are 54 percent lower; �labour costs are 92 percent lower; and �overheads and service costs are 71 percent lower. these advantages do not translate to competitive prices for finished products, however.�Lower labour costs are negated by low levels of productivity.
any competitive advantage in low labour costs is entirely theoretical, since the personnel resources needed to produce an equivalent amount of good-quality castings are 3.3 times higher than in europe.
�Low energy costs are negated by high volumes of consumption. any competitive advantage in low energy prices is similarly lost, due to high levels of consumption throughout the production process: basic procedures (such as, for example, smelting) use twice as much energy as analogous processes in europe, and overall energy consumption levels are as much as three times higher.
Why is resource efficiency so important for Russia’s ferrous foundry industry?
Figure 1: POOr reSOurceS management iS cOSting ruSSian FOundrieS their cOmPetitiVe adVantage
PriceS cOStS
German foundry Russian foundry Russian foundry operating at
German efficiency levels’
energy Labor services/overhead
Germany
Russia
46%
100%
-36%
100%96%
64%
100%100%
8%
29%
Source: ifc (2010), “Resource efficiency in the ferrous foundry industry in Russia: Benchmarking study,” october.

8 resource efficiency in the Ferrous Foundry industry in russia: Benchmarking study
as a result, while the benefits of low-cost energy, labour, and natural resources should, as indicated above, give Russian foundries a theoretical competitive advantage in the order of 36 percent, poor resources management eliminates any price advantage, making Russian products (perceived as offering lower quality and value) uncompetitive in terms of quality–price ratios, and putting them at a further disadvantage in export markets. While prices edge ever nearer to international levels, quality does not meet eu standards.
the current poor quality of castings means russian producers are denied access to export markets, while falling demand puts even local markets at risk.
only a few Russian foundries have any experience of exporting beyond the countries of the commonwealth independent states (cis). foundries producing goods for domestic customers or for export to customers in the cis have never been subject to the more stringent quality controls in force in the international markets. the volumes of scrapped and rejected products at Russian foundries show considerable variation. While leading producers waste less than one percent of production, the volume of wasted and rejected product can reach between 15 and 30 percent at foundries throughout the country. Waste levels in Russian foundries (i.e., as a percentage of total production) are twice as high as those in european enterprises: and eu quality standards far exceed those in Russia. if Russian foundries were required to adhere to the more stringent quality standards of the european markets, waste volumes would be, on average, four times higher.
it is therefore extremely important that foundry owners recognise the importance of improved quality as a strategic objective in the capital refurbishment of existing foundries, and the construction of new ones. higher quality castings will result in higher added value throughout the market, leading to higher profit margins: better efficiency in resources management (particularly in containing raw materials and energy consumption levels and costs, as well as in improving labour productivity) will also be essential in improving and maintaining profitability.
Figure 2: rejectiOn rateS at ruSSian FOundrieS are BetWeen tWO and FOur timeS higher than thOSe at eurOPean enterPriSeS
rejection rate (industry average)
eu Russia (national standards)
Russia (eu standards)
6.7% 6.7%
6.7%
13.4%
3.4%
x 4
x 2
Source: ifc (2010), “Resource efficiency in the ferrous foundry industry in Russia: Benchmarking study,” october.

executive summary
9resource efficiency in the Ferrous Foundry industry in russia: Benchmarking study
Where does the greatest potential for better resources management lie?
matching the efficiency of the best-performing eu plants would save enough energy to power a typical russian city of 1.5 million people: and matching eu standards in water efficiency would result in savings equivalent to total residential consumption in the netherlands. for each tonne of good-quality castings produced, Russian foundries, in comparison with eu plants, use: � three times more energy; � 3.6 times more sand; and� 161 times more water.
on the basis of Russia’s current annual production of 6.1 million tons, matching the efficiency of european plants would save 19,882 gigawatt hours (GWh) of energy, 5.7 million tons of sand, and 879 million cubic meters of water, per year.
russia’s ferrous foundries could save up to $3.3 billion per year.
Matching the resource efficiency of the best-performing eu plants could save RuB100 billion ($3.3 billion) per year (excluding capital expenditure).1 the study also showed that, in moving towards european best practice, matching even average levels of european efficiency could achieve cost savings in the order of 25 percent (figure 3).
1 on the basis that total annual production of 6.1 million tons of castings incurs an estimated total cost of RuB350 billion.
Figure 3: Better reSOurce eFFiciency cOuLd SaVe $3.3 BiLLiOn annuaLLy
100% -19% -21% -29%
Best performance, Russia
assumed cost base comprises raw materials, energy, labor, equipment, and overheads.
Best performance, europe
total potential sector-wide savings
$3.3 billion
average efficiency, Russia
average efficiency, europe
Source: ifc (2010), “Resource efficiency in the ferrous foundry industry in Russia: Benchmarking study,” october.

10 resource efficiency in the Ferrous Foundry industry in russia: Benchmarking study
matching the efficiency of the leading russian enterprises could achieve savings in the order of 19 percent across the sector as a whole, while individual enterprises could increase operational profitability by up to 15 percent.
the study also suggests that Russian foundries lag significantly behind their european peers on certain key performance indicators (KPis), with a direct impact on profitability. in comparison with european foundries, Russian enterprises:
� use 14 percent more metal per tonne of finished product;� achieve average production volumes per employee 3.6 times lower than those
in the eu; and� utilise equipment and machinery for twice as long as plants in europe, while
utilising only 50 percent of total production capacity.
the study showed that many leading Russian companies are already actively implementing best international practice in production and resource efficiency. While KPis for the best Russian enterprises currently only match average efficiency standards in europe, achieving these standards could, in addition to raising the overall efficiency of the Russian ferrous foundry industry, result in cost savings in the order of 19 percent – or RuB65 billion per year.
even on the basis of current operating costs and profit margins, better resource efficiency could potentially increase the operating profit of individual enterprises by up to 15 percent.
savings/Profitoverhead/otherequipment costsLabour costsenergy costsMaterial costs
aRP* Materials Labourenergy equipment overhead Potential
12.8%
7.1%
21.4%
13.4%
45.2%
2.0%
9.2%
12.0%2.8%
3.1%
29.0%
9.7%
4.4%
9.4%4.2%
43.3%
improved efficiency/profitability
*arP = av. Russian performance
Figure 4: energy cOStS and LaBOur ShOW the greateSt POtentiaL FOr imPrOVed eFFiciency
Source: ifc (2010), “Resource efficiency in the ferrous foundry industry in Russia: Benchmarking study,” october.

executive summary
11resource efficiency in the Ferrous Foundry industry in russia: Benchmarking study
saving 879 million cubic meters of water per year would be enough to:
– supply 3.5 million Russian citizens for one year; and
– supply 30 percent of all households in Belarus.
this volume is also more than four times the total groundwater uptake of all industrial enterprises in the netherlands.
if Russian foundries were able to match the efficiency of the best-performing eu plants, the energy saved would be sufficient to power a typical Russian city of 1.5 million people.
12 resource efficiency in the Ferrous Foundry industry in russia: Benchmarking study
how can the benefits of better resource efficiency be optimised?
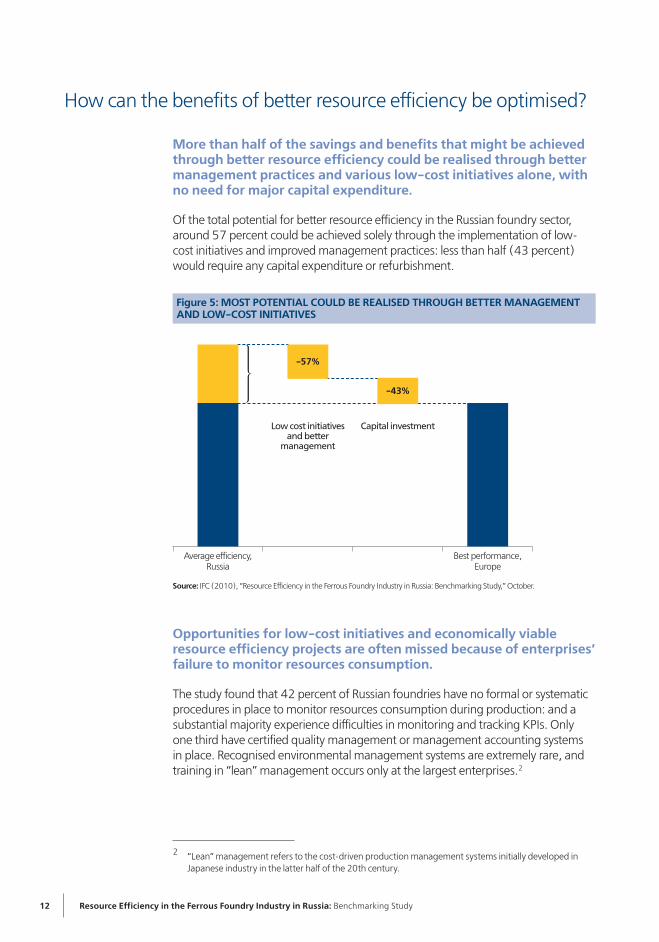
more than half of the savings and benefits that might be achieved through better resource efficiency could be realised through better management practices and various low-cost initiatives alone, with no need for major capital expenditure.
of the total potential for better resource efficiency in the Russian foundry sector, around 57 percent could be achieved solely through the implementation of low-cost initiatives and improved management practices: less than half (43 percent) would require any capital expenditure or refurbishment.
Opportunities for low-cost initiatives and economically viable resource efficiency projects are often missed because of enterprises’ failure to monitor resources consumption.
the study found that 42 percent of Russian foundries have no formal or systematic procedures in place to monitor resources consumption during production: and a substantial majority experience difficulties in monitoring and tracking KPis. only one third have certified quality management or management accounting systems in place. Recognised environmental management systems are extremely rare, and training in “lean” management occurs only at the largest enterprises.2
2 “Lean” management refers to the cost-driven production management systems initially developed in Japanese industry in the latter half of the 20th century.
Figure 5: mOSt POtentiaL cOuLd Be reaLiSed thrOugh Better management and LOW-cOSt initiatiVeS
100%
Best performance, europe
average efficiency, Russia
Low cost initiatives and better
management
capital investment
-57%
-43%
Source: ifc (2010), “Resource efficiency in the ferrous foundry industry in Russia: Benchmarking study,” october.
executive summary
13resource efficiency in the Ferrous Foundry industry in russia: Benchmarking study
russian foundries could achieve their optimum potential – in terms of resource efficiency, competitiveness, and profitability – by:
А. improving operational efficiency and productivity.1. attention needs to be most closely focused on those KPis relating to
operational procedures and technological processes since these, more than any others, have the greatest influence on cost reduction.
2. taking every available opportunity to improve energy efficiency can improve profitability levels by five percent or more. improved management processes and investment in more energy-efficient plant and machinery can be vital here: minimising energy costs must be a priority in the face of the inexorable rise in energy prices.
B. making change management an ongoing process. 1. Benchmarking techniques should be used to gain a clear understanding of an
enterprise’s competitiveness against peers in both Russia and europe.2. clear objectives should be set. Viable cost-reduction and consumption targets
should be made clear, as well as the timeframe over which these might realistically be achieved.
3. an environment of continuous improvement is essential. a 2008 report by consultancy firm McKinsey argues that only one third of change-management programs actually succeed – largely because success depends predominantly on the behavior and motivation of individuals.3 establishing an environment conducive to the implementation of optimum resource efficiency depends not only on setting key objectives and determining the best way of achieving these, but also on educating and engaging individuals in developing appropriate skills and behaviors. setting up a dedicated project team (with both internal and external specialist advisors) can be a good first step here: the involvement of external experts acts as a catalyst in eradicating redundant processes and habits, as well as generating new ideas.
3 the inconvenient truth about change Management (2008), Keller, s., and aiken, c., McKinsey & company. available at: http://www.mckinsey.com/clientservice/organisationleadership/the_inconvenient_truth_about_change_Management.pdf.
the introduction of appropriate process management practices and better monitoring of resources consumption would enable Russian foundries to close the gap on their european peers without, necessarily, incurring significant capital expenditure.

14 resource efficiency in the Ferrous Foundry industry in russia: Benchmarking study
С. making full use of available resources. following the completion of its Resource efficiency in the ferrous foundry industry in Russia: Benchmarking study, ifc has recently issued the Practical Guide to resource efficiency in the russian Ferrous Foundry industry, published in four standalone volumes.
1. compendium of key Performance indicators
the compendium of Key Performance indicators includes reference tables of potential KPis for enterprises in Russia and europe, including:� best-performance and average
standards, according to various criteria; � 32 separate classifications covering
specific aspects of iron and steel production; and
� KPis specific to the ferrous foundry industry.
2. Self-diagnostic guide Based on the methodologies used in conducting this study, the self-diagnostic Guide enables individual enterprises to collate information and analyze results against various KPis. With recommendations on data collection, and on the evaluation and analysis of information, resulting conclusions may then be benchmarked against best practice and average standards in Russia and europe.
3. Best Practice guide for the russian Ferrous Foundry Sector
this guide includes a number of strategies for improving performance, and analyzes cross-sectoral experience and best practice in the implementation of new technologies. it includes practical advice on the continuous improvement of new production processes, as well as strategies for the analysis of potential investment in new technologies.
4. resource efficiency in the Ferrous Foundry industry in russia: Benchmarking Study
the full text of this report brings together the key findings from the benchmarking study, together with recommendations on how the industry’s full potential might be realised.

1. introduction
resource efficiency in the Ferrous Foundry industry in russia: Benchmarking study 15
intRoduction the ferrous foundry industry is fundamental to machine building contributing to up to 90 percent of the its final product. high-quality castings are essential to a range of heavy industries, including railroad and electro industries, vessels building, automotive industry, and many others. over 80 percent of all ferrous castings in Russia are currently produced in foundries attached to machine-building plants. as a result of obsolete equipment (and low utilization rates of such equipment as exists), these enterprises are frequently cost rather than profit centres – and, moreover are among the most environmentally polluting.
Russia is the fourth largest producer of ferrous castings worldwide – an industry which, globally, is highly dynamic, and showing good levels of growth. during the period 1999–2008, the compound annual growth rate (caGR) in the BRic countries averaged 12 percent per year.4 Production in Russia, however, demonstrated a more modest caGR of three percent per year (prior to the economic crisis of 2008–09), of which only marginal volumes were produced for export: the poor quality of Russian castings resulting in a less than one percent of total Russian casting being exported. if this trend is allowed to continue Russia will, ultimately, cease to become a net exporter of cast iron, and will be forced to rely increasingly on imports from china and india.
4 the “BRic” countries comprise Brazil, Russia, india, and china.

resource efficiency in the Ferrous Foundry industry in russia: Benchmarking study 16
a key strategic question for senior management at machine-building and engineering plants, therefore, is: should existing foundries be modernised (and domestic production thus maintained), or should the procurement of castings be outsourced abroad?
comparing or benchmarking key performance indicators (KPis) at individual foundries against comparators in Russia and europe can inform decision making in this respect, highlighting a plant’s standing against its domestic and international peers. identifying shortfalls against KPis at “average” or “best” enterprises and industry leaders can identify the benefits to be gained in improving performance, and the initiatives necessary to achieve this. Benchmarking enables senior management to take informed decisions on whether to: а) invest in modernisation and expansion; b) dispose of or “spin-off” foundries as independent economic units; c) engage in the construction of new, greenfield plants; or d) phase out internal production in favour of outsourcing.
Russian foundries in general have a far lower degree of specialisation than their peers in europe and the united states, which, benefitting directly from greater independence (i.e., in not being tied to a specific machine-building or engineering plant, as many Russian foundries are) are more competitive on the international markets. � over 80 percent of Russian foundries are tied to an affiliated machine-building or
engineering plant, and gear the majority of their production to that single client. in europe and the united states, the position is reversed, with eight percent of all foundries being entirely independent, and supplying a range of clients. only 20 percent of foundries in these countries are attached to an affiliated machine-building or engineering company.
� competitiveness is also hampered by the sheer diversity of products that affiliated Russian foundries have to produce. almost every second foundry in Russia produces different types of final casting products and thus has to maintain different types of technology lines, which are difficult to re-orient for production from one type of casting product to another and which are often not used at their full capacity. all this leads to lower levels of efficiency.
the study also exposed a number of issues with regard to technology and equipment:� the majority of Russian foundries still utilise outdated and obsolete equipment,
with industry-wide deterioration rates of equipment being 75 percent. the use of morally obsolete technologies, as well as resulting in lower levels of efficiency and production, further inhibits Russian foundries’ ability to produce goods that are globally competitive in terms of quality and price.
� only one third of all Russian foundries use fully automated molding lines: a level of automated production prevalent throughout the industry.
the ifc Resource efficiency in the ferrous foundry industry in Russia: Benchmarking study was undertaken on the basis of comparisons of seven key performance indicators driving the costs and operating profit of a foundry. the study did not cover any issues relating to the strategic development of the foundry sector as a whole (i.e., in terms of industry-wide trends, government policy, or incentives to promote innovation or to support specific sub-sectors) since these demand more in-depth macroeconomic analysis.
russian foundries differ significantly from foundries in europe and the united States, with a lower degree of specialisation and poor quality equipment ultimately resulting in a lower level of com pe ti ti ve-ness.

1. introduction
resource efficiency in the Ferrous Foundry industry in russia: Benchmarking study 17
the study did, however, identify that the ferrous foundry industry in Russia has considerable potential for better resource efficiency, and that exploiting this potential could have a considerable bearing on the industry’s competitiveness. to support owners, senior management, and specialists at foundry plants in Russia, and based on the results of its Resource efficiency in the ferrous foundry industry in Russia: Benchmarking study, ifc has recently issued a Practical Guide to Resource efficiency in the Russian ferrous foundry industry, published in four standalone volumes.
1. compendium of key Performance indicators
the compendium of Key Performance indicators includes reference tables of potential KPis for enterprises in Russia and europe, including:� best-performance and average
standards, according to various criteria; � 32 separate classifications covering
specific aspects of iron and steel production; and
� KPis specific to the ferrous foundry industry.
2. Self-diagnostic guide Based on the methodologies used in conducting this study, the self-diagnostic Guide enables individual enterprises to collate information and analyze results against various KPis. With recommendations on data collection, and on the evaluation and analysis of information, resulting conclusions may then be benchmarked against best practice and average standards in Russia and europe.
3. Best Practice guide for the russian Ferrous Foundry Sector
this guide includes a number of strategies for improving performance, and analyzes cross-sectoral experience and best practice in the implementation of new technologies. it includes practical advice on the continuous improvement of new production processes, as well as strategies for the analysis of potential investment in new technologies.
4. resource efficiency in the Ferrous Foundry industry in russia: Benchmarking Study
the full text of this report brings together the key findings from the benchmarking study, together with recommendations on how the industry’s full potential might be realised.

resource efficiency in the Ferrous Foundry industry in russia: Benchmarking study 18
Figure 1.6: PracticaL guideS On reSOurce eFFiciency in the FerrOuS FOundry induStry in ruSSia
3) Best Practice guide
a) improving KPisB) KPis covering best-practice
technologies and techniques c) “Best available” technologies
1) compendium of kPis 2) Self diagnostic guide
4) Benchmarking Study – results
KPis values Russia (field research) • KPis values europe (GeMco data warehouse)• overall aggregated benchmark comparison•
seven selected KPis• 32 product categories• tables with KPis •
Questionnaire• instructions for data • collection and calculation of KPis
there is no doubt that improving the competiveness of individual foundries in Russia will raise the competitiveness of the ferrous foundry and machine-building industries in the country, as a whole.
the results of this research will also enable financial institutions (particularly banks and leasing companies) to develop specialist financial products to support improved resource efficiency in Russian enterprises, as well as helping suppliers, service companies, and engineering firms to identify and develop technical solutions to meet the most immediate needs of the sector. Policymakers and senior management involved in the strategic development of the sector will also find the study helpful in identifying those areas in most urgent need of reform, and in developing the strategies necessary to support this.
Structure of this report this report is structured as follows.
� chapter 2 outlines the methodology used in conducting the benchmarking study.
� chapter 3 summarises the key findings of the study, with analysis of results and data. in addition to comparing aggregated data for plants in Russia and europe, the implications of this are assessed in terms of the seven KPis on which the study was based: i) process yield; ii) production efficiency; iii) capacity utilisation; iv) energy consumption; v) fresh water consumption; vi) fresh sand consumption; and vii) labour productivity. the chapter concludes with an analysis of the potential financial benefits of improved performance in respect of each KPi, and includes an overview of technologies and management systems currently used in Russia.
� chapter 4 outlines key recommendations on maximising the potential of improved resource efficiency in ferrous foundries in Russia.

2. BenchmarkinG study: methodoLoGy
19resource efficiency in the Ferrous Foundry industry in russia: Benchmarking study
BenchMaRKinG study: MethodoLoGy the Resource efficiency in the ferrous foundry industry in Russia: Benchmarking study was conducted on the basis of hard data received from Russian foundries returning a completed questionnaire, analysed against data maintained by GeMco engineers B.V./Knight Wendling Gmbh on projects undertaken at various european ferrous foundries.
the resource efficiency in the Ferrous Foundry industry in russia: Benchmarking Study was conducted on the basis of the following criteria. � seven specific KPis, consisting of: i) process yield; ii) production efficiency; iii) capacity utilisation; iv)
energy usage; v) fresh water consumption; vi) fresh sand consumption; and vii) labour productivity.� KPis determined on the basis of production profiles and volumes derived from nationwide average
trends, calculated on the basis of all foundries participating in the data collection process.� Values derived from 32 different foundry product categories.� factual data received from Russian ferrous foundries returning a completed questionnaire: foundries
were classified according to categories outlined in the ifc compendium of Key Performance indicators.
� Product categories adjusted to reflect Russian and world ferrous casting categories.
2

20 resource efficiency in the Ferrous Foundry industry in russia: Benchmarking study
the data collected was deemed to constitute an adequate database for analysis and evaluation.� fifty five datasets were sourced from individual foundry production units.� data were analysed on the basis of averages calculated over the years 2007, 2008, and 2009 –
meaning that, effectively, some 150 individual datasets were returned and analysed.� the total production volumes of all foundries participating in the study amounted to 478,000 tonnes.
Production covered products from 27 of the 32 product categories classified in the study (84 percent).� at 478,000 tonnes, the total production volumes of all foundries participating in the study
constituted 14 percent of total Russian ferrous casting production). � data were received from both major and smaller foundries.� data were received from foundries using a range of technological processes, for the production of
both castings and mouldings. � data were received from both “single-product” and “multiple-product” foundries.
Foundries were benchmarked on the basis of seven specific kPis.the following KPis were used to monitor the operational performance of key manufacturing functions within individual ferrous foundries.
� kPi no. 1, “Process yield.” this KPi was compiled on the basis of four sub-indicators: – melting loss; – pig and spillage; – runners and risers; and – scrap castings and rejects.
� kPi no. 2, “Production efficiency” (overall equipment effectiveness (Oee)). this KPi was compiled on the basis of four sub-indicators relating to the moulding process: – down time; – slow running effects; – bad moulds; and – scrap castings and rejects.
� kPi no. 3, “capacity utilisation” (total effective equipment productivity (teeP)). � kPi no. 4, “energy consumption.”� kPi no. 5, “Fresh sand consumption.”� kPi no. 6, “Fresh water consumption.”� kPi no. 7, “Labour productivity.”
LaBOur PrOductiVity
kPi 7
PrOceSS yieLd kPi 1
PrOductiOn eFFiciency
kPi 2
FreSh Sand cOnSumPtiOn
kPi 5
energy cOnSumPtiOn
kPi 4
teeP kPi 3
FreSh Water cOnSumPtiOn
kPi 6
kPi mainLy determined By
technology and Procedures
Products and technology
Organisation and equipment
Figure 2.1: key PerFOrmance indicatOrS (kPiS)

2. BenchmarkinG study: methodoLoGy
21resource efficiency in the Ferrous Foundry industry in russia: Benchmarking study
metal yard storage
charging
sand Plant storage
preparation
raw material
21 4
Buy
21
2 73
7 3
Production efficiency (oee)2
Process yield1
4 energy consumption
5 Fresh sand consumption
6 Fresh Water consumption
7 Labor Productivity
3 capacity utilization (teeP)
Selected kPi's
metal recycling transport
moulding shop mould forming
core making core setting
sand recycling transport, cooling
melting shop melting holding
treatment
casting shop pouring cooling
shake out separation
Finishing shop shot blasting
grinding deburring thermal
treatment inspection/
testing
Packing Labelling
storage shipping
21 6 4 6 7
21 7
7 3
21 5 7 3
2 5 3
21 4 6 7 3
Scraprisers runners sprue
Sell
Figure 2.2: SeLected kPiS

22 resource efficiency in the Ferrous Foundry industry in russia: Benchmarking study
Benchmarking comparisons were based on KPis across the full product mix of all foundries in the survey, calculated as a weighted average on the basis of total production in each product category.
Product categories:� the survey focused on three major product categories: “grey iron,” “ductile iron,”
and “steel castings,” each of which differs in terms of the specific KPis most relevant to it. for that reason, it was important to ensure the data reflected a mix of foun-dries and products consistent with the wider ferrous foundry industry in Russia.
� the data sample was cross-matched against statistics sourced from the european foundry association (caef) and the Russian foundry association (Rfa). it was found to deliver a good match in terms of the product categories outlined in table 2.1, below.
global comparisons (by product category)overall benchmarking standards were set on the basis of industry-wide production in Russian foundries, despite some differences in the total Russian product mix in comparison with european and worldwide production (figure 2.3, below). Russia produces proportionately more steel castings and fewer ductile castings (by volume), than both europe and the rest of the world.
Grey and alloyed iron
ductile and malleable iron
steel
note: * europe excluding Russia.Source: Modern casting statistics (2008), december.
Figure 2.3: the Structure OF the FOundry SectOrS in ruSSia, the eurOPean uniOn, and WOrLdWide (2007)
50%
ruSSia
eurOPe*
WOrLd
30%
20%9%
13%
53%38% 57%
30%
Product category Benchmarking Study(data 2007, 2008, 2009)
caeF(data 2007–08)
rFa(data 2008)
grey iron
automatic 35%
50% 50%
84%
Mechanised 11%
hand 5%
ductile iron
automatic 25%
26% 30%Mechanised 0.4%
hand 1%
Steel
automatic 0.1%
24% 20% 16%Mechanised 22%
hand 2%
table 2.1: SurVey data cOmPOSitiOn (By PrOduct categOry and data SOurce)
note: “caef” is the european foundry association (www.caef.org) and “Rfa” is the Russian foundry association (www.ruscastings.ru).

2. BenchmarkinG study: methodoLoGy
23resource efficiency in the Ferrous Foundry industry in russia: Benchmarking study
it is anticipated that ductile and malleable iron will become increasingly important in terms of total production in Russia as production of steel castings, forgings, and fabrications begins to decrease.
ductile iron castings exhibit many similar properties to steel castings. however, they are much cheaper than steel castings and are easier to cast. Purchasers in price-sensitive industries (e.g., the automotive industry) prefer to use ductile castings rather than steel castings, where possible. Producers operating throughout Russia, and those exporting on the international markets, will require more ductile castings (and fewer steel-cast components) in the future.
data were collected from Russian foundries over a period of three years, from 2007 to 2009, inclusive. however, production volumes showed considerable variation during this period, as a result of the current economic crisis.
KPis were calculated as an average across all years from 2007 to 2009. on that basis, total production across all three years was 84 percent of total production in 2007. this lower average volume was found to have a significant impact on two KPis in particular: � production efficiency (oee) (scheduled operational time unadjusted); and� capacity utilisation (teeP).
since the ferrous foundry industry is so highly segmented, it is important that any benchmarking analysis take account of key differentiating factors (material, technology, and product type).
grey irOn (product categories)
ductiLe irOn (product categories)
SteeL (product categories)
automatic moulding
gaBh = automotive engine blocks and cylinder headsgaaO = automotive othergaag = agriculturegami = mining
daau = automotive otherdage = general engineering
Sarc = railway components (c)Samm = mining components (m)Saac = commercial vehicles (c)Sagc = general engineering (c)
mechanised moulding
gmBh = medium size engine blocks and heads (energy generation)gmag = agriculturegmmi = mininggmge = general engineering
dmau = automotivedmge = general engineering
Smrc = railway components (c) Smmm = mining components (m)SmPc = pumps and valves (c)SmPS = pumps and valves (s)Smgc = general engineering (c) Smac = commercial vehicles (c)
manual (hand) moulding
ghBh = large size engine blocks and heads (energy generation)ghmi = miningghge = general engineering
dhen = energy generation componentsdhcO = compressor componentsdhge = general engineering
Shmm = mining components (m) ShPc = pumps and valves (c)Shea = energy components (a)Shgc = general engineering (c)
key: (c) is carbon steel; (s) is stainless steel; (m) is manganese steel; (a) is high-alloy steel
table 2.2: a tOtaL 32 PrOduct categOrieS Were identiFied

24 resource efficiency in the Ferrous Foundry industry in russia: Benchmarking study
the data collected provides an adequate basis for analysis and evaluation. � the total production volumes of all foundries participating in the study
amounted to 478,000 tonnes, and covered products from 27 of the 32 of the product categories identified (84 percent).
� any gaps in the coverage of product categories was covered by the interpolation of data based on total-industry, Russia-wide performance.
� data were also cross-matched against the proportional distribution of all product categories comprising total Russia-wide production.
the quality of the analysis, and of the conclusions reached, can only be as good as the quality of the data provided, however.� all data has been taken at face value, and has been used on the basis of
questionnaires returned.
� some of the data received had clearly not been measured, but, rather, had been estimated or projected. this was evidenced by: – performance levels recorded as identical for all three years;– consumption levels identical across all three years;– individual parameters recorded as precise whole numbers (rather than
recorded to one or more decimal points); and– parameters showing no change despite changes in the product mix.
� some data received was deemed to be dubious. such data included:– foundries recording no melting loss (no furnace can melt without some
melting loss); and– foundries recording no scrap, bad moulds, or downtime over the three
years from 2007–09.
� Where Knight Wendling Gmbh believed responses to be questionable further clarification was sought: questionable data which could not be clarified were disregarded.
the data reported clearly indicate that performance monitoring could be improved, potentially by:� measuring and recording data accurately, automatically, and on a regular basis;
and � analysing data and instigating measures for the continuous improvement of
this process.
the collection of data is the start of a process, not the end of one.

2. BenchmarkinG study: methodoLoGy
25resource efficiency in the Ferrous Foundry industry in russia: Benchmarking study
on some KPis russia’s best foundries triumph over the best in europe. however, these cases are rare and, where they occur, unique.
in terms of competitiveness, the Russian foundry industry lags significantly behind europe – being between 1.5 and four times less competitive.

26 resource efficiency in the Ferrous Foundry industry in russia: Benchmarking study
BenchMaRKinG study: Key findinGs 3.1 anaLySiS OF aggregated data Key performance indicators (KPis) monitor operational performance on the basis of physical values (tonnes, cubic metres, time, man-hours, etc.). By comparing KPis, e competitive advantage (or the “operations gap”) can be monitored. this section compares the aggregated performance of all those Russian ferrous foundries participating in the benchmarking survey, together producing the total product mix as described above.
3

3. BenchmarkinG study: key FindinGs
27resource efficiency in the Ferrous Foundry industry in russia: Benchmarking study
3results for kPis across all foundries (all categories: grey iron, ductile iron, and steel castings)
Overall Foundries key Performance indicators iron and Steel
eurOPe ruSSia
Overall weighted Overall weighted
Best practice
average perfor-mance
Best practice
average perfor-mance
1. Process yield (%) (from four sub-indicators) 64.1 59.4 66.2 52.3
melting loss (%) 1.9 3.2 2.6 4.5
pig and spillage (%) 2.4 3.0 1.7 3.3
runners & risers (%) 31.5 34.5 29.3 39.3
scrap & rejects (%) 2.1 3.4 2.2 6.7
2. Oee (moulding) (%) (from four sub-indicators) 81.1 77.3 86.9 48.4
downtime (%) 11.9 14.2 4.6 22.7
slow running (%) 5.1 5.7 6.5 30.3
bad moulds (%) 0.8 1.1 0.5 3.8
scrap & rejects (%) 2.1 3.4 2.2 6.7
3. teeP (%) capacity utilisation 63.9 53.5 43.6 25.2
4. energy consumption (kWh per to produced)
for melting (kWh/to melt) 544** 560** 779** 1164**
for casting (kWh/to cast) 1247 1453 3155 4506
5. Sand consumption (per ton good casting)
fresh sand (to sand/to cast) 0.312 0.349 0.583 1.252
sand regeneration (%) 95.9 94.0 95.6 89.2
6. Fresh water consumed (m3 per to good casting) 0.76 0.90 17.10 144.89
7. Labour productivity (man-hr/to good casting) 15.1 21.0 26.7 75.2
** note: excludes post-tap refining
analysis of average performance against benchmarks
the benchmarking of average performance levels highlights significant differences between european and Russian foundries.
to produce an equivalent volume (one tonne) of good castings, Russian foundries:
� process 14 percent more metal (of which most is recycled);
� operate plant and facilities for 60 percent longer;
� consume 2.1 times more energy for melting;
� consume 3.1 times more energy, in total;
� consume 3.6 times more fresh sand;
� consume 161 times more fresh water;
� need 3.6 times more man-hours;
� operate at only half the capacity utilisation of european foundries.
efficiency levels at ferrous foundries differ significantly between those producing iron (grey and ductile iron) and those producing steel products.
table 3.1: key PerFOrmance indicatOrS (kPis) – eurOPe and ruSSia

28 resource efficiency in the Ferrous Foundry industry in russia: Benchmarking study
Overall Foundries key Performance indicators
iron castings Steel castings
europe russia europe russia
Best practice
average perfo-mance
Best practice
average perfo-mance
Best practice
average perfo-mance
Best practice
average perfo-mance
iron castings weighted
iron castings weighted
iron castings weighted
iron castings weighted
Steel castings weighted
Steel castings weighted
Steel castings weighted
Steel castings weighted
1. Process yield (%) (from four sub-indicators) 69.1 64.2 64.6 52.5 49.6 45.3 71.0 51.6
melting loss (%) 1.0 2.0 2.0 4.1 4.9 7.1 4.3 5.8
pig and spillage (%) 1.9 2.4 1.6 2.9 4.0 5.0 1.9 4.7
runners & risers (%) 27.8 30.9 31.3 39.2 43.5 46.0 23.0 39.5
scrap & rejects (%) 1.6 2.9 2.3 7.2 3.8 5.0 1.7 5.0
2. Oee (moulding) (%) (from four sub-indicators) 81.9 77.9 85.9 44.1 78.7 75.1 90.1 63.2
downtime (%) 11.9 14.3 4.1 23.8 12.0 14.0 6.2 19.1
slow running (%) 4.6 5.2 8.0 35.1 6.8 7.5 1.6 15.3
bad moulds (%) 1.0 1.3 0.5 4.0 0.3 0.5 0.6 2.9
scrap & rejects (%) 1.6 2.9 2.3 7.2 3.8 5.0 1.7 5.0
3. teeP (%) capacity utilisation 68.3 56.3 35.7 22.3 50.2 44.8 69.5 34.2
4. energy consumption (kWh per to produced)
for melting (kWh/to melt) 558 571 807 1118 500** 525** 686** 1310**
for casting (kWh/to cast) 1165 1338 3014 4235 1503 1815 3604 5359
5. Sand consumption (per ton good casting)
fresh sand (to sand/to cast) 0.31 0.34 0.35 0.70 0.33 0.36 1.31 2.99
sand regeneration (%) 96.1 94.8 96.6 94.3 95.1 91.6 92.6 73.0
6. Fresh water consumed (m3 per to good casting) 0.8 0.9 20.9 173.2 0.7 0.8 4.6 55.8
7. Labour productivity (man-hr/to good casting) 11.5 16.3 24.0 59.6 26.3 35.7 34.3 124.3
table 3.2: kPis at FOundrieS PrOducing grey irOn and ductiLe irOn, and thOSe PrOducing SteeL PrOductS (Benchmark SurVey SamPLe)
** note: excludes post-tap refining

3. BenchmarkinG study: key FindinGs
29resource efficiency in the Ferrous Foundry industry in russia: Benchmarking study
ratios of kPis across russia and europe (benchmark survey sample)
Ratios of KPis highlight the volume of resources used in Russian foundries in comparison with those in europe: depending on the KPi, a high ratio can indicate a good or bad performance.
ratiOkey Performance indicators
iron castings Steel castings iron and Steel
Best practice
average perfo-mance
Best practice
average perfo-mance
Best practice
average perfo-mance
ruS/eu weighted
ruS/eu weighted
ruS/eu weighted
ruS/eu weighted
ruS/eu weighted
ruS/eu weighted
1. Process yield (%) (from four sub-indicators) 0.93 0.82 1.43 1.14 1.03 0.88 high ratio =
high performance
melting loss (%) 2.00 2.05 0.88 0.82 1.37 1.41high ratio = high losses
=> low performance
pig and spillage (%) 0.84 1.21 0.48 0.94 0.71 1.10
runners & risers (%) 1.13 1.27 0.53 0.86 0.93 1.14
scrap & rejects (%) 1.44 2.48 0.45 1.00 1.05 1.97
2. Oee (moulding) (%) (from four sub-indicators) 1.05 0.57 1.14 0.84 1.07 0.63
high ratio = high
performance
downtime (%) 0.34 1.66 0.52 1.36 0.39 1.60high ratio = high losses
=> low performance
slow running (%) 1.74 6.75 0.24 2.04 1.27 5.32
bad moulds (%) 0.50 3.08 2.00 5.80 0.63 3.45
scrap & rejects (%) 1.44 2.48 0.45 1.00 1.05 1.97
3. teeP (%) capacity utilisation 0.52 0.40 1.38 0.76 0.68 0.47
high ratio = high
performance
4. energy consumption (kWh per to produced)
high ratio = high
consumption => low
performance
for melting (kWh/to melt) 1.45 1.96 1.37 2.50 1.43 2.08
for casting (kWh/to cast) 2.59 3.17 2.40 2.95 2.53 3.10
5. Sand consumption (per ton good casting)
fresh sand (to sand/to cast)
1.14 2.03 3.97 8.23 1.87 3.59
sand regeneration (%) 1.01 1.00 0.97 0.80 1.00 0.95 high ratio = high
performance
6. Fresh water consumed (m3 per to good casting) 26.13 192.44 6.57 69.75 21.38 161.00 high ratio
= high consumption
=> low performance
7. Labour productivity (man-hr/to good casting) 2.09 3.66 1.30 3.48 1.77 3.58
* note: the large gap in water consumption reflects the data returned, and may merit more detailed analysis on site. it is assumed that some foundries included recycled water in their calculation of “fresh” water consumption.
table 3.3: ratiOS OF kPis acrOSS ruSSia and eurOPe (Benchmark SurVey SamPLe)
Russian foundries could save approximately RuB100 billion per year on total production of six million tonnes of castings by matching european best practice in the more efficient use of energy, sand, and water.

30 resource efficiency in the Ferrous Foundry industry in russia: Benchmarking study
Russian foundries use 14% more metal to produce one tonne of finished product.
Why?
– wastage and scrap volumes are twice as high as those in europe;
– melting losses are, on average, 40 percent higher;
– obsolete technologies and inadequate control procedures constrain productivity.

3. BenchmarkinG study: key FindinGs
31resource efficiency in the Ferrous Foundry industry in russia: Benchmarking study
3.2.1 PRocess yieLd comparative results for KPi no. 1, “Process yield”
1
4 5
2
6
37
Factor europe russia
Best practice (BP) 1.0 1.03
average practice 1.0 0.885
BP 64.1%
average 59.4%
50%
r F
e u
100%
BP 66.2%
average 52.3%
the “process yield” describes the material balance over the manufacturing process. the quantity of good castings sold is expressed as a percentage of the metallic raw material charged to the furnaces. this is an important parameter as it measures how efficiently a foundry uses its raw material.
Process yield comprises four sub-indicators (each expressed as a percentage of total production): а) melting loss;b) pig and spillage;c) runners and risers; d) scrap castings and rejects.
a) melting Loss (oxydation, slag, ...)
metal tapped from furnace
metallic charge to furnace (tons = 100%)
b) Pig and Spillage (solidified, spilled, ...)
metal poured into molds
c) runners, risers (gatings, ...)
metal forming the cast component
d) Scrap castings (internal scrap + external rejects)
good castings (tons = ....%)
Process Yield (%) (material consumption)
3.2 cOmPariSOn OF kPiS FOr ruSSia and eurOPe
5 on average, Russian foundries have to process 14 percent more metal than european foundries to produce the same volume of good-quality castings: 59.4 / 52.3 = 1.14.

32 resource efficiency in the Ferrous Foundry industry in russia: Benchmarking study
increasing the process yield has an effect on: � improved material use, as well as on:
– lower energy consumption; – the potential for higher labour utilisation and the potential for improved
capacity utilisation.
the main areas of difference (on average, in terms of Russian losses vs. those in the eu) concern:� scrap castings and rejects: 1.97 (or 97 percent more);� melting loss: 1.41 (or 41 percent more); � box yield (runners and risers): 1.14 (or 14 percent more).
Major differences between Russian and european foundries include:� the greater use of arc furnaces in Russia;� generally lower-technology moulding systems; � lack of process control.
actionscarry out detailed foundry audits on individual plants to identify specific differences and potential improvements.
1
4 5
2
6
37
3.2.1.1 improving kPi no. 1.1, “melting loss”
comparative results for KPi no. 1.1, “Melting loss”
Factor europe russia
Best practice (BP) 1.0 1.37
average practice 1.0 1.41
BP 1.9%
average 3.2%
0%
r F
e u
5%
BP 2.6%
average 4.5%
“Melting loss” is the material lost during melting (either by oxidation or incorporation into the slag), expressed as a percentage of the metallic material charged to the melting furnaces.
the melting loss has a direct impact on the consumption and cost of raw materials. the melting loss includes:� a “necessary” loss, necessary to achieve the required chemical composition for
the desired alloy properties; � an “unnecessary” loss, resulting from sub-optimal material qualities,
production processes, and technology.

3. BenchmarkinG study: key FindinGs
33resource efficiency in the Ferrous Foundry industry in russia: Benchmarking study
the impacts of melting loss on the performance of a foundry include the following.� a direct impact on the consumption and cost of raw materials.� a direct impact on energy costs (since the lost metal has been melted).� if the melting plant is the bottleneck of the foundry:
– an impact on capacity utilisation (capital costs); – an impact on labour costs (productivity).
the melting loss differs in accordance with the melting processes applied.
kPi 1.1 “melting loss”
eurOPe ruSSia
Best practice
average Best practice
average
induction melting 1.0% 2.0% 1.0–3.0% 1.4–7.7%
cupola melting 2.0% 4.0% 2.8–5.0% 2.8–9.0%
arc melting 4.0–5.0% 5.0–7.5% 4.2–5.6% 4.3–9.2%
Reasons for excessive melting loss include:а) the quality of charged material;b) the sequence of charged material;c) holding material at high temperatures for extended periods of time;d) incorrect refractory application (inferior material as a lining would cause more
slag);e) poor slag chemistry control; f) inadequate melting equipment.
to improve kPi 1.1, “melting loss:”
a) select charge material of the correct quality:� the composition of the “cold set-up” of raw materials must fit the required final
cast material specification, in order to:– avoid the later addition of missing alloy/trim additions, because these are
higher in burn-off; – avoid additional metallurgical steps to reduce elevated chemical elements;
� ensure the raw material is kept dry and free from white frost or any other source of water, and purchase alloy additions with a low content of chemically bond water inside: – humidity will cause chemical reactions resulting in oxidation and hydration, as
well as losses of various important chemical elements; – moisture influences the consumption of elements initially provided to
compose the required specification;
� ensure the raw material is kept free from dirt such as oil, grease, sand, rust, etc.:– dirt of this kind is weighed and charged but does not contribute to the
amount of liquid metal: it must therefore be replaced by additions;– the emission of oxygen (i.e., evidenced by rust) or other gases in the melt will
lead to increased burn-off or excessive slag;– since dirt influences the chemistry and leads to the necessary addition of certain
elements, keep the material clean and, if possible, shot-blast the return; – avoid the use of zinc-coated scrap.

34 resource efficiency in the Ferrous Foundry industry in russia: Benchmarking study
b) follow the optimum sequence when charging material:� an incorrect cold set-up sequence will lead to inhomogeneous melt, which finally
results in higher burn-off (stirring by overheating and convection); � the later addition of elements in order to correct the melt will always lead to
higher burn-off or slag.
c) avoid non-metallurgical overheating and extended holding times:� avoid losses related to diffusion: diffusion is a function of temperature and time –
higher temperatures and longer periods of time rapidly increase losses;� melt as quick as possible and accomplish the necessary overheating; � avoid high corrections between melting and tapping by adjusting the metal
analysis in the charge preparation.
d) apply the correct refractory (lining of the furnace);� if the melt and refractory do not fit together the melt will chemically react with
the refractory, leading to elevated slag, burn-off, and conglomerates.
e) control slag chemistry carefully:� if slag control is poor some important elements may be trapped in the slag and
need to be replaced later.
f) apply adequate melting technology:� for select certain technology (induction, cupola, arc, etc.) the melting loss is
fixed within a certain range. despite this, losses can be reduced by upgrading equipment to state-of-the-art technology;
� modern state-of-the-art equipment has improved performance in the following ways:– higher-energy density increases the melting rate and reduces losses over
time; – better heat-exchange processes allow much higher energy transfer
effectiveness and thereby reduce losses over time.
impact on the bottom line.
Reducing melting loss will result in:� reduced consumption of metal (because most of the metal lost has to be
replaced); � reduced consumption of energy (because the energy consumed in melting the
lost metal is wasted).

3. BenchmarkinG study: key FindinGs
35resource efficiency in the Ferrous Foundry industry in russia: Benchmarking study
1
4 5
2
6
37
3.2.1.2 improving kPi no. 1.2, “Pig and spillage”
comparative results for KPi no. 1.2, “Pig and spillage”
Factor europe russia
Best practice (BP) 1.0 0.71
average practice 1.0 1.10
BP 2.4%
average 3.0%
0%
r F
Е u
5%
BP 1.7%
average 3.3%
“Pig and spillage” refers to the amount of liquid metal tapped from the furnaces (and which does not get poured into moulds), expressed as a percentage of the liquid metal tapped.
the impact of pig and spillage loss on the performance of a foundry is as follows.� some five to ten percent of pig and spillage is lost material and has to be
disposed of; such material cannot be recycled since it contains ingredients which are not required in the next scheduled charges.
� some 90–95 percent of material can be recycled but:– further losses occur with melting loss;– it is necessary to add further alloys or trimming additions;– further energy is required for melting;– further melting capacity and labour are required at the melt shop; – if the melt shop is the bottleneck, further plant capacity and labour are
consumed.
Losses incurred through pig and spillage vary:� in relation to the melting processes applied; � in relation to moulding technology: the hand-moulding process will always
involve an excess of melt, necessary to avoid having insufficient metal available (which could potentially ruin an entire large casting).
kPi 1.2 “Pig and spillage”
eurOPe ruSSia
Best practice
average Best practice
average
induction melting 1.6–4.0% 2.5–5.0% 1.0–4.8% 1.5–6.0%
cupola melting 1.6–4.0% 2.5–5.0% 1.0–4.8% 1.5–6.0%
arc melting 4.0% 5.0% 1.0–5.0% 2.4–9.1%

36 resource efficiency in the Ferrous Foundry industry in russia: Benchmarking study
Reasons for excessive pig and spillage loss include:а) incorrect metal analysis (which cannot be poured into moulds since this would
result in scrap castings);b) incorrect metal temperature in the ladle (as above);c) moulding line breakdown after tapping;d) fragile or vulnerable production plan;e) inadequate pouring technology and procedures.
to improve kPi 1.2, “Pig and spillage:”
a) Release melt for pouring only in line with correct metal analysis: � install test equipment close to the furnaces for:
– thermal analysis;– wedge test;– spectrometer;
� edit instructions for sampling, testing, and documentation.
b) ensure the correct metal temperature in the ladle:� use only preheated ladles;� measure temperature before tapping;� closely synchronise tapping with progress at moulding.
c) Minimise moulding line breakdown time: � always have spare patterns ready, to replace damaged patterns;� repair damaged patterns as soon as possible;� ensure the repair of moulding line damage as fast as possible;� ensure essential spare parts for moulding lines need are available at all times.
d) a robust and synchronised production plan should be: � robust throughout the entire manufacturing system (including the melting,
moulding, cores, and pouring functions); � sufficiently flexible to allow alterations without the need to change melt batches.
e) ensure adequate pouring technology and procedures: � choose an appropriate pouring technology, from:
– manual ladle pouring for medium-sized (mechanised moulding) to large castings (manual moulding);
– automatic pouring (auto-pour) for castings on automated moulding lines; � ensure casters involved in manual pouring are fully skilled:
– ensure employees are fully trained in pouring;– motivate the workforce to pour carefully;
� maintain vigilant control of auto-pour devices in automatic pouring:– take care that the nozzle is clean to ensure sealed closure;– ensure vigilant temperature control if unheated pouring vessels are used.
impact on the bottom line.
Reducing pig and spillage will:� reduce consumption of metal, since between five and ten percent of pig and
spillage material is lost, and must be replaced;� reduce consumption of energy, because any pig and spillage losses will have
been melted without success, and must therefore be melted again.

3. BenchmarkinG study: key FindinGs
37resource efficiency in the Ferrous Foundry industry in russia: Benchmarking study
1
4 5
2
6
37
3.2.1.3 improving kPi no. 1.3, “runners and risers”
comparative results for KPi no. 1.3, “Runners and risers”
this KPi concerns the weight of any liquid metal poured into a mould, which is not subsequently used to form a casting, expressed as a percentage of the liquid metal poured into that mould. in this context, the term “box yield” is often used. this refers to the percentage of metal poured into the mould, which is subsequently used to form a casting.
the impact of runners and risers on the performance of a foundry is as follows.� More castings are produced for the same amount of liquid metal, resulting in:
– savings in energy consumption;– savings in labour;– improved capacity utilisation;– savings in the cost of materials (alloy and trimming additions).
the losses arising from runners and risers vary in accordance with: � casting materials (designed to material-specific properties such as volume
deficit (cubic contraction, micro-porosity, macro-porosity, shrinkage, etc.); � the type of product (large-series castings will be optimised whereas in small
series and single castings a sub-optimum is acceptable);� the type of process (mould rigidity);� the geometry of castings: this also influences the proportion of runners and
risers – complex castings require more runners and risers than simple designs.
Factor europe russia
Best practice (BP) 1.0 0.93
average practice 1.0 1.14
BP 29.3%
average 39.3%
BP 31.1%
average 34.0%
0%
r F
Е u
50%
kPi 1.3 “runners and risers”
eurOPe ruSSia
Best practice average Best practice average
grey/alloy iron 20.0–38.0% 25.0–40.0% 20.4–34.9% 25.7–42.0%
ductile iron 35.0–38.0% 37.5–40.0% 17.9–49.7% 45.3–54.2%
Steel 30.0–48.0% 32.5–50.0% 29.9–59.9% 33.0–50.8%

38 resource efficiency in the Ferrous Foundry industry in russia: Benchmarking study
Reasons for low box yield include:а) runners too large for the size of castings;b) feeders larger than is necessary;c) large pouring cups;d) an insufficient number of impressions per mould;e) size of moulding box inappropriate for casting size.
to improve kPi 1.3, “runners and risers:”
a) Redesign the running system (runners, feeders), including:� balance systems;� use of insulating and exothermic sleeves;� use of predictive solidification simulation packages (mainly steel).
b) optimise the dimensions of pouring cups:� ensure the pouring cup is of the smallest size possible, consistent with the
speed of metal delivery;� where, appropriate an auto-pour system allows the size of the pouring cup to
be minimised. c) improve mould utilisation:� use appropriate mould packages of a size appropriate to the size of the
casting;� improve mould utilisation by increasing the number of impressions per mould;� ensure adequate mould rigidity.
impact for the bottom line.
Reducing runners and risers will: � reduce consumption of energy, since losses incurred through runners and risers
will have been melted without being used as a casting, and must be melted again;
� reduce man-hours in the casting process since, if runners and risers are reduced, labour is concentrated on the production of saleable castings;
� improve capacity utilisation: the availability of casting manufacturing equipment is the predominant factor in limiting capacity. if runners and riders are reduced then proportionately more capacity can be dedicated to the production of saleable cast components.

3. BenchmarkinG study: key FindinGs
39resource efficiency in the Ferrous Foundry industry in russia: Benchmarking study
1
4 5
2
6
37
3.2.1.4 improving kPi no. 1.4, ”Scrap casting and rejects”
comparative results for KPi no. 1.4, “scrap casting and rejects”
this KPi monitors the weight of scrap castings (including customer returns), expressed as a percentage of the weight of gross castings produced.
a comparison of european and Russian scrap levels should take into account: � the fact that scrap and general quality requirements are based on Western
specifications and customer requirements;� the fact that Russian KPi values predominantly relate to domestic standards.
the impact of reducing the volume of scrap and rejects on the performance of a foundry is as follows.� More good-quality castings are produced in proportion to the same volume of
gross castings, resulting in:– savings in energy consumption;– improved labour productivity;– improved capacity utilisation;– savings in material costs (alloy and trimming additions);
� better relationships with customers, leading to fewer losses through customer returns.
the losses connected to scrap and rejects vary in relation to: � material applications (e.g., x-ray requirements for oil-related steel castings);� the size of the series run (higher series have lower scrap levels).
Factor europe russia
Best practice (BP) 1.0 1.05
average practice 1.0 1.97
BP 2.1%
average 3.4%
0%
r F
Е u
10%
BP 2.2%
average 6.7%
kPi 1.4 “Scrap casting and rejects”
eurOPe ruSSia
Best practice
average Best practice
average
grey/alloy iron 1.0–4.0% 2.5–5.0% 1.0–3.0% 5.4–25.6%
ductile iron 1.2–4.0% 2.5–5.0% 2.2–16.5% 6.3–14.0%
Steel 2.5–4.5% 5.0% 0.5–4.7% 1.8–7.4%

40 resource efficiency in the Ferrous Foundry industry in russia: Benchmarking study
there are many reasons for excessive scrap castings and high scrap levels, but they generally involve:
a) insufficient process controls;b) incorrect metallurgy;c) sand-related problems;d) casting design;e) incorrect manufacturing processes.
to improve kPi 1.4, “Scrap casting and rejects:”
a) instigate a systematic approach to identifying potential causes, and set clear priorities:� investigate scrap levels by weight, volume, and cost;� identify high scrap items by product type, individual castings, and defect
causes;� implement an improvement programme targeted at the highest scrap values. b) implement product process control procedures and data collection, to include: � manufacturing process control data (e.g., analysis and temperature controls,
etc.);� metallurgical requirements (e.g., microstructure, hardness, etc.);� sand properties;� customer requirements on casting quality (acceptance standards). c) instigate continuous improvement and updating of process control data.
d) ensure all design is conducted on the basis of ensuring optimum manufacturing efficiency (e.g., remove sharp corners, insufficient draft angles, hot spots, insufficient radius, etc.), and establish desirable standards and parameters through discussion with customers.
e) Re-equip the foundry with production processes and/or equipment more appropriate to the castings being manufactured.
impact on the bottom line.
Reducing the volume of scrap castings and rejects will: � reduce consumption of energy, since losses incurred due to scrap castings and
rejects will have been melted without producing a saleable good casting, and must be melted again;
� improve labour efficiency: labour can be concentrated on the production of viable castings as the level of scrap and rejects is reduced (and with it the incidence of runners and risers);
� improve capacity utilisation as the proportionate volume of saleable castings increases.

3. BenchmarkinG study: key FindinGs
41resource efficiency in the Ferrous Foundry industry in russia: Benchmarking study
Low production efficiency means producing one ton of good-quality castings takes
60 percent longer in Russia than in europe.

42 resource efficiency in the Ferrous Foundry industry in russia: Benchmarking study
3.2.2 PRoduction efficiency (“oVeRaLL eQuiPMent efficiency” (oee))1
4 5
2
6
37
“Production efficiency” refers to the utilisation of the time available for production. it refers to the time used for the production of good-quality castings, expressed as a percentage of the planned time available.
this KPi comprises four sub-indicators (each expressed as a percentage):a) KPi 2.1: down time;b) KPi 2.2: slow running;c) KPi 2.3: Bad moulds;d) KPi 2.4: scrap castings.
BP 81.1%
average 77.3%
0%
r F
Е u
100%
BP 86.9%
average 48.4%
a) down time (molding line stops)
uptime (molding line operates)
Production time (100%) (line and labour prepared)
b) Slow running (line running slower than designed)
actual Line Output (considering actual speed)
c) Bad/uncast molds (defect moulds during molding process)
cast molds (successful pouring process)
d) Scrap castings (internal scrap + external rejects)
good castings (time efficient production...%)
Oee (%) Overall equipment efficiency(time consumption)
this KPi has an impact on:� increased labour productivity;� improved capacity utilisation.
6 on average, Russian foundries have to run plant for periods up to 60 percent longer than those in europe to produce an equivalent volume of good-quality castings: 77.3/48.4 = 1.60.
Performance factors:oee: (Russian time consumption/casting vs. eu time consumption) � Best practice (86.9/81.1): 1.07� average (48.4/77.3): 0.636

3. BenchmarkinG study: key FindinGs
43resource efficiency in the Ferrous Foundry industry in russia: Benchmarking study
the main areas of difference (on the basis of average time losses in Russia vis-à-vis time losses in the eu) are: � slow running: 5.32;� bad moulds: 3.45;� downtime: 1.60.
Major differences include:� excessive spare capacity in Russia (see teeP), which reduces downtime through
the availability of alternative production capacity;� the “slow running” figure of c. 30 percent indicates a complete lack of
supervision and hides other problems;� the level of downtime and the incidence of bad moulds reflect the standard of
the maintenance of much equipment.
1
4 5
2
6
37
3.2.2.1 improving kPi no. 2.1, “down time” (moulding)
comparative results for KPi no. 2.1, “down time” (moulding)
Factor europe russia
Best practice (BP) 1.0 0.39
average practice 1.0 1.60
BP 11.9%
average 14.2%
0%
r F
Е u
25%
BP 4.6%
average 22.7%
this KPi monitors the time during which a moulding facility is not in operation (as a result of breakdowns or for other operational reasons), expressed as a percentage of the total time available for production (often described as “net operating time”).
the impact of less downtime on the performance of a foundry is as follows.� More gross castings are produced during the same amount of time, resulting in:
– better labour efficiency;– better capacity utilisation.
the losses connected to downtime differ.� Losses vary according to moulding technology:
– manual moulding – little sophisticated equipment is involved in this process, resulting in fewer breakdowns and less impact; equipment failure does not necessarily result in production downtime;
– mechanised moulding lines – these have higher levels of breakdowns due to the greater volume of equipment involved, resulting in downtime for virtually all breakdowns;

44 resource efficiency in the Ferrous Foundry industry in russia: Benchmarking study
– plants with automatic moulding lines are at risk of breakdowns but tend to have a fault indication system and organised maintenance schemes.
� Within automatic and mechanised moulding differences in performance relate to different types of moulding processes:– high-pressure boxed (green sand);– flaskless vertically parted (green sand);– mechanised pattern flow (chemically bonded/no bake).
kPi 2.1 “downtime” (moulding)
eurOPe ruSSia
Best practice average Best practice average
automatic moulding 11.5–13.0% 15.0% 0.6–16.3% 1.1–35.9%
mechanised moulding 13.0–14.5% 15.0% 4.3–20.7% 11.8–50.4%
manual moulding 2.5% 5.0% 2.6–14.4% 5.0–21.3%
reasons for excessive downtime include:
a) mechanical and electrical stoppages;b) waiting periods and delays for metal or sand;c) a high number of pattern changes;d) operational and/or organisational inefficiencies;e) poor scheduling.
to improve kPi 2.1, “downtime (moulding):”
a) instigate a systematic approach to identify the main causes of downtime: � investigate stoppage times by cause;� identify incidences of high or frequent stoppage and rectify these;� structure and classify the reasons for downtime, in terms of:
– equipment failures;– inadequate support services (waiting for metal, sand, cores, etc.);– organisational shortcomings (scheduling, pattern changes, etc.);– inadequate management control.
b) implement and support a recognised maintenance scheme to reduce breakdowns:
� define maintenance strategy in terms of:– targeted equipment;– preventive maintenance;– monitoring of the condition of plant and equipment;
� retain adequate spare parts in storage to support maintenance strategy; � ensure engineering staff are adequately trained to maintain the specific foundry
equipment in use.c) ensure adequate supplies of metal, sand, and cores to moulding lines:� organise the production process in supply departments;� eliminate bottlenecks by further investment in capacity in supply departments.d) Reduce the impact of pattern change through improved production scheduling.e) ensure employees do not impact on moulding line performance:� ensure adequate staffing levels and ensure personnel are fully trained, with the
correct professional attitude.
Foundries with higher levels of downtime tend also to experience higher scrap rates.

3. BenchmarkinG study: key FindinGs
45resource efficiency in the Ferrous Foundry industry in russia: Benchmarking study
impact on the bottom line:
the major impact of reducing downtime (measured at the moulding line) is that more gross castings can be produced within the same period of time, resulting in:� improved labour efficiency, due to:
– the workforce of the plant being available for (and committed to) continuous production, and avoiding “non-productive waiting” caused by downtime;
– the avoidance of downtime at the moulding line resulting in the elimination of bottlenecks in other areas (e.g., at the melt shop, core shop, quality checks, logistics, etc.);
– the avoidance of bottlenecks leading to better capacity utilisation, since the moulding line is usually the decisive capacity in this respect (other bottlenecks having been eliminated), and the avoidance of downtime here ensures better capacity utilisation and no wastage of correlating equipment costs.
1
4 5
2
6
37
3.2.2.2 improving kPi 2.2, “Slow running” (moulding)
comparative results for KPi no. 2.2, “slow running”
Factor europe russia
Best practice (BP) 1.0 1.27
average practice 1.0 5.32
BP 6.5%
average 30.3%
BP 5.1%
average 5.7%
0%
r F
Е u
50%
this KPi monitors the production time lost through the operation of a moulding facility below design capacity or calculated output, expressed as an equivalent percentage of the net operating time.
the impact of reducing slow running in foundry is as follows.� More gross castings are produced over the same period of time, resulting in:
– improved labour productivity;– better capacity utilisation.
the losses connected to slow running vary:� in accordance with moulding technology:
– the manual moulding rate is controlled by people – and production rates can therefore fall below standard relatively easily;
– in mechanised and automatic plants the moulding speed is machine-controlled but can be stopped or slowed by personnel;

46 resource efficiency in the Ferrous Foundry industry in russia: Benchmarking study
reasons for excessive slow running include:
a) difficulty in casting to mould in normal machine cycle time;b) a series of small stoppages occurring and not recorded as downtime;c) individual operations not synchronised with moulding operations; d) long pouring times for very heavy castings;e) poor supervision.
to improve kPi no. 2.2, “Slow running” (moulding):
a) Monitor any incidences of slow running, investigate the reasons for this, and rectify them.
b) among the large variety of solutions that may come to light, three categories will be evident:
� organisational improvements which can be influenced by management, such as: – the unauthorised reduction of moulding speed, or stoppages by personnel;– downtime not recorded as such;
� production restrictions which usually cannot be improved without investment, such as:– moulding and core setting not possible within machine cycle time;– long pouring times for heavy box weights;
� inadequate supervision:– in which case it is important to ensure employees carry out the required
operations within stipulated time periods (particularly in manual moulding).
impact on the bottom line.
as with KPi no.2.1, the main impact of reducing the losses caused by slow running at the moulding line is that more gross castings can be produced within the same amount of time. this results in:� improved labour productivity, since reduced productivity on the moulding line can
have implications throughout the production chain; � better capacity utilisation, because capacity utilisation on the moulding line is
kPi 2.2 “Slow running” (moulding)
eurOPe ruSSia
Best practice average Best practice average
automatic moulding 0.0–5.6% 0.0–6.0% 0.0–24.3% 6.5–60.2%
mechanised moulding 4.5–6.4% 5.0–7.0% 0.0–12.7% 11.0–27.3%
manual moulding 10.1% 12.5% 0.0–11.4% 8.4–39.8%
� within automatic and mechanised moulding – differences in performance relate to the type of moulding process:– high-pressure boxed (green sand);– flaskless vertically parted (green sand);– mechanised pattern flow (chemically bonded/no bake);
� in accordance with production parameters, affecting both mechanised and automatic lines, including: – core setting requirements;– casting cooling requirements;– residual stresses;– pouring rate.
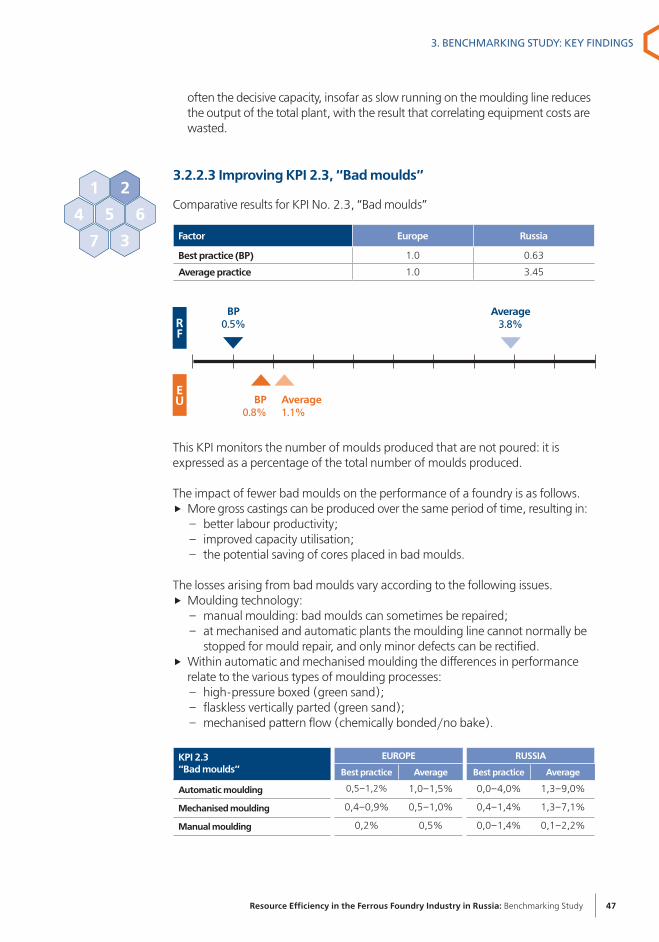
3. BenchmarkinG study: key FindinGs
47resource efficiency in the Ferrous Foundry industry in russia: Benchmarking study
often the decisive capacity, insofar as slow running on the moulding line reduces the output of the total plant, with the result that correlating equipment costs are wasted.
1
4 5
2
6
37
3.2.2.3 improving kPi 2.3, “Bad moulds”
comparative results for KPi no. 2.3, “Bad moulds”
this KPi monitors the number of moulds produced that are not poured: it is expressed as a percentage of the total number of moulds produced.
the impact of fewer bad moulds on the performance of a foundry is as follows.� More gross castings can be produced over the same period of time, resulting in:
– better labour productivity; – improved capacity utilisation;– the potential saving of cores placed in bad moulds.
the losses arising from bad moulds vary according to the following issues.� Moulding technology:
– manual moulding: bad moulds can sometimes be repaired;– at mechanised and automatic plants the moulding line cannot normally be
stopped for mould repair, and only minor defects can be rectified.� Within automatic and mechanised moulding the differences in performance
relate to the various types of moulding processes:– high-pressure boxed (green sand);– flaskless vertically parted (green sand);– mechanised pattern flow (chemically bonded/no bake).
Factor europe russia
Best practice (BP) 1.0 0.63
average practice 1.0 3.45
BP 0.8%
average 1.1%
r F
Е u
BP 0.5%
average 3.8%
kPi 2.3 “Bad moulds”
eurOPe ruSSia
Best practice average Best practice average
automatic moulding 0,5–1,2% 1,0–1,5% 0,0–4,0% 1,3–9,0%
mechanised moulding 0,4–0,9% 0,5–1,0% 0,4–1,4% 1,3–7,1%
manual moulding 0,2% 0,5% 0,0–1,4% 0,1–2,2%

48 resource efficiency in the Ferrous Foundry industry in russia: Benchmarking study
reasons for excessive bad moulds include:
a) the condition of the sand used;b) the condition of the patterns used;c) problems in moulding machine alignment;d) non-poured moulds.
to improve kPi 2.3, “Bad moulds”:
a) ensure appropriate sand conditions:� monitor and investigate appropriate sand properties and adjust to required level.
b) ensure pattern equipment and tooling are properly maintained:� check the condition of pattern equipment:
– check pattern and tooling dimensions;– check pattern equipment and tooling for damage;– check curves and radii for undercuts;– polish and clean pattern equipment;
� instigate a comprehensive procedure for the inspection of pattern equipment and tooling:– after every production all pattern equipment, core boxes, and tooling must be
cleaned, polished, and checked;– dimensional checks should be carried out on pattern equipment, and castings
produced on a regular basis (in line with customer requirements);� improve the design and construction of tooling:
– ensure appropriate core print fit, radii, draft angle, etc.;– ensure appropriate tooling relative to production volumes.
c) ensure correct moulding machine alignment:� measure the position of the pattern plate bolster to the squeeze plate;� measure the position of the pattern plate relative to the mould box closure
system (check castings for mismatch);� check the stripping action of the pattern, relative to the bolster;� for automatic moulding lines, implement frequent checks of test pieces;� rectify and adjust the moulding line accordingly.
d) avoid producing moulds which are not poured.
impact on the bottom line.
again, as with KPi no. 2.1 and KPi no. 2.2, the major impact of reducing the frequency of bad moulds will be in making possible the production of more gross castings during the same period of time. other benefits include:� improved labour productivity, since greater productivity on the moulding line
(due to fewer bad moulds) will ensure production is maintained at the intended output levels;
� improved capacity utilisation, because capacity utilisation on the moulding line is often the decisive capacity (since other bottlenecks are assumed to have been eliminated): reducing the production of bad moulds here will reduce waste in correlating equipment costs and wasted core.

3. BenchmarkinG study: key FindinGs
49resource efficiency in the Ferrous Foundry industry in russia: Benchmarking study
operational efficiency at Russian foundries currently runs at only
50 percent of capacity.

50 resource efficiency in the Ferrous Foundry industry in russia: Benchmarking study
3.2.3 totaL effectiVe eQuiPMent PeRfoRMance (teeP), “caPacity utiLisation”1
4 5
2
6
37
comparative results for KPi no. 3, “total effective equipment performance” (teeP)
Factor europe russia
Best practice (BP) 1.0 0.68
average practice 1.0 0.47
BP 63.9%
average 53.5%
0%
r F
Е u
100%
BP 43.6%
average 25.2%
total effective equipment performance (teeP) measures overall equipment effectiveness (oee) in terms of calendar hours – i.e., 24 hours per day, 365 days per year. total effective equipment performance per annum is expressed as a percentage of total plant capacity, assuming operation for 24 hours per day, 365 days per year.
improving a foundry’s teeP will result in:� a better return on overhead costs;� more effective utilisation of capital employed.
total effective equipment performance varies in accordance with various factors.� Moulding technology:
– the higher the capital investment, the greater the capacity utilisation required. � in automatic and mechanised moulding, differences in teeP in connection with
oee performance relate to various types of moulding processes:– high-pressure boxed (green sand);– flaskless vertically parted (green sand);– mechanised pattern flow (chemically bonded/no bake);
Reasons for low teeP include:� a low level of oee (KPi no. 2, “Production efficiency”); � insufficient orders;� limited access to electrical power;� excessively high electricity tariffs during peak hours.
kPi no. 3 “teeP”
eurOPe ruSSia
Best practice average Best practice average
automatic moulding 70.7–78.6% 57.5–63.1% 25.3–56.0% 16.3–28.4%
mechanised moulding 51.1–53.2% 46.0–48.0% 21.4–74.4% 17.7–53.7%
manual moulding 36.7–37.7% 32.8–33.7% 22.0–52.5% 14.8–49.0%

3. BenchmarkinG study: key FindinGs
51resource efficiency in the Ferrous Foundry industry in russia: Benchmarking study
to improve kPi 3, “teeP:”
total effective equipment performance is driven by loading, multiplied by oee. since “loading” (the percentage of total calendar time that is actually scheduled for operation) will usually be limited by the orders a foundry can produce, three scenarios need to be considered, as follows.� if a foundry is not subject to any limitation in respect of orders (such
that the foundry could produce maximum volumes within its existing installed capacity and operational performance standards), then:– eliminate all technical bottlenecks that reduce capacity (e.g., limitations in
power supply, ancillary departments, etc.);– restructure the organisation and the workforce to operate at maximum
capacity: for example, increase the working schedule from two shifts (i.e., in operation for 16 hours a day) to three shifts (in operation 24 hours per day), and from five days per week to seven;
– increase oee (see KPi 2, “Production efficiency”).
�if a foundry is suffering from insufficient orders, take measures to increase these:– with existing customers, through the development of new products (this
may require investment in training and skills); – with new customers, through the production and sale of existing products
(improve skills in sales and marketing for domestic markets).
� if a foundry is currently seeking new customers in export markets improve skills in operations with regard to customer requirement standards, and improve sales and marketing skills to develop international business.
� if there is no intention of increasing sales volumes at all, then downsize (after due consideration of all financial implications). this will ultimately result in a more competitive plant, operating at a higher level of capacity utilisation:– through the removal of excess capacity at all levels of the plant (or group of
plants), including moulding, melting, workforce, overheads, etc.;– as a result of consolidation within the foundry sector (through the disposal
and outsourcing of foundries within vertically integrated enterprises, and through mergers and acquisitions, etc.), as has happened and continues to occur throughout europe.
impact on the bottom line.
the major impact of improved teeP is: � better utilisation of capital employed – the capital invested in allowing the
foundry to operate at the intended capacity should be utilised to the greatest possible extent, to ensure that the cost of such capital is not wasted;
� better utilisation of overheads – better capacity utilisation need not, necessarily, involve significantly higher overheads if the additional volumes produced are within an existing product category.
improved capacity utilisation is dependent on the identifica-tion of certain critical factors:
1) if a foundry is subject to any limitations in respect of orders, then eliminate all technical bot-tlenecks that reduce capac-ity;
2) restructure the organisa-tion and the workforce to operate at maximum capacity;
3) if the foun-dry is suffering from insuf-ficient orders then take measures to increase these;
4) if there is no likelihood of increasing sales volumes at all, then downsize by cutting out excess capacity at all levels.

52 resource efficiency in the Ferrous Foundry industry in russia: Benchmarking study
Matching the efficiency of the best-performing eu plants would save enough power to power a typical Russian city of
1.5 millionpeople.

3. BenchmarkinG study: key FindinGs
53resource efficiency in the Ferrous Foundry industry in russia: Benchmarking study
3.2.4 eneRGy consuMPtion1
4 5
2
6
37
as well as raw materials, energy constitutes one of the most important cost factors in a foundry’s operations: the energy involved in melting can often be a factor in limiting capacity.� KPi 4.1 concerns “energy consumption in melting” (“Melting efficiency”),
expressed in terms of the energy necessary to produce one tonne of melt (kWh/tonne melted).
� KPi 4.2 concerns “energy consumption in foundry,” expressed in terms of the energy necessary to produce one tonne of good-quality castings (kWh/tonne of good-quality castings).
1
4 5
2
6
37
3.2.4.1 improving kPi 4.1, ”energy consumption in melting” (“melting efficiency”)
comparative results for KPi no. 4.1, “energy consumption in melting”
this KPi monitors the furnace power consumption (kWh) divided by the tonnage of metallic material charged to the furnaces. increasing melting efficiency has the effect of reducing energy costs.
energy consumption varies in accordance with:� induction melting:
– iron castings: by alloy type and manufacturing process;– steel castings: by alloy type;
� arc melting:– iron castings: no longer produced by arc melting in european foundries;– steel castings: arc furnaces are the most common furnace for melting steel.
Factor europe russia
Best practice (BP) 1.0 1.43
average practice 1.0 2.08
BP 544 kWh
average 560 kWh
0
r F
Е u
1000 кВтч
BP 779 kWh
average 1164 kWh

54 resource efficiency in the Ferrous Foundry industry in russia: Benchmarking study
kPi 4.1 “energy consumption in melting” (kWh/per tonne melted)
eurOPe ruSSia
Best practice average Best practice averageinduction melting– iron 540–620 550–625 543–1478 893–1447
– Steel 580–700 675–800arc melting– iron – –
– Steel 5001),2) 5251),2) 645–884 859–15641) excludes any post-tap refining.2) does not involve the use of oxygen.
Reasons for low energy efficiency in melting include: a) holding liquid metal for long periods of time;b) electrically inefficient and old equipment;c) outdated processes for operating the melting process (specific to arc furnaces);d) low power density of some furnaces, causing long tap-to-tap times (specific to
arc furnaces).
to improve kPi 4.1 “energy consumption in melting:”
a) avoid holding and treating metal for long periods of time in melting furnaces:� review melting procedure.
b) Replace old, inefficient, or inappropriate melting equipment:� induction furnaces with high electrical efficiency should be installed;� arc furnaces should have a high power density, with oxygen injection;� check the efficiency and suitability of cupola furnaces on the basis of a
comprehensive feasibility analysis, covering all aspects of operating costs and potential implications.
impact on the bottom line.
the key impact of reducing energy consumption in melting is lower energy costs.
example:assume an “average-performing” multi-product foundry in Russia wishes to check the optimum impact of matching european best practice. since the melt shop is by far the largest energy consumer in a foundry, any initiatives on energy efficiency should be concentrate on the melting process and equipment.
kPi actual performance kPi target performance kPi room for improvement
1164 kWh/tonne 544 kWh/tonne 620 kWh/tonne = 53.3%
the basic cost structure data of the individual enterprise are:� energy costs as a proportion of total costs: 13.4%
– energy costs as a proportion of total melting energy costs 70.0%
an improvement of 53.3 percent in KPi no. 4.1, “energy consumption in melting” will equate to 5.0 percent of total plant costs per tonne of good castings:� energy costs savings: 0.533 x 0.134 x 0.70 = 0.0499 = 5.0%

3. BenchmarkinG study: key FindinGs
55resource efficiency in the Ferrous Foundry industry in russia: Benchmarking study
for each tonne of good-quality castings they produce, Russian foundries use
three times more energythan those in europe.

56 resource efficiency in the Ferrous Foundry industry in russia: Benchmarking study
1
4 5
2
6
37
3.2.4.2 improving kPi 4.2, “energy consumption in foundry”
comparative results for KPi no. 4.2, “energy consumption in foundry”
this KPi monitors total energy consumption (kWh) across various foundry departments, divided by the tonnage of net good castings produced. decreasing energy consumption in a foundry has the effect of reducing energy costs. energy consumption within a foundry varies in accordance with:� the material, alloys, and processes involved in melting; � other additional factors, including:
– variations in process yield;– variations in heat treatment operations.
Factor europe russia
Best practice (BP) 1.0 2.53
average practice 1.0 3.10
BP 1147
average 1453
0
r F
Е u
5000
BP 3155
average 4506
kPi 4.2 “energy consumption in foundry” (kWh/tonne of good-quality castings)
eurOPe ruSSia
Best practice average Best practice average
grey iron 1000–1305 1169–1483 1521–4533 2939–5428
ductile iron 1284–1566 1744–1758 2344–3539 3322–5016
Steel 1165–2088 1391–2676 2874–6996 3285–7464
reasons for high total energy consumption include:
a) inefficient melting plant;b) extensive heat treatment cycles;c) inefficient heating and ventilation systems;d) insufficient awareness of energy efficiency.
to improve kPi 4.2, “energy consumption in foundry:”
a) Refer to section 3.2.4.1 (above) on improving KPi 4.1, “energy consumption in melting;”
b) check the condition and efficiency of heating, ventilation, and extraction systems, and rectify as necessary;
c) inform and educate employees on energy efficiency and conservation.

3. BenchmarkinG study: key FindinGs
57resource efficiency in the Ferrous Foundry industry in russia: Benchmarking study
PrOceSS yieLd
mOLten metaL handLing OrganiSatiOn & OPeratiOn
ener
gy
eFF
icie
ncy
PLa
n
meLting equiPment (total Plant)
Box yield
furnace downtime shift Patterns & Line utilisation
charge Materialcompressed air
scrap
tapping Process Production Planning
additions & alloysMaintenance
spillage & Pigging
temperature Losses Product Pallet
charging Procedureequip. controls
Pre-heatingconveyors
Melting Losses
Refractory scheduling
Pre-heating operation
Melting Procedureextractions
sinteringalternativesextraction
impact on the bottom line.
the key impact of reducing energy consumption is reduced energy costs.
example:assume an “average-performing” multi-product foundry in Russia wishes to check the optimum impact of matching european best practice. energy consumption in the melt shop should have been checked as a first step, but the efficiency gap remains high and total plant-wide energy consumption must now be checked.
kPi actual performance kPi target performance kPi room for improvement
4506 kWh/tonne 1247 kWh/tonne 3259 kWh/tonne = 72.3%
the basic cost structure data of the individual enterprise are:� energy costs as a proportion of total costs: 13.4%
– energy costs as a proportion of plant-wide total energy costs: 95.0%
the total cost savings achievable by reducing energy consumption across the total plant by 72.3 percent will be 9.2 percent of total plant costs per tonne of good castings:� energy costs savings: 0.723 x 0.134 x 0,95 = 0.0920 = 9.2%
further to the potential for cost savings in the melting process (i.e., of five percent), a further potential saving of 4.2 percent is identified throughout the remainder of the plant.
Figure 3.1: kPi 4.2, “energy cOnSumPtiOn in FOundry”

58 resource efficiency in the Ferrous Foundry industry in russia: Benchmarking study
for each tonne of good-quality castings they produce, Russian foundries use, on average, average
3.6 times moresand than their european peers.

3. BenchmarkinG study: key FindinGs
59resource efficiency in the Ferrous Foundry industry in russia: Benchmarking study
3.2.5 fResh sand consuMPtion 1
4 5
2
6
37
the sand used in making moulds should be recycled and regenerated as far as possible. a perfectly designed and effectively operating sand regeneration plant will reduce the costs of buying sand, and will also improve the quality of castings.
� KPi 5.1, “fresh sand consumption” monitors the weight of new (fresh) sand used, divided by the volume (tonnes) of net good-quality castings produced. this indicator includes the sand used in moulding as well as sand used in the production of core.
� KPi 5.2, “Rate of sand regeneration” monitors the percentage of sand that is re-used in each moulding cycle (expressed as an average of all moulding cycles included in the sampling period).
Reducing the consumption of fresh sand has the effect of reducing the costs of raw materials, as well as the costs of specialist services and facilities for the dumping of sand waste.
1
4 5
2
6
37
3.2.5.1 improving kPi 5.1, “Fresh sand consumption”
comparative results for KPi no. 5.1, “fresh sand consumption”
Factor europe russia
Best practice (BP) 1.0 1.87
average practice 1.0 3.59
BP 312
average 342
0
r F
Е u
1000 kg/t
BP 583
average 1250
this KPi monitors the weight of new (fresh) sand used, divided by the volume (tonnes) of net good-quality castings produced. this indicator includes sand used in moulding as well as sand used in the production of core.
Reducing the consumption of fresh sand has the effect of reducing material costs.
consumption of fresh sand varies in accordance with: � product type, and the extent and complexity of core-making requirements;� the extent of recovery of core material before shake out (e.g., engine blocks).

60 resource efficiency in the Ferrous Foundry industry in russia: Benchmarking study
1
4 5
2
6
37
3.2.5.2 improving kPi 5.2, “Sand regeneration”
comparative results for KPi no. 5.2, “sand regeneration”
kPi 5.1 “Fresh Sand consumption” (tonne sand used/tonne of core produced)
eurOPe ruSSia
Best practice average Best practice average
grey iron 1.60–0.87 0.19–0.98 0.22–1.22 0.52–2.60
ductile iron 0.17–0.37 0.20–0.41 0.25–0.51 0.33–1.10
Steel 0.17–0.87 0.19–0.96 0.24–4.37 0.51–5.39
Reasons for excessive consumption of new sand include:a) large or intensive core-making requirements;b) a low sand-to-metal ratio, causing high sand burn-out;c) poor-quality sand (roundness, size distribution, refractoriness, ph, etc.).
to improve kPi 5.1, “Fresh sand consumption:”
а) Where possible, use hollow and/or back-filled cores.b) improve sand-to-metal ratios to reduce high sand burn-out. note: increasing sand-to-metal ratios (and hence improving rates of sand consumption) should
not be carried out at the expense of reducing the box yield and, subsequently, the process yield.
c) improve the quality of sand purchased.d) improve system sand properties (compactability, shatter, etc.): refer to process
control measures elsewhere in this document.e) Review shake-out operations:� check the separation of core sand if possible;� ensure system sand is not carried out with castings;� check all processes to insure sand is not lost at shake-out.
impact on the bottom line.
Reducing fresh sand consumption reduces the costs of raw materials.
Factor europe russia
Best practice (BP) 1.0 1.00
average practice 1.0 0.95
BP 95.9%
average 94%
80%
r F
Е u
100%
BP 95.6%
average 89.2%
this KPi monitors the percentage of sand that is re-used in each moulding cycle (expressed as an average of all moulding cycles included in the sampling period).

3. BenchmarkinG study: key FindinGs
61resource efficiency in the Ferrous Foundry industry in russia: Benchmarking study
sand regeneration should be carried out at an optimum level for individual products and processes, bearing in mind certain factors, including the following:� core intensity; � the addition of new sand. additions must be made at a minimum of 10
percent of the metal weight if the appropriate weight of cores is not added; if this is not carried out the system sand will become unusable;
� increasing the rate of sand generation does not necessarily represent an improvement in performance.
the rate of sand regeneration differs in accordance with:� the type of system sand used (green sand or chemical-bonded);� the extent of core requirements and complexity;� the moulding process.
kPi 5.2 “Sand regeneration”
eurOPe ruSSia
Best practice average Best practice average
automatic moulding 92–98% 91–97.5% 93.0–98.4% 91.8–96.6%
mechanised moulding 88–98% 84–95% 84.2–97.6% 74.7–93.6%
manual moulding 84–98% 82–95% 82.2–95.3% 79.3–91.8%
Reasons for low rates of sand regeneration include:a) high core usage;b) high burn-out levels;c) poor sand quality;d) the choice of resin binder system (e.g., for the same volume of base sand a
furan binder will reclaim at a higher rate than an alkaline phenolic system);e) the surface requirement of the casting, resulting in the need for a separate
facing sand.
to improve kPi 5.2, “Sand regeneration:”
a) Regarding burn-out levels and sand quality issues: refer to section 3.2.5.1 on KPi 5.1, “fresh sand consumption,” above.
b) Review the selected binder system in chemical-bonded plants:� investigate alternative binder systems that have greater potential for
reclamation; � mixed binder systems tend to have greater potential for reclamation than
mono-systems.
c) the same factors that reduce new sand consumption will also improve sand regeneration levels (refer to section 3.2.5.1 on KPi 5.1, “fresh sand consumption,” above.
impact on the bottom line.
the better a foundry’s sand regeneration the less new sand must be bought.

62 resource efficiency in the Ferrous Foundry industry in russia: Benchmarking study
Russian foundries use, on average,
161 times more fresh water than those in europe.
Matching eu standards in water efficiency would save enough to supply more than
3.5 million Russian citizens for one year.

3. BenchmarkinG study: key FindinGs
63resource efficiency in the Ferrous Foundry industry in russia: Benchmarking study
3.2.6 fResh WateR consuMPtion1
4 5
2
6
37
comparative results for KPi no. 6, “fresh water consumption”
KPi 6, “fresh water consumption” monitors the fresh water consumed per unit of product (e.g., per tonne of net good castings produced).
Reducing fresh water consumption has the effect of reducing utility and service charges for water.
Volumes of fresh water consumption vary in accordance with:� the moulding medium used (green sand, chemical-bonded sand, etc.);� systems and cooling requirements;� equipment cooling requirements;� heat treatment cycles that have a quench requirement.
Factor europe russia
Best practice (BP) 1.0 21.38
average practice 1.0 161.00
BP 17.10
average 144.89
BP 0.76
average 0.90
0
r F
Е u
200 m3
Reasons for high levels of fresh water consumption include:a) heat treatment cycles involving water quench;b) excessive green sand temperatures requiring high cooling rates by evaporation;c) process water for green sand systems;d) general evaporative loss from cooling systems;e) low efficiency of cooling systems;f) the use of water-based dust cleaning systems.
kPi 6 “Fresh water consumption” m3/tonne good castings
eurOPe ruSSia
Best practice average Best practice average
grey iron 0.60–1.10 0.78–1.25 2.5–25.5 5.0–218.7
ductile iron 0.60–0.81 0.71–1.06 6.4–59.2 54.7–435.6
Steel 0.60–1.50 0.76–1.77 2.5–27.3 10.6–234.1

64 resource efficiency in the Ferrous Foundry industry in russia: Benchmarking study
to improve kPi 6, “Fresh water consumption:”
a) some reasons for high levels of water consumption cannot be changed:� heat treatment is necessary to reach required properties;� in areas of high ambient temperature/humidity more water is required for
evaporative cooling. b) Reduce sand cooling requirements by reducing sand temperature:� increase the storage volume of sand in the sand system, thus increasing the dwell
time before sand re-use and thereby reducing cooling requirements; this may also have the additional benefit of improving the overall sand quality;
� reduce sand-to-metal ratios, thereby reducing sand temperature and thus reducing cooling requirements.
note: increasing sand-to metal ratios (and hence improving rates of sand consumption) should not be carried out at the expense of reducing the box yield and, subsequently, the process yield.
c) Maintain correct sand properties (particularly moisture/clay relationships) as this will avoid producing sand that is too wet.
d) Reduce cooling water requirements for ancillary plant: � ensure all cooling systems are operating effectively, and replace defective
systems;� replace water-based dust collection systems with dry-bag filters (this
replacement will be necessary at some point in any case, to meet environmental standards).
e) Where possible, replace fresh water with collected surface water (rain water) instead of taking water from the distribution network.
impact on the bottom line.
the financial impact of reducing fresh water consumption is lower utility and supply costs.

3. BenchmarkinG study: key FindinGs
65resource efficiency in the Ferrous Foundry industry in russia: Benchmarking study
it takes Russian foundries
3.6 times more man-hours to produce the same volume of quality castings as their european peers.

66 resource efficiency in the Ferrous Foundry industry in russia: Benchmarking study
3.2.7 LaBouR PRoductiVity1
4 5
2
6
37
comparative results for KPi no. 7, “Labour productivity”
KPi 7, “Labour productivity” monitors the total number of man-hours worked (excluding management and supervisory hours) divided by the tonnage of net good castings produced.
improving labour productivity has the effect of:� reducing direct labour costs;� potentially reducing certain related indirect overhead costs.
Labour productivity varies in accordance with:� manufacturing processes (automatic, mechanised, or manual);� the volumes produced (volume regression effect);� the degree of automation (e.g., block grinder, rotary grinder for discs, etc.);� the extent of process requirements on casting type (e.g., the greater degree of
processing involved in steel castings).
Factor europe russia
Best practice (BP) 1.0 1.77
average practice 1.0 3.58
BP 15.1
average 21.0
0
r F
Е u
100
BP 26.7
average 75.2
kPi 7 “Labour productivity” (man-hours/tonne of good castings)
eurOPe ruSSia
Best practice average Best practice average
automatic moulding 5–25 10–34 19.7–89.8 36.2–173.9
mechanised moulding 12–27 19–37 16.1–101.7 31.9–162.7
manual moulding 22–30 24–40 24.0–114.2 52.9–234.7
Reasons for low labour productivity include:a) over-manning;b) low standards of automation;c) poor management of certain business processes and operational practices;d) poor performance levels of production equipment.

3. BenchmarkinG study: key FindinGs
67resource efficiency in the Ferrous Foundry industry in russia: Benchmarking study
to improve kPi 7, “Labour productivity:”a) conduct a full review of manning levels:� identify and clarify the roles and responsibilities of all personnel (both on the
shop floor, and in management);� establish clear staffing levels for each department within the plant:
– on the basis of existing equipment;– on the basis of increased automation following investment.
b) develop a new and improved manning strategy:� reduce manpower consistent with a) above;� where manpower reductions are not possible instigate an investment
programme to increase automation levels (e.g., through the use of materials-handling equipment, etc.);
� conduct training sessions (for shop floor employees and management) in order to familiarise the workforce with any necessary changes in working practices.
c) Before investing in greater automation existing equipment should be made to operate more effectively wherever possible.
impact on the bottom line.the major impacts of improved labour productivity are:� lower direct labour costs;� potentially lower related indirect overhead costs.
example:assume an “average-performing” multi-product foundry in Russia wishes to check the optimum impact of matching european best practice in labour productivity.
kPi actual performance kPi target performance kPi room for improvement
75.2 man-hours/tonne castings 15.1 man-hours/tonne castings 60.1 man-hours/t = 80.0%
the basic cost structure data of the individual enterprise are:� labour costs as a proportion of total costs: 21.4%
– direct labour hours as a proportion of total man-hours 70.0%� overhead costs as a proportion of total costs 12.8%
– overhead costs related to workforce levels 30.0%
the total cost savings achieved through improving labour productivity by 80.0 percent will be 15.2 percent of total plant costs per tonne of good castings:
� labour costs savings: 0.800 x 0.214 x 0,70 = 0.1198 = 12.1%� overhead cost savings: 0.800 x 0.128 x 0.30 = 0.0307 = 3.1%

68 resource efficiency in the Ferrous Foundry industry in russia: Benchmarking study
Matching european best practice could improve the profitability of individual foundries by
15 percent and reduce costs by up to
ruB100 billion ($3.3 billion) for a sector at large per year.

3. BenchmarkinG study: key FindinGs
69resource efficiency in the Ferrous Foundry industry in russia: Benchmarking study
3.3 the BOttOm-Line BeneFitS OF Better reSOurce eFFiciency
the financial implications of improving KPis have been estimated on the following basis.
1) Benchmarking survey questionnaires returned by Russian ferrous foundries were used to estimate the total annual production of ferrous castings. overall Russian cost structure data were calculated on the basis of the aggregated weighted average of all responses, as follows:
Material costs: 45.2%energy costs: 13.4%Labour costs (direct and indirect labour): 21.4%equipment costs (depreciation and maintenance): 7.2%overhead costs (including all other costs) 12.8%total 100.0%
2) a project database supplied by GeMco Knight Wendling Gmbh was used
to estimate the proportional cost of specific items within total cost categories (this database having been developed on the basis of GeMco engineers B.V./Knight Wendling Gmbh’s prior experience and projects), as follows:
any individual foundry will use its own cost structure and cost categories for calculating the financial impact of improved performance against specific operational KPis.
cost category
Specific cost item item cost as a proportion of category costs
material costs
Metal 70% of material costs
Metal lost through pig and spillage (i.e., the proportion not possible to recycle)
10% of pig and spillage cannot be recycled
sand (new sand) 2% of material costs
Water (total fresh water) 1% of material costs
energy costsenergy for melting 70% of energy costs
energy for plant operations 95% of energy costs
Labour costs
direct labour for melting and moulding 20% of labour costs
direct labour for finished casting 80% of labour costs
direct labour for running equipment 60% of labour costs
Labour directly related to productivity 70% of labour costs
equipment costs
equipment for melting, cores, and moulding 55% of equipment costs
equipment involved up to the detection of scrap castings 60% of equipment costs
Overhead costs
fixed costs for overheads designed for full capacity utilisation 100% of overhead costs
table 3.4: item cOStS aS a PrOPOrtiOn OF tOtaL categOry cOStS
Source: GeMco engineers B.V./Knight Wendling Gmbh (2010).

70 resource efficiency in the Ferrous Foundry industry in russia: Benchmarking study
Scope for cost reduction through improved performance
table 3.5 below illustrates the scope for improvement across all seven KPis, expressed in terms of potential cost reductions: calculated on the basis of the average performance of Russian foundries in comparison with european best practice.
scope for improvement is expressed as: RaV vs. eBP = 29%.
a typical (average) Russian foundry could reduce its costs (and improve its profitability) by as much as 29 percent of total costs by matching european best practice in various areas (survey sample results).
the potential savings achievable in financial terms through cost reductions of 29 percent can be calculated by multiplying this percentage against the total costs incurred in total volume castings production.
Figure 3.1: POtentiaL cOSt reductiOnS in FinanciaL termS
savings/profitoverheads/otherequipment costsLabour costsenergy costsMaterial costs
RaV actual Material Labourenergy equipment overheads Potential
12.8%
7.1%
21.4%
13.4%
45.2%
2.0%
9.2%
12.0%2.8%
3.1%
29.0%
9.7%
4.4%
9.4%
4.2%
43.3%
cost savings or additional profit
= 29.0%
Benchmarking ofaverage russian
performance (rav) against european best practice (eBP)
Source: GeMco engineers B.V./Knight Wendling Gmbh (2010).

3. BenchmarkinG study: key FindinGs
71resource efficiency in the Ferrous Foundry industry in russia: Benchmarking study
impa
ct o
f im
prov
emen
ts o
f kPi
nr.
1) –
nr.
7) b
ased
on
Surv
ey S
ampl
e re
sult
s
Sam
ple
resu
lts fo
r im
prov
e-m
ent o
f all
7 k
Pik
Pi -
>Pr
oces
s y
ield
n
r. 1)
Prod
uctio
n ef
fici
ency
Oee
nr.
2)te
eP
nr.
3)en
ergy
n
r. 4)
Sand
n
r. 5)
Wat
er
nr.
6)La
bour
n
r. 7)
Pote
ntia
l cha
nge
kPi
and
sub
-ind
icat
or -
>
melting Loss
Pig & Spillage
runners & risers
Scrap & rejects
downtime
Slow running
Bad moulds
Scrap & rejects
capacity utilisation
energy melting
energy Plant
Fresh Sand
Fresh Water
Labour Productivity
all improvements
Potential cost Structure per tonne including potential Savings
kPi
nr.
->1.
1)1.
2)1.
3)1.
4)2.
1)2.
2)2.
3)2.
4)3)
4.1)
4.2)
5)6)
7)1)
- 7
)
kPi
ra
V -
>4
.5%
3.3
%3
9.3
%6
.7%
22
.7%
30
.3%
3.8
%6
.7%
25
.2%
1.1
64
4.5
06
11
44
.97
5.2
kPi
eBP
->
1.9
%2
.4%
31
.5%
2.1
%1
1.9
%5
.1%
0.8
%2
.1%
63
.9%
54
41
.24
70
0.7
61
5.1
kPi
cha
nge
->-2
.6%
-0.9
%-7
.8%
-4.6
%-1
0.7
%-2
5.2
%-3
.0%
-4.6
%-3
8.8
%-5
3.3
%-7
2.3
%-7
5.0
%-9
9.5
%-8
0.0
%
cos
t str
uctu
rein
itial
chan
gech
ange
chan
gech
ange
chan
gech
ange
chan
gech
ange
chan
gech
ange
chan
gech
ange
chan
gech
ange
chan
geFi
na
L
Mat
eria
l cos
ts4
2.5
%7
0%
7%
2%
1%
-2.0
%4
3.3
%-0
.8%
-0.0
3%
-0.7
%-0
.4%
ener
gy c
osts
13
.4%
70
%7
0%
70
%7
0%
70
%9
5%
-9.2
%4
.2%
-0.2
%-0
.08
%-0
.7%
-0.4
%in
1.4
)-5
.0%
-2.7
%*
Labo
ur c
osts
21
.4%
20
%8
0%
60
%6
0%
60
%7
0%
-12
.0%
9.4
%-0
.3%
-0.8
%-1
.4%
-3.2
%-0
.4%
in 1
.4)
-5.9
%*
equi
pmen
t cos
ts7
.1%
55
%6
0%
55
%5
5%
55
%1
00
%-2
.8%
4.4
%-0
.3%
-0.2
%-0
.4%
-1.0
%-0
.1in
1.4
)-0
.7%
*
ove
rhea
d/o
ther
12
.8%
10
0%
30
%-3
.1%
9.7
%-5
.0%
1.9
%
tota
l pla
nt10
0%-4
.0%
-6.5
%-5
.7%
-7.7
%-0
.7%
-0.4
%-4
.0%
-29.
0%71
.0%
savi
ngs/
add.
pro
fit
*exc
l. ot
her
1.3
) –
2.4
)
*exc
l. 4
.1)
1.1
) –
1
.4)
*exc
l. ot
her 3
) 29
.0%
ca
Lcu
Lati
On
Pr
Oc
edu
re:
Po
tent
ial =
a x
B x
c
a =
KPi
cha
nge
(gap
bet
wee
n Ru
ssia
n av
erag
e pe
rfor
man
ce (
RaV
) an
d eu
rope
an b
est p
ract
ice
(eBP
))
K
Pi c
hang
e (t
arge
t) =
eBP
– R
aV
B =
cos
t cat
egor
y as
a p
ropo
rtio
n of
tota
l cos
ts
c =
rele
vant
pro
port
iona
l im
pact
on
cost
cat
egor
y
exa
mPL
e:
impa
ct o
f im
prov
ing
KPi
no.
1.1
, “M
eltin
g lo
ss:”
a =
KPi
cha
nge
= 1
.9%
– 4
.5%
= –
2.6
%
B =
mat
eria
l cos
ts a
s a
prop
ortio
n of
tota
l cos
ts =
45
.2%
c =
cos
t of m
etal
as
a pr
opor
tion
of m
ater
ial c
osts
=7
0%
Pote
ntia
l = a
x B
x c
=
-0.0
26
x 0
.45
2 x
0.7
0 =
-0
.00
82
= -
0.8
%
SOu
rc
eS:
KPi
dat
a an
d in
itial
cos
t str
uctu
re
sour
ced
from
ben
chm
ark
surv
ey
data
. oth
er d
ata
(rel
evan
t im
pact
on
cos
t str
uctu
re c
ompo
nent
s)
sour
ced
from
GeM
co
eng
inee
rs
B.V.
/Kni
ght W
endl
ing
Gm
bh
proj
ect s
ampl
es.
tabl
e 3.
5: S
cO
Pe F
Or
imPr
OV
emen
t a
cr
OSS
aLL
kPi
S

72 resource efficiency in the Ferrous Foundry industry in russia: Benchmarking study
highly competitive cost advantages – a good starting point
to date, Russian foundries have enjoyed highly competitive cost advantages in comparison with countries in western europe (for example, Germany).
Based on the assumption that the total production costs for Russian castings would be at current european market prices, total potential cost savings are equivalent to RuB100 billion ($3.3 billion) per year.
castings Production (tonnes, 2008)
market price* (eur/kg)
costs (eur billion)
costs (ruB billion)
39.23 ruB/eur
grey iron 3 070 000 0.80 2.5 96.3
ductile iron 1 830 000 1.30 2.4 93.3
Steel 1 200 000 3.50 4.2 164.8
total ruS 6 100 000 9.0 354.4
Potential savings 28.8% 2.6 102.1
* note: assumption of market price for this benchmarking exercise:– actual costs in Russia would be equal to eu market prices;– the market price is the average across all casting material groups (wide differentiation by type of product)
table 3.6: SamPLe caLcuLatiOn FOr ruSSian FOundrieS
Source: ifc, GeMco engineers B.V./Knight Wendling Gmbh (2010).
energy costs: 54% lowerGermany/Russia ratio: 2.2
Germany 0.109 $/kWh
russia 0.050 $/kWh
100%
45% 54%
table 3.7: eLectricity cOStS FOr induStriaL cLientS (2008)
Source: ifc, GeMco engineers B.V./Knight Wendling Gmbh (2010).
russia 8% 92%
Germany $37.59/hour
russia*
$2.93/hour
$8.80/hour
100%
23% 77%
Labour costs: 92% lowerGermany/Russia ratio (iMd): 12.8Germany/Russia ratio (GeMco): 4.3*
Source: ifc, GeMco engineers B.V./Knight Wendling Gmbh (2010).
table 3.8: LaBOur cOStS – tOtaL hOurLy cOmPenSatiOn FOr induStriaL WOrkerS (2007)
* note: GeMco/Knight Wendling Gmbh audits at foundries in Russia found labour costs at$8.8 0/hour = 77% lower.

3. BenchmarkinG study: key FindinGs
73resource efficiency in the Ferrous Foundry industry in russia: Benchmarking study
Figure 3.2 ruSSian FOundrieS are nOt caPitaLiSing On their cOmParatiVe cOSt adVantage
overhead (staff, services)
equipment (depr.+maint.)
Labour costs (dir.+indir.)
energy (utilities)
Material (scrap, other)
GeR cost level GeR (Rus) Material equipment energy Labour overhead. Rus (RaV)
-71%
-77%
+1.9
64.1
64.1
95.3
95.3
100
+4.1
61% lower cap. utilization
additional costs for lower performance (rus average vs. eu Best Practice)
remaining cost advantage
Problems: quality? design? distance? transport? reliable?
note: ger: sample cost index structure of a competitive ferrous foundry in Germany, producing iron castings for the automotive industry.ger (ruS): cost index structure if the German foundry could operate at Russian cost levels (energy, labour, overheads).Performance gaps: Russian average vs. european best practice.
Lower factor cost levels rus versus Ger
2% more metal 4 x sand 190 x water
3.6 x energy consumption
5.0 x labor per tonne
61% lower cap. utilization
+15.2
+9.5
+0.5
-54%
0
10
20
30
40
50
60
70
80
90
100
-36%
+31%
+5%
� there is little point in having an advantage in energy costs (with a ratio of 2.2) if melting consumption is 2.1 times european levels, and overall consumption 3.1 times higher; this represents a competitive disadvantage (benchmarks for average performance).
� there is little point in having an advantage in labour costs with a ratio of 4.3 if 3.6 times more people are employed; this represents only a marginal advantage (average).
� the advantages of low energy and labour costs are lost because of performance shortfalls which impact on many aspects of the cost structure (see figure 3.2, below). in this example the cost advantage equates to 4.7 percent – which is too low to compensate for other costs (such as freight, quality, long distance support, extra stocks, etc.).
as a result, while the benefits of low-cost energy, labour, and natural re-sources should, as indicated above, give russian found-ries a theoreti-cal competitive advantage in the order of 36 percent, poor resources management eliminates any price advan-tage.
table 3.9: OVerhead cOSt LeVeLS – remuneratiOn OF dePartment headS in SerVice PrOFeSSiOnS (2006)
Germany $79,433/year
russia $23,400/year
100%
29% 71%
specialist advisors/ services: 71% lower Germany/Russia ratio: 3.4
Source: ifc, GeMco engineers B.V./Knight Wendling Gmbh (2010).

74 resource efficiency in the Ferrous Foundry industry in russia: Benchmarking study
despite the prices of major resources being as much as
half those in europe, inefficient resources management is costing Russian foundries any competitive advantage.
Producing one tonne of good-quality castings, for example, takes
three times more energy than in europe.

3. BenchmarkinG study: key FindinGs
75resource efficiency in the Ferrous Foundry industry in russia: Benchmarking study
3.4 techniqueS and technOLOgieS uSed in ruSSian FerrOuS FOundrieS the survey included questions on the technology and management techniques used in Russian foundries.
manufacturing technology – findings:
� Russian foundries exhibit a low level of specialisation – in sharp contrast to european enterprises, which have been forced to specialise in order to remain competitive.
– ninety two percent of Russian foundries produce items in more than one product category:
Product categories one category two to four categories five or more categories companies 8% 58% 33%
– Most of the Russian foundries participating in the survey process more than one category of materials, and more than half of all foundries produce steel castings:
materials one material two materials three materials companies 33% 54% 13% combinations only iron iron and steel only steel companies 42% 46% 13%
– almost half of the Russian foundries surveyed apply more than one technology:
technologies one technology two technologies three or more techn. Melting: 58% 29% 13% Moulds: 63% 29% 8% Moulding: 46% 38% 17% core production: 42% 50% 8%
� Specific observations regarding manufacturing technology include the following:– multiple technologies are applied to serve multiple product mix categories;– the data indicate high utilisation of arc furnace technology: the percentage
of arc furnaces is higher than the it would have been needed to produce the current volume of steel castings;
– there is a high requirement for robust moulds (chemical-bonded, dry sand, permanent, etc.);
– Russian foundries demonstrate a low level of automation: only 34 percent are equipped with automatic moulding lines;
– there is a high incidence of outdated technology: many Russian foundries still use out-of-date techniques which are inaccurate, inappropriate, less efficient, and lead to the production of lower quality castings. these include: - moulding using sodium silicate;- core-making using oil sand;- multiple charging of arc furnaces and extended melting cycles;- insufficient post-melting metal treatment facilities (e.g., aod).
� Specific observations regarding management techniques include the following:– the percentage of companies familiar with techniques to improve
performance is low;
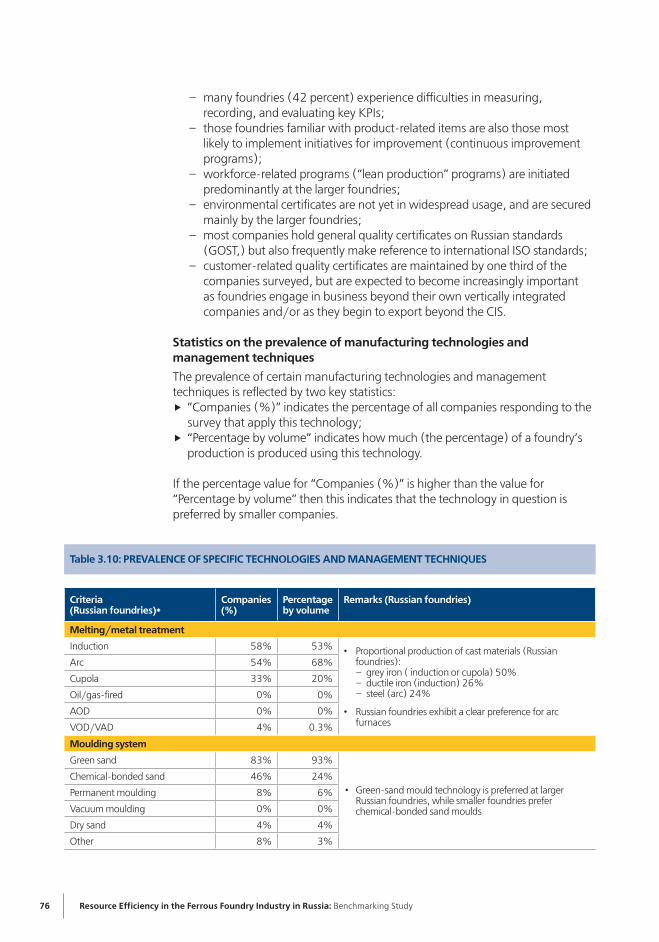
76 resource efficiency in the Ferrous Foundry industry in russia: Benchmarking study
– many foundries (42 percent) experience difficulties in measuring, recording, and evaluating key KPis;
– those foundries familiar with product-related items are also those most likely to implement initiatives for improvement (continuous improvement programs);
– workforce-related programs (“lean production” programs) are initiated predominantly at the larger foundries;
– environmental certificates are not yet in widespread usage, and are secured mainly by the larger foundries;
– most companies hold general quality certificates on Russian standards (Gost,) but also frequently make reference to international iso standards;
– customer-related quality certificates are maintained by one third of the companies surveyed, but are expected to become increasingly important as foundries engage in business beyond their own vertically integrated companies and/or as they begin to export beyond the cis.
Statistics on the prevalence of manufacturing technologies and management techniques
the prevalence of certain manufacturing technologies and management techniques is reflected by two key statistics:� ”companies (%)” indicates the percentage of all companies responding to the
survey that apply this technology;� “Percentage by volume” indicates how much (the percentage) of a foundry’s
production is produced using this technology. if the percentage value for “companies (%)” is higher than the value for “Percentage by volume” then this indicates that the technology in question is preferred by smaller companies.
criteria(russian foundries)*
companies (%)
Percentage by volume
remarks (russian foundries)
melting/metal treatment
induction 58% 53% Proportional production of cast materials (Russian • foundries):– grey iron ( induction or cupola) 50%– ductile iron (induction) 26%– steel (arc) 24%
Russian foundries exhibit a clear preference for arc • furnaces
arc 54% 68%
cupola 33% 20%
oil/gas-fired 0% 0%
aod 0% 0%
Vod/Vad 4% 0.3%
moulding system
Green sand 83% 93%
Green-sand mould technology is preferred at larger • Russian foundries, while smaller foundries prefer chemical-bonded sand moulds
chemical-bonded sand 46% 24%
Permanent moulding 8% 6%
Vacuum moulding 0% 0%
dry sand 4% 4%
other 8% 3%
table 3.10: PreVaLence OF SPeciFic technOLOgieS and management techniqueS

1. introduction
resource efficiency in the Ferrous Foundry industry in russia: Benchmarking study 77
criteria(russian foundries)*
companies (%)
Percentage by volume
remarks (russian foundries)
moulding facilities 4% automatic, 92% mechanised, 4% manual
automatic green sand moulding 50% 60%
Mechanised moulding is very common in Russia: many • foundries also use floor/hand moulding for minor quantities
Mechanised (semi) green sand 67% 31%
Mechanised chemical-bonded loop 13% 1%
floor or pit hand-moulding 50% 8%
core making
oil sand 29% 12%
a substantial number of smaller Russian foundries still • apply outdated technologies for core production (oil sand, sodium silicate, etc.)
shell sand (croning) 13% 35%
cold box 46% 59%
hot box 46% 82%
sodium silicate 29% 16%
chemical-bonded sand 8% 1%
other 4% 6%
core production
Machine manufacture 50% 83% automatic machine manufacture of core is predominantly • utilised at larger foundrieshandmade 83% 56%
heat treatment
Batch 54% 51%eighty three percent of Russian foundries apply heat • treatment: a greater number of smaller Russian foundries concentrate on normalising, quenching, and tempering
continuous 25% 26%
normalising 67% 47%
Quenching and tempering 63% 43%
management techniques
company is familiar with:
only a minority of Russian companies are familiar with • state-of-the-art management techniques for operational performance improvement
continuous improvement programs and lean production • techniques are predominantly used in larger foundries
continuous improvement programs 36% 37%
six sigma methodologies 32% 14%
lean production 55% 62%
company has already applied:
continuous improvement programs 27% 68%
six sigma methodologies 0% 0%
lean production 27% 55%
certificates:
environmental certificates 17% 45% environmental certificates are in evidence at larger • foundries: the majority of Russian foundries respect quality standard regulations
General quality certificates 63% 86%
customer quality certificates 33% 41%
note: *Russia data, based on the percentage of foundries responding to the benchmarking survey and corresponding production volumes.

78 resource efficiency in the Ferrous Foundry industry in russia: Benchmarking study
RecoMMendations closing the resource-efficiency gap on european standards will require Russian foundry owners and management to face up to the necessity of engaging in certain key strategic initiatives, including: 1) improving operational performance – much of which can be undertaken internally, without
major capital investment, through improvements in processes and organisation, as well as investment in equipment;
2) revising the business models of many foundries (in line with company and/or group strategy) to:
а. specialise on core competencies (in terms of products and technology);
b. penetrate attractive market sectors and geographic regions: this may require the development of sales and marketing strategies and customer-service skills directed at developing both domestic and international markets.
4

4. recommendations
79resource efficiency in the Ferrous Foundry industry in russia: Benchmarking study
4improved operational performance could be achieved through the following steps.
� improving those process-related KPis most likely to deliver direct cost savings and improve the bottom line:
Process yield: 4.0% potential reduction in total costs Production efficiency: 6.5% potential reduction in total costs total: 10.5% potential reduction in total costs
Many of these improvements could be realised through organisational changes and managerial initiatives, without, necessarily, any need for major capital investment.
� Better energy efficiency in the melting process could reduce total costs by as much as five percent. While a degree of capital investment may be required (in the replacement of outdated equipment with more energy-efficient plant) a number of savings might also be achieved through organisational initiatives. Minimising energy costs will become increasingly important as energy prices continue their inexorable rise.
� improved labour productivity could result in a saving of up to four percent on total costs: much of it achievable without the need for any financial investment, through organisational initiatives such as reductions in over-manning and improved operational and administrative processes. this will become increasingly important as wages rise in line with Russia’s developing economy.
� Lower consumption of fresh water and sand will also become increasingly important in future as water charges and waste disposal costs rise. Better resource efficiency in both cases could be achieved, however, though organisational initiatives (requiring only limited investment) as well as through major capital projects.
on the basis of the results of the ifc Resource efficiency in the ferrous foundry industry in Russia: Benchmarking study, matching european best practice could deliver the following results.

80 resource efficiency in the Ferrous Foundry industry in russia: Benchmarking study
Russian foundries have opportunities to increase their international competitiveness if performance is improved and cost advantages exploited and maintained. But only when the quality of castings is improved will Russian foundries be able to increase production volumes significantly, and on a sustainable basis. � Very few foundries have experience of exporting outside the cis. foundries
manufacturing for in-house, domestic, or cis clients are not yet exposed to the strict quality systems and requirements in force internationally.
table 4.1: imPrOVementS acrOSS aLL kPiS
Sample results for improvement across all 7 kPis
Savings/additonal profit (% total costs)
Organisational measures (minor investment only)
major capital investment required
% potential % total costs % potential % total costs
1. Process yield (%) (from four sub-indicators) -4.0% 68% -2.7% 32% -1.3%
melting loss (%) -1.1% 50% -0.5% 50% -0.5%
pig and spillage (%) -0.1% 50% -0.1% 50% -0.1%
runners & risers (%) -1.4% 75% -1.0% 25% -0.3%
scrap & rejects (%) -1.4% 75% -1.1% 25% -0.4%
2. Oee (moulding) (%) (from four sub-indicators) -6.5% 70% -4.6% 30% -1.9%
downtime (%) -1.8% 25% -0.4% 75% -1.3%
slow running (%) -4.2% 95% -4.0% 5% -0.2%
bad moulds (%) -0.5% 25% -0.1% 75% -0.4%
scrap & rejects (%) 0.0% *) 0.0% 0.0%
3. teeP (%) capacity utilisation -5.7% *) 70% -4.0% 30% -1.7%
4. energy consumption (kWh per to produced) -7.7% 25% -1.9% 75% -5.8%
for melting (kWh/to melt) -5.0% 25% -1.3% 75% -3.8%
for casting (kWh/to cast) -2.7% *) 25% -0.7% 75% -2.0%
5. Sand consumption (per ton good casting) -0.7% 25% -0.2% 75% -0.5%
6. Fresh water consumed (m3 per to good casting) -0.4% 50% -0.2% 50% -0.2%
7. Labour productivity (man-hr/to good casting) -4.0% *) 75% -3.0% 25% -1.0%
total Plant Savings -29.0% 57% -16.6% 43% -12.4%
note: * excluding double counts.
markets served (by volume) (survey sample results)
in-house 62.4%
domestic 32.9%
export to cis countries 4.2%
export outside the cis 0.5%
table 4.2: dOmeStic and exPOrt marketS
Source: GeMco engineers B.V./Knight Wendling Gmbh (2010).
Source: GeMco engineers B.V./Knight Wendling Gmbh (2010).

4. recommendations
81resource efficiency in the Ferrous Foundry industry in russia: Benchmarking study
� the scrap and reject volumes currently borne by Russian foundries are relative to (domestic) quality standards and customer quality acceptance levels. however: – quality requirements are currently higher in europe than in Russia;– if Russian castings were subject to european quality standards it is likely that
scrap and reject volumes would be considerably higher.
Figure 4.2: rejectiOn rateS at ruSSian FOundrieS are BetWeen tWO and FOur timeS higher than thOSe at eurOPean enterPriSeS
rejection rate (industry average)
eu Russia (national standards)
Russia (eu standards)
6.7% 6.7%
6.7%
13.4%
3.4%
x4
x2
Source: ifc (2010), “Resource efficiency of the ferrous foundry industry in Russia Benchmarking study,” october.
� evidence from GeMco engineers B.V., as well as various Russian specialists in the sector, suggests that if Russian foundries were subject to european quality standards scrap and reject volumes would be likely to double.
� Quite apart from the need to reduce scrap and reject volumes, Russian foundries also need to improve the “visual appearance” of castings in order to compete effectively on the international markets.
it is of vital importance for Russia’s machine-building and engineering industries that quality standards improve: � high quality castings are a precondition for state-of-the-art construction and
performance; � they are also a precondition for the technological competitiveness of Russian
foundries;� and for fully efficient resources management.

82 resource efficiency in the Ferrous Foundry industry in russia: Benchmarking study
key recommendations
following the completion of its Resource efficiency in the ferrous foundry industry in Russia: Benchmarking study, ifc has recently issued the Practical Guide to resource efficiency in the russian Ferrous Foundry industry, providing a series of tools to support Russian foundries in benchmarking and operational improvement. specifically, the guide also includes the following volumes:
1. Self-diagnostic guide Based on the methodologies used in conducting this study, the self-diagnostic Guide enables individual enterprises to collate information and analyze results against various KPis. With recommendations on data collection, and on the evaluation and analysis of information, resulting conclusions may then be benchmarked against best practice and average standards in Russia and europe.
2. Best Practice guide for the russian Ferrous Foundry Sector
this guide includes a number of strategies for improving performance, and analyses cross-sectoral experience and best practice in the implementation of new technologies. With 55 concrete proposals on improving performance against KPis, as well as 150 indicators on the evaluation of capital equipment and 200 “best available techniques,” it also includes practical advice on the continuous improvement of new production processes.
key strategies for senior management in implementing performance improvement.� clearly define the proposed scope of all projects, and set clear and achievable
targets, timeframes, policies and procedures.� set clear leadership goals and objectives, and ensure both management
and employees are fully engaged in these, through regular reporting and communications.
� establish a dedicated “Project team” staffed by internal specialists and external independent advisers: the involvement of external experts will act as a catalyst in eradicating redundant processes and habits, as well as generating new ideas.
� ensure all personnel understand the necessity for change, and are fully engaged in all change management initiatives.


iFc in russia
36/1 Bolshaya Molchanovka 121069 MoscowPhone: +(7 495) 411 7555Fax: +(7 495) 411 7572E-mail: [email protected]/rcpp 2011