iex workshop @ iit kanpur training-2018/presentation/caret_iitk... · iex workshop @ iit kanpur ......
TRANSCRIPT

Business of Charging Infrastructure for Electric Vehicle
Wednesday, May 2, 2018CENTRE OF ADVANCED RESEARCH IN ELECTRIFIED TRANSPORTATION, A.MU.
1
IEX Workshop @ IIT Kanpur
M. Saad Alam
Director,
Centre of Advanced Research in Electrified Transportation (CARET)
Aligarh Muslim University (AMU), Aligarh
Associate Professor,
Department of Electrical Engineering, Aligarh Muslim University (AMU), Aligarh

Wednesday, May 2,
2018
2
Introduction Introduction
Smart Grid
Charging Infrastructure
Battery Swapping Station
Impact on Charging Infrastructure
EV Market
EV Charging Business Model
Challe ges a d solutio s to I dia s EV hargi g i frastru ture Viability of xEVs in India: A Public Opinion Survey
Case Studies
Content

Introduction
1. The swiftly growing structure of urbanization and industrialization;
Facilitating the transportation era at peak; 25% GHG
Exponentially increasing energy demand; 33.3T kWh by 2030
2. The salient impacts of the use of fossil fuels for power generation;
Significant ecological degradation,
Fuel supply shortage,
Energy security crises,
Economic growth limitations.
3. The conventional T&D systems causes;
Significant amounts of energy losses,
Do not provide the hoped reliability & security levels,
Limited control and high costs of FACTS devices.
3
Zero-Carbon future
through intelligent
integration of electric
vehicles, electricity,
free renewable
energy and market
opportunities.
Smart Grid

Wednesday, May 2, 2018
4
Energy Management
Centre
GenerationTransmission &
Distribution
Commercial & IndustrialResidential
Renewable Energy Sources
Conventional Energy Sources
Cross-Border Power Transfer
Remote Control/ Condition Monitoring
Grid/Distribution AutomationSmart Switches
Smart Substation
Smart Meters
Smart Appliances
Demand Response
Energy Storage
Residential EV Charging
EV Charging Station
Energy Storage
Distributed Generation
Smart Building
Distributed Energy
Management
Asset Management
Tariff Mechanism
Data Analytics
Ancillary Services
Isolated Microgrid
Disturbance in grid
Outage Management
Structure of Smart Grid

Solution Area: Electricity Grid
Solutions for evolving system demands
Wednesday, May 2, 2018
5
§ New levels of monitoring,
protection and control deeper
into the distribution grid
Overview
§ Incent customers with supply
side signals to change demand or
feed in generation
§ Cope with renewables using
voltage regulation as well as
distribution grid automation
§ Utilize batteries in the network to
address capacity constraints and
improve power quality
§ Improved capacity, efficiency,
reliability, sustainability
Benefits
§ Reduced need to build new
generation or grid capacity
§ Reduced system costs
§ Improved reliability of supply
§ Supports higher share of
renewables
§ Improved network stability,
power quality and efficiency
Power & Automation for …
Grid
Automation
Energy
Storage
Demand
Response
Renewables
Integration

Solution Area: TransportInfrastructure to effectively electrify transportation
Wednesday, May 2, 2018
6
§ Charging infrastructure for 15-30
minute charges and longer
Overview
§ Infrastructure to power ships
with electricity from the shore
when berthed
§ Ultra-fast charging for battery
powered electric buses
§ Recuperate braking energy in
metro trains and trams
§ Foster electric vehicle uptake
§ Cut emissions in the city
§ Help integrate renewables
Benefits
§ Eliminate 98% of emissions and
all noise and vibration
§ Improve quality of life near port
§ Clean, quiet public buses
§ No overhead cables
§ Reduce energy costs by up to
30%
§ Potentially sell services to grid
Electric Vehicle
Charging
Electric Rail
Shore-to-Ship
Electric Buses
Power & Automation for …

Path to Transportation Electrification
Wednesday, May 2, 2018
7
Natural Gasand Biofuels
HybridFuel + Electric
FullyElectric
Hydrogen
Electrification
10- 30%Up to 15% -100 %50%30-40 -100 %50
Advanced
combustion engine
Raw Material Suppliers
Traditional Component Suppliers
Battery Suppliers
OEMS
Utilities / Infrastructure
The EV value chain

Wednesday, May 2, 2018
8
EV Charging Infrastructure Deployment Timeline
2009:
Inductive charging
standard SAE-J17721994-2000:
GM inductive
MagneCharge for
home charging
2011:
SAE Combined
Charging System
(Combo Coupler)
introduced
2010:
The CHΛdeMOstandard developed
in Japan.
2010:
SAE-J1772 adopted by GM,
Chrysler, Ford, Toyota,
Honda, Nissan and Tesla
2017:
Audi, BMW, Daimler, Ford,
General Motors, Porsche
and Volkswagen agreed to
introduce Combo Coupler/
BSS

Wednesday, May 2, 2018
9
E-mobility models:
Comparison of selected countries
Lever US China Japan France
R&D
Supply Side
Demand side incentives
Infrastructure
Proposed Investment >$5 B >$20 B >$1.7 B >$3.5 B

Wednesday, May 2, 2018
10
EV infrastructure
Charging
On-board
chargingOff-board
charging
AC Charging spot DC charger
Private carPrivate car
Public bus
Battery swapping
Commercial
vehiclePassenger car
Side-swappingRear-swapping
Bottom-swapping
Public bus Sanitation
vehiclePrivate car Taxi

Wednesday, May 2, 2018
11
Typical layout of EV charging system

Wednesday, May 2, 2018
12
EV Charging Levels
Charging type Level 1 Level 2 DC Fast
Charging Time (h) 20-22 6-8 0.2-0.5
Charger location On-board
(1- phase)
On-board
(1 or 3- phase)
Off-board
(3- phase)
Voltage supply ( V) 120 240 208-600
Power level (kW) 1.3 to 1.9 Up to 19.2 50 to 150
Range 2-5 miles per hour of
charging
10-20 miles per hour of
charging
60-80 miles in < 30
minutes
Primary Use Residential charging Residential and public
charging
Public charging

Wednesday, May 2, 2018
13
EV Charging Standards
Standard Specification
SAE-J1772 EV Coupler for conductive Charging
SAE-J1773 EV Inductively Coupled Charging
SAE-J1797 Recommended Practice for EV Battery Modules Packaging
SAE-J2288 Life Cycle Testing of Battery Modules for EV
SAE-J2464 EV/HEV Rechargeable Energy Storage System (RESS) Safety & Abuse Testing
SAE-J2836 Part 1 Use Cases for Communications between PEVs and Utility Grid
SAE-J2836 Part 2 Use Cases for Communications between PEVs and Supply Equipment (EVSE)
SAE-J2836 part 3 Communications between Plug-In Vehicles and the Utility grid for Reverse Flow
SAE-J2894 Power Quality Requirements for Plug-In Vehicle Chargers- Requirements
IEC-69/156/CD:2008 Electric vehicle conductive charging system
IEC-23H/222/CD:2010 Plugs, socket-outlets, vehicle couplers and vehicle inlets - Conductive charging of EVs
JEVS-C601:2000 Plugs and receptacles for EV charging
AIS-138(Draft) Electric Vehicle Conductive AC charging system-ARAI

Wednesday, May 2, 2018
14
Bus
Charging station
Taxi
Charging station
Environmental
sanitation vehicles
Charging station
Main type of charging facilities

Wednesday, May 2, 2018
15
Estimated Cost of Charging Infrastructure
Total investment cost required for the establishment of charging infrastructure for EVs includes
The cost of equipments to be used,
Installation costs
Operation and maintenance costs.
With increase in penetration of EVs in the next few years, number of EV chargers will increase and
hence the equipment cost is expected to decrease.
The installation cost includes
cost of civil works, transaction cost regarding distribution system operator permission and other related
costs depending on factors like requirement of a new grid connection or up gradation of the existing
connection

Wednesday, May 2, 2018
16
Estimated Cost of Charging Infrastructure
Level 1 Level 2 DC Fast
0
2
4
6
8
10
12
14
16
Insta
llatio
n C
ost in
La
c (
INR
)
Tyoe of Charging station
0.3
3.0
15.0
Level 1 charger of 1.5kW, Level 2 charger of 6.6kW
and DC fast charger of 50kW capacity.
For semi-private/semi-public places where low or
medium power level chargers are required, cost
varies between 500 € (Rs 36,431) and 1200 € (Rs
87,435).
For public places where high power level chargers are
required, installation cost is relatively higher ranging
between 2400 € (Rs 1, 74,871) to 3600 € (Rs 2,
62,306).
For that operation and maintenance cost is to be
added, which may be taken to be 10% of the total
installation cost (including equipment cost)
Wednesday, May 2, 2018
17
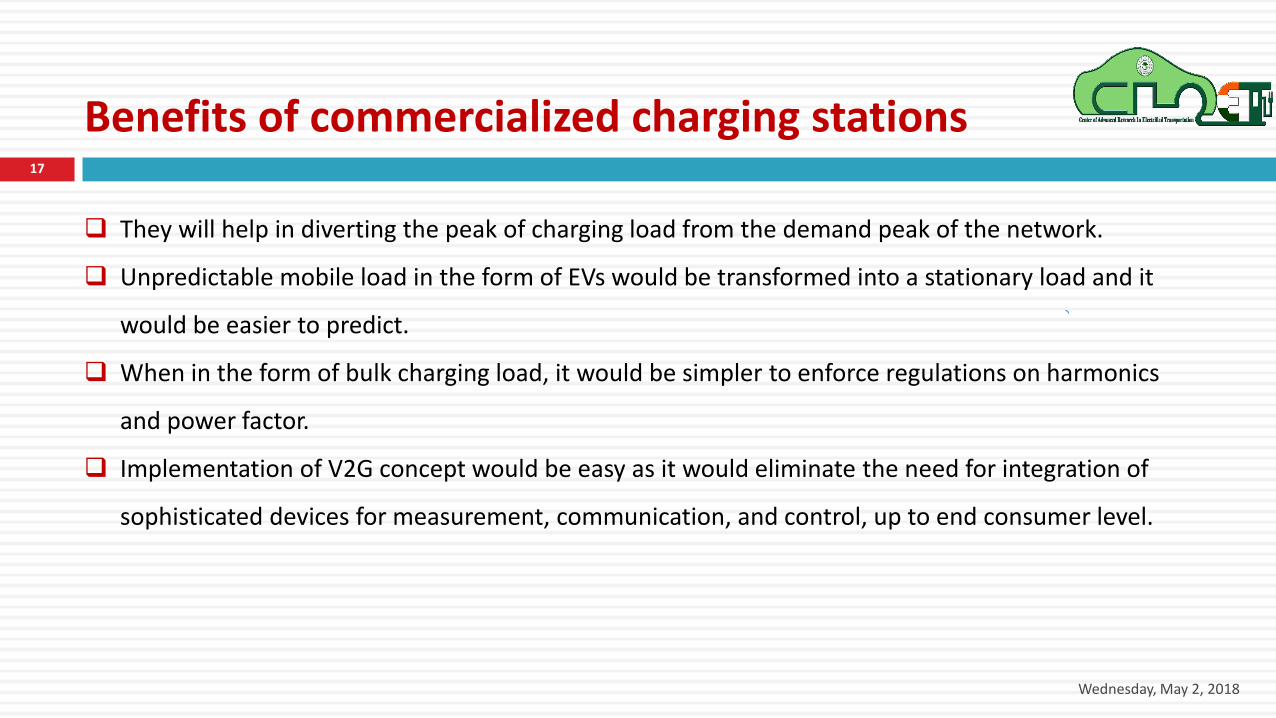
They will help in diverting the peak of charging load from the demand peak of the network.
Unpredictable mobile load in the form of EVs would be transformed into a stationary load and it
would be easier to predict.
When in the form of bulk charging load, it would be simpler to enforce regulations on harmonics
and power factor.
Implementation of V2G concept would be easy as it would eliminate the need for integration of
sophisticated devices for measurement, communication, and control, up to end consumer level.
Benefits of commercialized charging stations

Wednesday, May 2, 2018
18
In general, EV charging requires a long charging process. Thus far, due to policy and money
constraints, the charging stations, charging piles and other charging infrastructure are not widely
deployed.
The abovementioned reasons make it probable that EV users will be forced to stop and wait, which
results in waiting anxiety.
In addition, EV users trade-off between the remaining battery energy, the location distribution of
charging facilities and their travel plans, which easily results in range anxiety.
Therefore, more researchers and EV operators are turning their attention to battery swapping.
Battery swapping can provide a new fully charged battery, which does not require depleting the
energy of the old battery.
Limitation of EV Charging Station

Wednesday, May 2, 2018
19
Type of Battery Swapping Stations
S i d e - s wa p p i n g : applicable to as
commercial electric vehicles such
buses and sanitation truks which
have battery packs installed in both
sides of the vehicle body
Rear-swapping: applicable
to electric passenger
vehicles such as private
cars and taxis, with battery
packs installed in the
trunk of the vehicle body.
Bottom-swapping:
applicable to electric
passenger vehicles such as
private cars and taxis, with
battery packs installed in the
chasiss of the vehicle body.

Wednesday, May 2, 2018
20
Challenges of Battery Swapping Station
However, before the benefit of
battery swapping becomes a reality,
two problems need to be solved.
One is the EV battery technology,
which is fundamental for battery
swapping.
A standardized EV battery with
the characteristic of high
mileage, high energy density,
high recycling ratio, high recovery
ratio, environmentally friendly
ability and security needs to be
developed
BSSCharging facilities
Uncertainties
Construction operation
Battery Ownership Basis and Infrastructure
Charging device
Battery pack design
Battery Degradation
Interface/ Compatibility

Wednesday, May 2, 2018
21
Complexity of EV/BSS Integration

Wednesday, May 2, 2018
22
Benefit of Battery Swapping Stations
Costumer Prospective
In BSS scheme, the customers would lease the battery from the BSS and avoid a lump investment.
The other aspects that concern potential EV owners are the long charging times, the costs of
upgrading household installations to high power chargers, and the limited number of public
charging stations.
Another concern of the EV owners is the limited range due to the relative small capacity of the
batteries. In order to ease this concern, the owners would need to have access to public charging
stations, which are translated into requiring heavy infrastructure investments. These concerns
could be eliminated if an EV owner has access to BSSs in the areas where they usually travel.

Wednesday, May 2, 2018
23
Benefit of Battery Swapping Stations
Power System Operator Prospective
Sifting power demand form one duration to another
Prediction of EV load demand is easy
Furthermore, the BSS is an aggregator of batteries, and these stations could also be used to
provide services to the system as a whole.
The BSS can inject power back into the power system to smooth the net daily demand curve, if the
BSS perceives a benefit in doing so.
In addition to acting as a storage device, the BSS can also provide a share of the required ancillary
services in different intervals, e.g., frequency regulation, load following, and voluntary reserve
provisions.

Wednesday, May 2,
2018
24
Impact of charging on Power system
Increases the difficulty of distribution network planning. New constraints in the form of electricity demand
and the layout of charging stations need to be considered, which add to the complexity of network
planning.
Improved quality equipments with high ratings are required in the distribution network to facilitate
interconnection of charging infrastructure.
Requires distribution transformer with larger capacity and distribution line of larger cross section to avoid
problems like overloading, voltage deviation etc.
It may lead to a decrease in the economy of distribution system operation. As charging load exhibits large
volatility, it is difficult to confine charging behavior to low load periods, leading to greater system peak
difference. This would ultimately result in lower utilization efficiency of distribution network equipment.
Power quality of the distribution network is affected. Charger uses several power electronic conversion
devices in the form of converters which induce harmonics in the source side current.

Wednesday, May 2, 2018
25
Recommendations for EV charging/BSS
Most research is this area is focused on the following issues:
Battery logistics strategy, battery swapping station planning and construction strategy,
battery charging strategy for the battery swapping stations
The abovementioned research intends to improve the coverage and service of a battery swapping
system. However, these approaches do not realize the o je ti e of get energy replenishment anytime
and anywhere.
Switching from the existing passive battery swapping mode to the active battery swapping mode
Mobile Battery Swapping Stations

Wednesday, May 2, 2018
26
Electric Vehicle Infrastructure in India
Wednesday, May 2, 2018
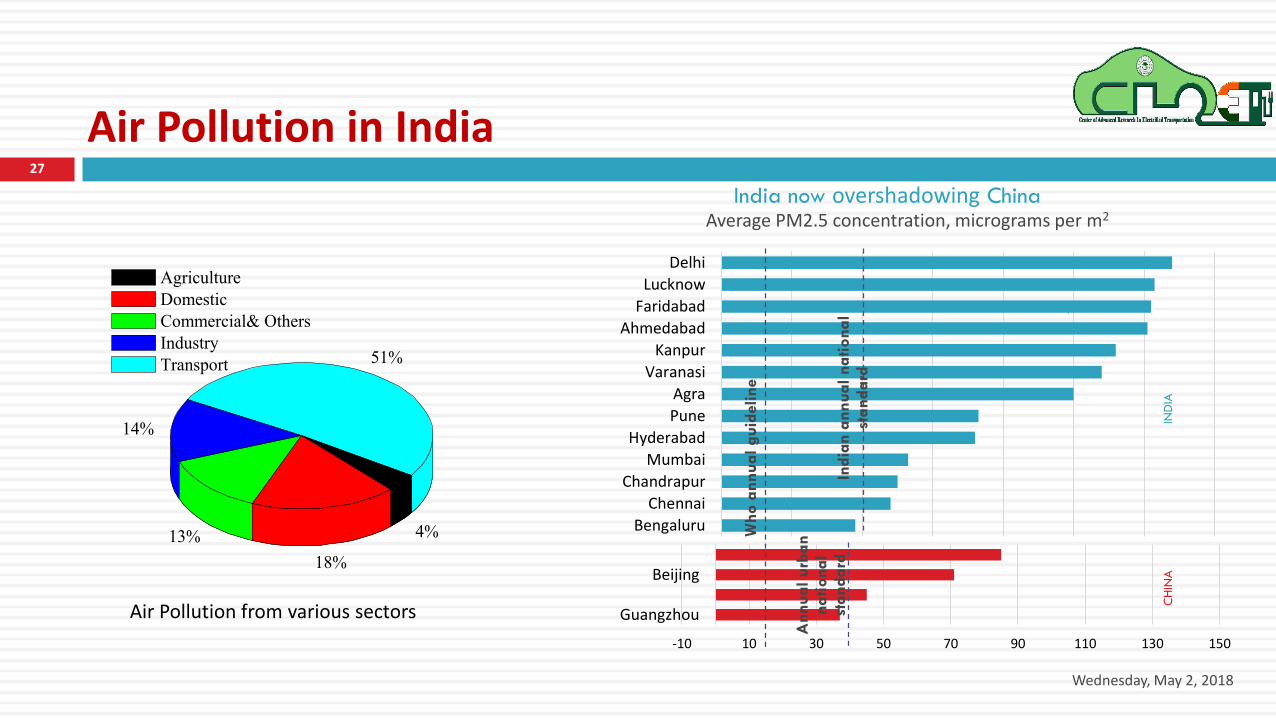
27
51%
14%
13%
18%
4%
Agriculture
Domestic
Commercial& Others
Industry
Transport
Air Pollution in India
India now overshadowing China
Bengaluru
Chennai
Chandrapur
Mumbai
Hyderabad
Pune
Agra
Varanasi
Kanpur
Ahmedabad
Faridabad
Lucknow
Delhi
-10 10 30 50 70 90 110 130 150
Guangzhou
Beijing
Average PM2.5 concentration, micrograms per m2
India
n a
nnual
na
tional
standard
Annual
urb
an
na
tional
standard
Who a
nnual
guid
eline
IND
IAC
HIN
A
Air Pollution from various sectors

Wednesday, May 2, 2018
28
Road Transport: CO2 Emissions by Fuel type
55%
28%
15%
2%
Buses/Cars/Taxi/3W (CNG+LPG
2W/3W (Petrol)
Car/Taxi/Jeep (Petrol+Diesel)
Commercial Vehicles: Trucks/Buses/LCV (Diese
0
100
200
300
400
500
600
700
800
Water
Frieght rail
Freight trucks
Air
Pass rail
Buses
3-wheelers
2-wheelers
Pass cars

Wednesday, May 2,
2018
29
Green Transport in India
1998 2000 2001 2002 2003 2004 2005 2006 2007 2008 2009 2010 2011
I dia s first CNG
bus launched
Supreme Court
orders to convert
all city bus fleets,
taxis and auto-
rickshaws in Delhi
to CNG
CNG conversion of
buses, taxis and auto-
rickshaws introduced
in Mumbai
First electric car
commercialized
in India (Reva)
All buses in Delhi
converted to
CNG)
First section of the Delhi Metro
Rail–the red line-opened
Karnataka is the first
state to utilize bio-fuels
and ethanol-blended
fuels in public buses in
Bangalore
Reva exported to
European markets
and branded as G-wiz
I dia s first MUV-
O i Cargo launched by
Maruti-Suzuki
I dia s first ele tritwo wheeler
launched – Yo Byke
by Indus Elec-trans
I dia s first dual fuel (petrol +
LNG) passe ger ar Wago R
Duo lau hed y Maruti-Suzuki
Hero Electric launches
electric two wheeler
First hybrid car
launched in
India-Honda
Civic Hybrid
1,10,000 electric
vehicles sold – 97
98% of which were
two wheelers
Full exemption from central
excise duty provided to Evs
Delhi is the first city in India to
introduce a hybrid electric
CNG public bus manufactured
by Tata Motors
GOI sets up the
National Mission
for Hybrid and
Electric Vehicles

Wednesday, May 2,
2018
30
National Mission for Electric Mobility Structure
NCEM
NBEM
NAB
National Council for
Electric Mobility
National Board for
Electric Mobility
National
Automotive
Board (NAB)
NCEM is a Government body
made up of 18 members
including 8 Cabinet Ministers
25 members, comprising of
secretaries of stakeholder
Central Ministries and academia
The expert body to assist NCEM
and NBEM
National Electric
Mobility Mission
Plan 2020
(NEMMP 2020)

Wednesday, May 2, 2018
31
Total Investment Proposed under
National Mission for Electric Mobility (Rs in Crores)
Area
4W 2W 3W Buses LCV Total
HG/ HEV
HG/HEV/BEV
HG/ HEV HG/ HEV HG/HE
V/BEVHG/ HEV
HG/HE V/BEV
HG/ HEV
HG/HE V/BEV
HG/ HEV
HG/HEV/BEV
Demand Incentives
4900-5000
5600-5700
5200-5300
400-450
700-750
500-550 500-550
1250 -1300
1500 -1550
12,250-12,600
13,500-13,850
R&D Investment 500-600 500-600
500-600 - -
500-600 500-600 - -
1500-1800
1500-1800
Power Infrastructure 700-
8001200-1300
3300-3400
40-50 75-85 5-10 20-30 55-65 90-100
4100-4325
4685-4915
Charging
Infrastructure 700-800
950-1000
40-50 70-80 5-10 10-20 70-80 115-125
815-940
1145-1225
NMEM (Rs in Crores)
Government Funded
Government & Industry Funded

Wednesday, May 2, 2018
32
India and global xEV demand projections for 2020 (Nos in Millions)
Vehicle seg./country 2W 4W Range Buses Total Range
India xEV projections 2020 Numbers 4.8 1.6 1.7 0.002 5 7
penetration of xEV India % 15.0% 17.8% 18.9% - 14-16%
Total vehicle Sales India Numbers 32 9 9 - 43
Global xEV projections 2020 Numbers 27 5 13 0.12 32.12 40.12
Global penetration of xEV % 35.5% 7% 19% 20%
Total vehicles 2020 Numbers 76 70 70 0.57
India Share as per above % 17.8% 12.8% -30% -
How fast will EV market share grow ??
2.4 million EVs to be
sold by 2020
6% displacement of
global gasoline
demand
$100/Kwh battery
pack costs in 10 years
Expect the global EV fleet to rise from 2 million vehicles
today to 125 million by 2035

Wednesday, May 2, 2018
33
How fast will EV market share grow: India
2017 2018 2019 2020 2021 2022 2023 2024 2025
Passenger Cars
45000
40000
35000
30000
25000
20000
15000
10000
Forecasted India Passenger Car Electric Vehicle Market, Volume, 2017-2025
Source: ANS MarketProAnalytics

Wednesday, May 2, 2018
34
How fast will EV market share grow: India
140000
120000
100000
80000
60000
40000
20000
0
2017 2018 2019 2020 2021 2022 2023 2024 2025
Forecasted India Electric 2-Wheeler Market, Volume, 2017-2025
0
500000
1000000
1500000
2000000
2500000
3000000
2017 2018 2019 2020 2021 2022 2023 2024 2025
Forecasted India Electric 3-Wheeler Market, Volume, 2017-2025
Source: ANS MarketProAnalytics
Wednesday, May 2, 2018
35
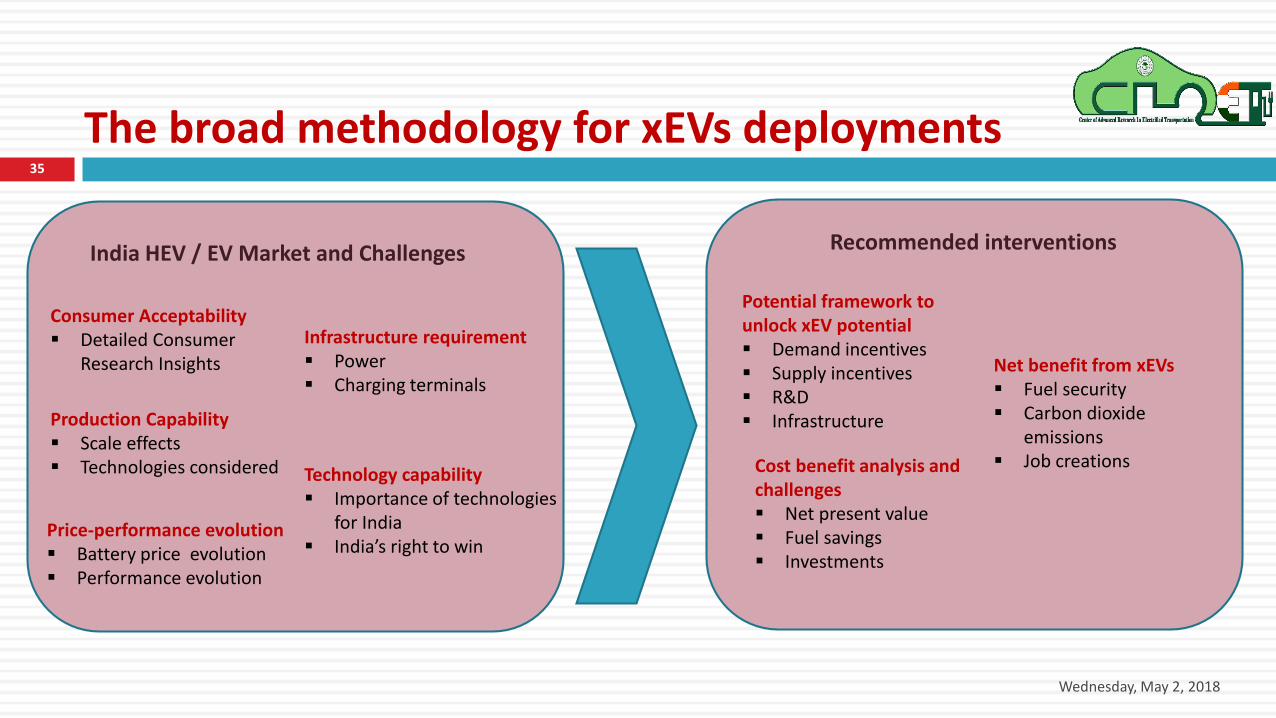
The broad methodology for xEVs deployments
India HEV / EV Market and Challenges
Consumer Acceptability
Detailed Consumer
Research Insights
Production Capability
Scale effects
Technologies considered
Price-performance evolution
Battery price evolution
Performance evolution
Technology capability
Importance of technologies
for India
I dia s right to i
Infrastructure requirement
Power
Charging terminals
Recommended interventions
Potential framework to
unlock xEV potential
Demand incentives
Supply incentives
R&D
Infrastructure
Cost benefit analysis and
challenges
Net present value
Fuel savings
Investments
Net benefit from xEVs
Fuel security
Carbon dioxide
emissions
Job creations

Wednesday, May 2, 2018
36
Technology priority areas V
alu
e 5
5-7
0%
, P
rio
rity
1
Battery Cell
Va
lue
5-1
0%
, P
rio
rity
2
Battery Management System
Va
lue
10
-15
%,
Pri
ori
ty 3
Power Electronics
Va
lue
5-1
5%
, P
rio
rity
4
Electric Motor
Va
lue
<5
%,
P
rio
rity
5
Transmission System

Wednesday, May 2, 2018
37
The broad methodology for xEVs deployments
Demand side incentives
Manufacturing incentives
R&D incentives
Infrastructure support
Promote initial sales
Promote local manufacturing
Promote local battery and
power train research
Develop power generation and
charging infrastructure
Checking feasibility
through TCO model
Studying global examples for
implementation
Discussing proposed
incentives with government
bodies
Getting feedback from OEM and
SIAM
TCO: Totalcostofownership
SIAM: Society of Indian automotive manufacturing

Wednesday, May 2, 2018
38
Emerging Business Model for EV
Direct Vehicle Sales:
Provide autonomy and flexibility to sell or trade the car whenever they consumers desire.
Requires a high level of consumer education and awareness to effectively communicate the low
operating cost of an EV when compared to conventional vehicles
EV Leasing:
Ownership of the vehicle primarily remains with OEM or authorized service providers that lease out
the vehicle for a predetermined period of time.
It reduces the upfront purchase price (which is prohibitive for a large proportion of consumers in India)
by spreading it over the lease period.

Wednesday, May 2, 2018
39
Emerging Business Model for EV
Battery Leasing and Swap Schemes:
It help negate consumer concerns about battery durability and performance, while simultaneously
reducing the initial/upfront EV purchase price.
Service providers retain the ownership of batteries.
This model puts the operational costs of an EV on par with conventional ICEs,
It allows manufacturers to retain ownership of the battery for various 'second-life' applications that would
provide additional value
At the end of the contracted subscription/rental period, the EVs would then return back to the franchised
dealer network, giving them greater control over its assets
Manufacturers, battery suppliers and service operators can partner to collectively develop 'battery swap/
switiching stations

Wednesday, May 2, 2018
40
Emerging Business Model for EV
Infrastructure Service Models
Public Infrastructure Model – Provides EV station at public parking spaces.
Only EVs are allowed to park at these spots, they are likely to act as an incentive to consumers in urban
cities.
This model would have to be supported by local municipalities in partnership with infrastructure providers.
It seeks to provide access to charging for those consumers that lack home charging.
Private Infrastructure Model – More preferable in the early stages of EV adoption as it responds to direct consumer demand.
It involves installing charging points for EV adopters at their residence or at private sites such as malls, office parking
etc.
This ensures higher usage of charging points based on actual demand, as reflected by EV purchases, thus providing a
greater return on investment.

Wednesday, May 2, 2018
41
Emerging Business Model for EV
End-to-End Solution –
Involves close partnerships between OEMs, infrastructure facility providers, maintenance services
providers and local Governments
provide consumers with an integrated package of end-to-end value added services, thereby
minimizing the number of interfaces that the consumer has to manage.
Evolve as a subscription service where EV adopters pay a monthly/annual fee for an integrated
services package that involves access to charging facilities, vehicle maintenance services and free
parking at public pay-and-park lots, that are managed by local municipalities

Wednesday, May 2, 2018
42
Road Blocks for Charging Infrastructure in India
EVs are to be taxed at 12%, hybrid vehicles are taxed at 28% plus a 15% cess.
Consumers are more likely to try hybrid vehicles, but that sector is not being encouraged by the
current tax structure
Most of the chargers being installed across the country, however, are AC chargers.
Battery technology is yet another aspect that needs to be looked into
Yet another issue is that simply shifting the fleet to electric will not address the impact on the
environment.

Wednesday, May 2, 2018
43
Viability of xEVs in India: A Public
Opinion Survey

Wednesday, May 2, 2018
44
The survey was conducted majorly at events-
EV Boot Camp, AMU, Aligarh, 2016
ISGF week 2016, New Delhi
SIAT, ARAI, Pune, 2017
Survey methodology

Wednesday, May 2, 2018
45
Survey Results
37.35%
34.90%
27.75%
0.00% 10.00% 20.00% 30.00% 40.00%
HEV
PHEV
BEV
Fig: Demand for different xEVs type
0.00%5.00%
10.00%15.00%20.00%25.00%30.00%35.00%40.00%45.00%
Cu
tba
ck/e
limin
-
ati
on
of
foss
il f
ue
ls
Less
ma
inte
na
nce
Re
du
ced
air
po
lluti
on
Loo
ks/s
tyle
Luxu
ry
most attractive (5) 4 3 2 least attractive (1)
Fig: Key characteristics of xEVs

Wednesday, May 2,
2018
46
Survey Results
High initial
cost
30.4%
Lack of charging
infrastructure
25.4%
Safety
4.3%
Range
26.1%
Reliability
13.8%
67.4%
23.9%
8.7%
Will be limited to
research only
Completely replace
ICE vehicles
Will be part of
transportation
system but only
next to ICE vehicles

Wednesday, May 2, 2018
47
Potential solutions
Advertising of vehicle manufacturer, internet resources etc. should be made available for
consumers for decision making.
Using media and social networks, public attitude can be influenced for non-financial advantages of
adopting xEVs.
Opportunities to develop local EV experience facility to offer essential test-drive prospects can be
explored.
By adding xEVs to public fleets and establishing charging infrastructure at various facilities, visibility
a d o fide e of asses i GoI s i itiati e a e i pro ed. Other measures include bigger investments in xEV technology, infrastructure and battery swapping
programs, strong warranties on the xEV batteries and tax waiver to reduce the cost of xEVs.

Barriers ?
Road Blocks??
Solutio s………………..
QUESTIONS for Workshop Participants
Wednesday, May 2, 2018CENTRE OF ADVANCED RESEARCH IN ELECTRIFIED TRANSPORTATION, A.MU.
49
CENTRE OF ADVANCED RESEARCH IN ELECTRIFIED TRANSPORTATION
ALIGARH MUSLIM UNIVRSITY
SUPPORTED
by
DEPARTMENT OF HEAVY INDUSTRY
GOVERNMENT OF INDIA
UNDER FAME MISSION
CENTRE OF EXCELLENCE FOR CHARGING INFRASTRUCTURE

EXPLORING……….
AVENUES FOR COLLABORATION
CONSORTIUM PARTICIPATION
50

Any questions?
51

Thanks!
52