ies 2013 - innovazione e società innovation and society 2013 · anna crisci, second university of...
TRANSCRIPT

IES 2013 - Innovazione e società
Innovation and Society 2013
Metodi statistici per la valutazione
Milano, 9 - 10 dicembre 2013
Contributed Session Abstracts

A comparing among the different approaches for
DIF analysis.
T. Menini1, I. Camminatiello2, M. Gallo3
Our study focuses on measurement instrument for teaching evaluating (Carpita;
2008). One of the most proper statistic methodology is Item Response Theory -
IRT (Baker, Kim; 2004), that collects several models, the simplest is Rasch
Model - RM (1960).
The RM makes several assumptions. In some cases, it can happen it is not
possible to identify any set of items consistent with the hypothesis of the RM:
this can be caused by a ill calibrated questionnaire or a mixture of individuals
apparently belonging to the same population, but in reality related to different
populations (Camminatiello, Gallo, Menini; 2010).
The latter case can be a symptom of a different functioning of the items
corresponding to distinct groups of individuals: this phenomenon is called
Differential Item Functioning or DIF. In literature there are several DIF
diagnostics (Glas & Verhelst, 1995), but the most used and implemented in the
most commonly used software (Wu, Adams, Wilson; 1998) is based on the
residual analysis among the subgroups identified by one or more aggregation
variables. Other authors (Wang; 1998) treat the DIF as a parameter to be
estimated rather simply a sign to be detected. In this study we are going to
compare the different approaches for analysing the DIF.
References
1. Baker, F., Kim S.: Item response theory. Parameter estimation techniques, Dekker, New
York (2004).
2. Camminatiello I., Gallo M., Menini T.: The Rasch Model for Evaluating Italian Student
Performance Journal of Applied Quantitative Methods, Volume 5, Issue 2, June 30 (2010).
3. Carpita M.: Presente e futuro dei sistemi di valutazione dell’università, Statistica & Società,
anno VI, n. 1, pp. 2-18.
4. Glas, A., Verhelst, N.: Tests of fit for polytomous rasch models, in G. H. Fischer e I. W.
Molenaar, eds, Rasch models. Foundations, recent developments, and applications.
Springer-Verlag, pp. 325–352 (1995).
5. Wang, W.C.: An ANOVA-like Rasch analysis of differenzial item functioning. Report
(1998).
6. Wu, M., Adams, R., Wilson M.: Acer Conquest. Generalised item response modelling
software, Acer Press (1998).
1 Tullio Menini, “Orientale” University of Naples; [email protected]
2 Ida Camminatiello, Federico II University of Naples; [email protected]:
3 Michele Gallo,“Orientale” University of Naples, [email protected]

A finite mixture model approach on the first year
university drop out probability
Matilde Bini and Lucio Masserini
Abstract University drop-out is one of the most important problems occurring during
the first year of the first cycle degree courses. The aim of this study is to analyze the
first year university drop outs at the University of Pisa (Italy). In particular, the analysis
is focused on identifying the covariates affecting the response variable (Y = 1, if the
student dropped out; Y = 0, otherwise), and especially on detecting unobserved
subgroups of students, if they exist, having different probabilities of dropping out.
Classical regression models assume that parameters are the same for all units in the
population. This assumption is violated whenever the population is made up by an
unknown but finite number of subpopulations (latent classes). In this case, explanatory
variables may produce different effects on the response variable for each latent class.
Hence, when the assumption of population homogeneity is not satisfied, the use of
finite mixture regression models is more appropriate.
A dataset formed by administrative data of the University of Pisa, collected at
enrollment time for the academic years from 2008-2009 to 2012-2013, was used for
this purpose. The analysis is limited to students of the first cycle degree courses.
The characteristics detected of subgroups and the influential covariates, should
represent useful pieces of information for the implementation of academic policy
changes that could affect the drop-out rate.
1Matilde Bini, Department of Human Sciences, European University of Rome; email:
Lucio Masserini, Statistical Observatory, University of Pisa; email: [email protected]

A latent variable model for market segmentation
Francesca Greselin and Salvatore Ingrassia
Abstract We present a first explorative analysis to model a set of quantitative vari-ables provided by a telecom company, and related to the amount of services usedby customers. Motivated by the high correlation observed among the variables, weemploy mixtures of factor analyzers, which -at the same time- perform dimensionreduction. The purpose is to provide a market segmentation and to compare it tothe choice, made by customers, of their traffic plan. Any significative differencebetween the two classification approaches could be an important information to de-vise patterns of pre-churn customers. To estimate model parameters, we implementa constrained approach, based on the covariance decomposition in such a way toavoid spurious local maximizers and singularities in EM algorithm. First resultshighlight a non-unique behavior of customers inside the same traffic plan.
Key words: Market segmentation, Mixture of Factor Analyzers, Model-BasedClustering, Constrained EM algorithm.
Francesca GreselinUniversity of Milano Bicocca e-mail: [email protected]
Salvatore IngrassiaUniversity of Catania e-mail: [email protected]
1

IES 2013
Milano 9-10 dicembre 2013
A Multilevel Model to analyze the Italian students’ achievement
Autori:
Angelo Paletta, University of Bologna
Anna Crisci, Second University of Naples
Antonello D’Ambra, Second University of Naples
Abstract:
The aims of this study is to examine, by means of a Multilevel Model, as the
instruction, school and educational system influence the Italian students’
achievement. The main assumption of the model is that student outcomes are
influenced by students’ personal characteristics, by the time they actually spend on
learning and the way in which they use the opportunities to learn. At each level of
instruction three key concepts in educational effectiveness are distinguished: quality
of learning, time for learning and opportunity to learn. It is assumed that factors of
all levels can have direct and indirect effects on students’ learning outcomes even
though differences in these outcomes are though to be largely explained by
processes at classroom level and particularly by teachers behavior in the classroom.

A multivariate analysis of the quality of public
transport services
F. D. d'Ovidio, D. Leogrande, D. Viola, R. Mancarella, A. Schinzano1
Abstract The purpose of this study is to investigate what kind of observable and non-
observable factors can influence passenger satisfaction on the quality of public
transport services in the city of Bari. Of course, these results can be used by the
transport company in order to modify its business strategies and to improve its business
performance and competitive advantage.
Based on a sample survey, in the first step, relationships among the intangible
dimensions such as quality, satisfaction and loyalty are defined using suitable statistical
measuring models, for example Factor Analysis on the results of a Categorical Principal
Component Analysis. Successively, multivariate methods, like Segmentation Analysis
and Structural Equation Models, are used in order to verify if a cause-effect structure
among the previous factors exists.
Topic: Transports
1 Francesco Domenico d’0vidio Department of Economics and Mathematics, University of Bari
Aldo Moro [email protected]
Domenico Leogrande Department of Private Law and Business Studies, University of Bari Aldo
Moro [email protected]
Domenico Viola Department of Private Law and Business Studies, University of Bari Aldo Moro
Rossana Mancarella Department of Private Law and Business Studies, University of Bari Aldo Moro [email protected]
Andrea Schinzano Department of Private Law and Business Studies, University of Bari Aldo
Moro [email protected]

A statistical based H index for the evaluation ofe-markets
Paola Cerchiello and Paolo Giudici
Abstract The measurement of the quality of academic research is a rather contro-versial issue. Recently Hirsch has proposed a measure that has the advantage ofsummarizing in a single summary statistics all the information that is contained inthe citation counts of each scientist. From that seminal paper, a huge amount of re-search has been lavished, focusing on one hand on the development of correctionfactors to the h index and on the other hand, on the pros and cons of such measureproposing several possible alternatives. In the present work we propose an exactstatistical approach to derive the distribution of the h index. To achieve this objec-tive we work directly on the two basic components of the h index: the number ofproduced papers and the related citation counts vector, by introducing convolutionmodels. What proposed has been applied to a database of homogeneous scientistsin a recent paper. Here we extend what proposed in an application that concernsthe evaluation of e-market performances. The results show that the approach is ableto rank well e-market places on the basis of an H index based on the number ofcompanies present in the web and their number of orders.
Key words: h index, discrete extreme value models, convolution models, e-markets
1 Foreword
The measurement of research achievements of scientists has received a great deal ofinterest, since the paper of Hirsch (2005) that has proposed a ”transparent, unbiased
Paola CerchielloDep. Economics and Management, University of Pavia, via S. Felice 5, Pavia, e-mail:[email protected]
Paolo GiudiciDep. Economics and Management, University of Pavia, via S. Felice 5, Pavia e-mail: [email protected]
1

Assessing the quality of universities: a value added approach
Francesco Ferrante and Silvia Ghiselli
Abstract A large body of literature straddling economics and psychology shows that the technology of cognitive and non-cognitive skills formation is characterized by the cumulative nature of learning processes and by the presence of significant complementarities and irreversibility in the acquisition of such skills along the educational production chain [Cunha and Heckman 2007]. Tertiary education is the educational level most conditioned by previous learning. Equally ample and consolidated is the empirical evidence on the crucial role performed by contextual factors in learning processes (family of origin, social and educational environment); factors which condition the outcomes of the latter beyond the effects of the quality of educational institutions and teachers. National and international surveys on the quality of primary-level learning [PISA, INVALSI] not only confirm the important role played by the socio-economic context but also depict a highly diversified pattern in Italy – both geographically and by type of school [Montanaro 2008]. From this it follows that, in order to evaluate the quality of universities in terms of effectiveness and efficiency, account should be taken of the quality of the human capital entering the education system and of the role of contextual factors. So it should be possible to make a value added measurement of the university’s quality. This approach is largely restricted to the English-speaking countries. In the presence of significant differences among starting conditions, there is a risk that the superficial use of assessments based on outgoing performance indicators (e.g. graduates’ academic performance, graduates’ employment X years after graduation), and thus conditioned by the scant availability of information and its cost, will, on the one hand, reward universities which, though not particularly virtuous, enjoy more favourable conditions and, on the other, remove valuable resources – in a chronically under-funded system – from universities which, though situated in more disadvantaged areas, operate virtuously. Meritocratic criteria in the allocation of funds among schools 1 Francesco Ferrante, Università di Cassino e del Lazio Meridionale and ALMALAUREA Scientific Board, [email protected]
Silvia, Ghiselli, ALMALAUREA Interuniversity Consortium, [email protected]

2� Francesco Ferrante and Silvia Ghiselli
and universities which do not take account of these considerations, in the absence of effective tools to support the right to study (especially in the form of grants and an adequate university building programme), would exacerbate the polarization of Italy’s educational system. They would penalize the least mobile students, regardless of their talent, and especially those from the more disadvantaged social groups, and schools/universities in more backward areas independently of the merits/deficiencies of their personnel. These conclusions acquire greater value with the transition from tertiary education systems characterized by strong homogeneity among matriculants to systems with broader entry – like those towards which the OECD countries and Europe have been moving in the past twenty to thirty years, and which are inevitably characterized by greater heterogeneity. This prospect has been confirmed by the Europe 2020 document, which sets a 40% target for the proportion of graduates in the 30-34 age group. The aim of this paper is to assess graduates’ performance (regularity, employment status etc) after controlling for matriculants quality and the role of context factors. The assumption of this study, based on the ALMALAUREA data bank, is that students constitute both the fundamental input to tertiary educational processes and their output. Consequently, referring in abstract to the ‘quality of universities’ without considering the quality of their students at matriculation is methodologically inappropriate [Zhang, 2009], especially in the presence of high variability in the quality of secondary schools and of limited students’ geographical mobility. In order to control for the quality of the input it is necessary to detect a standardized and reliable measure of the matriculants’ skills and competences. The first candidate for this function is the high-school diploma grade. However, the PISA and INVALSI surveys raise doubts about its reliability. The empirical investigation here proposed is based on joint use of the CISIA test scores and of a normalized measure of the high-school diploma grade, as alternative measures of the quality of incoming students . The standardized CISIA test verifies the extent to which matriculants possess the basic skills (logic, mathematics and sciences). It has the merit of absorbing the effects and interactions between subjective traits and contextual factors, yielding a measure of cognitive and non-cognitive skills at an age when they should be consolidated and stabilized. AlmaLaurea is a public consortium of 64 Universities (collecting the curricula of the 80% of graduates in Italy). AlmaLaurea analyzes every year graduates' characteristics and performances, allowing a direct comparison between different courses, faculties and universities and examines employment opportunities of graduates 1, 3 and 5 years after graduation. The 2013 Survey [ALMALAUREA 2013] involves almost 227.000 graduates of the year 2012.
References
1. ALMALAUREA: XV indagine - Profilo dei Laureati 2012. Scelte, processi, esiti nell'istruzione universitaria (2013). Available on www.almalaurea.it/universita/profilo/profilo2012
2. ALMALAUREA: XV Indagine - Condizione occupazionale dei laureati. Investire nei giovani: se non ora, quando? (2013). Available on www.almalaurea.it/universita/occupazione/ occupazione11
3. Cunha F. and Heckman J.: The Technology of Skill Formation. In: American Economic Review, vol. 97(2): 31-47 (2007)
4. Montanaro P.: I divari territoriali nella preparazione degli studenti italiani: evidenze dalle indagini nazionali e internazionali. In: Banca d’Italia, Questioni di Economia e Finanza, n. 14 (2008)

Assessing the quality of universities: a value added approach 3�
5. Zhang J.: A value-added estimate of higher education quality of US states. In: Education Economics, vol. 17(4): 469-89 (2009)

Componential Segmentation based Conjoint
Analysis: the Dummy-coded Parametrization of
the Model
Amedeo De Luca
Abstract. In componential segmentation (CS) each component of each consumer
profile, considered jointly with each component of the product profile, is supposed to
contribute to the overall evaluation of the product. The CS focuses on the effect of
interactions between the product profile, x, and the person profile z (a vector of
dummy variables that describes the person in terms of a certain set of background
characteristics ) on preference for the product. A consumer’s reaction to a product is
broken into the sum of two components: 1) the average part-worth utilities due to the
attribute levels of that product (pooled across all persons) and 2) the interactions
between the consumer’s background variables and the attribute levels.
The multivariate regression model is estimated by the metric approach to COA and
in two steps. First step: modelization of the preference and estimation of part-worth;
second step: explanation of B by background variables. The model is the following:
were: X = design matrix; B = matrix of utility coefficients; Z' = matrix of socio-
demographic characteristics in binary coding; . E and F = error matrix; Q = number
stimuli, G = number judgments; K = number levels; S = number socio-demographic
group Each value , generic term of , can be interpreted as a measure of the
preference of the s-th socio-demographic group for the k-th attribute level.
We provide an application of the model and an interpretation of interaction effects.
1 Amedeo De Luca, Università Cattolica del Sacro Cuore di Milano, Dipartimento di
Scienze Statistiche; email: [email protected]

Confidence intervals for ranks with applicationto performance indicators
Erik van Zwet, Rosa Meier, Aldo Solari and Jelle Goeman
Abstract Ranks are notoriously difficult to estimate, yet there is a growing demandto rank health care providers on the basis of certain ”performance indicators”. It istherefore very important to convey the uncertainty in a ranking to decision makersby providing them with confidence intervals.We propose a method to construct confidence intervals for ranks that have simul-taneous coverage of 95%. Simultaneous confidence intervals are appropriate when,for instance, one is interested in the ten worst performing centres.We contrast our approach with the Empirical Bayes method which is often em-ployed. Our approach is based on a fixed effects model and on testing multiplecomparisons, while Empirical Bayes is based on a random effects model. Applica-tion of the Empirical Bayes approach leads to shrinkage of the centre effects to acommon mean. This has definite advantages, but also produces some difficulties.Our approach is targeted to avoid these problems. We demonstrate on a large dataset from the Netherlands.
Key words: multiple comparisons, performance indicators, ranks, simultaneousconfidence intervals
Erik van ZwetMSBI, Leiden University Medical Centre, The Netherlands, e-mail: E.W.van [email protected]
Rosa MeierMSBI, Leiden University Medical Centre, The Netherlands, e-mail: [email protected]
Aldo SolariDEMS, University Milano-Bicocca, Italy, e-mail: [email protected]
Jelle GoemanMSBI, Leiden University Medical Centre, The Netherlands, e-mail: [email protected]
1

Do students answer correctly? An empirical
study using Rasch and CUB models
F. D. d'Ovidio, D. Leogrande, R. Mancarella, A. Schinzano1
Abstract The main purpose of this study is to analyze student satisfaction on the
quality of teaching services and dedicated structures of the University of Bari, in order
to support this Institution in its investment decisions.
However, being well-know that latent factors such as uncertainty and feelings can
influence people’s answers, it’s very important to identify the statistical tool that can
better verify the existence of possible violations of answer coherence principles. So, in
this study, Rasch models and CUB models are applied to a large databases containing
evaluations provided by all students of the University of Bari during several academic
years, and then their results are compared.
Topics: Education
References
1. Cicia G., Corduas M., Del Giudice T., Piccolo D. (2008) L’analisi delle preferenze dei consumatori nei confronti delle produzioni di qualità: uno studio del consumo di caffè equosolidale mediante il modello CUB, SIDEA Meeting, Portici, 25-27 September 2008.
2. Kass G. V. (1980) An Exploratory Technique for Investigating Large Quantities of Categorical Data, Journal of Applied Statistics, Vol. 29, 2: 119-127.
1 Francesco Domenico d’0vidio Department of Economics and Mathematics, University of Bari
Aldo Moro [email protected]
Domenico Leogrande Department of Private Law and Business Studies, University of Bari Aldo
Moro [email protected]
Rossana Mancarella Department of Private Law and Business Studies, University of Bari Aldo Moro [email protected]
Andrea Schinzano Department of Private Law and Business Studies, University of Bari Aldo
Moro [email protected]

3. Iannario M., Piccolo D. (2009c) A program in R for CUB models inference, Version 2.0, available at http://www.dipstat.unina.it, this paper.
4. Iannario M., Piccolo D. (2010a) A new statistical model for the analysis of customer satisfaction, Quality Technology and Quantitative Management, 7, 149–168

Efficiency comparison on administrative business
regulation in the G20 economies
Antonio Pavone e Paola Pianura
Abstract This paper focuses on the G20 economies, split into mature markets (MMs)
and rapid growth markets (RGMs), according to the International Monetary Fund
definition of “advanced economies” and “emerging and developing economies” The
aim is to evaluate their administrative business regulation efficiency in term of two
components: efficiency spread in each market group and differences between the best-
practice frontiers of each market group. We collect data from Doing Business Survey
by World Bank, referring to two topics used to evaluate administrative compliance for
businesses: starting a business and trading across borders (divided in import and export
components), in the pooled period 2007 - 2012, in order to have a reasonable number of
observations to make a meaningful evaluation.
To measure efficiency we apply a nonparametric method based on envelopment
techniques.
The empirical analysis suggests two broad conclusions. In terms of within-market
group, seems that RGMs exhibit a small dispersion of efficiency spreads of levels
among countries respect to MMs at least for starting a business. This is likely to be a
result of internal ability to reduce business administrative burdens. However, the group
efficiency component is the major determinant of performance in business regulation
that makes differences between two market groups.
Exploring ICT infrastructure data, statistic comparison suggest that: MMs are more
active in keeping up with new technologies rather than exploiting their existing
production potential, while, RGMs use traditional way to comply, determining high
administrative cost, time and procedures for businesses.
1 Antonio Pavone, Italian National Institute of Statistics, [email protected]
Paola Pianura, Italian National Institute of Statistics, [email protected]

Estimating technical efficiency in the ItalianMunicipalities: a robust non-parametricapproach
Claudia Settimi, Francesco Vidoli, Elisa Fusco and Danilo Ballanti
Abstract The focus of public national account systems in the last decades is shift-ing to the need, both in the short term, but especially in the medium-long term, tobuild stable, flexible and proactive control spending systems, both at central leveland, mainly, at local level [1].Given these constraints, for governments the real challenge is to build spendingperequation and account control systems that allow to maintain the levels of pub-lic service, as much as possible, unchanged by minimizing the overspending due toinefficiency, incorrect allocations of production factors or chronic misalignments inoptimal Local Authorities sizing.Due to these needs, an innovative autonomy path for Local Authorities has startedin Italy in 2009 linked to a fundamental change in the funding criteria. The statutorylaw on fiscal federalism (Law No. 42, May 5th 2009) and the determination of stan-dard requirements for Local Authorities (Municipalities, Provinces and Metropoli-tan cities) issued through Legislative Decree No. 216, November 26th 2010, areallowing to modernize intergovernmental financial relations and to minimize LocalAuthorities cost (overall 77 billion Euro in 2010, equal to 5% of GDP and 10% ofconsolidated public spending).This constitutional reform intersects, also, with a more contingent need caused bythe structural Italian public finances imbalances, removing disparity conditions aterritorial and national level. In 2012 the Legislative Decree No. 95 (also called”spending review”) emphasized the need to adopt in the short term ”urgent measuresfor the reduction of public spending keeping constant level of services”. However,efficiency analysis and local grants perequation criteria still remain separated bothin the theoretical systematization and in the practical implementation.The main aim of this paper is, therefore, to estimate with a robust nonparametricmethodology [2] the technical efficiency of the services provided by General Regis-ter Offices for the year 2009; in particular labour-capital input and output - services
SOSE, Soluzioni per il Sistema Economico, Via M. Maggini 48c, Roma, ItalyClaudia Settimi e-mail: [email protected] · Francesco Vidoli e-mail: [email protected] · Elisa Fuscoe-mail: [email protected] · Danilo Ballanti e-mail: [email protected]
1

2 Claudia Settimi, Francesco Vidoli, Elisa Fusco and Danilo Ballanti
has been measured for each Italian Municipality through a specific questionnairerealized by SOSE in partnership with IFEL [3]. The collected data, in conjunctionwith the expenditure information and supply and demand contextual factors, repre-sent an unique, very recent and detailed database on all 6,712 Italian municipalities.
Key words: Public governments expenditure needs, Technical efficiency, Nonpara-metric frontier, Robust estimation
References
1. Blochliger, H., Merk, O., Charbit, C., Mizell, L.: Fiscal equalization in oecd countries. Tech.rep., OECD network on fiscal relations across levels of government, Working paper , n. 4 (2007)
2. Daraio, C., Simar, L.: Advanced Robust and Nonparametric Methods in Efficiency Analysis.Springer (2007)
3. SOSE: Fc01c questionnaire. http://tinyurl.com/FC01C-questionnaire

Evaluating inter-rater agreement for ordinal
data: A comparison of weighted indexes
Enrico Ripamonti and Piero Quatto
Abstract In this paper we use a database of evaluation of University courses by the
University of Milan-Bicocca. Our goal is to calculate a satisfaction index, and a
measure of inter-rater agreement between observers. We introduce a new version of the
s statistic for ordinal data and we compare the use of different weightings.
1 Introduction
As for the accreditation of university courses, Italy is adapting to the standards
of other European countries. The ANVUR (National Agency for the Evaluation
of the University System and Research) is aligning itself to numerous other
agencies already existing in Europe, which have been established after the
agreements of Bergen in 2005 (Bergen Communiqué). The accreditation
process will have its official launch for the academic year 2013-14 following
the criteria, indicators and benchmarks prepared by the same ANVUR
(ANVUR, Final Document, 2012). This process aims at compelling Italian
universities to adopt effective tools to improve services offered to students and
society. In this context of self-assessment and evaluation, particular importance
is given to questionnaires designed to detect the satisfaction of undergraduate
and graduate students as far as the quality of teaching is concerned (ANVUR,
Annexes to the Final Document, 2012).
2 Aims of this paper
In this paper we consider the questionnaires compiled by students of the
Bachelor of Science and of the Master of Science in Statistics and Economics
at the University of Milan-Bicocca, in the academic year 2011-12. We focus on
two questions on teachers, which also appear in the new questionnaires
designed by the ANVUR. Our goal is to measure the satisfaction of students
with respect to the performance of their teachers. Besides a measure of
satisfaction, we need measures of inter-rater agreement. From one hand, if such
agreement is weak, there is a dissemination of judgments, and this lowers the
strength of the satisfaction index. From the other hand, in the case of high
concordance, responses are compact in one of two directions: either towards
1 Enrico Ripamonti, Department of Economics, Statistics and Management, University
of Milan-Bicocca, [email protected]
Piero Quatto, Department of Economics, Statistics and Management, University of
Milan-Bicocca, [email protected]

2� Enrico Ripamonti and Piero Quatto
satisfaction, or towards dissatisfaction. In this paper we have compared several
measures of inter-rater agreement.
3 A comparison of weighted indexes
As a measure of agreement, it has been proposed to use the s statistic (Quatto,
2004) which has been derived as an alternative to the kappa statistic (Fleiss,
1971 Fleiss et al. , 2003). Both these statistics measure the agreement between
multiple observers and multiple categories. The kappa statistics, even if well-
known in several applied contexts, has been shown to be affected by some
important paradoxes (Feinstein and Cicchetti, 1990); these problems are solved
using the s statistic. Nevertheless s has some drawbacks as well, such as the
fact that it does not take into account the use of an ordinal scale. We have
generalized the s statistic to the case of ordinal variables and with a different
number of examiners for each row. This has been done introducing appropriate
weightings, taking into account the variability of the ordinal scale. In
particular, we have compared the use of: (i) linear weights; (ii) truncated linear
weights; (iii) quadratic weights; (iv) weights dependent from a measure of
ordinal dispersion (Leti, 1983). Last, this new statistic, used as a descriptive
measure of concordance, has been applied to the database available from the
University of Milan-Bicocca.
References
1. ANVUR, Final document, http://www.anvur.org/, 2012
2. Bergen Communiqué, http://www.processodibologna.it/, 2005
3. Feinstein, A.R. and Cicchetti, D.V. High agreement but low kappa: I.
The problems of two paradoxes. Journal of Clinical Epidemiology,
43, 543--549 (1990)
4. Fleiss J.L. Measuring nominal scale agreement among many raters,
Psychological Bulletin, 76, 378--382 (1971)
5. Fleiss J.L., Levine B., Paik M.C. Statistical Methods for Rates and
Proportions. John Wiley & Sons, Hoboken (2003)
6. Leti G. Statistica descrittiva. Il Mulino, Bologna (1983)
7. Quatto P. Un test di concordanza tra più esaminatori. Statistica,
LXIV, 1, 145—151 (2004)

Evaluating the current evolution of GDP towards quality
Antonio Frenda1, Valentino Piana
2, Sergio Scippacercola
3
Abstract
The Quality Domestic Product (QDP) is the measurement of the share of Gross Domestic Product (GDP) recognized as characterized by “high quality”, leaving the rest in the category of “low quality”, providing a metrics for evaluating the effectiveness of policies aimed ad restructuring GDP by increasing its “high quality” component.
New procedures to obtain disaggregated sectorial estimations of medium-to-long-term components are proposed and tested, based on the New Eurocoin indicator (NE), the real time indicator for the Euro area, published monthly by the Banca d’Italia and CEPR, which provides a summary index of the medium to long-run component (MLRG) of the whole GDP for the entire aggregate Euro area.
Estimations of NE are obtained through the generalized dynamic factor model. These models allow a net reduction of the cross-sectional size of the dataset. Since New Eurocoin indicator provides a summary index of the medium to long-run component (MLRG) of the GDP solely for the whole Euro area aggregate, the main empirical contribution of this research, extending Altissimo et al. (2009), Forni et al. (2005), is to propose some procedures to estimate the sectoral smoothed growths of disaggregated components of European GDP.
We focus on medium to long-run component of the growth (MLRG), i.e. the smoothed component of the GDP growth rate obtained by removing the fluctuations of a period shorter than (or equal to) one year, without any relationship to any linear or non-linear definition of trend.
The Eurocoin approach is used in this paper to estimate monthly smoothed GDP components by added value sectors (industries). These values are couples with estimation of the corresponding share of high quality production, following the QDP methodology.
The GQP is a bottom-up computation of the split in total national monetary current-price GDP into two components: quality vs. non-quality. The starting level is the statistical sector, as defined at two-digit NACE classification, possibly with some aggregations. At this level, national updated statistics are available for value added. For each sector, an estimation of the quality share is carried out, with grand totals adding sectors and residuals (like certain taxes).
QDP represent a new way to look at a key macroeconomic variable as GDP by separating “what’s is well done” from what is not. In the methodology used in Siniscalco, Piana et al. (2007), a procedure to elicit from expert an estimation of sector share of quality (defined according to 5 key dimensions). In 2010, experts have been substituted by quantitative indicators, renouncing to the diversification of quality dimensions. In both cases, sectoral shares of good quality production have been obtained. By multiplying the shares for the nowcasting of the GDP sectors, one obtains the nowcasting of quality vs. non-quality production in the overall GDP month by month. Depending on data availability and the requirements, quality shares can be assumed constant for one year (and recomputed each year) or being nowcasted as well.
In synthesis, this paper couples for the first time a new nowcasting technique with a quality-oriented analysis of GDP to provide citizen-satisfaction-oriented policymakers a tracking tool for their policies and innovations.
Main references
Altissimo F., R. Cristadoro, R. Forni, M. Lippi, G. Veronese: New Eurocoin: tracking economic growth in real time, CEPR
Discussion Paper 5633 (2006).
Forni, M., M. Hallin, M. Lippi, and L. Reichlin: The generalized dynamic factor model: one-sided estimation and forecasting.
Journal of the American Statistical Association, 100, 830-840 (2005).
Piana V.: Gross domestic product, quoted in European Parliament (2007).
Piana V.: Bringing heterodox recipes to policymakers: the case of “Innovative Economic Policies for Climate Change
Mitigation”, University IV of Bordeaux – The 12th Annual Conference of the Association of Heterodox Economics, The
Economy of Tomorrow (2010).
Siniscalco D., Piana V., et al.: PIQ – Prodotto Interno Qualità 2007, retrieved from
http://www.symbola.net/din/adminphp/doc/PIQ%20-%20def.%2026.05.06.pdf (2007).
1 Antonio Frenda, Member of Italian Statistical Society (SIS)
2 Valentino Piana, Economics Web Institute
3 S. Scippacercola, Economics, Management, Institutions Department, “Federico II” University (Naples)

Evaluating the financial literacy in Italy.
Paola Bongini, Paolo Trivellato and Mariangela Zenga
Abstract In recent years, financial literacy has gained the attention of a wide rangeof organizations, both at the national level - policymakers and financial regulatoryauthorities - and at the international level, with the OECD leading the way with itsInternational Gateway for Financial Education (IGFE) and the International Net-work on Financial Education (INFE). Interested groups are concerned that con-sumers may lack the minimum knowledge of financial concepts to be able to makeinformed financial decisions in their day-by-day life, namely: budgeting; managingmoney, credit and debt effectively; assessing needs for insurance and protection;evaluating the different risks and returns involved in savings and investment op-tions; saving for long-term goals. Such lack of financial literacy has been widelyacknowledged as an aggravating factor of the recent financial crisis (OECD-INFE,2009). At the same time, the crisis has exacerbated the risks that less financially lit-erate consumers face: lacking the sophistication required to absorb financial shocks,they are more vulnerable to financial market fluctuations.In this work we will evaluate the financial literacy in Italy, showing the results ofthe survey Indice di Cultura Finanziaria 2013 promoted by Pattichiari.
Key words: financial literacy, Italian adults, Indice di cultura Finanziaria 2013.
References
1. OECD-INFE: Financial education and the crisis. Policy paper and guidance. (2009)
Paola Bongini, Paolo Trivellato and Mariangela ZengaMilano Bicocca University, Via B. degli Arcimboldi , 8, Milano, Italy e-mail: [email protected]
1

Evaluation of University Human Capital: knowledge accumulation estimation in a real case Anna Simonetto1
Emma Zavarrone 2
Keywords: University human capital, Latent growth model, Gompertz curve, Structural Equation Model, Cluster Analysis
Abstract: Human capital can be evaluated from many points of view. One aspect that is gaining more and more importance is the assessment of the acquisition of academic knowledge. It is a major challenge for both the academic world, as it allows to improve the educational processes, and the employment’s world, which is increasingly interested to be able to discriminate between the various candidates. The difficulties of this approach are innumerable. Obviously there are many aspects that contribute to the assessment of capital university, some of that can be easily measured with the objective data of students’ careers, other aspects should be investigated with appropriate techniques to consider the time-variant nature of such data.
The goal of our work is to implement different latent variable models to analyze the trend of university knowledge acquisition, assessing its stability over time (referring to different cohorts of students), and to study the characteristics of the different types of students identified in the analysis. We will focus on the latent growth curves to model the latent change in University Human Capital from one time to another. We will use the latent Gompertz curve to model the acquisition of UHC over time by individual students:
�� = 1 ∗ �� + � ∗ � + �� = 1,2, … , �
� = exp �−exp�α ∗ �i − λ��� = 1,2,… , �.
��� = 1,2,… , �� are the � temporal splits, α is the rate of change, λ represents the time at which maximum growth rate occurs, �� is the lower asymptote, and ��� + �� is the upper asymptotic value of the function. In a second phase, we use the UHC estimates to cluster students.
In literature, there are some similar studies, but mainly referring to scientific degree courses, while in our work, we will focus on the real data of a faculty of humanistic studies.
1 Department of Economics and Management, University of Brescia, e-mail: [email protected]
2 Department of Communication, Behaviour and Consumption “Giampaolo Fabris”, IULM University, e-
mail: [email protected]

Evaluation indices of the judicial system and ITC
developments in civil procedure
Carlo Cusatelli, Massimiliano Giacalone
Abstract The reform that by Presidential Decree (13th February 2001, n. 123)
introduced “telematics civil procedure” in our system has the objective of a more
efficient and rapid justice. The combination of justice and Information and
Communications Technology is now a path to be not only in terms of functionality and
cost management, but also to adjust the Italian quality standards respect to the other
European states. From the statistical point of view as an indirect measure of the
judiciary evaluation, we analyze the indices of average length in the various
proceedings, as the main tool for assessing the efficiency court, noting the repeated
condemnations against the Italian state, by the European Court of Human Rights, for
failure to comply with the principle of reasonable duration of the process. Then we
analyze some of the data relating to the average duration of proceedings in Italy in the
various proceedings, a further confirmation of the unfortunate situation that our country
is facing on the topic of judicial authority. Finally, it is shown telematics civil
procedure in its architecture, in its draft implementation and benefits arising from its
actual use.
References
1 Amendolagine V.: Processo civile - le novità del decreto crescita, Ipsoa (2012)
2 Aubyn M. St.: Law and Order Efficiency Measurement - A Literature Review, Iseg, WP n.
19 (2008)
3 Bassoli E.: Lezioni di diritto dell’informatica ed elementi di informatica giuridica. ECIG,
Genova (2009)
1 Carlo Cusatelli, Jonico Department, Bari University “Aldo Moro”; email:
Massimiliano Giacalone, Bologna University “Alma Mater Studiorum”; email:

2� Name of First Author and Name of Second Author
4 CEPEJ (European Commission for the Efficiency of Justice). European judicial systems:
Efficiency and quality of justice, 2010 data. Council of Europe Publishing, Strasbourg
(2012)
5 D'Agostini D.: L'informatica negli studi legali e nel processo civile, Experta (2005)
6 Kessler D.P., Rubinfeld D.L.: Empirical study of the civil justice system, NBER WP
n.10825 (2004)
7 MIPA - Consorzio per lo sviluppo delle metodologie e delle innovazioni nelle pubbliche
amministrazioni: Sistemi giudiziari e statistiche in Europa. Indicatori di funzionamento e
statistiche ufficiali: un confronto tra paesi europei. Roma: Istat (2004)

Examination of collaborations between universities and companies
Peter Kovacs and Marton Vilmanyi
Abstract
The effectiveness and manageability of collaborations between universities and companies are extremely significant in the
period when cooperative R&D projects enjoy increased support. University-corporate relationships may imply a lot of
advantages that can yield significant potential added value for all participants. This added value can be translated as
contribution to human resource development, access to additional resources, learning impacts, other social gains, or the sum
of the synergies of all these benefits. The precondition for the success of these unique business-nonbusiness collaborations is
the management of projects implemented within the framework of cooperation, as well as the management of the entire cooperation.
We adapt the performance management’s performance-approach to examine collaborations between universities and
companies, thus as a new approach we model the effectiveness of collaborations after the conception of collaboration performance.
Our study focuses on this latter issue. By interpreting the results of empirical research, and by using the tools of relationship
marketing we are trying to find the answer to the question whether (governmental, regional, institution or other) programmes
designed to enhance the closeness of cooperation improve the effectiveness of university-corporate collaborations in economic terms.
As a starting point of our analysis we conducted a pilot research on the relationship portfolio of the University of Szeged
during 2007 and 2013. During the analysis we applied a dual approach, which means that the relationship between the
effectiveness of cooperation and the closeness of cooperation was studied not only from the viewpoint of the corporate, or
university party, but from both viewpoints in parallel. In addition to answering this question, this paper pays special attention
to the study of the possible gains of university-corporate cooperation, to the components of effective cooperation, as well as to the interpretability of the closeness of cooperation in relation to these two sectors.
1 Peter Kovacs, associate professor, University of Szeged, Faculty of Economics and Business Administration, Hungary, email:
Marton Vilmanyi, associate professor, University of Szeged, Faculty of Economics and Business Administration, Hungary;
email: [email protected]
Footnotes

Hospitalization in geriatric wards:considerations on the evaluation of the outcome
Franca Crippa, Adele H.Marshall, Gianluca Merchich and Mariangela Zenga
Abstract Within a defined law framework, the Italian central health system dictatesthe standards for hospitalization to local care units, which are in turn allowed toestablish their own effectiveness criteria. The appropriateness of the hospitalisationdecision is therefore predetermined at patients admission, whereas its effectivenessrelies on the ex post patient well-being as a result of the complex system of recipro-cal relations between patients and healthcare agents at the ward level. We considerthe outcomes in geriatric wards referring to the national health system, with respectboth to patients traits at the individual level and wards/hospital settings. The risk thatmodels the healthcare outcome is accordingly adjusted for covariates at the differentlevels of analysis (Goldstein and Spiegelhalter, 1996), thus allowing to differentiateamong outcomes in terms of the hospitalisation structure and, when appropriate, ofterritorial aggregation.
Key words: geriatric wards, risk adjustment, hierarchical model
Franca CrippaDepartment os Psychology, piazza dell’Ateneo Nuovo, 1, Milano, Italy e-mail:[email protected]
Adele H.MarshallQueens University of Belfast, University Road, Belfast BT7 1NN, UK e-mail:[email protected]
Gianluca Mercich Mariangela Zengavia B. degli Arcimboldi, 20126 Milano, Italy e-mail: [email protected]
Mariangela Zengavia B. degli Arcimboldi, 20126 Milano, Italy e-mail: [email protected]
1

Job opportunities and academic drop-out: thecase of the University of Trieste
Laura Chies, Grazia Graziosi and Francesco Pauli
We analyze the main determinants of the performance of university students en-rolled at the University of Trieste to a three-year degree course from 2003/04 to2010/11, with the main goal of determining the charactheristics of the students in-fluencing the drop-out probability at first year, defined as not enrolling to universityof Trieste for a second year.
We consider a data set built by collecting information on students enrolled forthe first time at the University of Trieste to a three-year course from 2003 to 2010from a set of administrative sources. In particular the information collected includethe academic career path of the students (enrollments, number and score of exams,...), socioeconomic related information (on personal income and university grants),past education performance (type and mark of high school degree). In addition, weconsider the job position of the students (whether they work, how many days andwhich type of contract) as available from Ergon@t, the administrative dataset ofFVg region.
A total of 23665 students is considered, overall 18.9% are drop-outs, the drop-out rate per Faculty is ranging from 6.4% to 28.1%. The probability of drop-out willbe modeled as a function of the characteristics of the students and of the Facultythey are enrolled to, focusing in particular on the heterogeneity of effects betweenFaculties and will be pursued by means of a hierarchical generalized linear model,the response being the drop-out as defined above. Issues related to the selection ofexplanatory variables will be discussed.
Laura ChiesDEAMS, University of Trieste, via Valerio 1, e-mail: [email protected]
Grazia GraziosiDEAMS, University of Trieste, via Valerio 1, e-mail: [email protected]
Francesco PauliDEAMS, University of Trieste, via Valerio 1, e-mail: [email protected]
1

Longitudinal Analysis of Post-diploma Orientation
among Young People of Bari
M. Basile1, F. D. d'Ovidio
2
1 Language and Technical-Economic State High School “Marco Polo” [email protected] 2 Department of Economics and Mathematics, University of Bari Aldo Moro [email protected]
The aim of this paper is the analysis of the current status in the final year of secondary
school degree. It aims to guide pupils in order to take a well weighted decision.
It is known that students are confused at the end of the secondary education and are
unable to get a clear view of the landscape and the opportunities that exist in the academic
world or in the work market.
Objectives of the present research work are to give a tool to students to take well
weighted decision regarding their professional and future studies, through variance analysis
between what was declared by interviewed people (ex-ante survey) and the effective choice
at the end of the study cycle (ex-post choice). It was identified an educational continuity
between the secondary school level, the world of work and / or the university system.
An easy indicator was introduced in order to measure the coherence between ex-ante
questions and the final choices after first diploma. This indicator was placed at the base of
the subsequent multivariate analysis methodology in order to identify a forecasting model.
References
BREIMAN L., FRIEDMAN J.H., OLSHEN R.A., STONE C.J. (1984) Classification and Regression Trees, Chapman & Hall, New York-London.
DE LEEUW J., YOUNG F.W., TAKANE Y. (1976) Additive Structure in Qualitative Data: an Alternative Least Squares Method with Optimal Scaling Features. Psychometrika, 41: 471-504.
EDELMAN G. (1998)“Neural Darwinism. The theory of neuronal group selection”, 1998. GIFI A. (1981) Nonlinear Multivariate Analysis, Department of Data Theory, University of Leiden, The
Netherlands. KASS G. V. (1980). An Exploratory Technique for Investigating Large Quantities of Categorical Data, Journal of
Applied Statistics, Vol. 29, 2: 119-127. LEIBOLD C. (2004) Stability Analysis of Asynchronous States in Neuronal Networks with Conductance-Based
Inhibition”, 2004.
Topic: Education

Migration policy: An assessment on the North
Africa emergency provisions.
Lucia dalla Pellegrina, Margherita Saraceno, and Mattia Suardi
Abstract
Emergency rules temporary changing migration >regulation can be seen as natural
experiments which can be exploited to assess effectiveness of migration policies. In 2011,
the Italian Government released the North Africa Emergency Provisions (ENA) temporary
relaxing immigration policies for refugees fled to Italy as a consequence of the Arab
Spring and the Libyan civil war in 2011. To take advantage of this experimental
opportunity, we run difference-in-differences regressions on an original dataset to estimate
the effects of ENA provisions on the probability of obtaining a permit of stay. The dataset
includes micro-data self-collected from an important charity in Milan (Casa della Carità)
which regularly provides migrants with legal assistance so as to help them to comply with
immigration rules. Estimates show that the provisions actually increased the number of
permits of stay to migrants entitled to ENA benefits. On the other hand, however, migrants
who were not entitled to such provisions suffered from exacerbated difficulties in
complying with standard regulation.
1 Lucia dalla Pellegrina, DEMS, University of Milano-Bicocca and “Paolo Baffi” Center, Università
Bocconi; [email protected]
Margherita Saraceno, DEMS, University of Milano-Bicocca and Amsterdam Center for Law and
Economics, University of Amsterdam; [email protected]
Mattia Suardi, IUSS Pavia, [email protected]

Multivariate analysis for the ex post evaluation of the environmental fiscal
reform: a methodological proposal
Arbolino R., Romano O.
Abstract:
The environmental fiscal reform includes several measures such as taxes, subsidies, investment
incentives, aimed at reducing the negative consequences on the environment from productive and
others activities, and at achieving jointly economy policy goals, such as promoting employment
through the reduction of taxes on labour.
Although from the theoretical point of view, the benefits of the reform are undeniable. An issue of
ex post valuation that would allow for the objective estimation of the social environmental and
economic and economic results still persists. This is mainly due to the fact that the integration
moony fiscal tools do not allow at isolating the impact on pre-defined objectives.
The aim of the paper is to show how the multivariate analysis could be usefully employed for the
qualitative, multi-criteria and multi-objective evaluation of possible strategies of action relating to
environmental fiscal reform at European level.
The evaluation of a reform in fact requires a careful analysis of the current situation, the evolution
trends, the strengths and weaknesses with respect to the possible development strategies.
The proposed approach aims at verifying the effectiveness of this complex phenomenon - through
the use of factor analysis and cluster analysis - in order to make a comparison between the ex ante
situation and the changes obtained in terms of achieved after the implementation of the reform.
The comparison, based on a careful analysis of the choice of indicators for the identification of
relevant factors, will represent a quantitative basis on which to rely for necessary changes to get the
desirable output.
1 Roberta Arbolino, Università degli Studi di Napoli “L’Orientale”, Department of Social and Human Science, [email protected]
Oriana Romano, Università degli Studi di Napoli “L’Orientale”, Department of Social and Human Science, [email protected]
Footnotes

On measuring polarization for ordinal data: an application to
self-reported health data
Mauro Mussini1
Statistics surveys frequently comprise one or more questions asking respondent to self-assess his
status (e.g., health, well-being, satisfaction) by choosing a response category from a set of ordered
categories. When analysing polarization in the distribution of an ordinal variable, one approach
consists of imposing cardinality on ordinal categories in order to calculate synthetic measures.
However, Apouey (2007) argues that transforming ordinal data into cardinal data is a supra-ordinal
assumption, and proposes bi-polarization indices which do not require supra-ordinal assumptions.
The concept of bi-polarization differs from that of polarization, since the latter is the tendency of
grouping around local poles (Deutsch et al., 2013) which can be more than two and different from
the extreme categories.
Polarization is a relevant topic in studies on income distribution (Esteban and Ray, 1994; Duclos et
al., 2004) and its original notion is related to the concept of identification-alienation: individuals
identify themselves with those having similar income levels, whereas they feel alienated from those
with different income levels. When attention is focused on measuring polarization for ordinal data,
Fusco and Silber (2011) note that polarization arises when groups of individuals characterized by
within-group homogeneity (identification) and between-group heterogeneity (alienation) are
observable. Following this approach, the situations of minimum and maximum polarization can be
defined by assuming that groups are established a priori. Polarization is minimal if each group
shows the same distribution of individuals among the various ordered categories; that is, if an
individual cannot identify himself with the members of his group or distinguish himself from those
of the other groups. Polarization is maximal if all the individuals within a group belong to the same
ordered category differing by group; that is, if an individual can perfectly identify himself with the
members of his group and feel alienated from those of the other groups. This approach based on
within-group homogeneity and between-group heterogeneity is in line with that suggested by Zhang
and Kanbur (2001) for measuring income polarization.
Grilli and Rampichini (2002) decomposed the Leti index of heterogeneity (Leti, 1983) into two
components: a within-group component measuring heterogeneity within groups, and a between-
group component measuring heterogeneity between groups. The ratio of the between-group
component to the overall index can be interpreted as a measure of polarization. This polarization
measure equals 0 if polarization is minimal and 1 if polarization is maximal; moreover, it does not
require transforming ordinal data into cardinal data. An application to Italian survey data on self-
reported health status is shown.
Essential references
Apouey, B. (2007) Measuring health polarization with self-assessed health data, Health Economics,
16, 875-894.
Deutsch, J., Fusco, A. and Silber, J. (2012) The BIP trilogy (Bipolarization, Inequality and
Polarization): one saga but three different stories, Economics, Discussion Paper No. 2012-
49. Available at http://www.economics-ejournal.org/economics/journalarticles/2013-22
1 Mauro Mussini; Dipartimento di Economia, Metodi Quantitativi e Strategie di Impresa, Università degli Studi di
Milano Bicocca, Piazza dell'Ateneo Nuovo, 1 - 20126, Milano (Italy); e-mail: [email protected]

Duclos, J. Y., Esteban, J. M. and Ray, D. (2004) Polarization: Concepts, measurement, estimation,
Econometrica, 72, 1737-72.
Esteban, J. M. and Ray, D. (1994) On the measurement of polarization, Econometrica, 62, 819-51.
Fusco, A. and Silber, J. (2011) Ordinal Variables and the Measurement of Polarization, CEPS
Working Paper No 2001-33, Luxembourg.
Grilli, L. and Rampichini, C. (2002) Scomposizione della dispersione per variabili statistiche
ordinali, Statistica, 62, 111-116.
Leti, G. (1983) Statistica descrittiva, il Mulino, Bologna.
Wolfson, M. C. (1994) When inequalities diverge? American Economic Review, 84, 353-58.
Zhang, X. and Kanbur, R. (2001) What difference do polarization measures make? An application
to China, Journal of Development Studies, 37, 85-98.

Outsourcing services in the Italian National Health
Service: the satisfaction of private and public
operators.
Paolo Mariani, Rosa Falotico and Biancamaria Zavanella
Abstract Outsourcing has shown itself worldwide to be a useful tool for improving
partnership between private and public companies. The budgetary constraints imposed by
the Italian government on health industry are enhancing the urgency to outsource to face
costs. Our study deals with the relationship between ASLs (Aziende Sanitarie Locali, the
Italian local health authority) and private operators outsourcing in Italy.
We studied 44 pharmaceutical companies (with a yearly turnover of about € 6 billion) and
34 ASLs (with about 12 million users) to find out the areas in which they used
outsourcing, the amount and the frequency of such investment, their satisfaction and,
therefore, their future intentions. We analysed the answers in search for possible
relationships between location, size, frequency of use and other features to uncover a
possible convergence between public and private interest in outsourcing.
To better evaluate the convergence we analyse and compare satisfaction of both the
operators involved in outsourcing (ASL and private operators). We aim to offer a
representation of the current state of outsourcing in the Italian Healthcare System and a
first indication of possible contrasts in the relationship between public and private
partners. The results suggest that public and private operator have a different satisfaction
level and in particular their expectations are in contrast whit their satisfaction: ASLs that
are generally more satisfied than pharmaceutical companies, expect a considerable
reduction of outsourced, private companies less satisfied, provide an increase in these
activities.
References
1. Macinati MS. Outsourcing in the Italian National Health Service: findings from a national
survey. The International Journal of Health Planning and Management 2008.
2. Mariani P, Falotico R, Data G. Aziende Sanitarie Locali italiane: una lettura dai bandi di gara
pubblicati sul web. Tendenze Nuove 2011, 3: 145-160.
1 Paolo Mariani ,University of Milan-Bicocca, DEMS, [email protected]
Rosa Falotico,University of Milan-Bicocca, DEMS, [email protected]
Biancamaria Zavanella University of Milan-Bicocca, DEMS [email protected]

PLS path analysis and its application in an examination of
psychological sense of brand community
Klára Kazár
Abstract Latent variable modeling is an actual question in many fields in which
structural equation modeling (SEM) is frequently applied. Within the model family the
most popular techniques are the covariance based (CB-SEM) and the variance based
(PLS-SEM) methods; the latter is known as PLS path analysis or PLS regression,
which is less widely applied yet. The aim of this paper to give a short overview about
the PLS-SEM and introduce an application in the field of marketing. In the application
I would like to examine how can – a kind of brand community – the psychological
sense of brand community occur, and how the psychological sense of brand community
can influence loyalty. The results show that in the case of a music festival the
psychological sense of brand community influences the brand commitment, the loyalty
intentions and the word-of-mouth positively as well.
1 Klára Kazár, University of Szeged Faculty of Economics and Business Administration;
email: [email protected]

SOCIAL INITIATES INFLUENCE ON
CUSTOMER BEHAVIOUR: A STRUCTURAL
EQUATION MODEL
Boccia Flavio and Sarnacchiaro Pasquale
Abstract
Nowadays many companies make considerable efforts more and more to follow the
consumers’ preferences regard to their requirements and responsible initiatives, very
important in order to change the business strategies for better results. In recent years,
firms tend more and more to sponsor social and environmental and charitable activities
to improve their own image, but it is not always reflected in terms of benefits towards
consumers. Modern consumers have much more attention to social problems and
require that firms do not operate only in accordance with the logic of profit, but also to
improve social and environmental background. As a matter of fact, today people is
much in agreement about the need to take care of social problems. Therefore, it can say
that corporate social responsibility should not be understood simply as a cost or
constraint, but as a real investment from the perspective of functional marketing
strategies, which eventually contributes to the development of companies and creates
value for all stakeholders. So, the enterprise’s role has changed today, above all into
industrialized world: it is not only an economic institution, but also a social one, whose
decisions are of increasing importance for the welfare of community: it becomes an
organism that must take a more responsible behaviour in satisfaction of human needs. A
firm is responsible producing wealth and wellbeing, and contributing to create
1 Boccia Flavio, Assistant Professor - Economics and Law Department “Parthenope”
University of Naples (Italy); email: [email protected]
Sarnacchiaro Pasquale, Assistant Professor – Economics Department University of Rome Unitelma Sapienza (Italy); email: [email protected]

PAGE 2 Boccia Flavio and Sarnacchiaro Pasquale
economic and social contexts suitable for development. In the work, by administering a
questionnaire to consumers, authors have tried to assess the impact of responsible
initiatives solidarity on the consumers’ preferences. The conclusions are also a matter
for thought for further discussion. Therefore, it is important to underline that this study
really considers the behaviour that consumers in charge for purchasing have towards
food products meeting specific social responsibility requirements. For this reason, the
investigation was conducted through a sample size survey. The survey was carried out
by delivering a questionnaire: it was designed just to investigate the main aims
mentioned before. The analysis was carried out considering a representative sample of
332 families, selected on a functional relation to the objectives of the work in one of the
most important Italian city: Naples, in Campania Region. This survey had two main
aims. The first is to investigate consumers’ preferences regard responsible initiatives of
company. The second is to propose a structural equation model (SEM) to formalize the
origins of behaviours regarding consumers’ preferences towards responsible initiatives
and detect the drivers of their purchase.
References
Ackerman, R.W. (1975). The social challenge to business. Cambridge. MA: Harvard University
Press.
Becker-Olsen, K.L., Cudmore, B.A., Hill, R.P. (2006). The impact of perceived corporate social responsibility on consumer behavior. Journal of Business Research, 59(1), 46_53.
Bollen, K. A. (1989). Structural Equations with Latent Variables. New York: John Wiley & Sons.
Bollen, K. A., & Lennox, R. (1991). Conventional wisdom on measurement: A structural equation perspective. Psychological Bullettin, 110, 305–314.
Boccia, F., Sarno, V., (2013). Consumer perception and corporate social responsibility: An explorative survey on food Italian market. Quality - Access to Success, 14 (132), pp. 110-
112.
Campbell, J. L. (2007). Why would corporations behave in socially responsible ways? An institutional theory of corporate social responsibility. Academy of Management Review,
32(3), 946–967.
Covino, D., Boccia, F., Di Donato, S., Regazzi, D., (2008). Food quality and safety in agro-food system: Economic and technological innovations. Italian Journal of Agronomy, 3 (1
SUPPL.), pp. 173-190.
Creyer, E.H., Ross, W.T. (1997). The influence of firm behavior on purchase intention: Do consumers really care about business ethics? Journal of Consumer Marketing, 14(6),
421_432.
Jarvis, C. B., MacKenzie, S. B., & Podsakoff, P. M. (2003). A critical review of construct indicators and measurement model misspecification in marketing and consumer research.
Journal of Consumer Research, 30, 199–218.
Jones, T. M. (1995). Instrumental stakeholder theory: A synthesis of ethics and economics. Academy of Management Review, 20(2), 404–437.
Maignan, I., Ferrell, O. C. (2004). Corporate social responsibility and marketing: An integrative
framework. Journal of the Academy of Marketing Science, 32(1), 3_19. Schwartz, M., Carroll, A. (2003). Corporate social responsibility: A three-domain approach.
Business Ethics Quarterly, 13(4), 503_530.
Sen, S., Bhattacharya, C.B. (2001). Does doing good always lead to doing better? Consumer reactions to corporate social responsibility. Journal of Marketing Research, 38(2), 225_243.
Spiller, R. (2000). Ethical business and investment: A model for business and society. Journal of
Business Ethics, 27(1/2), 149–160. Swanson, D. L. (1995). Addressing a theoretical problem by reorienting the corporate social
performance model. Academy of Management Review, 20(1), 43_64.

Some Indicators for Tracking University StudentProgression
Giuseppe Boari, Gabriele Cantaluppi, Anna Torriero
Abstract We propose some indicators for assessing student progression in a uni-versity curriculum. Usually the survival ratio ny/n0 is computed at the end of eachyear, y = 1,2, . . ., with reference to the cohort of n0 students which enrolled at time0. The ratio is updated yearly and informs about the proportion of students expectedto complete their degree, but it does not allow for a thorough control of the academicprogression, e.g. in terms of ability to raise credits. To this aim, the distribution ofcredits might be considered for each year, thought it does not give any informationabout the student performance in taking exams. Moreover, in the Italian universitysystem, students can take exams over several sessions (at least two or three per year),each session including up to four dates.Given the survival ratio, we suggest to consider the percentiles of the distributionof the following two variables measured on students (i = 1, . . . ,n) who did not dropout from their starting cohort: ∑ j∈{1,2,...,J} ai j(s)c j and ∑ j∈{1,2,...,J} ai j(s)c jgi j.With reference to courses j = 1, . . . ,J the two variables describe at each sessions the total amount of credits and the total amount of credits×grades attained bystudents since their enrollment, being ai j(s) an indicator variable with value 1 ifstudent i passed exam j before session s. In this way progression growth curves canbe defined in order to both assess the speed in achieving credits and the student per-formance in taking exams. The simple inspection of the grade average would notremove the effect of the behaviour of students who remain enrolled but stopped tak-ing exams.Control charts defining student progression can be built and used for the continuousassessment of the efficiency of the course organization as requested e.g. by the AVA(Autovalutazione, Valutazione periodica, Accreditamento) evaluation system.
Giuseppe Boari · Gabriele CantaluppiDipartimento di Scienze statistiche, Universita Cattolica del Sacro Cuore, Milano, e-mail:{giuseppe.boari, gabriele.cantaluppi}@unicatt.it
Anna TorrieroDipartimento di Discipline matematiche, finanza matematica ed econometria, Universita Cattolicadel Sacro Cuore, Milano, e-mail: [email protected]
1

Statistical nomogram for the evaluation of mooring activities
in port areas
Giuseppe Raffaele1
Keywords: Pleasure Boating, Mooring Rate, Mooring Average Duration, Moorings Quotient of
Employment, Time Succession of Moorings, Index of Circular Motion, Statistical Nomogram of Port
Dynamism,
Abstract: In the nautical tourism, the pleasure boating sector is commonly considered a strategic resource.
This sector is part of a wide framework of integrated regional policies, aimed at making the pleasure boating
as a driving force for the essential development of some of the leading sectors of the world economy.
Pleasure boating, developed significantly only in the last 20 years, stands today for the high rates of
development, high performances and the capability to involve other closely linked areas, which together
constitute the economy of the sea: shipbuilding, touristic harbours, transport and tourism. Therefore, the
enhancement of pleasure boating includes the urgent need to develop an adequate statistical information for
the efficient organization of touristic harbours.
However, is important to note that in the economic and statistical literature do not exist, nowadays, specific
indicators and models to assess the mooring activity level in a touristic harbour. For this reason, the
statistical methodology, developed and discussed in this research work aims to define some innovative
statistical tools (indexes and models) that support researchers in the nautical tourism sector and the port
management in decision-making processes. These tools provide a synthetic and detailed representation of
the mooring activities and also allow a strategic assesment and management of the quality of the service
provided in a port area.
The so constructed model, named the Nomogram of Port Dynamism, is an appropriate statistical tool to
study many characteristics of nautical sector at the same time. This model offer an appropriate methodology
for the detection, description and prediction of the mobility of pleasure boaters mooring in a touristic
harbour. In particular, for the construction of the model five classes of statistical reports (Mooring Rate,
Mooring Average Duration, Moorings Quotient of Employment, Time Succession of Moorings, Index of
Circular Motion) were defined and formalized. Then, after identifying some algebraic relations between
these indicators, a geometric representation on a cartesian plane of the level curves has been formulated,
whose intersections have allowed to determine a grid (Nomogram) and a circumscribed space named
Efficiency Area (Fig.1).
So, Nomogram allows to the port management to:
photograph the port reality in some particular aspects;
estimate the flows of boaters who take turns on a mooring;
monitor analytically the evolution of mobility in the harbor for boaters in time;
evaluate the activities of a touristic harbour compared to other virtuous ports;
support the planning of improvement initiatives jointly evaluating efficiency and effectiveness;
plan focused policies in order to maximize the efficiency of the moorings in a financially sustainable
way.
Figure. 1: Nomogram of Port Dynamism.
1 Department of Management, Economics, Mathematics and Statistics, University of Salento, Italy, [email protected].

Marcantonio Caltabiano, Maria Gabriella Campolo and Antonino Di Pino1
Università degli Studi di Messina – Dipartimento SEAM
THE EFFECT OF RETIREMENT ON ITALIAN COUPLES’ LABOUR DIVISION: A SIMULTANEOUS
EQUATION APPROACH
Key words: Difference-in-Differences, Retirement, Intra-Household labour division, Gender attitudes,
Simultaneous equations
Abstract: Several studies found that Italian married or cohabiting women generally suffer a higher gender
gap in intra-household labour division than elsewhere in Europe (Anxo et al, 2011). However, in Italy as
well in other countries, the gendered division of labour is in part considered an effect of life course events, as
the birth of a child or the transition from cohabitation to marriage. The effect of retirement of one among the
partners on labour division has been investigated for the US (Szinovacz, 2000; Kahn et al., 2011), but (at the
best of our knowledge) this aspect has not been sufficiently analyzed for Italy.
The aim of this study is to use data on Italian couples from the Istat FFS-GGS survey for the years 2003
and 2007 to explore gender differences. We would like to examine the extent to which married or cohabiting
adults in their 50s and 60s provide informal help to their own family after retirement. A Difference-in-
Differences (DID) specification of simultaneous equations of market and domestic work of both partners is
adopted, taking into account censored dependent variables such as the partners’ paid work (Huang et. al.,
1987). Namely, the effects of the retirement of a partner on both market and domestic work (measured in
weekly working hours) of the other partner is estimated using a simultaneous equation approach.
We assume that latent variables - such as the “bargaining process” between partners - influence labour
division. Misspecification of bargaining and other latent factors are corrected imposing specific constraints
on the errors covariance matrix. To evaluate the impact of gender attitude on partners’ labour division, we
use a cluster-based classification of couples according to gender attitudes. The classification produces a
dummy signalling if the couple is characterized by a high perception of the traditional gender-role or not.
This dummy is added as a time-invariant explanatory variable in the regressors set.
Preliminary results show that retired men spend more time with housework - both in their own and their
partner’s domain - than they do when continuously employed. The retirement of the partner influences
positively woman participation in the labour market, and negatively her domestic work. Moreover, the data
reveal that the time devoted to domestic work generally increases for both retired and employed adult men
during the period 2003-2007 (about to eight weekly hours). However, the positive variation of domestic
work registered on adult men, as an effect of their retirement, is close to 30%.
REFERENCES
Anxo D., Flood L., Mencarini L., Pailhé A., Solaz A. and Tanturri M.L. (2011): Gender differences in time
use over the life course in France, Italy, Sweden, and the US. Fem. Econ. 17(3): 159-195
Huang, C., Sloan, F. A., Adamache, K. W. (1987): Estimation of Seemingly Unrelated Tobit Regressions via
the EM algorithm. Journal of Business and Economic Statistics, 5(3): 425-430
ISTAT (2010)- Italian National Institute of Statistics: Multi-Purpose Survey on Italian Families: Critical
Path of Working with a Gender Perspective. Panel 2003-2007
Kahn J. R., Mcgill B. S., Bianchi S. M. (2011): Help to Family and Friends: Are There Gender Differences at
Older Ages? Journal of Marriage and Family, 73: 77 – 92 DOI:10.1111/j.1741-3737.2010.00790.x
Szinovacz M. E. (2000): Changes in Housework After Retirement: A Panel Analysis. Journal of Marriage
and the Family, 62: 78–92
1 Marcantonio Caltabiano, email: [email protected]
Maria Gabriella Campolo, email: [email protected] Antonino Di Pino, email: [email protected]

The evaluation of active labour policies: the case of Employment Service Centres (Centri Servizi per il Lavoro).
Lodovico Conzimu
Abstract This paper is a part of a broader study undertaken by the Public Investment
Evaluation and Verification Unit (NVVIP) of the Autonomous Region of Sardinia. The
aim of the study was to evaluate the activity of the 28 Employment Service Centres
(Centri Servizi per il Lavoro- called CSL) in Sardinia during the reference years 2009-
2010. The analyses discussed focus particularly on the employment transitions of the
CSL users’, the passage from the status of job seeker to job finder, in the attempt to
understand how this change came about. These analyses were made implementing
parametric models (Cox models) and non-parametric models (Kaplan-Meier method).
1. Employment Service Centres
The Region of Sardinia, with the LR. 20/ 05 in December 2005, set out regulations on
services and labour policies. The law provides an articulated system among several
institutional and private actors, characterized by different functions. The Employment
Service Centres take the place of previous employment offices (SCICA).
The law also sets out a system for planning and programming at different levels
(provincial and regional) and points out the importance of monitoring and evaluation of
policies.
1 Lodovico Conzimu, Nucleo di Valutazione e Verifica degli investimenti Pubblici –
(Unit of evaluation public policies), Regione Autonoma della Sardegna; email: [email protected]

PAGE 2 Lodovico Conzimu
1.1. The Effectiveness of Employment Service Centres)
Labour policies have been at the centre of economic and political debate at both the
European and Italian level. Since 1990, several reforms of Active Labour Market
Policies (ALMPs) have been promoted in many European countries to overcome a
passive system, with only monetary benefits paid to the unemployed.
As a result of these reforms, studies and evaluations have tried to understand
whether this innovative process had achieved the desired results. In particular, some
studies have analysed the possible effects of public employment services, with a special
focus on the quality of services provided (analysis of customer satisfaction), and with
less attention on implications about the users' employability.
One possible criteria for evaluating the effectiveness of the CSL activity could be
the "speed " with which users of the CSL find employment, in other words the amount
of time that elapses between the state of unemployment to that of being employed.
This type of analyses are called "survival analysis" and belong to a group of
statistical methods, known as "event history analysis”, aimed at the study of the
transition times from a given initial condition to a final state.
This research uses parametric models (Cox model ) and non-parametric (the Kaplan
- Meier). The Kaplan-Meier method provides estimates of the duration of
unemployment for CSL users, while the Cox model is an econometric analysis that
evaluates how the likelihood of the users' finding a job can vary, taking into
consideration main individual characteristics (gender, age, etc).
In other words, this method calculates the probability that a user of the CSL will
find a job during the interval considered. The data cover the time period from 2008 to
2010. The gathered administrative records are referred to all users registered in 2008
who were observed until the end of 2010, in order to have a reasonable lapse of time to
enable us to study the possible "effects" the services provided by CSL have on the
duration of unemployment.
Figure 1: The probability of getting a job for users CSL users .
Figure 1 shows how the probability of finding a job for a CSL user increases
gradually, up to slightly less than 50 % in 600 days. This is in line with the trend of the
labour market in Italy, where, on average, very high rates of long-term unemployment
can be observed (60 % of job seekers are unemployed for over 12 months).
0.00
0.25
0.50
0.75
1.00
0 200 400 600 800analysis time
Kaplan-Meier failure estimate
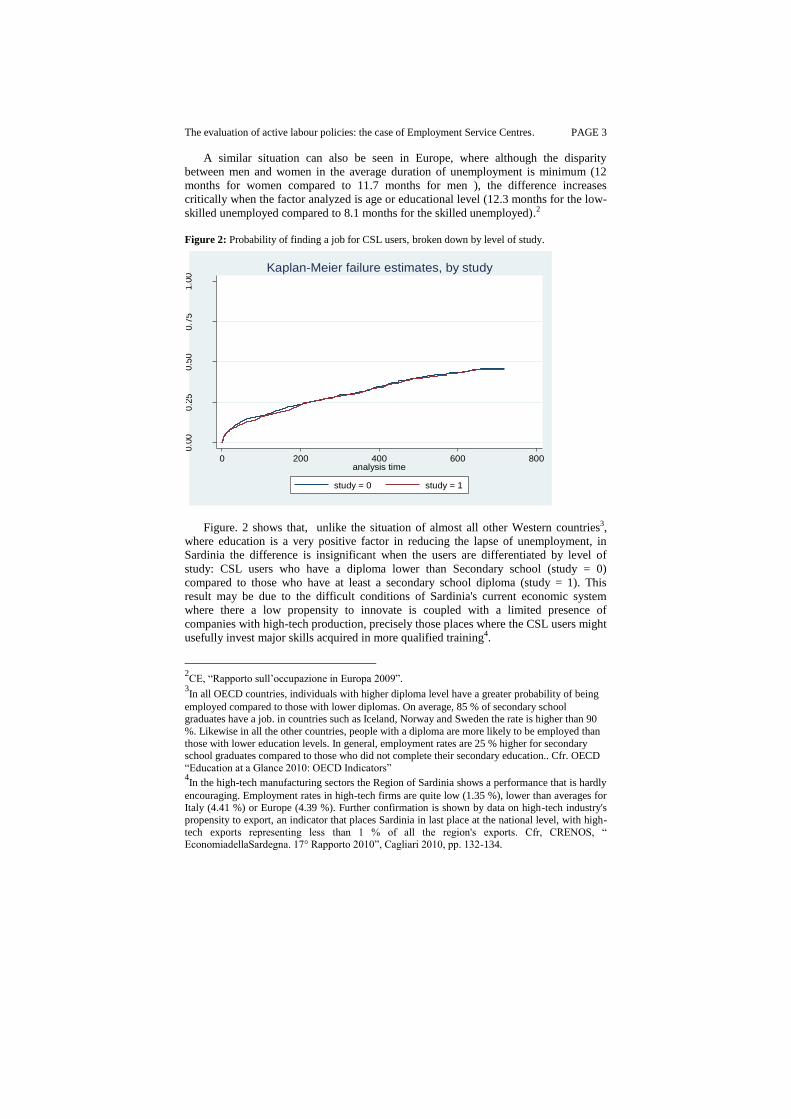
The evaluation of active labour policies: the case of Employment Service Centres. PAGE 3
A similar situation can also be seen in Europe, where although the disparity
between men and women in the average duration of unemployment is minimum (12
months for women compared to 11.7 months for men ), the difference increases
critically when the factor analyzed is age or educational level (12.3 months for the low-
skilled unemployed compared to 8.1 months for the skilled unemployed).2
Figure 2: Probability of finding a job for CSL users, broken down by level of study.
Figure. 2 shows that, unlike the situation of almost all other Western countries3,
where education is a very positive factor in reducing the lapse of unemployment, in
Sardinia the difference is insignificant when the users are differentiated by level of
study: CSL users who have a diploma lower than Secondary school (study = 0)
compared to those who have at least a secondary school diploma (study = 1). This
result may be due to the difficult conditions of Sardinia's current economic system
where there a low propensity to innovate is coupled with a limited presence of
companies with high-tech production, precisely those places where the CSL users might
usefully invest major skills acquired in more qualified training4.
2CE, “Rapporto sull’occupazione in Europa 2009”.
3In all OECD countries, individuals with higher diploma level have a greater probability of being
employed compared to those with lower diplomas. On average, 85 % of secondary school graduates have a job. in countries such as Iceland, Norway and Sweden the rate is higher than 90
%. Likewise in all the other countries, people with a diploma are more likely to be employed than
those with lower education levels. In general, employment rates are 25 % higher for secondary school graduates compared to those who did not complete their secondary education.. Cfr. OECD
“Education at a Glance 2010: OECD Indicators” 4In the high-tech manufacturing sectors the Region of Sardinia shows a performance that is hardly
encouraging. Employment rates in high-tech firms are quite low (1.35 %), lower than averages for Italy (4.41 %) or Europe (4.39 %). Further confirmation is shown by data on high-tech industry's
propensity to export, an indicator that places Sardinia in last place at the national level, with high-
tech exports representing less than 1 % of all the region's exports. Cfr, CRENOS, “ EconomiadellaSardegna. 17° Rapporto 2010”, Cagliari 2010, pp. 132-134.
0.0
00.2
50.5
00.7
51.0
0
0 200 400 600 800analysis time
study = 0 study = 1
Kaplan-Meier failure estimates, by study

PAGE 4 Lodovico Conzimu
The major differences with respect to the probability of leaving the unemployed status
are observed by comparing users with no work experience (inoccupati - never-
employed), with those who have had a previous experience of work (disoccupati -
presently unemployed). The difference between these two groups increases to reach a
22 % greater chance for a presently unemployed to find work after 200 days, compared
to the never-employed.
In order to corroborate and supplement the previous analysis we have used the Cox
model, despite strong initial assumptions that characterize it (the hazard rate for two
individuals is constant over time). This model, in fact, makes it possible to use factors
such as gender, education and experience as explanatory variables to assess the impact
on the probability of finding a job, isolating the contribution of each feature and
considering them all to have an equal impact.
Table 1: Hazard factors for the co-variates analysed by the Cox model
Explanatory variables
Haz.
Ratio Std. Err. Z P>|z| 95% Conf. Interval
Age 1,76 0,122 8,10 0 1,53 2,01
Education 1,09 0,071 1,37 0,172 0,96 1,24
Work Experience 5,16 0,503 16,82 0 4,26 6,24
Gender 1,48 0,098 5,97 0 1,30 1,68
In Table 1 the explanatory variables (dichotomous with values ranging between 0
and 1) are age (value of 0 if the subject is over the age of 39 and 1 if less ), education
level (0 for those whose education level is less than a secondary school diploma) , work
experience (0 for the never-employed, those with no previous work experience ),
gender ( 1 for men and 0 for women). The hazard rate point estimate allows us to assess
the impact of these variables on the period of unemployment.
The second column shows the hazard rate (the marginal effects of each feature on
the probability of finding a job) associated with each variable: for example if you
consider the gender variable, men are 50 % more likely to find a job than women
(1.4823 -1 = 0.4823 ), but if you consider the age variable, a young man has about a 9
% greater chance than an older user. Once the coefficients of the model are estimated,
they may be used to create "profiles" of different users, empirically identifying the
profiles of potential beneficiaries of the active policies.
In this way, users with different levels of employability may be steered towards
interventions of varying intensity, and the resources in the field of active labour market
policies can be more closely targeted towards those who are most exposed to the risk of
long-term unemployment. Appropriate activities of “targeting”, calibrating appropriate
policies to specified groups of users, would improve the relationship between the
effects and the costs incurred.
References
V. Battiloro, L. MoCostabella, “Il profiling dei disoccupati basato sul concetto di occupabilità: uno
strumento a supporto della programmazione delle politiche attive del lavoro” PROVA, 2012 L. MoCostabella ed A. Martini “Valutare gli effetti indesiderati dell’istituto della mobilità sul
comportamento delle imprese e dei lavoratori”, POLIS Working Papers, Universita’ del
Piemonte Orientale, (2007). CRENOS, “ Economia della Sardegna. 17° Rapporto 2010”, Cagliari (2010).
OCSE, “Activating the Unemployed: What Countries Do”, Paris (2007).
The factors of the bank customer (dis)loyalty in
portfolio choices
Umberto Salinas, Andrea Schinzano1
Abstract The purpose of this study is to identify advanced statistical methods to
support and to help banks to specify their customers’ characteristics that could
influence their (dis)loyalty in portfolio choices. In the first step, Cluster Analysis is
used to identify the main customer's characteristics. In the second step, in order to
pinpoint these factors, the survival analysis and the logit regression are used jointly,
based on the dataset of "Banca Popolare di Puglia e Basilicata". The survival analysis
aims to estimate, in terms of time, the desire of customers to benefit from banking
services in portfolio choices. The logit regression aims to describe the potential
unfaithful customer.
References
1. CONSOB (2008), La direttiva MIFID – Guida per il Consumatore. Investire in Prodotti Finanziari.
2. MIGNANI S., MONARI P., MONTANARI A., VICHI M. (2000), New developments in classification and data analysis. Proceedings of the Meeting of the Classification and Data Analysis Group (CLADAG) of the Italian Statistical Society, University of Bologna, September 22-24 2003, Springer.
3. KLEINBAUM D. G., KLEIN M. (2012), Survival Analysis - A self Learning text - Third Edition, Springer.
1 U. Salinas, Department of Private Law and Business Studies, University of Bari Aldo Moro
[email protected] A. Schinzano, Department of Private Law and Business Studies, University of Bari Aldo Moro

Vincenzo F. Cavalierea and Sara Lombardib
a Department of Business Administration, School of Business, University of Florence, Florence, Italy
b Department of Business and Management, LUISS Guido Carli University, Rome, Italy
“The multilevel nature of knowledge sharing processes:
Preliminary evidence from innovative manufacturing sectors”
Keywords: knowledge sharing, micro-foundations, multilevel analysis, micro and macro level
The need to successfully manage the turbulence of the business environment leads firms to devote attention to
the importance of knowledge assets. According to the literature, they are likely to help organizations to achieve
sustainable competitive advantages (McEvily and Chakravarthy 2002; Grant 1996). In this regard, researchers
as well as managers are becoming increasingly aware that leveraging knowledge is a very complex process,
which entails distinctive sub-processes. This study argues that the success of knowledge management activities
is strongly linked to how the process of intra-organizational knowledge sharing (KS) is implemented.
The relevance of knowledge sharing (KS) process is justified by the fact that sharing knowledge and
information allows employees to talk and listen to each other, to stimulate new knowledge creation, and to
fasten mutual learning. KS is thus very important since an individual’s knowledge will not have much impact
on the organization unless it is made available to other individuals.
As investigating knowledge-based processes (e.g. knowledge sharing) first calls for understanding where such
knowledge is created, i.e. where the locus of knowledge resides (Felin and Hesterly 2007), we build our
argument on prior research stating that an organization’s knowledge is built upon that of individuals (Lukas et
al. 1996). Consistently with this perspective, this study looks at the individuals as the crucial locus of
knowledge and the fundamental basis for understanding both the process of value creation and the
organizational outcomes (Felin and Foss 2005). This is what Coleman’s (1990) ‘methodological individualism’
approach suggests: in order to understand a social system, it is necessary to study its micro-foundations, by
making a clear distinction between micro- and macro-level of analysis. While considering that analyzing social
phenomena should always take into account such a distinction, we mean to empirically investigate how KS
process occurs at two different levels of analysis, i.e. the individual one (micro-level) and the organizational
one (macro-level). In so doing, we aim at exploring whether the process differs depending on the level of
analysis.
This issue is consistent with the recognition that organizations are, by their nature, multi-level entities such that
an examination across levels is more likely to capture their complexity, indeed, the constructs involved in
organization studies are always linked to one or more organizational levels (e.g. individual, groups,
organizations, industries, etc.). In addition, social researchers have widely pointed out that, when interacting
with others, individuals are influenced by the groups they belong to, because they are nested within higher-
order organizations and are generally not completely independent from them; conversely, focusing on only one
level of analysis assumes that that level is (more or less) is not linked to the interactions with other levels and,
as such, it is likely to endanger the truthfulness of the resulting empirical findings. Social phenomena are rather
made of highly interdependent components (i.e. individuals, groups, communities, associations, etc.).
Despite the relevance of this issue, so far KS research and more generally knowledge-based literature have paid
little attention to the need for multilevel investigation. While recently some interesting contributions have been
provided (Gupta et al. 2007; Rothaermel and Hess 2007; Becker and Huselid 2006), further studies are
certainly needed. For instance, relevant scholars (Foss et al. 2010) have found that most research on KS has
focused extensively on macro-level variables, overlooking the importance of individuals as the central locus of
knowledge within organizations (i.e. micro-foundations). Thus, as very few empirical studies in the knowledge-
based literature have an authentic multi-level nature, we believe that a multi-level analysis that simultaneously
looks at micro- and macro-organizational levels is thus needed.
Given this, this research is an attempt to extend and contribute to the multi-level research on KS in order to
better understand how and whether micro- and macro-level of analysis may affect KS outcomes. For the
purpose of this study, we empirically analyze survey data of 24 highly innovative manufacturing firms
operating in Italy.