ieej outlook 2018 - international energy forum - ief · ieej outlook 2018 – prospects and...
TRANSCRIPT

IEEJ
Out
look
201
8
IEEJ
© 2
017
The 427th Forum on Research Work
IEEJ Outlook 2018 – Prospects and challenges until 2050 – Tokyo, 12 October 2017 The Institute of Energy Economics, Japan
Energy, Environment and Economy
IEEJ:October 2017 © IEEJ2017

IEEJ
Out
look
201
8 IE
EJ ©
201
7
Overview of the current global energy market
2
• Although the trend of Asia as leading the global energy market remains unchanged, developments in the US and China, which accounts for 40% of the energy market, must be carefully monitored.
• World coal demand dropped for two years in a row (US and China largely) while oil and gas grew. China’s coal consumption declined for the third consecutive year (2016, BP).
• Discussions on Peak Oil (supply) of the 2000s are now changing to Peak Demand. Note the recent movements that aim to ban the sale of internal combustion engine vehicles.
• CO2 emissions dropped in 2015 but increased again in 2016. India and ASEAN showed big increases despite the declined observed in the US and China.
• Paris Agreement calls for “Long-term low greenhouse gas emission development strategies” by 2020. This Outlook expands its estimation period to 2050.
IEEJ:October 2017 © IEEJ2017

IEEJ
Out
look
201
8 IE
EJ ©
201
7
Scenarios in this Outlook
3
<Energy Model Analysis> #Reference Scenario Reflects past trends with current energy and environment policies. Does not reflect any aggressive policies for low-carbon measures. #Advanced Technologies Scenario Assumes the introduction of powerful policies to enhance energy security and address climate change issues. It promotes utmost penetration of low-carbon technologies. #Oil Demand Peak Case Assumes a more rapid introduction of electric drive vehicles than in the reference scenario, to analyze the possibilities of oil demand peak. *1 ZEV: battery electric vehicles, plug-in hybrid electric vehicles and fuel cell battery vehicles
*2 CCT: ultra super critical, advanced-USC and integrated coal gasification combined cycle
❖Examples for Technology
<Climate Model Analysis> #Reference: Emissions path with continuing past trends #Minimizing Cost: Emissions path with minimizing total cost #Halving Emissions by 2050: Emissions path reflected RCP2.6 in AR5 by IPCC
Reference Advanced Technologies
Peak Oil Demand
Ener
gy e
ffic
ienc
y Vehicle technology (ZEV*1 sales share)
9% in 2030 20% in 2050
21% 43%
30% 100%
Coal-fired power generation (CCT*2 share in newly installed capacity)
30% in 2030 90% in 2050
70% 100%
Same as Reference
Carb
on fr
ee
tech
nolo
gy Installed capacity
Solar PV Wind Nuclear
(2015 to 2050) 0.2 to 1.5 TW 0.4 to 1.9 TW 0.4 to 0.6 TW
(2050) 2.5 TW 3.0 TW 1.0 TW
Thermal power generation with CCS (Only countries and regions with CO2 storage potential excluding aquifers)
none Newly installed after 2030
IEEJ:October 2017 © IEEJ2017

IEEJ
Out
look
201
8 IE
EJ ©
201
7
Energy Outlook up to 2050
IEEJ:October 2017 © IEEJ2017

IEEJ
Out
look
201
8 IE
EJ ©
201
7
0
50
100
150
200
250
1990 2000 2010 2020 2030 2040 2050
Y2015=100-250 250 750
China
India
ASEAN
Other Asia
*MENA
**SS Africa
Latin America
Europe
Intl. bunkers
OECDN
on-O
ECD
2015-20302030-2050
Mtoe
Energy market shifting to southern Asia
Despite large improvements in energy efficiency/intensity, global energy demand continues to increase. Two thirds of the energy growth comes from non-OECD Asia. As China peaks during the 2040s, the center of gravity of the market shifts within Asia towards the south.
5
❖ Global Population, GDP and Energy ❖ Growth in Primary Energy
255
145
132
GDP
Energy
Population
<Reference>
* Middle East and North Africa, **Sub-Saharan Africa
IEEJ:October 2017 © IEEJ2017

IEEJ
Out
look
201
8 IE
EJ ©
201
7
Demand led by fuels for Generation & Transport
Three quarters of the growth until 2050 are for fuels for power generation and transportation. The economic development and improvements in living standards of the relatively poor and populous areas – non-OECD Asia – contribute to the global energy expansion.
6
❖ Electricity ❖ Oil fuels for vehicles
<Reference>
7.0
2.83.8
1.62.2
8.6
-10
-8
-6
-4
-2
0
2
4
6
8
10
0
2
4
6
8
10
12
Chin
a
Indi
a
ASEA
N
Oth
er A
sia
Oth
erN
on-O
ECD
OEC
D
PWh
MWh/p
Growth in 2015-2050
Electricity demand per capita
0.320.19
0.26
0.070.15
0.70
-1.2
-0.8
-0.4
0.0
0.4
0.8
-8
-4
0
4
8
12
16
20
Chin
a
Indi
a
ASEA
N
Oth
er A
sia
Oth
erN
on-O
ECD
OEC
D
Mb/d
unit/p
Growth in 2015-2050
Vehicle ownership per capita
IEEJ:October 2017 © IEEJ2017

IEEJ
Out
look
201
8 IE
EJ ©
201
7
21.2
32.9
44.1
0
10
20
30
40
50
1990 2010 2030 2050
GtCO2
13.6
19.8
0
5
10
15
20
2015 2050
Gtoe
-0.5 0.5 1.5 2.5
Coal
Oil
Natural Gas
Nuclear
Renewables Asia*
RoW**
Gtoe
High dependence on fossil fuels continues
Sixty percent of the growth in electricity demand will be met by thermal power generation, especially natural gas. Asia leads the large global increase in fossil fuels required for power generation as well as for transportation. The high dependence on fossil fuels remains unchanged and energy related CO2 emissions increase by 34% by 2050.
7
❖ Growth in Primary Energy ❖ Energy-related CO2
<Reference>
❖ Energy Mix
* Non-OECD Asia, **Rest of the world
81%
79%
IEEJ:October 2017 © IEEJ2017
IEEJ
Out
look
201
8 IE
EJ ©
201
7
19.8
17.2
0
5
10
15
20
25
1990 2000 2010 2020 2030 2040 2050
Reference
Advanced Technology
Gtoe
elec.elec.
elec.
other fuels
other fuels
other fuels
genera-tion loss
transmission
losses*
-0.8 -0.6 -0.4 -0.2 0.0
Industry
Transport
Building
PowerGeneration
Gtoe
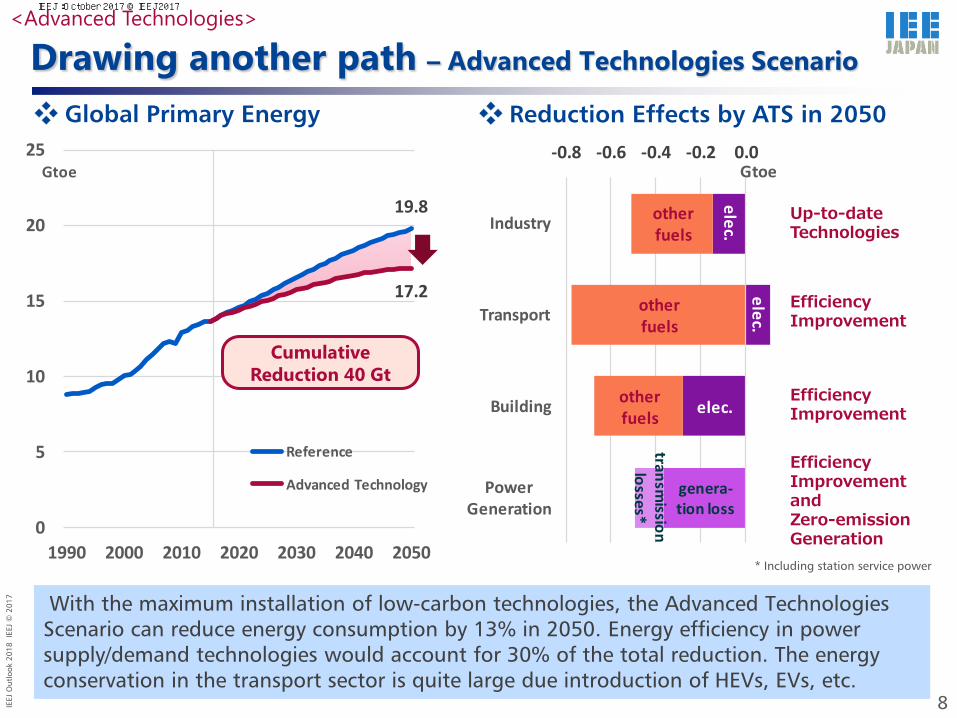
Drawing another path – Advanced Technologies Scenario
With the maximum installation of low-carbon technologies, the Advanced Technologies Scenario can reduce energy consumption by 13% in 2050. Energy efficiency in power supply/demand technologies would account for 30% of the total reduction. The energy conservation in the transport sector is quite large due introduction of HEVs, EVs, etc.
8
❖ Global Primary Energy ❖ Reduction Effects by ATS in 2050
Up-to-date Technologies
Efficiency Improvement
Efficiency Improvement and Zero-emission Generation
* Including station service power
Cumulative Reduction 40 Gt
<Advanced Technologies>
Efficiency Improvement
IEEJ:October 2017 © IEEJ2017

IEEJ
Out
look
201
8 IE
EJ ©
201
7
0
10
20
30
40
50
Reference ATS
2015 2050
PWh
10%
28%47%
0
2
4
6
8
10
12
14
Reference ATS
2015 2050
VRE*
Other RE
Hydro
Nuclear
Gas
Oil
Coal
TW
Zero-emission Generation occupies two thirds
ATS slows the growth in electricity demand from 1.8 times in the reference, down to 1.6 times. In ATS, non-fossil power generation accounts for 60% and zero-emission generation, including thermal generation with CCS represents two thirds (that’s half today’s CO2 emissions per unit of generation). Half of the total power capacity will be comprised of intermittent renewable energy, which needs to further reduce costs and enhance grid stability.
9
❖ Global Power Generation ❖ Global Power Capacity
* Variable Renewable Energy includes solar PV, CSP, wind and marine.
66% 62%
38%
34%
60%
6%
Non-fossil
Fossil with CCS
Fossil
34%
<Advanced Technologies> IEEJ:October 2017 © IEEJ2017

IEEJ
Out
look
201
8 IE
EJ ©
201
7
0
1
2
3
4
5
6
1990 2000 2010 2020 2030 2040 2050
Gtoe
Oil
Coal
Nuclear
Renewables
Gas
Genera-tion
Genera-tion
Genera-tion
Genera-tion
Trans-port
-2 -1 0 1
Coal
Oil
Gas
Nuclear
Renewables
Gtoe
Coal falls significantly and below renewables
In ATS, coal starts to decline from now and is surpassed by renewables around 2040, due mainly to energy efficiency and the elimination of emissions in the power supply/demand sectors. Despite large decline in transportation fuels, oil does not reach a peak. Fossil fuels share of the total in 2050 is reduced to 68%, from 79% in the reference case. It is still a high level of dependence. 10
❖ Primary Energy ❖ Effects by ATS in 2050
(solid line: ATS, dotted line: Reference)
<Advanced Technologies> IEEJ:October 2017 © IEEJ2017

IEEJ
Out
look
201
8 IE
EJ ©
201
7
11
CO2 emissions peak in the middle of 2020s
Energy-related CO2 emissions in ATS decline after 2020s but are still very far from reaching half of current levels by 2050. Efficiency is the most contributor for CO2 reductions from the reference. Two thirds of the total reductions are electricity-related technologies, including non-fossil power, thermal power with CCS and energy efficiency in power supply/demand.
❖ Energy-related CO2 Emissions ❖ Reductions by technology
…… -6.2 Gt
…… -0.4 Gt
…… -2.2 Gt
-14.4 Gt
…… -3.6 Gt
…… -0.5 Gt
…… -1.5 Gt
<Advanced Technologies>
44
30
33
10
20
30
40
50
1990 2000 2010 2020 2030 2040 2050
GtCO2Energy Efficiency
Biofuels
Wind, Solar, etc.
Nuclear
Fuel Switching
CCS
Reference
ATS
Halve
IEEJ:October 2017 © IEEJ2017

IEEJ
Out
look
201
8 IE
EJ ©
201
7
Ultra-long-term Climate Analysis
IEEJ:October 2017 © IEEJ2017

IEEJ
Out
look
201
8 IE
EJ ©
201
7
13
Rule for ultra long-term: Reduce the total cost
Without measures against climate change, the mitigation cost is small, while the adaptation and damage costs become substantial. Aggressive mitigation measures on the other hand, would reduce the adaptation and damage costs but the mitigation costs would be notably colossal.
The climate change issue is a long-term challenge influencing vast areas over many generations. As such, and from a sustainability point of view, the combination (or the mix) of different approaches to reduce the total cost of mitigation, adaptation and damage is important.
❖ Mitigation+Adaptation+Damage=Total Cost ❖ Illustration of Total Cost for Each Path
Mitig
ation
•Typical measures are GHG emissions reduction via energy efficiency and non-fossil energy use. • Includes reduction of GHG release to the atmosphere via CCS • These measures mitigate climate change.
Ad
aptatio
n
•Temperature rise may cause sea-level rise, agricultural crop drought, disease pandemic, etc. • Adaptation includes counter measures such as building banks/reservoir, agricultural research and disease preventive actions.
Dam
age
If mitigation and adaptation cannot reduce the climate change effects enough to stop sea-level rise, draught and pandemics, damage will take place.
パス①
緩和過小
適応大
被害大
パス②
緩和中庸
適応中
被害中
パス③
緩和過大
適応小
被害小
緩和費用
適応費用
被害額
総合コストMitigation Cost Adaptation Cost Damage Value
Total Cost
Mitigation Adaptation Damage
Too Small
Big
Big
Reasonable
Medium
Medium
Too Big
Small
Small
Path 1 Path 2 Path 3
IEEJ:October 2017 © IEEJ2017

IEEJ
Out
look
201
8 IE
EJ ©
201
7
Minimizing Total Cost in IAM* *Integrated Assessment Model
Total cost of “Minimizing Cost” is half of the reference. In 2150, GHG emissions decrease by 80% from now and temperature rises by 2.6 °centigrade from the late 19th century. In “Halving Emissions by 2050“, temperature peaks at 2100, resulting in 1.7°C in 2150. However, total cost is 20% higher than the reference and double of the “Minimizing Cost“ path.
14
❖ GHG Emissions ❖ GHG Concentrations (incl. aerosol etc.)
❖ Temperature Rise (vs. 1850-1900)
❖ Total Cost (cumulative present value*)
*cumulating 2015 to 2500
*Emissions path reflected “RCP 2.6” in the 5th Assessment Report (AR5) by the Intergovernmental Panel on Climate Change (IPCC).
0
20
40
60
80
2000 2050 2100 2150
GtCO2eq
Reference Minimizing Cost Halving Emissions by 2050*
0
200
400
600
800
1,000
2000 2050 2100 2150
ppm CO2eq
0.0
1.0
2.0
3.0
4.0
2000 2050 2100 2150
°C
0
20
40
60
80
100
Mitigation Adaptation&Damage
Tril. $
IEEJ:October 2017 © IEEJ2017

IEEJ
Out
look
201
8 IE
EJ ©
201
7
-10
0
10
20
30
40
50
60
2000 2050 2100 2150 2200
reference high ECS low ECS
GtCO2-eq
0.0
0.5
1.0
1.5
2.0
2.5
3.0
3.5
2000 2050 2100 2150 2200
reference high ECS low ECS
°C
-10
0
10
20
30
40
50
60
2000 2050 2100 2150 2200
reference high discount low discount
GtCO2-eq
0.0
0.5
1.0
1.5
2.0
2.5
3.0
3.5
2000 2050 2100 2150 2200
reference high discount low discount
°C
Still large uncertainties in the climate analysis
15
❖ GHG emissions and temperature rise using different discount rates (minimizing cost)
Discount rate This model uses 2.5%. There are a range of 1.1 to 4.1% summarized by AR5.
Equilibrium Climate Sensitivity (ECS) This model uses 3 degree. According to AR5, high possibility that ECS is between 1.9 and 4.5 degree.
1.4 °C difference
Note: A parameter indicating how many degrees centigrade the temperature will rise when the atmospheric greenhouse gas concentration (CO2 equivalent concentration) doubles.
Note: The value used when converting future value (income and expenditure) into current value. The lower discount rate tends to raise emphasis of adaptation and damage, and strengthen the latest GHG reduction. The higher discount rate raises emphasis of mitigation costs and delays GHG reduction efforts. Although it changes every year in the model analysis, it is represented by the average value in 2015 to 2300 here.
❖ GHG emissions and temperature rise using different ECS (minimizing cost)
1.3 °C difference
IEEJ:October 2017 © IEEJ2017

IEEJ
Out
look
201
8 IE
EJ ©
201
7
Another path to “2°C target”
“2°C Minimizing Cost”, for example, is a path that minimize total cost under the condition of 2°C temperature rise in 2150. Its total cost is 20% higher than “Minimizing Cost” without the temperature limit. GHG emissions decrease by 30% in 2050 and needs almost zero-emissions after 2100. Temperature rises to just over 2°C in 2100 and then declines to 2°C.
16
❖ GHG Emissions ❖ GHG Concentrations (incl. aerosol etc.)
❖ Temperature Rise (vs. 1850-1900)
❖ Total Cost (cumulative present value*)
*cumulating 2015 to 2500
*Emissions path reflected “RCP 2.6” in the 5th Assessment Report (AR5) by the Intergovernmental Panel on Climate Change (IPCC).
0
20
40
60
80
2000 2050 2100 2150
GtCO2eq
Reference Minimizing Cost 2°C Minimizing Cost Halving Emissions by 2050*
0
200
400
600
800
1,000
2000 2050 2100 2150
ppm CO2eq
0.0
1.0
2.0
3.0
4.0
2000 2050 2100 2150
°C
0
20
40
60
80
100
Mitigation Adaptation&Damage
Tril. $
IEEJ:October 2017 © IEEJ2017

IEEJ
Out
look
201
8 IE
EJ ©
201
7
Technology development for ultra long-term
17
Technologies Description Challenges Technologies to reduce CO2 emissions
Next Generation Nuclear Reactors
Fourth-generation nuclear reactors such as ultra-high-temperature gas-cooled reactors(HTGR) and fast reactors, and small- and medium-sized reactors are now being developed internationally.
Expansion of R&D support for next generation reactors
Nuclear fusion reactor
Technology to extract energy just like the sun by nuclear fusion of small mass number such as hydrogen. Deuterium as fuel exists abundantly and universally. Spent nuclear fuel as high-level radioactive waste is not produced.
Technologies for continuously nuclear fusion and confining them in a certain space, energy balance, cost reduction, financing for large-scale development and establishment of international cooperation system, etc.
Space Photovoltaic Satellite (SPS)
Technologies for solar PV power generation in space where sunlight rings abundantly above than on the ground and transmitting generated electricity to the earth wirelessly via microwave, etc.
Establishment of wireless energy transfer technology, reduction of cost of carrying construction materials to space, etc.
Technologies to sequestrate CO2 or to remove CO2 from the atmosphere
Hydrogen production and usage
Production of carbon-free hydrogen by steam reforming of fossil fuels and by CCS implementation of CO2 generated.
Cost reduction of hydrogen production, efficiency improvement, infrastructure development, etc.
CO2 sequestration and usage (CCU)
Produce carbon compounds to be chemical raw materials, etc. using CO2 as feedstocks by electrochemical method, photochemical method, biochemical method, or thermochemical method. CO2 can be removed from the atmosphere.
Dramatic improvement in quantity and efficiency, etc.
Bio-energy with carbon capture and storage (BECCS)
Absorption of carbon from the atmosphere by photosynthesis with biological process and CCS.
It requires large-scale land and may affect land area available for the production of food etc.
IEEJ:October 2017 © IEEJ2017
IEEJ
Out
look
201
8 IE
EJ ©
201
7
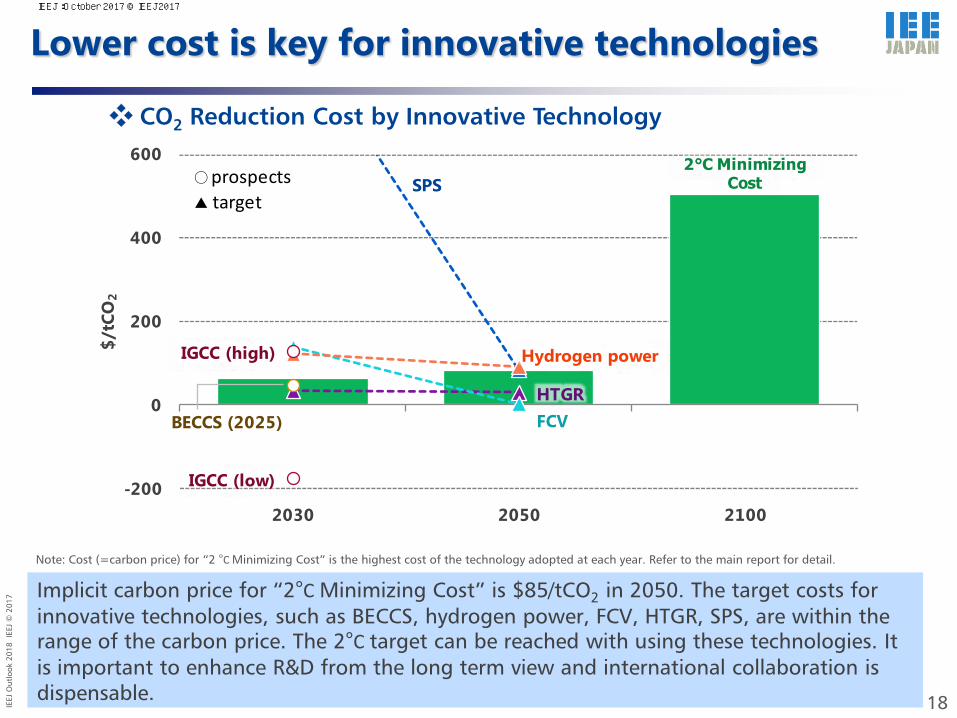
Lower cost is key for innovative technologies
Implicit carbon price for “2°C Minimizing Cost” is $85/tCO2 in 2050. The target costs for innovative technologies, such as BECCS, hydrogen power, FCV, HTGR, SPS, are within the range of the carbon price. The 2°C target can be reached with using these technologies. It is important to enhance R&D from the long term view and international collaboration is dispensable. 18
Note: Cost (=carbon price) for “2 °C Minimizing Cost” is the highest cost of the technology adopted at each year. Refer to the main report for detail.
❖ CO2 Reduction Cost by Innovative Technology
2°C Minimizing Cost
HTGRFCV
Hydrogen power
BECCS (2025)
IGCC (high)
IGCC (low)-200
0
200
400
600
2030 2050 2100
$/tC
O2
SPS○prospects▲ target
IEEJ:October 2017 © IEEJ2017

IEEJ
Out
look
201
8 IE
EJ ©
201
7
Further CO2 reductions from ATS
19
❖ Energy-related CO2 Emissions
1) CO2 Free Hydrogen (refer to previous Outlook) • Hydrogen power 1 GW x 3000 units • Fuel cell vehicles 1 billion units (H2 demand of 800 Mt/yr corresponds 3 times of today’s LNG) 2) Negative-emission Technology • BECCS: Biomass power 0.5 GW x 2800 units (Fuel supply of 2000 Mtoe/yr needs land of 2.85 million km2) 3) Zero-emission Power and Factories with CCS -10 GtCO2 (Maximum reduction volume by substituting thermal power generation without CCS) • SPS: 1.3 GW x 2300 units or • HTGR: 0.275 GW x 8700 units or • Fusion reactor: 0.5 GW x 4500 units or • Thermal power with CCS: 2800 GW (Estimated CO2 storage potential is over 7000Gt) + -1 GtCO2 • CCS: Installed in 20% of factories and plants (iron & steel, cement, chemicals, pulp & paper, refinery and GTL/CTL)
❖ Examples of technologies needing further reductions
*Emissions path reflected “RCP 2.6” in the 5th Assessment Report (AR5) by the Intergovernmental Panel on Climate Change (IPCC).
44
30
19
10
20
30
40
1990 2010 2030 2050
Reference
ATSGtCO2
<Climate Analysis>●Minimizing Cost
● 2°C Minimizing Cost◆ Halving Emissions by 2050*
▲11Gt
IEEJ:October 2017 © IEEJ2017
IEEJ
Out
look
201
8 IE
EJ ©
201
7
Peak Oil “Demand” Case
IEEJ:October 2017 © IEEJ2017

IEEJ
Out
look
201
8 IE
EJ ©
201
7
Transport, especially cars, drives oil demand
About 70% of the increases in oil consumption until 2050 is for transport or petrochemical feedstocks. Road transport, in particular, may decide where the consumption will go.
21
⛽ Oil consumption [Reference Scenario] ⛽ Oil for Road [Reference Scenario]
Oil consumption by cars in OECD countries is decreasing and will be surpassed by non-OECD around 2020. Non-OECD accounts for all future consumption increases.
Others
Non-energy
use
Other transport30
40
4547
Road48
76
90
105114
122
0
20
40
60
80
100
120
2000 2015 2030 2040 2050
Mb
/d
21
19OECD
15
18
26Non-OECD
33
0
10
20
30
40
2000 2010 2020 2030 2040 2050M
b/d
IEEJ:October 2017 © IEEJ2017

IEEJ
Out
look
201
8 IE
EJ ©
201
7
The time for car electrification has come?
22
⛽ Selected recent movements by governments/assemblies and car makers A resolution to ban conventional car sales in the European Union by 2030 was passed by the Bundesrat of Germany (2016) Germany
The ruling and opposition parties proposed the abolition of conventional vehicles by 2025 (2016) Norway
The Government announced that it would ban conventional car sales by 2040 (2017)
France
The Government announced that it would ban conventional car sales by 2040 (2017)
United Kingdom
Minister said that all new car sales after 2030 would be electric vehicles (2017)
India
Deputy Minister mentioned that the ban on the sale of conventional vehicles was under investigation (2017) China
The target for FCV sales is more than 30,000/year in 2020 (2015). Reported of full-scale entry into EVs in 2020 (2016)
Announced the strategy to increase EV share in its total sales to 25% with more than 30 models of EVs by 2025 (2017)
Introducing 12 models of EVs by 2022. The target of 30% of its total sales as EVs (2017)
The plan to prepare EVs at all line up by 2020 (2015)
Announced that eco-cars combined with EVs and HEVs will be raised to 70% by 2025 (2017).
In 2030, two-thirds of automobile sales will be electrified. EVs will be released in China in 2018 (2017).
Toyota
Volkswagen
Renault-Nissan
Hyundai
Ford
Honda
IEEJ:October 2017 © IEEJ2017

IEEJ
Out
look
201
8 IE
EJ ©
201
7
Oil peaks around 2030 with a rapid penetration of ZEVs
Oil consumption by cars in Non-OECD, which continues to increase rapidly in the Reference Scenario, also declines from around 2030. It is as much as one third of the Reference Scenario in 2050.
23
⛽ Oil consumption ⛽ Oil for Road [Peak Oil Demand Case]
In the Peak Oil Demand Case, oil consumption hits a peak of 98 Mb/d around 2030 before declining. The reduction from the Reference Scenario is 7 Mb/d and 33 Mb/d in 2030 and in 2050, respectively.
Note: Dotted lines are the Reference Scenario
8690
105
122
Advanced Technologies
9798
Peak Oil Demand
89
60
80
100
120
2010 2020 2030 2040 2050
Mb
/d
Reference
15
33
21
16
OECD5
18
22
Non-OECD
11
0
10
20
30
40
2000 2010 2020 2030 2040 2050M
b/d
IEEJ:October 2017 © IEEJ2017

IEEJ
Out
look
201
8 IE
EJ ©
201
7
While natural gas and coal increase, the petroleum product composition changes
As ZEVs demand for oil declines and electricity increases, the fuel required for power generation also increases. Both natural gas and coal exceeds oil by the late 2030s. Natural gas becomes the largest energy source thereafter.
24
⛽ Changes in consumption (from the Reference Scenario)
⛽ Composition of petroleum products consumption
Note: Excluding own use
Gasoline reduces its share from 27% to 10% in 2050. The share of diesel oil is not reduced as much because diesel oil has other uses. Diesel share in 2050 is 8 points lower than today.
-1,846
-1,596
432
572
-1,567
-83
409
-2,000 -1,000 0
(Mt)
Oil
Coal
Natural gas
Oil
Biomass
Electricity
CO
2Pr
imar
y co
nsu
mp
tio
nRo
ad
Mtoe
2030
2050
Dieseloil
35%34% 33%
Gasoline27%
25% 23%
34%27%
23% 10%
0%
20%
40%
60%
80%
100%
20152030205020302050
Reference Peak Oil Demand
LPG
Naphtha
Jet fuel
Kerosene
Heavyfuel oil
Others
IEEJ:October 2017 © IEEJ2017

IEEJ
Out
look
201
8 IE
EJ ©
201
7
Crude oil production shifts towards low-cost regions...
Oil price falls due to the change in supply and demand pressure and market perception. Relative to the Reference Scenario (in $2016), prices drop from $95/bbl to $65/bbl in 2030 and from $125/bbl to $50/bbl in 2050. Given such drastic price decreases, regions with low production costs would be the only ones with potential for increases. Only the Middle East is expected to produce more in 2050 than today. North America production decreases by 40% from the Reference Scenario to 13 Mb/d.
25
⛽ Crude oil production [Peak Oil Demand Case]
28.8
9.9
17.113.8
7.2 8.4
33.7
10.7
18.4
13.8
6.9 6.9
37.3
9.213.0 11.5
6.2 5.3
32.4
42.0
11.313.6
21.6 21.9
14.5 15.0
8.812.4
7.4 7.2
0
10
20
30
40
Middle East Others North America Former Soviet Union
Latin America Asia
OPEC Non-OPEC
Mb
/d
2015 2030 2050 Reference
IEEJ:October 2017 © IEEJ2017

IEEJ
Out
look
201
8 IE
EJ ©
201
7
...but the economic downturn will affect the Middle East
Although the Middle East achieves a relative gain, the decrease in net oil export revenues is $1.6 trillion; a significant drop of 13% of nominal GDP. At the other end of the spectrum, India which is the second largest oil consumer, benefits the most with a decrease in net oil import costs. It is followed by China, in which more cars are on road than in any other countries. Despite its consumption scale, the United States faces little impact since it is almost oil self-sufficient.
26
⛽ Changes in net oil exports/imports and ratios to nominal GDP [2050]
Note: Europe excludes the former Soviet Union
0.0 0.5 1.0 1.5 2.0 2.5
United States
Japan
OECD Europe
China
India
Latin America
Former USSR
Middle East
Net
imp
ort
sN
et e
xpo
rts
$ trillion
ReferencePeak Oil Demand
Quantity effect
Price effectASEAN
India
Other Asia
Japan
Europe
ChinaOceania
United States
Africa
Latin America
Former USSR
Canada
Middle East
-15%
-10%
-5%
0%
5%
0 50 100 150C
han
ges
in n
et o
il ex
po
rt r
atio
to
n
om
inal
GD
PGD
PReal GDP ($2010 trillion)
IEEJ:October 2017 © IEEJ2017

IEEJ
Out
look
201
8 IE
EJ ©
201
7
Impact of less oil consumption diverges
Emission reductions in NOx and PM2.5, the major drivers behind car electrification, are 27% and 3%, respectively, compared to total emissions in 2010. Contribution to air quality in urban areas are expected.
27
⛽ Changes in emissions (from the Reference Scenario)
⛽ Excise taxes on gasoline and diesel oil for automobiles in OECD
Note: Automobile origin. Does not include effect on improvement of conventional automobile emission control performance
Revenues from excise taxes on automotive gasoline and diesel oil will be reduced significantly, unless tax regime changes. They may become financial issues similar to the subsidies for ZEVs at their promotion stage.
-5.4
-30.5
-40 -30 -20 -10 0
2030
2050
NO
x (M
t)
-0.2
-1.2
-1.5 -1.0 -0.5 0.0
2030
2050
PM2
.5 (M
t)
370
313
238270
79
0
100
200
300
400
2030 2050 2030 2050
2015 Reference Peak Oil Demand
$ b
illio
n
IEEJ:October 2017 © IEEJ2017

IEEJ
Out
look
201
8 IE
EJ ©
201
7
How do we recognise the rapid de-oiling?
28
The rising dependence on the Middle East crude oil will increase geopolitical risk for stable supply.
Although it is reasonable to expect that Governments in the Middle East would cut public investment and subsidies to reduce budget deficits while coping with low oil prices, it is difficult to deny the possibility of increasing social anxiety and of a worsening situation in the region.
The role of consuming countries as well as producing countries’ own efforts continue to be important. Support to the efforts represented by Saudi Arabia “Saudi Vision 2030“ is needed.
...and then
It should not be overlooked that in the Peak Oil Demand Case, oil remains required in 2050 on a scale that does not differ from today.
If the supply investment becomes insufficient due to excessive pessimism in the future , it can trigger the switching from oil to other energies threatening energy security.
The Peak Oil Demand Case shows that, under some circumstances, oil consumption can turn into a decline in the not too distant future,.
However, the feasibility of this Case can be said to be extremely challenging because the penetration of ZEVs is far greater than that in the “Advanced Technologies Scenario,” in which a bottom-up approach to the maximum implementation of advanced technologies is adopted. It can be said that oil consumption may not be so easily reduced, so quickly.
IEEJ:October 2017 © IEEJ2017

IEEJ
Ou
tlo
ok
2018
IEE
J ©
201
7
Reference materials
IEEJ:October 2017 © IEEJ2017

IEEJ
Ou
tlo
ok
2018
IEE
J ©
201
7
Geological coverage
• The world is geographically aggregated into 42 regions. • Especially the Asian energy supply/demand structure is considered in detail, aggregating the area into 15 regions.
- United States - Canada
North America
- Australia - New Zealand
Oceania - South Africa (Rep. of) - North Africa - Other Africa
Africa
-Saudi Arabia - Iran - Iraq - UAE - Kuwait - Qatar - Oman - Other Middle East
Middle East - Japan - China - India - Chinese Taipei - Korea - Hong Kong - Indonesia - Malaysia - Philippines - Thailand - Viet Nam - Singapore - Myanmar - Brunei Darussalam - Other Asia
- United Kingdom - Germany - France - Italy - Other OECD Europe
OECD Europe - Russia - Other FSU - Other Non-OECD Europe
Non-OECD Europe
- Mexico - Brazil - Chile - Other Latin America
Latin America
Asia
30
IEEJ:October 2017 © IEEJ2017

IEEJ
Ou
tlo
ok
2018
IEE
J ©
201
7
Energy supply-demand model
World trade model
Computable general equilibrium model
Climate change model
Use the linear programming (LP) method to calculate the future international trade flows of crude oil, petroleum products, etc.
Estimate the economic impacts induced by the changes in energy supply and demand, based on input-output data.
Calculate future GHG concentration in the atmosphere, temperature rise, damage caused by climate change, etc.
Major assumptions
GDP, population, energy prices, exchange rates, international trade, etc.
Technology assessment model
Optimal power generation planning model
Calculate GDP-related indices, price indices, activity indices including material production, etc. consistently.
Use a bottom-up approach to calculate future efficiencies of appliances, vehicles, etc.
Calculate the cost-optimal power generation mix to meet the projected future electricity demand.
Econometric model to project future energy supply and demand by regression analysis of historical trends based on the energy balance tables data of the International Energy Agency (IEA). This model calculates energy demand, supply and transformation as well as related indices including CO2 emissions, CO2 intensities and energy self sufficiency ratios.
Experts’ opinions
Macroeconomic model
Modelling framework
31
IEEJ:October 2017 © IEEJ2017
IEEJ
Ou
tlo
ok
2018
IEE
J ©
201
7
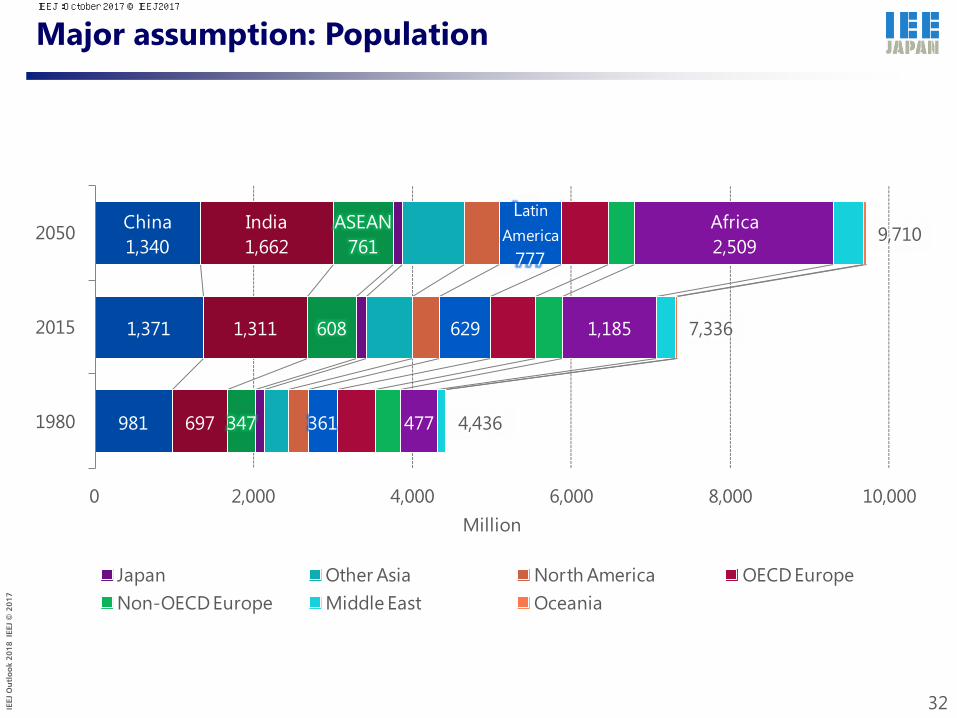
Major assumption: Population
32
981
1,371
China1,340
697
1,311
India1,662
347
608
ASEAN761
361
629
Latin America
777
477
1,185
Africa2,509
4,436
7,336
9,710
0 2,000 4,000 6,000 8,000 10,000
1980
2015
2050
Million
Japan Other Asia North America OECD EuropeNon-OECD Europe Middle East Oceania
IEEJ:October 2017 © IEEJ2017
IEEJ
Ou
tlo
ok
2018
IEE
J ©
201
7
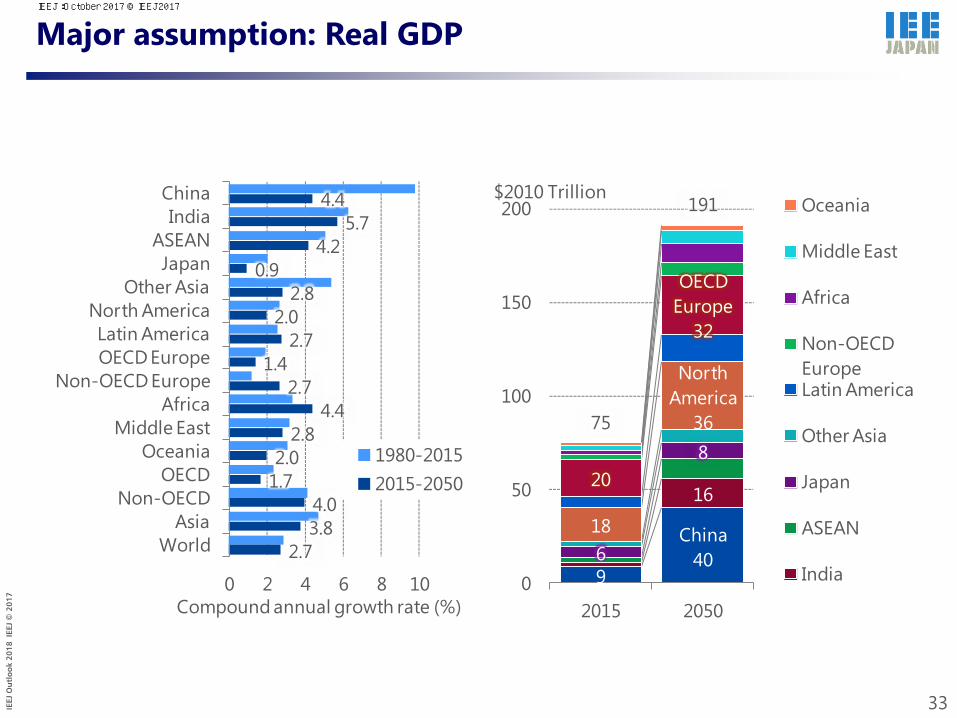
Major assumption: Real GDP
33
4.4 5.7
4.2 0.9
2.8 2.0
2.7 1.4
2.7 4.4
2.8 2.0
1.7 4.0 3.8
2.7
0 2 4 6 8 10
ChinaIndia
ASEANJapan
Other AsiaNorth AmericaLatin AmericaOECD Europe
Non-OECD EuropeAfrica
Middle EastOceania
OECDNon-OECD
AsiaWorld
Compound annual growth rate (%)
1980-20152015-2050
9
China40
16
6
8
18
North America
36
20
OECD Europe
32
75
191
0
50
100
150
200
2015 2050
Oceania
Middle East
Africa
Non-OECD EuropeLatin America
Other Asia
Japan
ASEAN
India
$2010 Trillion
IEEJ:October 2017 © IEEJ2017

IEEJ
Ou
tlo
ok
2018
IEE
J ©
201
7
Major assumption: International energy prices
* Historical prices are nominal price. Assumed future prices are real price in $2016.
CIF import prices for Japan
Crude oil Natural gas
Steam coal
34
0
50
100
150
1980 1990 2000 2010 2020 2030 2040 2050
$/bbl
0
5
10
15
20
1980 1990 2000 2010 2020 2030 2040 2050
JapanEurope (UK)United States
$/MBtu
0
50
100
150
1980 1990 2000 2010 2020 2030 2040 2050
$/t
0
200
400
600
800
1,000
19801990200020102020203020402050
Crude oilNatural gasSteam coal
$/toe
IEEJ:October 2017 © IEEJ2017

IEEJ
Ou
tlo
ok
2018
IEE
J ©
201
7
Energy outlook in the world and Asia 2015-2050
Reference Scenario
IEEJ:October 2017 © IEEJ2017

IEEJ
Ou
tlo
ok
2018
IEE
J ©
201
7
World population, GDP, primary energy consumption and CO2 emissions
36
Reference Scenario
132
255
145 134
0
50
100
150
200
250
300
1980 1990 2000 2010 2015 2020 2030 2040 2050
Primary energyconsumption
Population
2015=100
Real GDP
CO2 emissions100
IEEJ:October 2017 © IEEJ2017

IEEJ
Ou
tlo
ok
2018
IEE
J ©
201
7
0
2,000
4,000
6,000
8,000
10,000
1980 1990 2000 2015 2030 2040 2050
North AmericaLatin AmericaAsiaMiddle EastOECD EuropeNon-OECD EuropeAfricaOceania
Mtoe
-146
-145
4
345
526
539
847
3,893
-0.2%
-0.3%
0.1%
0.8%
1.4%
1.6%
2.1%
1.5%
North America
OECD Europe
Oceania
Non-OECD Europe
Latin America
Middle East
Africa
Asia
Mtoe CAGR(2015-2050)
2015 13,700 Mtoe
2050
19,800 Mtoe (×1.5)
Primary energy consumption by region
Changes (2015-2050) World
37
Reference Scenario
IEEJ:October 2017 © IEEJ2017
IEEJ
Ou
tlo
ok
2018
IEE
J ©
201
7
0
500
1,000
1,500
2,000
2,500
3,000
3,500
4,000
4,500
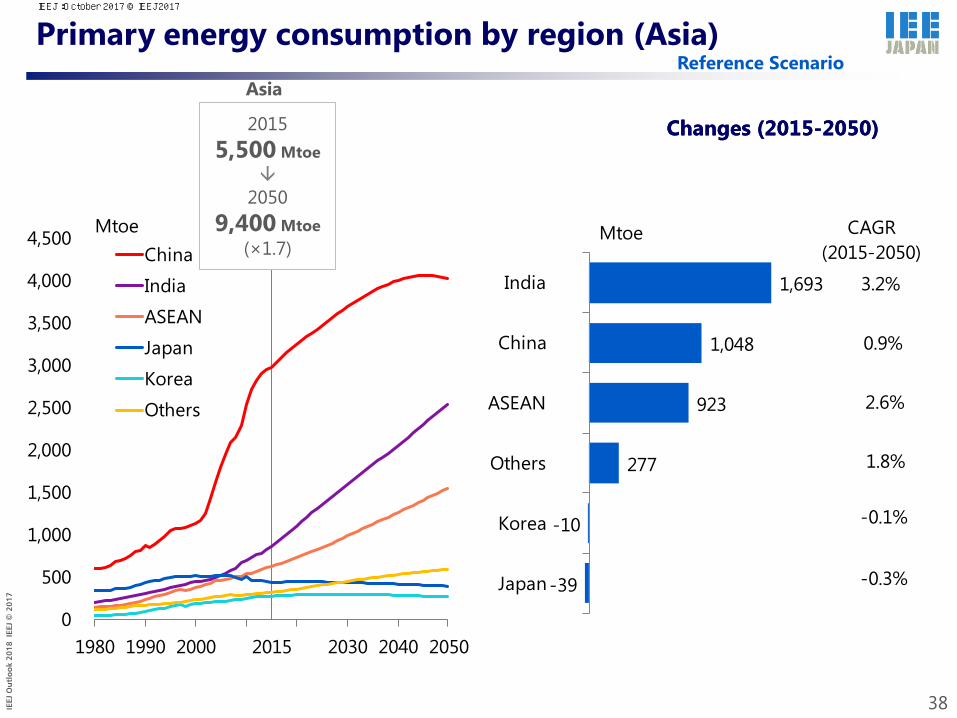
1980 1990 2000 2015 2030 2040 2050
China
India
ASEAN
Japan
Korea
Others
Mtoe
-39
-10
277
923
1,048
1,693
-0.3%
-0.1%
1.8%
2.6%
0.9%
3.2%
Japan
Korea
Others
ASEAN
China
India
Mtoe CAGR(2015-2050)
Primary energy consumption by region (Asia)
38
Reference Scenario
Changes (2015-2050)
Asia
Changes (2015-2050) 2015 5,500 Mtoe
2050
9,400 Mtoe (×1.7)
IEEJ:October 2017 © IEEJ2017

IEEJ
Ou
tlo
ok
2018
IEE
J ©
201
7
0
1,000
2,000
3,000
4,000
5,000
6,000
7,000
1980 1990 2000 2015 2030 2040 2050
CoalOilNatural gasNuclearHydroOther renewables
Mtoe
166
384
695
1,132
1,515
2,250
1.2%
1.3%
0.5%
1.6%
0.9%
1.6%
Hydro
Nuclear
Coal
Other renewables
Oil
Natural gas
MtoeCAGR
(2015-2050)
39
Reference Scenario
Changes (2015-2050) 2015 13,700 Mtoe
2050
19,800 Mtoe (×1.5)
World
Primary energy consumption by source IEEJ:October 2017 © IEEJ2017

IEEJ
Ou
tlo
ok
2018
IEE
J ©
201
7
0
500
1,000
1,500
2,000
2,500
3,000
3,500
4,000
1980 1990 2000 2015 2030 2040 2050
CoalOilNatural gasNuclearHydroOther renewables
Mtoe
90
330
443
993
1,015
1,020
1.5%
4.0%
1.6%
1.6%
0.9%
3.1%
Hydro
Nuclear
Other renewables
Oil
Coal
Natural gas
MtoeCAGR
(2015-2050)
Primary energy consumption by source (Asia)
40
Reference Scenario
Changes (2015-2050)
Asia
2015 5,500 Mtoe
2050
9,400 Mtoe (×1.7)
IEEJ:October 2017 © IEEJ2017
IEEJ
Ou
tlo
ok
2018
IEE
J ©
201
7
0
1,000
2,000
3,000
4,000
5,000
6,000
1980 1990 2000 2015 2030 2040 2050
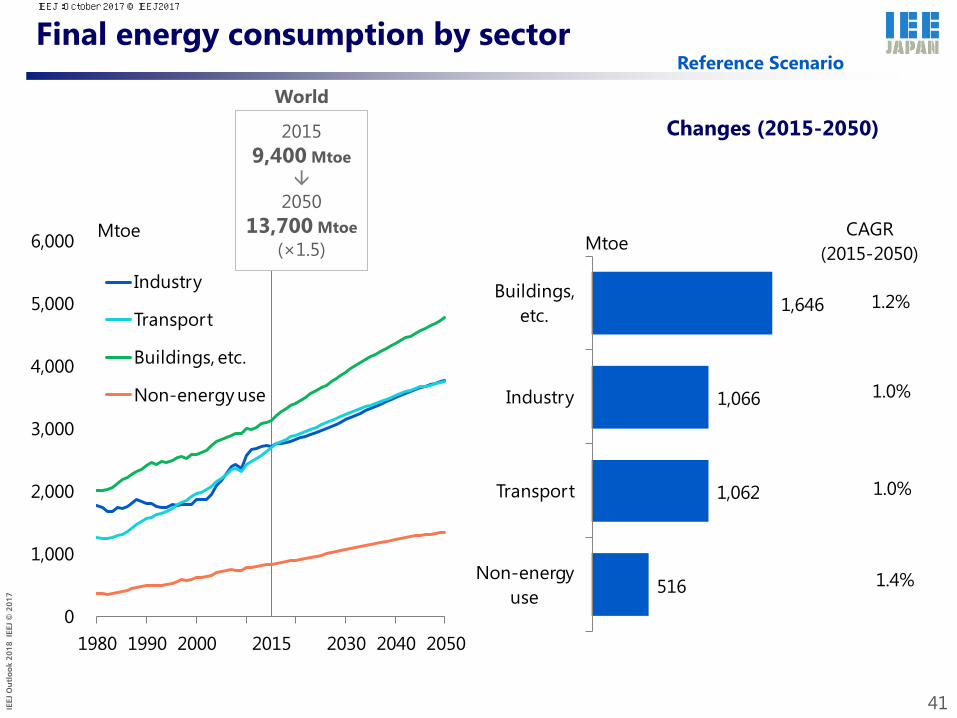
Industry
Transport
Buildings, etc.
Non-energy use
Mtoe
516
1,062
1,066
1,646
1.4%
1.0%
1.0%
1.2%
Non-energy use
Transport
Industry
Buildings, etc.
MtoeCAGR
(2015-2050)
Final energy consumption by sector
2015 9,400 Mtoe
2050
13,700 Mtoe (×1.5)
World
41
Reference Scenario
Changes (2015-2050)
IEEJ:October 2017 © IEEJ2017

IEEJ
Ou
tlo
ok
2018
IEE
J ©
201
7
0
500
1,000
1,500
2,000
2,500
1980 1990 2000 2015 2030 2040 2050
Industry
Transport
Buildings, etc.
Non-energy use
Mtoe
278
616
626
1,003
1.6%
1.0%
2.0%
1.8%
Non-energy use
Industry
Transport
Buildings, etc.
MtoeCAGR
(2015-2050)
Final energy consumption by sector (Asia)
42
Reference Scenario
Changes (2015-2050) Asia
2015 3,600 Mtoe
2050
6,100 Mtoe (×1.7)
IEEJ:October 2017 © IEEJ2017

IEEJ
Ou
tlo
ok
2018
IEE
J ©
201
7
0
1,000
2,000
3,000
4,000
5,000
6,000
1980 1990 2000 2015 2030 2040 2050
CoalOilNatural gasElectricityOthers
Mtoe
64
329
829
1,483
1,586
0.2%
0.6%
1.3%
0.9%
1.9%
Coal
Others
Natural gas
Oil
Electricity
MtoeCAGR
(2015-2050)
Final energy consumption by source
43
Reference Scenario
Changes (2015-2050) 2015 9,400 Mtoe
2050
13,700 Mtoe (×1.5)
World
IEEJ:October 2017 © IEEJ2017

IEEJ
Ou
tlo
ok
2018
IEE
J ©
201
7
0
500
1,000
1,500
2,000
2,500
1980 1990 2000 2015 2030 2040 2050
CoalOilNatural gasElectricityOthers
Mtoe
60
92
436
965
971
0.2%
0.4%
2.9%
2.4%
1.7%
Coal
Others
Natural gas
Electricity
Oil
MtoeCAGR
(2015-2050)
Final energy consumption by source (Asia)
44
Reference Scenario
Changes (2015-2050) Asia
2015 3,600 Mtoe
2050
6,100 Mtoe (×1.7)
IEEJ:October 2017 © IEEJ2017

IEEJ
Ou
tlo
ok
2018
IEE
J ©
201
7
Oil consumption
By region By sector
Reference Scenario
45
0
1,000
2,000
3,000
4,000
5,000
6,000
7,000
1980 1990 2000 2015 2030 2040 2050
International bunkersOceaniaAfricaNon-OECD Europe/Central AsiaOECD EuropeMiddle EastAsiaLatin AmericaNorth America
Mtoe
3,102 3,2353,660
4,334
5,0245,471
5,849
0
1,000
2,000
3,000
4,000
5,000
6,000
7,000
1980 1990 2000 2015 2030 2040 2050
Transformation
Non-energy use
Buildings, etc.
Transport
Industry
Mtoe
IEEJ:October 2017 © IEEJ2017

IEEJ
Ou
tlo
ok
2018
IEE
J ©
201
7
Oil consumption (Asia)
By region
Reference Scenario
46
By sector
0
500
1,000
1,500
2,000
2,500
1980 1990 2000 2015 2030 2040 2050
Others
Korea
Japan
ASEAN
India
China
Mtoe
477618
916
1,330
1,820
2,089
2,323
0
500
1,000
1,500
2,000
2,500
1980 1990 2000 2015 2030 2040 2050
Transformation
Non-energy use
Buildings, etc.
Transport
Industry
Mtoe
IEEJ:October 2017 © IEEJ2017

IEEJ
Ou
tlo
ok
2018
IEE
J ©
201
7
Oil production Reference Scenario
47
92102
11111843% 44%
47%48%
0%
10%
20%
30%
40%
50%
0
20
40
60
80
100
120
140
2015 2030 2040 2050
OPEC share
Asia/Oceania
Non-OECD Europe/Central Asia
Other Latin America
North America
Other Africa
Other Middle East
OPEC non-Middle East
OPEC Middle East
Mb/d
IEEJ:October 2017 © IEEJ2017

IEEJ
Ou
tlo
ok
2018
IEE
J ©
201
7
Oil net imports Reference Scenario
48
-23
-9
1
-2 -5
1 1
7 82
73
-25
-9-5 -3 -4
0 16 7
4
127
-33
-9 -7 -7-2
0 25 6
813 14
-40
-30
-20
-10
0
10
20
Middle East
Non-OECD
Europe/Central
Asia
North America
Latin America
Africa Oceania Other Asia
Japan/ Korea/
Chinese Taipei
OECD Europe
ASEAN China India
Mb/d
2015
2030
2050
Net exporters in 2050 Net importers in 2050
IEEJ:October 2017 © IEEJ2017

IEEJ
Ou
tlo
ok
2018
IEE
J ©
201
7
Major crude oil trade flows (2016)
Japan/Korea/ Chinese Taipei
Non-OECD Europe/ Central Asia
North America
Middle East
Latin America
Africa
OECD Europe
China
ASEAN
Oceania
South Asia 2.2
4.6
1.9
1.1
1.4
3.7
6.0
1.8
2.7
0.6
0.6
Unit: Mb/d
1.0
2.0 1.9
0.5 0.7
49
IEEJ:October 2017 © IEEJ2017

IEEJ
Ou
tlo
ok
2018
IEE
J ©
201
7
Major crude oil trade flows (2030) Reference Scenario
50
1.5
3.3
1.4
1.7
1.5
7.4
4.9
3.6
6.7
0.8
0.6
0.8
0.5 1.0
Unit: Mb/d
0.7
0.6
0.8 0.6
Non-OECD Europe/ Central Asia OECD Europe
Middle East
Africa
Oceania
South Asia
ASEAN
China Japan/Korea/ Chinese Taipei
North America
Latin America
IEEJ:October 2017 © IEEJ2017

IEEJ
Ou
tlo
ok
2018
IEE
J ©
201
7
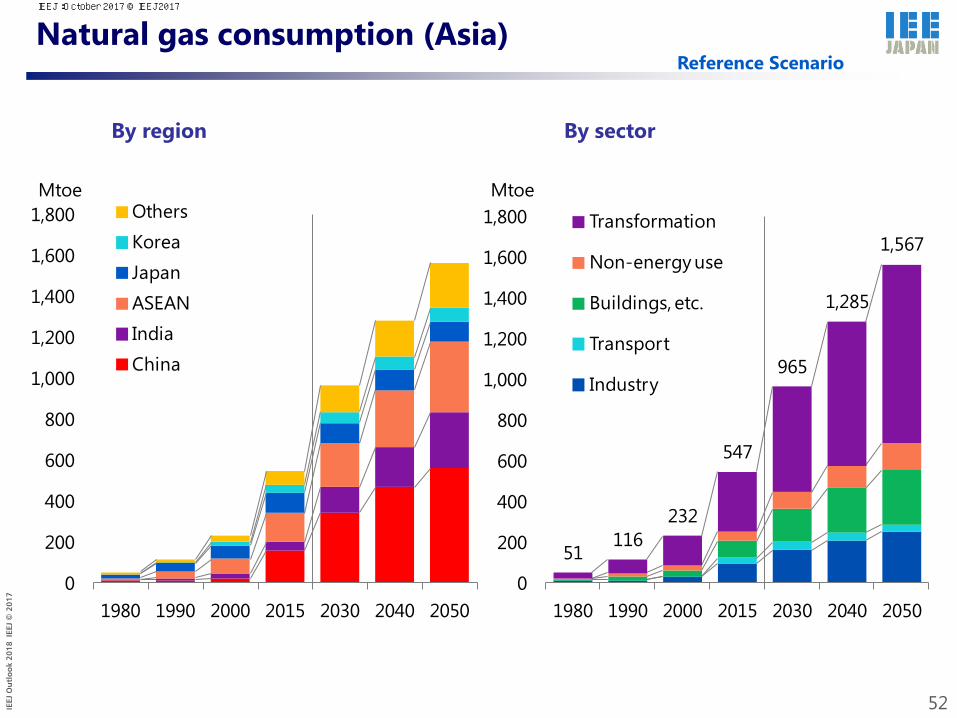
Natural gas consumption
By region By sector
Reference Scenario
51
0
1,000
2,000
3,000
4,000
5,000
6,000
1980 1990 2000 2015 2030 2040 2050
International bunkersOceaniaAfricaNon-OECD Europe/Central AsiaOECD EuropeMiddle EastAsiaLatin AmericaNorth America
Mtoe
1,2321,663
2,071
2,944
3,845
4,550
5,194
0
1,000
2,000
3,000
4,000
5,000
6,000
1980 1990 2000 2015 2030 2040 2050
Transformation
Non-energy use
Buildings, etc.
Transport
Industry
Mtoe
IEEJ:October 2017 © IEEJ2017
IEEJ
Ou
tlo
ok
2018
IEE
J ©
201
7
Natural gas consumption (Asia)
By region By sector
Reference Scenario
52
0
200
400
600
800
1,000
1,200
1,400
1,600
1,800
1980 1990 2000 2015 2030 2040 2050
OthersKoreaJapanASEANIndiaChina
Mtoe
51116
232
547
965
1,285
1,567
0
200
400
600
800
1,000
1,200
1,400
1,600
1,800
1980 1990 2000 2015 2030 2040 2050
Transformation
Non-energy use
Buildings, etc.
Transport
Industry
Mtoe
IEEJ:October 2017 © IEEJ2017

IEEJ
Ou
tlo
ok
2018
IEE
J ©
201
7
Natural gas production Reference Scenario
53
3,493
4,668
5,521
6,300
0
1,000
2,000
3,000
4,000
5,000
6,000
7,000
2015 2030 2040 2050
Asia/Oceania
Non-OECD Europe/Central Asia
Latin America
North America
Africa
Middle East
Bcm
IEEJ:October 2017 © IEEJ2017

IEEJ
Ou
tlo
ok
2018
IEE
J ©
201
7
Natural gas net imports Reference Scenario
54
-17
-105-77
-14-50
32
-30 -17
14
125
42
152
-164 -180
-125-96
-54
5417 26
62
143106
203
-269 -260 -246
-134
-36
4873
101138 157
186222
-300
-200
-100
0
100
200
300
North America
Non-OECD
Europe/Central
Asia
Middle East
Oceania Africa Latin America
ASEAN Other Asia
India Japan/Korea/Chinese Taipei
China OECD Europe
Bcm
2015
2030
2050
Net exporters in 2050 Net importers in 2050
IEEJ:October 2017 © IEEJ2017

IEEJ
Ou
tlo
ok
2018
IEE
J ©
201
7
LNG imports Reference Scenario
55
191
3910 13 8 3
349
96
20 245 3
0
100
200
300
400
500
0
100
200
300
400
Asia Europe Middle East Latin America Africa North America
2016
2030
Mt Bcm
IEEJ:October 2017 © IEEJ2017

IEEJ
Ou
tlo
ok
2018
IEE
J ©
201
7
56
Unit: Bcm
36
37
166
24
14 24
61
38
55
15
34
10
Pipeline Gas LNG
16
7
Japan/Korea/ Chinese Taipei
Non-OECD Europe/ Central Asia
North America
Middle East
Latin America
Africa
OECD Europe
China
ASEAN
Oceania
South Asia
Major natural gas trade flows (2016) IEEJ:October 2017 © IEEJ2017

IEEJ
Ou
tlo
ok
2018
IEE
J ©
201
7
Reference Scenario
57
Unit: Bcm
25 35
49 30
26
103 148
45
27
23
23
25
68 22
42
22 13
22
Pipeline Gas LNG
16
Japan/Korea/ Chinese Taipei
Non-OECD Europe/ Central Asia
North America
Middle East
Latin America
Africa
OECD Europe
ASEAN
Oceania
South Asia
China
Major natural gas trade flows (2030) IEEJ:October 2017 © IEEJ2017

IEEJ
Ou
tlo
ok
2018
IEE
J ©
201
7
Coal consumption
By region
Reference Scenario
58
By sector
0
1,000
2,000
3,000
4,000
5,000
1980 1990 2000 2015 2030 2040 2050
OceaniaAfricaNon-OECD Europe/Central AsiaOECD EuropeMiddle EastAsiaLatin AmericaNorth America
Mtoe
1,783
2,220 2,311
3,8364,254
4,486 4,531
0
1,000
2,000
3,000
4,000
5,000
1980 1990 2000 2015 2030 2040 2050
Transformation
Non-energy use
Buildings, etc.
Transport
Industry
Mtoe
IEEJ:October 2017 © IEEJ2017

IEEJ
Ou
tlo
ok
2018
IEE
J ©
201
7
Coal consumption (Asia)
By region By sector
Reference Scenario
59
0
500
1,000
1,500
2,000
2,500
3,000
3,500
4,000
1980 1990 2000 2015 2030 2040 2050
OthersKoreaJapanASEANIndiaChina
Mtoe
466785
1,037
2,739
3,3203,632 3,754
0
500
1,000
1,500
2,000
2,500
3,000
3,500
4,000
1980 1990 2000 2015 2030 2040 2050
Transformation
Non-energy use
Buildings, etc.
Transport
Industry
Mtoe
IEEJ:October 2017 © IEEJ2017

IEEJ
Ou
tlo
ok
2018
IEE
J ©
201
7
Coal production
60
Reference Scenario
3,866 4,246
4,479 4,526
0
1,000
2,000
3,000
4,000
5,000
2015 2030 2040 2050
Oceania
Asia
Non-OECD Europe/Central Asia
Latin America
North America
Africa
Middle East
Mtoe
IEEJ:October 2017 © IEEJ2017

IEEJ
Ou
tlo
ok
2018
IEE
J ©
201
7
Coal net imports Reference Scenario
61
-254
-85-47 -51 -24
9
-14
-161
132 105 117
244
-307
-96-61 -49 -29
12 6
-128
112 131 157
252
-429
-117-59 -56 -53
15 1750 70
116
221 225
-500
-400
-300
-200
-100
0
100
200
300
Oceania Non-OECD
Europe/Central
Asia
Africa North America
Latin America
Middle East
Other Asia
ASEAN OECD Europe
China India Japan/Korea/ChineseTaipei
Mtoe
2015
2030
2050
Net exporters in 2050 Net importers in 2050
IEEJ:October 2017 © IEEJ2017

IEEJ
Ou
tlo
ok
2018
IEE
J ©
201
7
Major steam coal trade flows (2016)
62
Unit: Mt
Non-OECD Europe /Central Asia
North America
Middle East
Latin America
Africa
OECD Europe
China
India
92
5 16
103
44 154 62
43
60
5
20
4
22
9 9
15
58 8 5
21 21 6
Russia
Colombia
South Africa
58
13
4
5
3
6 3
5
2
3 3
3
9
60
6
2 3
7
South-East Asia
Mongolia
Indonesia
Australia
Japan/Korea/ Chinese Taipei
IEEJ:October 2017 © IEEJ2017

IEEJ
Ou
tlo
ok
2018
IEE
J ©
201
7
Reference Scenario
63
Major steam coal trade flows (2030)
90
5 19
96
41 142 80
47
57
9
57
4
9
7 9
15
53 5 4
19 19 6 53
72
5
4
4
6 5
39
3
3 4
12
17
93
5
2 3
2 2
5
9
3
Unit: Mt
Non-OECD Europe /Central Asia
North America
Middle East
Latin America
Africa
OECD Europe
China
India
Russia
Colombia
South-East Asia
Australia
Japan/Korea/ Chinese Taipei
South Africa
Indonesia
Mongolia
IEEJ:October 2017 © IEEJ2017

IEEJ
Ou
tlo
ok
2018
IEE
J ©
201
7
64
Major coking coal trade flows (2016)
3
27 63
7
4
7
2
13
13 19
40
5
8
7
5
4 4
15
24
1
1
Unit: Mt
Non-OECD Europe /Central Asia
North America
Middle East
Latin America
Africa
OECD Europe
China
India
Russia
Colombia
Mozambique
South-East Asia Indonesia
Mongolia
Australia
Japan/Korea/ Chinese Taipei
IEEJ:October 2017 © IEEJ2017

IEEJ
Ou
tlo
ok
2018
IEE
J ©
201
7
Reference Scenario
65
2
30 66
7
4
3 18
18 19
60
4
6
7
6
2 2
16
2
3
3
10
4
3
2
1
1 1
1
Unit: Mt
Major coking coal trade flows (2030)
Non-OECD Europe /Central Asia
North America
Middle East
Latin America
Africa
OECD Europe
China
India Colombia
South-East Asia
Japan/Korea/ Chinese Taipei
Australia
Russia
Mozambique
Indonesia
Mongolia
IEEJ:October 2017 © IEEJ2017

IEEJ
Ou
tlo
ok
2018
IEE
J ©
201
7
Fossil fuel supply/demand balances (Asia)
Oil
Reference Scenario
66
9411,489
2,006
-4,000
-3,000
-2,000
-1,000
0
1,000
2,000
3,000
4,000
2015 2030 2050
Production
Demand
Net imports
Mtoe
164 425780
-4,000
-3,000
-2,000
-1,000
0
1,000
2,000
3,000
4,000
2015 2030 2050
Mtoe
296 416 626
-4,000
-3,000
-2,000
-1,000
0
1,000
2,000
3,000
4,000
2015 2030 2050
Mtoe
Natural gas Coal
IEEJ:October 2017 © IEEJ2017

IEEJ
Ou
tlo
ok
2018
IEE
J ©
201
7
Electricity final consumption
By region By sector
Reference Scenario
67
0
500
1,000
1,500
2,000
2,500
3,000
3,500
1980 1990 2000 2015 2030 2040 2050
OceaniaAfricaNon-OECD Europe/Central AsiaOECD EuropeMiddle EastAsiaLatin AmericaNorth America
Mtoe
586835
1,092
1,737
2,373
2,852
3,324
0
500
1,000
1,500
2,000
2,500
3,000
3,500
1980 1990 2000 2015 2030 2040 2050
Buildings, etc.
Transport
Industry
Mtoe
IEEJ:October 2017 © IEEJ2017

IEEJ
Ou
tlo
ok
2018
IEE
J ©
201
7
Electricity final consumption (Asia)
By region By sector
Reference Scenario
68
0
200
400
600
800
1,000
1,200
1,400
1,600
1,800
1980 1990 2000 2015 2030 2040 2050
OthersKoreaJapanASEANIndiaChina
Mtoe
88158
280
740
1,152
1,441
1,705
0
200
400
600
800
1,000
1,200
1,400
1,600
1,800
1980 1990 2000 2015 2030 2040 2050
Buildings, etc.
Transport
Industry
Mtoe
IEEJ:October 2017 © IEEJ2017

IEEJ
Ou
tlo
ok
2018
IEE
J ©
201
7
Power generation mix Reference Scenario
Electricity generated Share
69
8,28311,864
15,471
24,255
32,965
39,101
44,838
0
10,000
20,000
30,000
40,000
50,000
1980 1990 2000 2015 2030 2040 2050
Other renewables
Hydro
Nuclear
Natural gas
Oil
Coal
TWh
0%
20%
40%
60%
80%
100%
1980 1990 2000 2015 2030 2040 2050
IEEJ:October 2017 © IEEJ2017

IEEJ
Ou
tlo
ok
2018
IEE
J ©
201
7
Power generation mix (Asia) Reference Scenario
Electricity generated Share
70
1,1962,252
4,013
10,204
15,895
19,641
22,874
0
5,000
10,000
15,000
20,000
25,000
1980 1990 2000 2015 2030 2040 2050
Other renewables
Hydro
Nuclear
Natural gas
Oil
Coal
TWh
0%
20%
40%
60%
80%
100%
1980 1990 2000 2015 2030 2040 2050
IEEJ:October 2017 © IEEJ2017

IEEJ
Ou
tlo
ok
2018
IEE
J ©
201
7
0
5
10
15
20
25
1980 1990 2000 2015 2030 2040 2050
North America
Latin America
Asia
Middle East
Non-OECD Europe
OECD Europe
Africa
Oceania
GtCO2
-1.1
-1.0
0.0
0.4
0.9
1.1
1.5
8.6
-0.6%
-0.9%
-0.4%
0.4%
1.2%
1.3%
2.4%
1.3%
North America
OECD Europe
Oceania
Non-OECD Europe
Latin America
Middle East
Africa
Asia
CAGR(2015-2050)
GtCO2
CO2 emissions
Changes (2015-2050) 2015 32.9 Gt
2050 44.1 Gt (×1.3)
World
Reference Scenario
71
IEEJ:October 2017 © IEEJ2017

IEEJ
Ou
tlo
ok
2018
IEE
J ©
201
7
0
2
4
6
8
10
12
1980 1990 2000 2015 2030 2040 2050
China
India
ASEAN
Japan
Korea
Others
GtCO2
-0.3
0.0
0.6
1.2
2.3
4.7
-0.7%
0.1%
2.0%
0.3%
3.0%
3.4%
Japan
Korea
Others
China
ASEAN
India
CAGR(2015-2050)
GtCO2
CO2 emissions (Asia) Reference Scenario
2015 15.1 Gt
2050 23.7 Gt (×1.6)
Asia
72
Changes (2015-2050)
IEEJ:October 2017 © IEEJ2017

IEEJ
Ou
tlo
ok
2018
IEE
J ©
201
7
Advanced Technologies Scenario
IEEJ:October 2017 © IEEJ2017

IEEJ
Ou
tlo
ok
2018
IEE
J ©
201
7
Advanced Technologies Scenario assumptions
In this Scenario, each country further enhances policies on energy security and address climate change. Technology developments and international technology transfers are promoted to further expand the penetration of innovative technologies.
Demand side technologies
■ IndustryUnder sectoral and other approaches, best available technologies on industrial processes (for steelmaking, cement, paper-pulp and oil refining) will be deployed globally
■ TransportClean energy vehicles (highly fuel efficient vehicles, hybrid vehicles, plug-in hybrid vehicles, electric vehicles, fuel cell vehicles) will diffuse further.
■ BuildingsEfficient electric appliances (refrigerators, TVs, etc.), highly efficient water-heating systems (heat pumps, etc.), efficient air conditioning systems and efficient lighting will diffuse further, with heat insulation enhanced.
Supply side technologies
■ Renewable energiesWind power generation, photovoltaic power generation, CSP (concentrated solar power) generation, biomass-fired power generation and biofuel will penetrate further.
■NuclearNuclear power plant construction will be accelerated with capacity factor improved.
■ Highly efficient fossil fuel-fired power generation technologiesCoal-fired power plants (SC,USC, A-USC, IGCC) and natural gas–fired more advanced combined cycle (MACC) plants will penetrate further.
■ Technologies for next-generation transmission and distribution networksLower loss type of transformation and voltage regulator will penerate further
■ Carbon capture and storage
Introducing and enhancing environmental regulations and national targetsEnvironment tax, emissions trading, RPS, subsidy, FIT, efficiency standards, automobile fuel efficiency standard, low carbon fuel standard, energy efficiency labeling, national targets, etc.
R&D investment expansion, international cooperation on energy efficient technology (steelmaking, cement and other areas), support for establishing energy efficiency standards, etc.
Promoting technology development and international technology cooperation
*SC: Super Critical, USC: Ultra Super Critical, A-USC: Advanced Ultra Super Critical
74
IEEJ:October 2017 © IEEJ2017

IEEJ
Ou
tlo
ok
2018
IEE
J ©
201
7
Major assumption: Energy and environmental technologies
2015 2050 (Reference, 2050)
OECD Non-OECDThermal power plant
[Thermal efficiency (stock basis)] Natural gas: 48.5% 55.7% (56.9%) Natural gas: 36.7% 47.3% (44.9%)Coal: 37.3% 44.4% (45.0%) Coal: 36.5% 40.2% (41.4%)
Nuclear Maintenance of appropriate price in wholesale electricity market
Maintenance of framework for financing initial investment
[Capacity] 2015: 309 GW 327 (241) 2015: 90 GW 629 (337)
Renewables System cost reduction System cost reductionCost reduction of power system Low cost investmentEfficient operation of power system Improvement of power system
[Capacity] Wind: 237 GW 1,091 (718) Wind: 178 GW 1,912 (1,152)Solar: 165 GW 909 (573) Solar: 60 GW 1,588 (946)
Biofuels Development of next generation biofuel Cost reduction of biofuelHigher diffusion of FFV Relating to agricultural policy
[Consumption] 50 Mtoe 107 (68) 26 Mtoe 94 (56)
IndustryTransportation[Average fuel efficiency of new vehicle sales] 14.5 km/L 41.1 (27.8) 12.9 km/L 28.6 (20.2)[Share in annual vehicle sales of ZEV] 0.8% 66% (35%) 0.5% 41% (17%)
Buildingsand insulation is twice. 20% improvement in 2050 in ratio of the Reference ScenarioElectrification and clean cooking in space heating, water heater and cooking
Maintenance of financial scheme for initial investment.
Installing CCS after 2030 (Countries which have storage potential except for aquifer)
Best available technology diffuses 100% in 2050Cost reduction of high fuel efficiency of vehicles. Twice of travel distance of ZEV
The pace of improvement of efficiency of newly installed appliance, equipment
Share of IGCC in install 0% 60% (20%)
Advanced Technologies Scenario
75
IEEJ:October 2017 © IEEJ2017

IEEJ
Ou
tlo
ok
2018
IEE
J ©
201
7
Nuclear power generation capacities Advanced Technologies Scenario
76
385 399492
577638
784
956
0
200
400
600
800
1,000
1,200
2030 2050 2030 2040 2050
2005 2015 Reference Advanced Technologies
Middle East/Africa
Latin America
FSU/Non-OECD Europe
OECD Europe
North America
Asia
GW
IEEJ:October 2017 © IEEJ2017
IEEJ
Ou
tlo
ok
2018
IEE
J ©
201
7
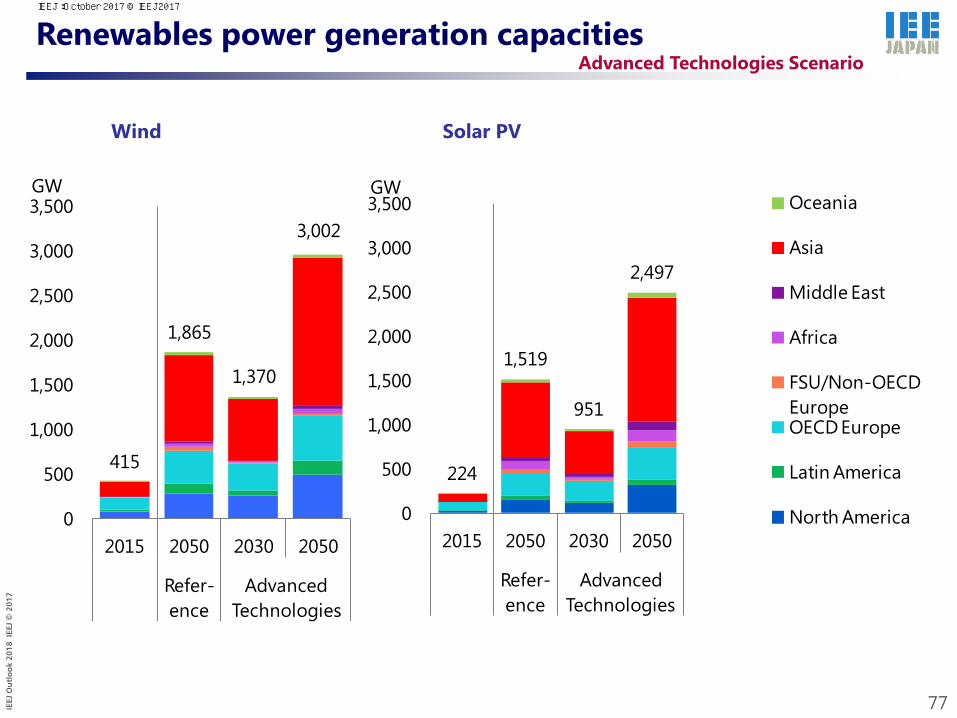
Renewables power generation capacities
Wind Solar PV
77
Advanced Technologies Scenario
415
1,865
1,370
3,002
0
500
1,000
1,500
2,000
2,500
3,000
3,500
2015 2050 2030 2050
Refer-ence
AdvancedTechnologies
GW
224
1,519
951
2,497
0
500
1,000
1,500
2,000
2,500
3,000
3,500
2015 2050 2030 2050
Refer-ence
AdvancedTechnologies
GWOceania
Asia
Middle East
Africa
FSU/Non-OECD EuropeOECD Europe
Latin America
North America
IEEJ:October 2017 © IEEJ2017
IEEJ
Ou
tlo
ok
2018
IEE
J ©
201
7
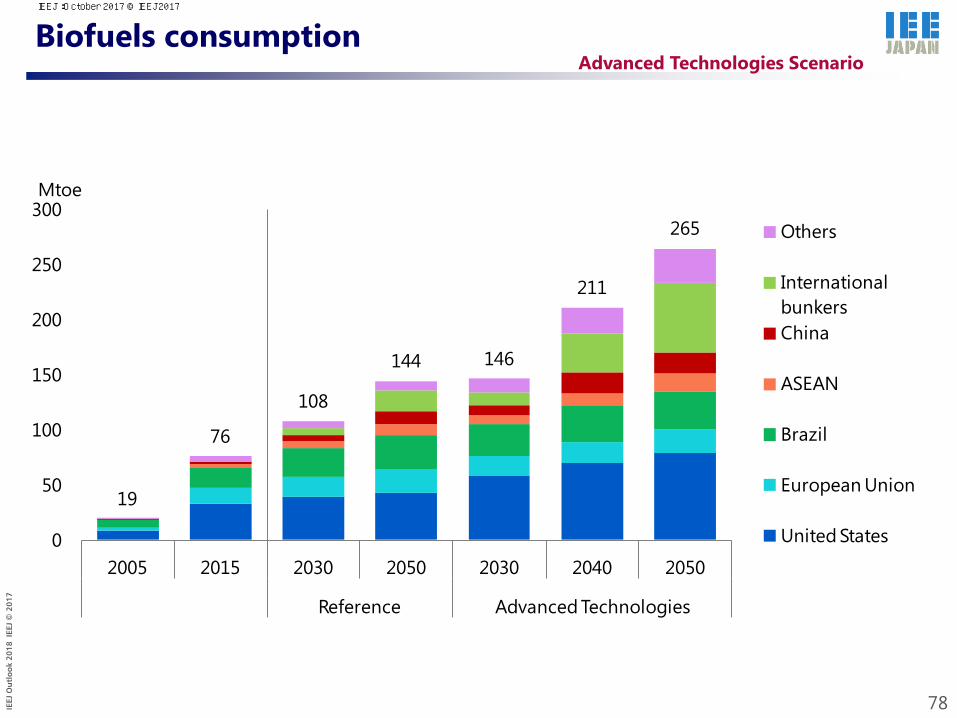
Biofuels consumption
78
Advanced Technologies Scenario
19
76
108
144 146
211
265
0
50
100
150
200
250
300
2005 2015 2030 2050 2030 2040 2050
Reference Advanced Technologies
Others
International bunkersChina
ASEAN
Brazil
European Union
United States
Mtoe
IEEJ:October 2017 © IEEJ2017

IEEJ
Ou
tlo
ok
2018
IEE
J ©
201
7
Vehicle stock and sales by type
Share of new passenger light-duty vehicle sales
Share of passenger light-duty vehicle stocks
79
Advanced Technologies Scenario
97%
56%
23%
2%
1%
1%
1%
25%
37%
9%
18%
8%21%
0% 0%
0%
20%
40%
60%
80%
100%
Reference Advanced Technologies
2015 2050
Plug-in hybrid vehicleElectric vehicleFuel cell vehicle
95%
50%
17%
2%
1%
0%
2%
25%
33%
11%
21%
12%28%
0% 1%
0%
20%
40%
60%
80%
100%
Reference Advanced Technologies
2015 2050
ICE (gasoline, diesel)Compressed natural gasHybrid vehicle
IEEJ:October 2017 © IEEJ2017

IEEJ
Ou
tlo
ok
2018
IEE
J ©
201
7
Fuel efficiency (New sales basis)
Fuel efficiency (Stock basis)
Fuel efficiency of passenger cars
80
Advanced Technologies Scenario
13.6
22.3
32.0
0
5
10
15
20
25
30
35
Reference Advanced Technologies
2015 2050
km/L43% up
12.5
20.4
27.8
0
5
10
15
20
25
30
35
Reference Advanced Technologies
2015 2050
km/L
36% up
IEEJ:October 2017 © IEEJ2017

IEEJ
Ou
tlo
ok
2018
IEE
J ©
201
7
Energy consumption per unit of output in industry
81
Advanced Technologies Scenario
73.2 64.3
80.6 71.2 75.6
66.5 80.1
70.9 68.7 60.6
0
20
40
60
80
100Re
fere
nce
Adva
nced
Tech
nolo
gies
Refe
renc
e
Adva
nced
Tech
nolo
gies
Refe
renc
e
Adva
nced
Tech
nolo
gies
Refe
renc
e
Adva
nced
Tech
nolo
gies
Refe
renc
e
Adva
nced
Tech
nolo
gies
2015 2050Iron and steel
2050Non-metallic
minerals
2050Chemical
2050Paper and pulp
2050Other industries
12% down 12% down 12% down 11% down 11% down2015=100
IEEJ:October 2017 © IEEJ2017

IEEJ
Ou
tlo
ok
2018
IEE
J ©
201
7
Total efficiency in buildings
82
Advanced Technologies Scenario
100
77.0
61.1
50.2 40.0
0
20
40
60
80
100
Reference AdvancedTechnologies
Reference AdvancedTechnologies
2015 2050, Household 2050, Commercial
21% down
20% down
2015=100
IEEJ:October 2017 © IEEJ2017

IEEJ
Ou
tlo
ok
2018
IEE
J ©
201
7
Power generation mix
Electricity generated Capacity
83
Advanced Technologies Scenario
24,255
44,838
31,482
39,733
0
10,000
20,000
30,000
40,000
50,000
2015 2050 2030 2050
Reference Advanced Technologies
Coal Natural gas Oil
TWh
6,169
12,547
8,567
12,488
0
2,000
4,000
6,000
8,000
10,000
12,000
14,000
2015 2050 2030 2050
Reference Advanced Technologies
Nuclear Hydro Other renewables
GW
IEEJ:October 2017 © IEEJ2017

IEEJ
Ou
tlo
ok
2018
IEE
J ©
201
7
Power generation mix (Asia)
84
Advanced Technologies Scenario
Electricity generated Capacity
10,204
22,874
15,136
20,032
0
5,000
10,000
15,000
20,000
25,000
2015 2050 2030 2050
Reference Advanced Technologies
Coal Natural gas Oil
TWh
2,530
6,178
4,094
6,421
0
1,000
2,000
3,000
4,000
5,000
6,000
7,000
2015 2050 2030 2050
Reference Advanced Technologies
Nuclear Hydro Other renewables
GW
IEEJ:October 2017 © IEEJ2017

IEEJ
Ou
tlo
ok
2018
IEE
J ©
201
7
Carbon intensity of electricity
*CO2 emissions per kWh at generation end
World Asia
85
Reference & Advanced Technologies Scenarios
374
251
641
566 541
507
445
389
200
300
400
500
600
700
1980 1990 2000 2010 2020 2030 2040 2050
Reference
gCO2/kWh
AdvancedTechnologies
464
322
638 613
646 622
555
487
200
300
400
500
600
700
1980 1990 2000 2010 2020 2030 2040 2050
Reference
gCO2/kWh
AdvancedTechnologies
IEEJ:October 2017 © IEEJ2017

IEEJ
Ou
tlo
ok
2018
IEE
J ©
201
7
Energy savings by region and by sector
Final energy consumption Energy savings by region and by sector
86
Advanced Technologies Scenario
Industry
Transport
Buildings, etc.
Non-energy use
0
2,000
4,000
6,000
8,000
10,000
12,000
14,000
16,000
2015 2050Reference
2050Advanced
Technologies
Mtoe
9,384
13,675
13,675Mtoe
11,831Mtoe
2050Reference
2050Advanced Technologies
United States
OECD EuropeJapan
Other OECDChina
India
Other Asia
OtherNon-OECD
Buildings, etc.
Transport
Industry
Intl. bunkers
IEEJ:October 2017 © IEEJ2017

IEEJ
Ou
tlo
ok
2018
IEE
J ©
201
7
Primary energy consumption reduction
87
Advanced Technologies Scenario
8,774
10,028
12,873 13,647
16,562
18,374
19,789
15,71716,693
17,219
8,000
10,000
12,000
14,000
16,000
18,000
20,000
1990 2000 2010 2015 2020 2030 2040 2050
International bunkersNon-OECDOECDReferenceAdvanced Technologies
Mtoe
IEEJ:October 2017 © IEEJ2017

IEEJ
Ou
tlo
ok
2018
IEE
J ©
201
7
Primary energy consumption reduction (Asia)
88
Advanced Technologies Scenario
2,108
2,887
4,818 5,459
7,434
8,548
9,351
7,078
7,794 8,156
2,000
4,000
6,000
8,000
10,000
1990 2000 2010 2015 2020 2030 2040 2050
Other AsiaASEANIndiaChinaReferenceAdvanced Technologies
Mtoe
IEEJ:October 2017 © IEEJ2017

IEEJ
Ou
tlo
ok
2018
IEE
J ©
201
7
Primary energy consumption by source
World Asia
89
Reference Scenario (solid) Advanced Technologies Scenario (dotted)
Reference & Advanced Technologies Scenarios
0
1,000
2,000
3,000
4,000
5,000
6,000
1980 1990 2000 2010 2020 2030 2040 2050
Mtoe
Oil
Coal
Natural gasOther renewables
NuclearHydro
Fossil fuel share81% (2015) 79% (Reference) 68% (Advanced
Technologies)
0
500
1,000
1,500
2,000
2,500
3,000
3,500
4,000
1980 1990 2000 2010 2020 2030 2040 2050
Mtoe
Fossil fuel share85% (2015) 82% (Reference) 71% (Advanced
Technologies)
Oil
Coal
Natural gas
Other renewables
Nuclear Hydro
IEEJ:October 2017 © IEEJ2017
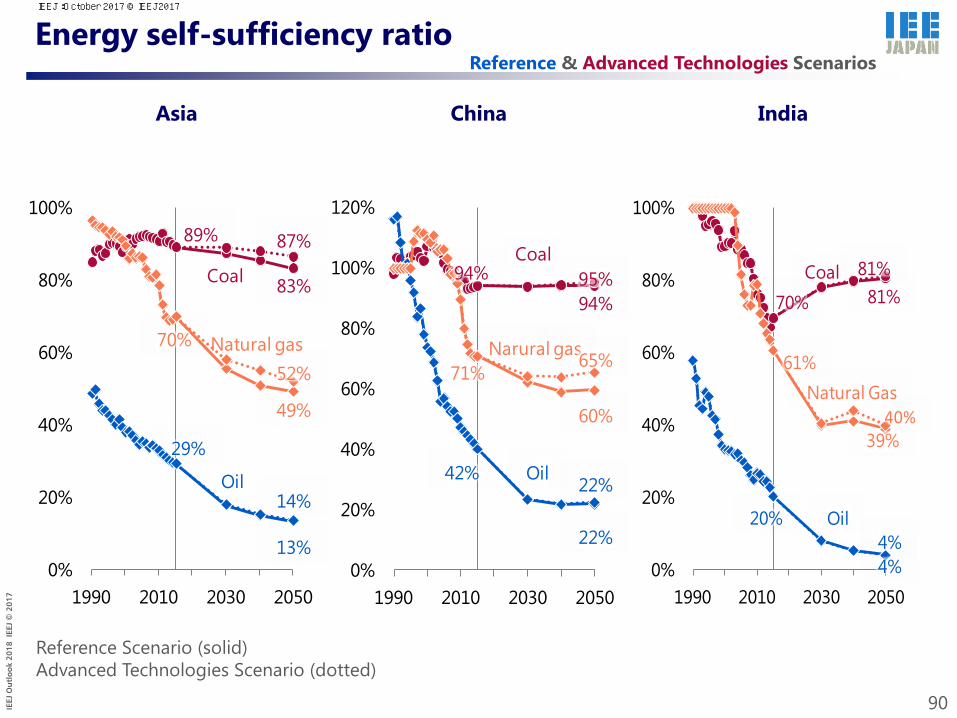
IEEJ
Ou
tlo
ok
2018
IEE
J ©
201
7
Energy self-sufficiency ratio
Asia China India
90
Reference & Advanced Technologies Scenarios
Reference Scenario (solid) Advanced Technologies Scenario (dotted)
0%
20%
40%
60%
80%
100%
1990 2010 2030 2050
Coal
Natural gas
Oil
70%
49%
52%
29%
14%
13%
89% 87%
83%
0%
20%
40%
60%
80%
100%
120%
1990 2010 2030 2050
Coal
Narural gas
Oil
71%
60%
65%
42% 22%
22%
94% 95%94%
0%
20%
40%
60%
80%
100%
1990 2010 2030 2050
Coal
Natural Gas61%
40%
20%4%4%
70%
39%
81%81%
Oil
IEEJ:October 2017 © IEEJ2017

IEEJ
Ou
tlo
ok
2018
IEE
J ©
201
7
CO2 emission reduction by region
91
Advanced Technologies Scenario
21.223.4
31.332.9
38.1
41.6
44.1
33.432.1
29.7
20
30
40
50
1990 2000 2015 2030 2040 2050
GtCO2United States
Japan
Other OECD
China
India
Other Asia
Other non-OECD
International bunkers
Reference
Advanced Technologies
IEEJ:October 2017 © IEEJ2017

IEEJ
Ou
tlo
ok
2018
IEE
J ©
201
7
CO2 emission reduction by region (Asia)
92
Advanced Technologies Scenario
4.96.9
13.315.1
19.522.0
23.7
17.0 17.0 16.0
0
10
20
30
1990 2000 2015 2030 2040 2050
GtCO2
China
India
Other Asia
ASEAN
Reference
Advanced Technologies
IEEJ:October 2017 © IEEJ2017

IEEJ
Ou
tlo
ok
2018
IEE
J ©
201
7
CO2 emission reduction by technology
93
Advanced Technologies Scenario
21.223.4
31.332.9
38.1
41.644.1
33.4 32.1
29.7
20
30
40
50
1990 2000 2015 2030 2040 2050
GtCO2
Efficiency
Biofuels
Wind, solar, etc.
Nuclear
Fuel switching
CCS
Reference
Advanced Technologies
IEEJ:October 2017 © IEEJ2017

IEEJ
Ou
tlo
ok
2018
IEE
J ©
201
7
CO2 emission reduction by technology (Asia)
94
Advanced Technologies Scenario
4.96.9
13.315.1
19.522.0
23.7
17.0 17.0 16.0
0
10
20
30
1990 2000 2015 2030 2040 2050
GtCO2
Efficiency
Biofuels
Wind, solar, etc.
Nuclear
Fuel switching
CCS
Reference
Advanced Technologies
IEEJ:October 2017 © IEEJ2017

IEEJ
Ou
tlo
ok
2018
IEE
J ©
201
7
Energy outlook in China, India and ASEAN
IEEJ:October 2017 © IEEJ2017

IEEJ
Ou
tlo
ok
2018
IEE
J ©
201
7
Primary energy consumption in China
96
8711,130
2,973
3,6954,005 4,021
3,416
0
1,000
2,000
3,000
4,000
1990 2000 2015 2030 2040 2050 2050
Reference AdvancedTechnolo-
gies
Otherrenewables
Hydro
Nuclear
Natural gas
Oil
Coal
Mtoe
Reference & Advanced Technologies Scenarios
IEEJ:October 2017 © IEEJ2017

IEEJ
Ou
tlo
ok
2018
IEE
J ©
201
7
97
Final energy consumption in China
654 781
1,906
2,3462,532 2,555
2,215
0
500
1,000
1,500
2,000
2,500
3,000
1990 2000 2015 2030 2040 2050 2050
Reference AdvancedTechnolo-
gies
Non-energyuse
Buildings, etc.
Transport
Industry
Mtoe
Reference & Advanced Technologies Scenarios
IEEJ:October 2017 © IEEJ2017

IEEJ
Ou
tlo
ok
2018
IEE
J ©
201
7
Fossil fuel supply/demand balances in China
Oil Natural gas Coal
98
Reference Scenario
319576 614
-2,500
-2,000
-1,500
-1,000
-500
0
500
1,000
1,500
2,000
2,500
2015 2030 2050
ProductionDemandNet imports
Mtoe
46 119 210
-2,500
-2,000
-1,500
-1,000
-500
0
500
1,000
1,500
2,000
2,500
2015 2030 2050
ProductionDemandNet imports
Mtoe
114 125 110
-2,500
-2,000
-1,500
-1,000
-500
0
500
1,000
1,500
2,000
2,500
2015 2030 2050
ProductionDemandNet imports
Mtoe
IEEJ:October 2017 © IEEJ2017

IEEJ
Ou
tlo
ok
2018
IEE
J ©
201
7
99
Power generation mix in China
Electricity generated Capacity
Reference & Advanced Technologies Scenarios
5,844
8,441
10,763
9,298
0
2,000
4,000
6,000
8,000
10,000
12,000
2015 2030 2050 2050
Reference AdvancedTechnolo-
gies
Coal Natural gas Oil
TWh
1,511
2,387
3,354 3,421
0
1,000
2,000
3,000
4,000
2015 2030 2050 2050
Reference AdvancedTechnolo-
gies
Nuclear Hydro Other renewables
GW
IEEJ:October 2017 © IEEJ2017

IEEJ
Ou
tlo
ok
2018
IEE
J ©
201
7
100
Primary energy consumption in India
306 441
851
1,585
2,061
2,545
2,158
0
500
1,000
1,500
2,000
2,500
3,000
1990 2000 2015 2030 2040 2050 2050
Reference AdvancedTechnolo-
gies
Other renewablesHydro
Nuclear
Natural gas
Oil
Coal
Mtoe
Reference & Advanced Technologies Scenarios
IEEJ:October 2017 © IEEJ2017

IEEJ
Ou
tlo
ok
2018
IEE
J ©
201
7
101
Final energy consumption in India
243 315
578
1,056
1,383
1,729
1,494
0
500
1,000
1,500
2,000
1990 2000 2015 2030 2040 2050 2050
Reference Advanced Technolo-
gies
Non-energy useBuildings, etc.
Transport
Industry
Mtoe
Reference & Advanced Technologies Scenarios
IEEJ:October 2017 © IEEJ2017

IEEJ
Ou
tlo
ok
2018
IEE
J ©
201
7
102
Fossil fuel supply/demand balances in India
Oil Natural gas Coal
Reference Scenario
164348
656
-1,500
-1,000
-500
0
500
1,000
1,500
2015 2030 2050
ProductionDemandNet imports
Mtoe
17 75169
-1,500
-1,000
-500
0
500
1,000
1,500
2015 2030 2050
ProductionDemandNet imports
Mtoe
115 159 222
-1,500
-1,000
-500
0
500
1,000
1,500
2015 2030 2050
ProductionDemandNet imports
Mtoe
IEEJ:October 2017 © IEEJ2017

IEEJ
Ou
tlo
ok
2018
IEE
J ©
201
7
103
Power generation mix in India
Electricity generated Capacity
Reference & Advanced Technologies Scenarios
1,383
3,106
5,663
4,845
0
1,000
2,000
3,000
4,000
5,000
6,000
2015 2030 2050 2050
Reference AdvancedTechnolo-
gies
Coal Natural gas Oil
TWh
280
649
1,3371,507
0
200
400
600
800
1,000
1,200
1,400
1,600
2015 2030 2050 2050
Reference AdvancedTechnolo-
gies
Nuclear Hydro Other renewables
GW
IEEJ:October 2017 © IEEJ2017

IEEJ
Ou
tlo
ok
2018
IEE
J ©
201
7
104
Primary energy consumption in ASEAN
233379
621
982
1,259
1,544 1,472
0
200
400
600
800
1,000
1,200
1,400
1,600
1,800
1990 2000 2015 2030 2040 2050 2050
Reference AdvancedTechnolo-
gies
Other renewablesHydro
Nuclear
Natural gas
Oil
Coal
Mtoe
Reference & Advanced Technologies Scenarios
IEEJ:October 2017 © IEEJ2017

IEEJ
Ou
tlo
ok
2018
IEE
J ©
201
7
105
Final energy consumption in ASEAN
173270
436
645
817
1,006873
0
200
400
600
800
1,000
1,200
1990 2000 2015 2030 2040 2050 2050
Reference Advanced Technolo-
gies
Non-energy useBuildings, etc.Transport
Industry
Mtoe
Reference & Advanced Technologies Scenarios
IEEJ:October 2017 © IEEJ2017

IEEJ
Ou
tlo
ok
2018
IEE
J ©
201
7
106
Fossil fuel supply/demand balances in ASEAN Reference Scenario
91
201
395
-500
-400
-300
-200
-100
0
100
200
300
400
500
2015 2030 2050
ProductionDemandNet imports
Mtoe
-4610
72
-500
-400
-300
-200
-100
0
100
200
300
400
500
2015 2030 2050
ProductionDemandNet imports
Mtoe
-163-128
50
-500
-400
-300
-200
-100
0
100
200
300
400
500
2015 2030 2050
ProductionDemandNet imports
Mtoe
Oil Natural gas Coal
IEEJ:October 2017 © IEEJ2017

IEEJ
Ou
tlo
ok
2018
IEE
J ©
201
7
107
Power generation mix in ASEAN
Electricity generated Capacity
Reference & Advanced Technologies Scenarios
868
1,670
3,2202,882
0
500
1,000
1,500
2,000
2,500
3,000
3,500
2015 2030 2050 2050
Reference AdvancedTechnolo-
gies
Coal Natural gas Oil
TWh
217
355
689 667
0
200
400
600
800
2015 2030 2050 2050
Reference AdvancedTechnolo-
gies
Nuclear Hydro Other renewables
GW
IEEJ:October 2017 © IEEJ2017

IEEJ
Ou
tlo
ok
2018
IEE
J ©
201
7
Peak Oil Demand Case
IEEJ:October 2017 © IEEJ2017

IEEJ
Ou
tlo
ok
2018
IEE
J ©
201
7 Expectation on penetration speed of ZEVs varies a lot. In the Peak Oil Demand Case, 30% and 100% of global new car (passenger and freight) sales are assumed to be ZEVs in 2030 and in 2050, respectively. Sensitivity analysis of energy supply and demand was conducted assuming that the electricity demand increased by the ZEVs will be met by thermal power generation.
109
❖ Assumption of new car sales ❖ Car ownership
Note: ZEV consists of plug-in hybrid vehicles, electric vehicles and fuel cell vehicles
New car sales and car ownership Peak Oil Demand Case
0%9% 14% 20%
Conven-tional
30%
66%
ZEV100%
0%
20%
40%
60%
80%
100%
2015 2030 2040 2050 2030 2040 2050
Reference Peak Oil Demand
0% 5% 10% 15%
Conven-tional
14%
40%
ZEV74%
0%
20%
40%
60%
80%
100%
2015 2030 2040 2050 2030 2040 2050
Reference Peak Oil Demand
IEEJ:October 2017 © IEEJ2017

IEEJ
Ou
tlo
ok
2018
IEE
J ©
201
7 Assuming that the supply and demand relaxation will result in a decline in international oil prices. In the Peak Oil Demand Case, the prices begin to decline after the 2020s and fall to $50/bbl in 2050.
110
❖ Assumption of real crude oil prices
Oil prices Peak Oil Demand Case
52
70
95
115125
44
7065
6050
0
20
40
60
80
100
120
140
2010 2020 2030 2040 2050
$2
01
6/b
bl
Reference
Peak Oil Demand
IEEJ:October 2017 © IEEJ2017

IEEJ
Ou
tlo
ok
2018
IEE
J ©
201
7
Utilisation of natural gas in Asia
IEEJ:October 2017 © IEEJ2017

IEEJ
Ou
tlo
ok
2018
IEE
J ©
201
7
Golden age of natural gas coming to Asia
Changes (2015-2050) Shares (2050)
112
While natural gas demand grows at a slow pace currently, it grows at the fastest pace among primary energy sources in long term. In the Advanced Technologies Scenario, the increases are the largest among fossil fuels and the share increases by 6%p from 2015.
1,020
1,015
993
444
330
90
748
-240
644
649
807
90
-500 0 500 1,000 1,500
Natural gas
Coal
Oil
Others
Nuclear
Hydro
Mtoe
Advanced Technologies Reference
10%17%
Natural gas, 16%
Coal
Oil
Nuclear
Hydro
Others
Inside: 2015Middle: Reference, 2050Outside: Advanced Technologies, 2050
Reference & Advanced Technologies Scenarios
IEEJ:October 2017 © IEEJ2017

IEEJ
Ou
tlo
ok
2018
IEE
J ©
201
7
To ensure golden age of natural gas coming to Asia
Improving flexibility in LNG market Demand in new LNG importing countries in Asia has high uncertainty, thus more flexible supply system is required. Survey on LNG Trades published by Japan Fair Trade Commission in June 2017 point out that providing destination clauses under a fixed-term FOB contract is likely to be in violation of the Antimonopoly Act. Not only new contracts or timing of renewal contracts but also existing contracts are required to be reviewed for destination restrictions. If Fair Trade Commission in other Asian countries have the same announcement, lifting destination restrictions becomes standard in LNG market
Supporting finance While natural gas supply requires large investments, private finance cannot afford the investment amount. Public support is essential. Financial support from each government, the Export Credit Agencies which have the companies in the country which are interested in infrastructure building and multilateral development bank such as the World Bank and the Asian Development Bank in financial arrangements are important.
Developing and implementing natural gas usage policies (energy mix) The advantage (clean, geographical dispersal, and ease of usage) of natural gas has is scarcely reflected to the price and political support is required. To reduce uncertainties of new investment of infrastructure as much as possible, political commitment by the government is required and implementing energy mix target is recommended.
Human capacity building The shortfall in human resources for rapid development of natural gas and LNG demand in both of the governments and industries is likely to hinder swift decision-making. LNG requires more expertise for deal, security, and environment more than other energy. If the countries which have been consuming LNG such as Japan play an active role, it would help increases the LNG usage in Asia significantly.
In order to ensure increase of natural gas usage, policy implementation by each government and public entity in the following area are important.
113
IEEJ:October 2017 © IEEJ2017

IEEJ
Ou
tlo
ok
2018
IEE
J ©
201
7
Role of coal and its efficient use
IEEJ:October 2017 © IEEJ2017

IEEJ
Ou
tlo
ok
2018
IEE
J ©
201
7
0
2,000
4,000
6,000
8,000
10,000
12,000
2015 2030 2050 2050
Reference AdvancedTechnolo-
gies
TWh
0
1,000
2,000
3,000
4,000
5,000
6,000
2015 2030 2050 2050
Reference AdvancedTechnolo-
gies
TWh
0
500
1,000
1,500
2,000
2,500
3,000
3,500
2015 2030 2050 2050
Reference AdvancedTechnolo-
gies
Other renewablesHydro
Nuclear
Oil
Natural gas
Coal
TWh
Share of coal in power generation
China ASEAN
115
In the Reference Scenario, most of the increase of coal-fired power generation occurs in Asia, especially in India and ASEAN. In the Advanced Technologies Scenario, electricity generated from coal declines significantly even in Asia, due to the lower electricity demand with the further progress of energy conservation, and the shift from coal to other sources in power generation. However, in India, Indonesia and other ASEAN countries with abundant coal resources, the construction of coal-fired power plants continues from the viewpoint of energy security and economic efficiency.
India
IEEJ:October 2017 © IEEJ2017

IEEJ
Ou
tlo
ok
2018
IEE
J ©
201
7
0.709
0.774
0.811
0.896
0.0 0.2 0.4 0.6 0.8 1.0
IGCC(1,500°C class)
USC
SC
sub-C
CO2 emssions per kWh (kg-CO2)
0.5
0.6
0.7
0.8
0.9
1.0
36 38 40 42 44 46 48 50 52 54 56 58 60
Gross thermal efficiency (%), LHV
(kg-CO2)
SC, 42%
sub-C, 38%
USC, 44%
A-USC, 48%
IGCC (1,500°C class), 48%
A-IGCC,A-IGFC, 60%
IGFC, 57%
IGCC (1,700°C class), 52%
High efficiency coal-fired power plant and CO2 emissions
Thermal efficiency and CO2 emissions per kWh CO2 emissions per kWh by plant
116
With the improvement of the thermal efficiency, CO2 emissions per kWh in SC, USC and IGCC are respectively 90%, 86%, 79% of that in sub-c coal fired plants. On the other hand, their plant costs are more expensive, about 1.2, 1.3, 1.5 times of that of sub-c plant. Though high thermal efficiency do reduce fuel costs, financial support remains necessary for the introduction of high-efficiency power plants. To ensure future commercialisation and wide utilisation of IGCC, cost reductions are required.
Cost of coal-fired power plant
Source: estimated from IEA, “World Energy Outlook 2016”
sub-C SC USC IGCC
Plant cost ($/kW) 1,422 1,689 1,867 2,144
IEEJ:October 2017 © IEEJ2017
Contact :[email protected]