ieee/acm supercomputing 2006 - purdue university …€¢ subcast component stopped responding to...
TRANSCRIPT

Problem Diagnosis in Large-ScaleProblem Diagnosis in Large Scale Computing Environments
IEEE/ACM Supercomputing 2006
Slide 1/25
IEEE/ACM Supercomputing 2006
Finding Errors in HPC is Difficult• Hard analyzing execution of interacting processes
• Bugs in concurrent systems not present in g y psequential software
• Non-interactive nature complicates error detection
Slide 2/25

Main Contributions• Locate causes of anomalies in distributed systems
Find processes substantially different from othersIdentify the function that explains anomaliesIdentify the function that explains anomalies
• Automate problem detection to some extent
Inject Agent to Collect run-time Identifies
Slide 3/25
Monitor Processes
Co ect u t eexecution data Anomalies
Problem Diagnosis ProcessCollect control-flow
traces until application fails
• Inject agent into every process• Record function calls/returns
Identify process that fails
• Non-trivial with silent or non-stop failures• Identify process that is different from the others• Distance-based outlier detection• Can work with or without
Slide 4/25
previous normal traces
Root Cause Identification • Determine why process behaved differently from the others
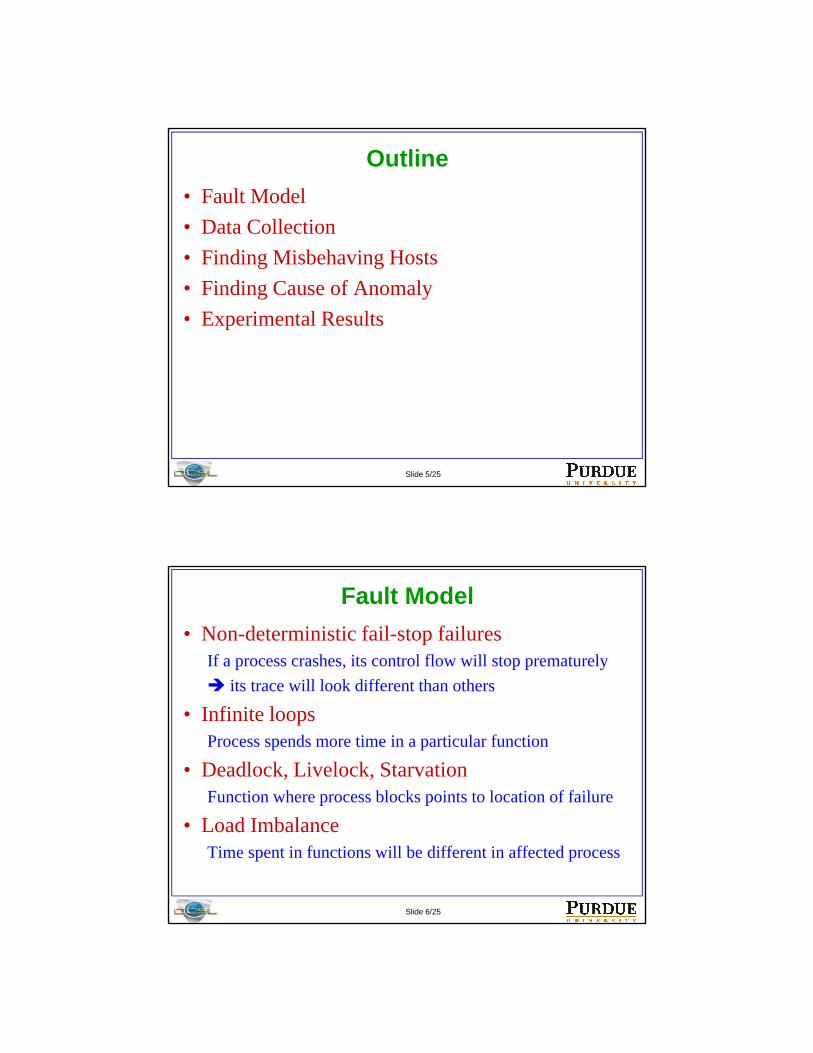
Outline• Fault Model• Data Collection• Finding Misbehaving Hosts• Finding Cause of Anomaly• Experimental Results
Slide 5/25
Fault Model• Non-deterministic fail-stop failures
If a process crashes, its control flow will stop prematurelyits trace will look different than othersits trace will look different than others
• Infinite loopsProcess spends more time in a particular function
• Deadlock, Livelock, StarvationFunction where process blocks points to location of failure
Slide 6/25
p p
• Load ImbalanceTime spent in functions will be different in affected process

Undetectable Problems• Massive failures
Problem happens on all nodes
• Problems with no change in the control flow
• Faults that are activated long before its manifestation
Slide 7/25
manifestationCircular buffer only retains fixed number of recent events
Problem Diagnosis ProcessCollect control-flow
traces until application fails
Collect control-flow traces until application
fails
Identify process that fails
Slide 8/25
Root Cause Identification

Data Collection• When application starts, an agent is
injectedAgent is a shared library (application’s
Shared memory
Agent is a shared library (application s address space)
Hijack mechanism to force library loadingRecords function calls and returnsPublished in MMCN ’05
ssA
gent
ssA
gent
Buffer
Slide 9/25
• Agents do not communicate to each other
• Buffer saved in shared memoryIf process dies, buffer is still available
Proc
es
Proc
es…
Problem Diagnosis ProcessCollect control-flow
traces until application fails
Collect control-flow traces until application
fails
Identify process that failsIdentify process that fails
Slide 10/25
Root Cause Identification
Earliest Last Timestamp• Process that stopped generating traces is reported
as an anomalyEffective for fail stop problemsEffective for fail-stop problems
• Simple detection mechanism:1. Compare absolute last timestamps (ti) across hosts2. Compute µ (mean) and σ (std. deviation)
Slide 11/25
p µ ( ) ( )3. If earliest ti substantially different from µ and σ, report
anomaly
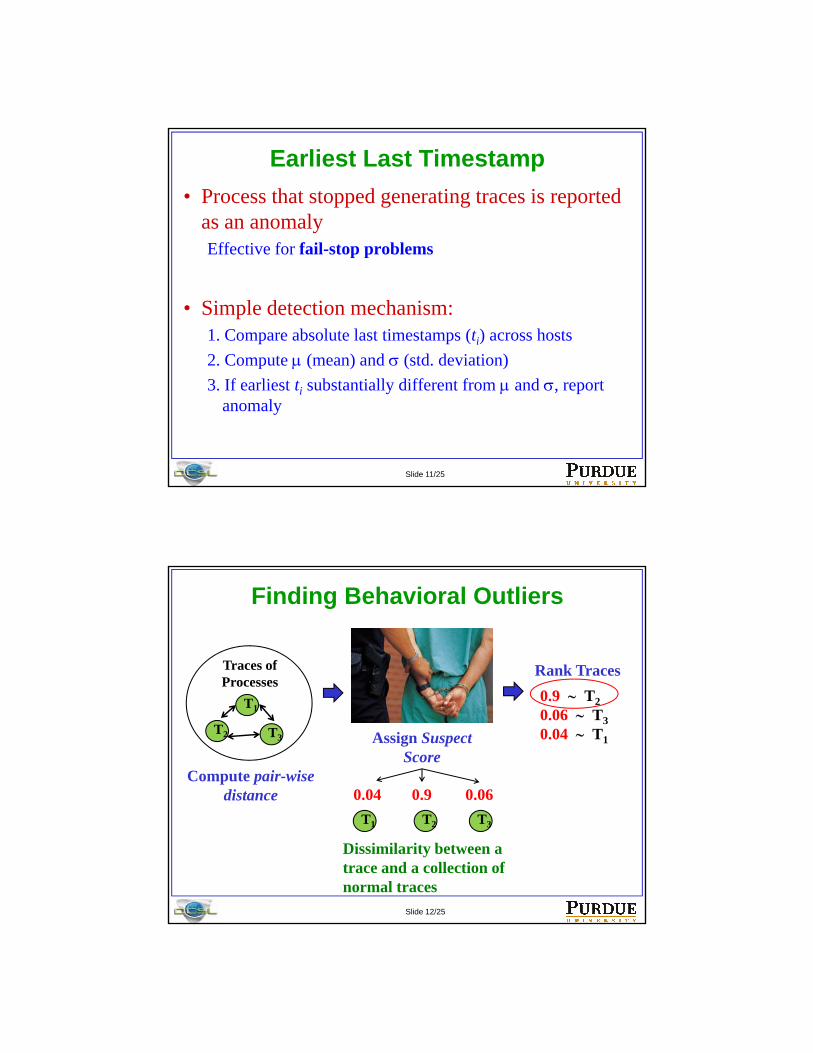
Finding Behavioral Outliers
Traces of Processes
Rank Traces
T1
Processes
T3T2
Compute pair-wise distance
Assign Suspect Score
0.90.04 0.06
0.9 ∼ T20.06 ∼ T30.04 ∼ T1
Slide 12/25
T1 T2 T3
Dissimilarity between a trace and a collection of normal traces

Pair-wise Distance Metric• Distance between traces of two hosts g and h• The profile of a host h is a vector p(h) of length F
F ∼ total number of functions in applicationith component is the time t(h, fi) spent in function fi
T(h) ∼ total runtime of the application ∑==
F
i ifhthT1
),()(
Slide 13/25
• Can treat different call paths as different functions(A → B → C) = f1, (D → E → C) = f2
Pair-wise Distance Metric (2)• Distance between traces g and h, d(g, h):
Manhattan length of the component-wise difference vector between p(g) and p(h)between p(g) and p(h)
Slide 14/25

Suspect Scores• Goal: computing suspect score for each trace
Largest score will be probably an anomaly
• Two cases:Unsupervised case: traces data only from failed executionSupervised case: additional data from normal previous run
is provided
Slide 15/25
• Supervised case increases Accuracy of outlier detection
Suspect Scores — Unsupervised
• For each trace h ∈ T, order all traces in Taccording to their distance to h:
• The suspect score for h is the distance of h to its kth nearest neighbor hk :
Slide 16/25
g k
• High suspect score Trace considered abnormal
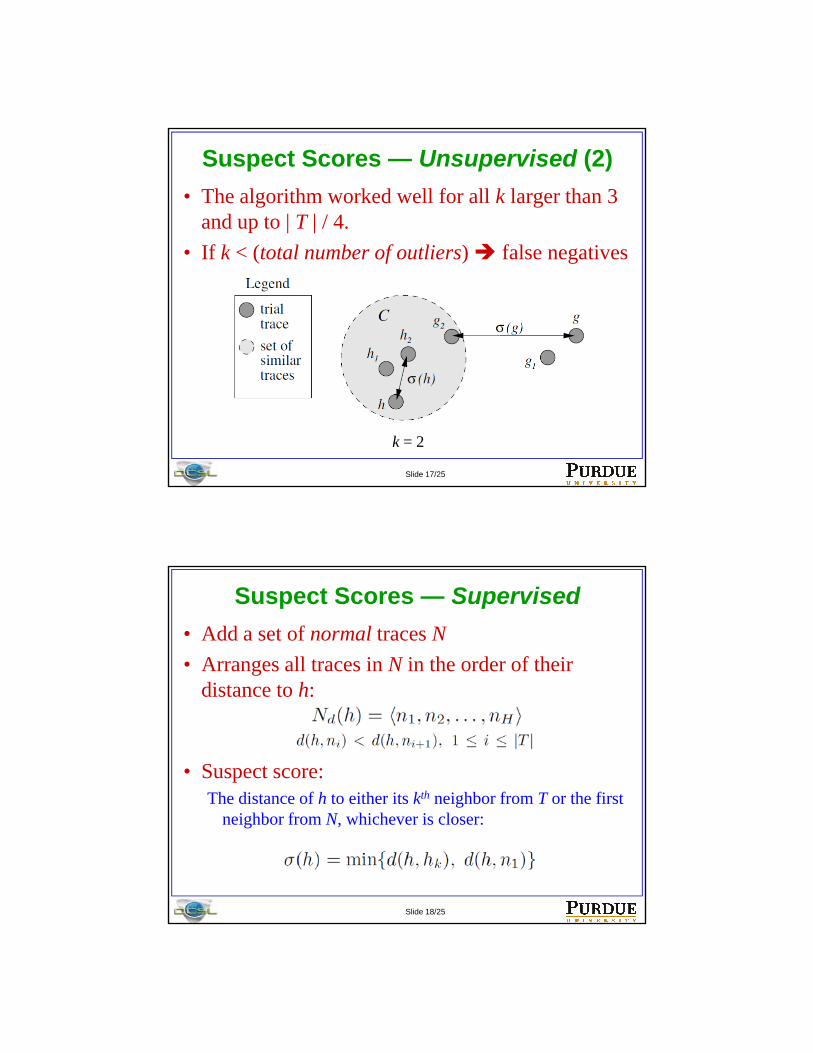
Suspect Scores — Unsupervised (2)• The algorithm worked well for all k larger than 3
and up to | T | / 4.If k < (t t l b f tli ) f l ti• If k < (total number of outliers) false negatives
Slide 17/25
k = 2
Suspect Scores — Supervised• Add a set of normal traces N• Arranges all traces in N in the order of their
di t t hdistance to h:
• Suspect score:The distance of h to either its kth neighbor from T or the first
Slide 18/25
gneighbor from N, whichever is closer:

Suspect Scores — Supervised (2)
Slide 19/25
k = 2
Problem Diagnosis ProcessCollect control-flow
traces until application fails
Identify process that failsIdentify process that fails
Slide 20/25
Root Cause IdentificationRoot Cause Identification

Finding Cause of Anomalies1. Last Trace Entry
• Pinpoint the last function executed by the faulty host
2. Maximum component of Delta Vector• Component δi of δ(h, g) corresponds to the contribution of
function fii to the distance
3 A l Ti I t l
Slide 21/25
3. Anomalous Time Interval• Identify the first moment when the anomalous host
started deviating from the norm
Experimental Test-bed
• Evaluated the techniques by locating bugs in SCore:• Large-scale cluster of workstations • Distributed job scheduling, checkpointing, process
migration• 129 nodes in Tokyo Institute of Technology
Slide 22/25
• C++ code base with 200,000 lines, 700 source files

Problem 1: Network Stability• Symptoms:
1. System stopped scheduling jobs2 Failure detected after 10 minutes and daemons were restarted2. Failure detected after 10 minutes and daemons were restarted3. Failure happened multiple times in two months
• Findings:• Node 14 stopped generating trace data 500 sec earlier• SCore terminated by calling the score_panic function• Source code used to determined that score panic was called by
Slide 23/25
Source code used to determined that score_panic was called by freeze_sending
• freeze_sending was reported as problematic with certain NICs
Problem 2: No response to requests
• subcast component stopped responding to request• Largest contribution to the node’s suspect score in:
Slide 24/25
• Used the Jumpshot tool to determine application entered in a loop within last two functions

Summary• Automated approach for problem determination
• Combines dynamic instrumentation and trace analysis for explaining failures
• Find the cause of problems in large-scale systems running similar tasks
Slide 25/25
running similar tasks