ieee transactions, tip-03364-2007-final 1 practical
TRANSCRIPT

IEEE TRANSACTIONS, TIP-03364-2007-FINAL 1
Practical Poissonian-Gaussian noise modeling andÞtting for single-image raw-data
Alessandro Foi, Mejdi Trimeche, Vladimir Katkovnik, and Karen Egiazarian, Senior member, IEEE
Abstract�We present a simple and usable noise model for theraw-data of digital imaging sensors. This signal-dependent noisemodel, which gives the pointwise standard-deviation of the noiseas a function of the expectation of the pixel raw-data output, iscomposed of a Poissonian part, modeling the photon sensing, andGaussian part, for the remaining stationary disturbancies in theoutput data. We further explicitly take into account the clippingof the data (over- and under-exposure), faithfully reproducingthe nonlinear response of the sensor. We propose an algorithmfor the fully automatic estimation of the model parameters givena single noisy image. Experiments with synthetic images as wellas with real raw-data from various sensors prove the practicalapplicability of the method and the accuracy of the proposedmodel.
Index Terms�clipping, digital imaging sensors, noise estima-tion, noise modeling, overexposure, Poisson noise, raw-data.
I. INTRODUCTIONProgress in hardware design and manufacturing has intro-
duced digital imaging sensors having a dramatically increasedresolution. This is mainly achieved by an increase of thepixel density. Despite the electrical and thermal characteristicsof the sensors have noticeably improved in the last decade[18], [15], with the size of each pixel becoming smaller andsmaller the sensor output signal�s susceptibility to photon noisehas become greater and greater. As of now, this source ofnoise appears as the most signiÞcant contributor of the overallnoise in a digital imaging sensor [1]. This makes the noisecomponent of the raw-data output of the sensor markedlysignal-dependent, thus far from the conventional additive whiteGaussian noise modeling so widely used in image processing.Further, with the intention of making full use of the ratherlimited dynamic range of digital sensors, pictures are usuallytaken with some areas purposely overexposed or clipped,i.e. accumulating charge beyond the full-well capacity ofthe individual pixels. These pixels obviously present highlynonlinear noise characteristics, which are completely differentthan those of normally exposed pixels.The raw-data which comes from sensor always under-
goes various processing stages (e.g., denoising, demosaicking,deblurring, compression) before the Þnal �cooked� imagereaches the user. In order to process the data and/or to attenuate
A. Foi, V. Katkovnik, and K. Egiazarian are with the Department of SignalProcessing, Tampere University of Technology, P.O. Box 553, 33101 Tampere,Finland. E-mail: Þrstname.lastname@tut.ÞM. Trimeche is with the Multimedia Technologies Laboratory, Nokia
Research Center, Tampere, Finland, E-mail: Þ[email protected] work was supported by the Finnish Funding Agency for Technology
and Innovation (Tekes), AVIPA/AVIPA2 projects, and by the Academy ofFinland, project No. 213462 (Finnish Centre of Excellence program 2006 -2011).
the noise in the most efÞcient and effective way, it is vital thata proper modeling of the noise is considered during the variousstages of digital image processing. However, the technicaldatasheets of the devices usually provide vague and inadequateÞgures for the noise that are of a global nature (i.e., �average�values which are meant to be valid for the whole sensor)[17]. Consequently, raw-data Þltering algorithms either assumeindependent stationary noise models or, if a signal-dependentmodel is assumed, the correct parameters for the noise areoften not speciÞed. Such rough noise estimates are inadequatefor the high-quality image processing Þlters which are rapidlybecoming an integral part of the imaging chain.Two are the contributions in this paper. First, we present
a simple noise model which can accurately be used for theraw-data. Based on the above considerations, it is a signal-dependent noise model based on a Poissonian part, modelingthe photon sensing, and Gaussian part, for the remaining sta-tionary disturbances in the output data. We explicitly take intoaccount the problem of clipping (over- and under-exposure),faithfully reproducing the nonlinear response of the sensor.Only two parameters are sufÞcient to fully describe the model.These parameters are explained in relation to the sensor�shardware characteristics (quantum efÞciency, pedestal, gain).As a second and most important contribution, we proposean algorithm for the fully automatic estimation of the modelparameters given a single noisy image.The paper is organized as follows. In Section II we present
the model in its basic form, which ignores the clipping. Theparameter estimation algorithm is then presented in SectionIII. The general model with clipping requires more involvedmathematics, and it is given in Section IV, followed bythe modiÞed estimation algorithm in Sections V and VI.Throughout these sections, we demonstrate the accuracy ofthe algorithm with synthetic test images, for which the exactnoise parameters are known. Experiments with real raw-dataare presented in Section VII; these experiments prove thepractical applicability of the method and conÞrm that theraw-data noise can indeed be accurately modeled as a clippedPoissonian-Gaussian process. Further comments and details onthe algorithm and its implementation are given in Section VIII.
II. POISSONIAN-GAUSSIAN MODELINGLet us consider the generic signal-dependent noise observa-
tion model of the formz (x) = y (x) + σ (y (x)) ξ (x) (1)
where x ∈ X is the pixel position in the domain X, z : X →R is the observed (recorded) signal, y : X → R is the original

2 IEEE TRANSACTIONS, TIP-03364-2007-FINAL
(unknown) signal, ξ : X → R is zero-mean independentrandom noise with standard deviation equal to 1, and σ :R → R+ is a function of y that gives the standard deviationof the overall noise component. Throughout the paper, wedenote the expected value (or mathematical expectation) ofa random variable as E {·}, its variance as var {·}, and itsstandard deviation as std {·} =pvar {·}; when any of theseoperators is applied to a sequence (resp. matrix) of randomvariables, its output is deÞned as the sequence (resp. matrix)of the operator�s outputs for the individual random variables.The symbol σ is used exclusively to denote this function ofthe model (1). From E {ξ (x)} = 0 follows that E {z (x)} =y (x), i.e. the original signal can be deÞned as the expectedvalue of the noisy observations. Consequently, we have thatstd {z (x)} = σ (E {z (x)}), i.e. the standard deviation of thenoise is a function, namely σ, of the expectation of the noisysignal.In our modeling, we assume that the noise term is com-
posed of two mutually independent parts, a Poissonian signal-dependent component ηp and a Gaussian signal-independentcomponent ηg:
σ (y (x)) ξ (x) = ηp (y (x)) + ηg (x) . (2)In terms of distributions, these two components are character-ized as follows,χ¡y (x) + ηp (y (x))
¢ ∼ P (χy (x)) , ηg (x) ∼ N (0, b) ,where χ > 0 and b ≥ 0 are real scalar parameters and P andN denote the Poisson and normal (i.e., Gaussian) distributions.From the elementary properties of the Poisson distribution, weobtain the following equation for the mean and variance
E©χ¡y (x) + ηp (y (x))
¢ª= var
©χ¡y (x) + ηp (y (x))
¢ª=
= χy (x) .
Since E©χ¡y (x) + ηp (y (x))
¢ª= χy (x)+χE
©ηp (y (x))
ªand χ2 var
©ηp (y (x))
ª= χy (x), it follows that
E©ηp (y (x))
ª= 0 and var
©ηp (y (x))
ª= y (x) /χ.
Thus, the Poissonian ηp has varying variance that depends onthe value of y (x), var
©ηp (y (x))
ª= ay (x), where a = χ−1.
The Gaussian component ηg has instead constant varianceequal to b.Consequently, the overall variance of z in (1) has the afÞne
form
σ2 (y (x)) = ay (x) + b, (3)
which gives the standard deviation σ as the square rootσ (y (x)) =
pay (x) + b, (4)
and, in particular, σ (0) =√b and σ (1) =
√a+ b.
Some examples of standard-deviation functions σ for dif-ferent combinations of the constants a and b are shown, as anillustration, in Figure 1 (solid lines).Figure 2 presents a simple piecewise smooth image which
is degraded by Poissonian and Gaussian noise with parametersχ = 100 (a = 0.01) and b = 0.042. As illustrated in Figure1, these parameters imply that the noise standard-deviation inthe brightest parts of the image is more than twice as large asin the darker ones.
A. Raw-data modeling
The Poissonian-Gaussian model (1-2) is naturally suitedfor the raw-data of digital imaging sensors. The Poissoniancomponent ηp models the signal-dependent part of the errors,which is essentially due to the photon-counting process, whilethe Gaussian ηg accounts for the signal-independent errorssuch as electric and thermal noise. We brießy mention howthe above model parameters relate to elementary aspects ofthe digital sensor�s hardware.1) Quantum efÞciency: The parameter χ of ηp is related to
the quantum efÞciency of the sensor: the larger the numberof photons necessary to produce a response of the sensor(generation of an electron), the smaller the χ.2) Pedestal parameter: In digital imaging sensors, the
collected charge is always added to some base �pedestal� levelp0 ∈ R+. This constitutes an offset-from-zero of the outputdata and it can be rewritten as a shift in the argument of thesignal-dependent part of the noise:
z (x) = y (x) + σ (y (x)− p0) ξ (x) == y (x) + ηp (y (x)− p0) + ηg (x) .
3) Analog gain: We model the analog gain as an ampli-Þcation of the collected charge. Let us denote the variablesbefore ampliÞcation by the circle superscriptû,
ûz (x) =ûy (x) +ûηp (ûy (x)− p0) +ûηg (x) .We formalize the ampliÞcation Θ ofûz as the multiplication ofthe noise-free signal, of the Poissonian noise, and of a part ofthe Gaussian noise, by a scaling constant θ > 1,z(x) =Θ (ûz(x)) = θ
¡ûy(x) +ûηp(ûy(x)−p0) +ûη0g(x)
¢+ûη00g (x).
Here, the Gaussian noise term ûηg has been split in twocomponentsûη0g andûη
00g ,ûη
0g+ûη
00g = ηg, whereûη
00g represents the
portion of the noise that is introduced after the ampliÞcationand thus not affected by the factor θ. The expectation andvariance for z are
E {z (x)} = y (x) = θûy (x) , var {z (x)} == θ2χ−1 (ûy (x)− p0)+θ2 var
©ûη0g (x)
ª+var
©ûη00g (x)
ª.
Hence, we come again to a model of the form (3)-(4) witha = χ−1θ, b = θ2 var
©ûη0g (x)
ª+ var
©ûη00g (x)
ª− θ2χ−1p0.Note that now this b can be negative, provided a large pedestalp0 and a small variance ofûηg. This does not mean that there isa �negative� variance. Indeed, because of the pedestal, y ≥ θp0and therefore ay + b ≥ 0.In digital cameras, the analog gain (i.e., θ) is usually
controlled by the choice of the ISO sensitivity setting. Thiscan be done manually by the user, or automatically by thecamera (�auto mode�). Large ISO numbers (e.g., 800 or 1600)correspond to large θ, and thus worse signal-to-noise ratio(SNR). Lower values (e.g., ISO 50) yield a better SNR but atthe same time produce darker images, unless these are takenwith a longer exposure time (which corresponds to havinglarger values of ûy before the multiplication by θ).Figure 3 shows few examples of the standard-deviation
functions σ which can typically be found for the raw data.Two of these examples have b < 0, which corresponds to apedestal p0 > 0.

FOI ET AL., PRACTICAL POISSONIAN-GAUSSIAN NOISE MODELING AND FITTING FOR SINGLE-IMAGE RAW-DATA 3
Fig. 1. Some examples of the standard-deviation functions σ (solid lines) from the model (1) for different combinations of the constants a and b of Equation(4): (left) a = 0.022, 0.062, 0.102, b = 0.042 and (right) a = 0.42, b = 0.022, 0.062, 0.102. The dashed lines show the corresponding functions �σ of theclipped observation model (30), as functions of the clipped �y (see Section IV). The small black triangles indicate the points (�y, �σ (�y)) which correspond toy = 0 and y = 1.
Fig. 2. A piecewise smooth test image of size 512 × 512: original y andobservation z degraded by Poissonian and Gaussian noise with parametersχ = 100 (a = 0.01) and b = 0.042.
B. Heteroskedastic normal approximationThroughout the following sections, we need to derive a few
results and relations which depend not only on the mean andvariance, but also on the particular distribution of the processedsamples. For the sake of simpliÞcation, we exploit the usualnormal approximation of the Poisson distribution, which gives
P (λ) ≈ N (λ, λ) . (5)The accuracy of this approximation increases with the para-meter λ and in practice, for large enough1 λ, a Poissonianprocess can be treated as a special heteroskedastic Gaussianone. We thus obtain the following normal approximations ofthe errors
σ (y (x)) ξ (x) =pay (x) + bξ (x) ' ηh (y (x)) , (6)
where ηh (x) ∼ N (0, ay (x) + b).
III. THE ALGORITHMOur goal is to estimate the function σ : R → R+ of the
observation model (1) from a noisy image z. The proposedalgorithm is divided in two main stages: local estimationof multiple expectation/standard-deviation pairs and globalparametric model Þtting to these local estimates. An initial
1How large λ is enough really depends on the considered applicationand desired accuracy. The fact that the Poisson distribution is discrete isa secondary aspect, because quantization of the digital data makes anywaydiscrete even errors due to continuous distributions.For the considered standard-deviation estimation problem, we found exper-
imentally that already with λ = 10 (corresponding to χ = 20 for the middleintensity y = 0.5) there is virtually no difference between the estimationaccuracy of a truly Poissonian variable and that of its Gaussian approximation.
Fig. 3. Some examples of the standard-deviation functions σ (solid lines)which are often found for the raw data. In these three examples the parameters(a, b) from Equation (4) are
!1.5 · 10−3, 10−4", !6 · 10−4,−5 · 10−6", and!
10−4,−8 · 10−6". The dashed lines show the corresponding functions �σ ofthe clipped observation model (30), as functions of the clipped �y (see SectionIV). The small black triangles indicate the points (�y, �σ (�y)) which correspondto y = 0 and y = 1.
preprocessing stage, in which the data is transformed to thewavelet domain and then segmented into non-overlapping levelsets where the data is smooth, precedes the estimation.
A. Wavelet domain analysisSimilar to [4], we facilitate the noise analysis by considering
wavelet detail coefÞcients zwdet deÞned as the downsampledconvolution
zwdet =↓2 (z ~ ψ) ,where ψ is a 2-D wavelet function with zero mean and unity52-norm,
Pψ = 0, kψk2 = 1, and ↓2 denotes the decimation
operator that discards every second row and every secondcolumn. Analogously, we deÞne the normalized approximationcoefÞcients as
zwapp =↓2 (z ~ ϕ) ,where ϕ is the corresponding 2-D wavelet scaling function,which we specially normalize so that
Pϕ = 1.
For noisy images, the detail coefÞcients zwdet contain mostlynoise and, due to the normalizations of the convolution kernels,we have
std©zwdet
ª= ↓2 (std {z ~ ψ}) =↓2
µqvar {z}~ ψ2
¶' (7)
' ↓2 (std {z} kψk2) =↓2 (std {z}) == ↓2 (σ (y)) = σ (↓2 y) = σ (↓2 (y
Pϕ)) '
' σ (↓2 (y ~ ϕ)) = σ (E {zwapp}) , (8)

4 IEEE TRANSACTIONS, TIP-03364-2007-FINAL
Fig. 4. From left to right: wavelet approximation and detail coefÞcients zwapp and zwdet, restricted on the set of smoothness Xsmo, and two level-sets Si(13) computed for ∆i = ∆ = 1/300. The scale of this Þgure is half that of Fig. 2.
with the approximate equalities ' becoming accurate at pointsin regions where y (and hence std {z}) is uniform, as we canassume that the distribution of z does not change over thesmall support of the wavelets. Thus, in particular, at a pointx in such uniform regions, we can assume that
zwdet (x) ∼ N (0, σ (E {zwapp (x)})) , (9)and, because of decimation and orthogonality properties ofwavelet functions, that the noise degrading zwdet, as well asthe noise degrading zwapp, are independent ones.Note that, always, kϕk2 6= 1. Therefore, when considering
std {zwapp}, the above equations can be repeated, replacing ψwith ϕ, only provided that the factor kϕk2 is kept. Thus, wecome to
std {zwapp} ' kϕk2 σ (zwapp) .In our implementation, we use separable kernels ψ = ψ1~
ψT1 and ϕ = ϕ1 ~ ϕT1 where ψ1 and ϕ1 are 1-D Daubechieswavelet and scaling functions
ψ1 = [0.035 0.085 − 0.135 − 0.460 0.807 − 0.333] , (10)ϕ1 = [0.025 − 0.060 − 0.095 0.325 0.571 0.235] .
B. SegmentationLike in our previous work [6], we segment the data into
level sets, in each of which the image can be reasonablyassumed to be uniformly close to a certain value. Havingnothing but a noisy image at our disposal, we shall employspatial smoothing (as opposed to temporal smoothing, used in[6]) in order to attenuate the noise and an edge-detector inorder to stay clear from edges when analyzing the data, thusenabling the conditions (7)-(8).There exist a myriad of different methods which can be
used for smoothing or for edge detection. However, for ourpurposes, the following simple and non-adaptive methodsproved adequate for all considered experimental cases.1) Smoothed approximation: From zwapp, we compute a
smoothed (low-pass) image zsmo,zsmo = zwapp ~7, (11)
where 7 is positive smoothing kernel, 7 ≥ 0 and k7k1 =1. The smoothing action of the kernel should be especiallystrong, so to effectively suppress most of the noise. In ourimplementation, we use a uniform 7× 7 kernel for 7.In the corresponding regions where y itself is smooth, zsmo
is approximately equal to E {zwapp}, and thus to ↓2 y. This is
a reasonable assumption provided that the support of 7 doesnot intersect edges during the calculation of the convolution(11).2) Edges and set of smoothness: To detect edges, we use
the conventional approach where some smoothed derivativesof the image are thresholded against an estimate of the localstandard deviation. Exploiting the fact that the mean of theabsolute deviations of N (0, 1) is equal to
p2/π [7], we can
deÞne a rough estimate of the local standard-deviations of zwdetas the map
s =
rπ
2
¯̄zwdet
¯̄~7.
We deÞne the set of smoothness Xsmo asXsmo = {x ∈↓2 X :
: |∇ (Λ (zwapp)) (x)|+ |Λ (zwapp) (x)| < τ · s (x)}, (12)Λ (zwapp) = ∇2medÞlt (zwapp) ,
where ∇ and ∇2 are, respectively, gradient and Laplacianoperators, medÞlt denotes a 3 × 3 median Þlter, ↓2 X is thedecimated domain of the wavelet coefÞcients zwapp, and τ > 0is positive threshold constant. We realize both the Laplacianoperator ∇2 and the gradient operator ∇ as convolutionsagainst 9× 9 kernels. Thresholding the sum of the moduli ofthe Laplacian and of its gradient is a heuristic way to obtain�thickened� edges.In Figure 4, we show the wavelet approximation and detail
coefÞcients zwapp and zwdet, restricted on the set of smoothnessXsmo (whose complement thus appears as white in the Þgure),calculated for the test image z of Figure 2. Note that some ofthe weakest edges have not been detected as such.3) Level sets (segments): In the set of smoothness Xsmo,
we can assume that edges of the image did not interfere withthe smoothing (11), hence, that the conditions (7)-(8) hold andthat, for x ∈ Xsmo,zsmo(x) = E {zwapp(x)} = E {(↓2 z)(x)} = (↓2 y)(x) ,
std©zwdet(x)
ª= std {(↓2 z)(x)} = (↓2 (σ (y)))(x).
We identify in the smoothness set Xsmo a collection ofN non-overlapping level sets (segments) Si ⊂ Xsmo, i =1, . . . , N of the smoothed image zsmo. Each level set, char-acterized by its centre value ui and allowed deviation ∆i > 0,is deÞned asSi = {x ∈ Xsmo : zsmo(x) ∈ [ui −∆i/2, ui +∆i/2)} . (13)

FOI ET AL., PRACTICAL POISSONIAN-GAUSSIAN NOISE MODELING AND FITTING FOR SINGLE-IMAGE RAW-DATA 5
By non-overlapping we mean that Si ∩ Sj = ∅ ifi 6= j. In practice, assuming a signal in the range [0, 1],one can take Þxed ∆i ≡ ∆ and equispaced ui ∈©∆j, j = 1, . . . , N̄ =
§∆−1
¨ª, where the b·c brackets indi-
cate the rounding to the nearest larger or equal integer. Further,we require that the level sets are non-trivial, in the sense thateach set Si must contain at least two samples2; thus, N ≤ N̄and
SNi=1 Si ⊆ Xsmo ⊆↓2 X. Figure 4 shows two of the level
sets computed for the example in Figure 2 for ∆ = 1/300.Observe that these sets are meager and quite fragmented.
C. Local estimation of expectation/standard-deviation pairsFor each level set Si, we deÞne the (unknown) variable
yi =1
ni
niXj=1
E {zwapp (xj)} , {xj}nij=1 = Si. (14)
Note that yi and ui might not coincide. The level set Si is usedas a one domain for the computation of a pair of estimates(�yi, �σi), where �yi is an estimate of yi and �σi is an estimateof σ (yi). In what follows, although we shall refer explicitlyto yi, this variable is always used implicitly and, in the Þnalestimation of the function y 7→ σ (y), the many yi, i, . . . , N ,remain �hidden� variables which are modeled as unknown.Similarly, the smoothed data zsmo and the values ui and ∆iused for the construction of Si do not appear in the followingestimation, where only zwdet, zwapp and Si are used in orderto compute the estimates �yi and �σi.1) Estimation of yi: We estimate yi as the sample mean of
the approximation coefÞcients zwapp on Si
�yi =1
ni
niXj=1
zwapp (xj) , {xj}nij=1 = Si. (15)
2) Estimation of σ (yi): The estimate �σi is calculated as theunbiased sample standard-deviation of the detail coefÞcientszwdet on Si
�σi =1
κni
sPnij=1
¡zwdet (xj)− z̄wdeti
¢2ni − 1 , (16)
where z̄wdeti = 1ni
Pnij=1 z
wdet (xj) and the factor κ−1ni isdeÞned [7]
κn =
r2
n− 1Γ¡n2
¢Γ¡n−12
¢ = 1− 1
4n− 7
32n2+O
µ1
n3
¶. (17)
This factor, which comes from the mean of the chi-distributionwith n− 1 degrees of freedom, makes the estimate unbiasedfor normally and identically independently distributed (i.i.d.)zwdet (xj).3) Unbiasedness: Clearly from the deÞnition (14), �yi is an
unbiased estimator of yi.The unbiasedness of �σi as an estimator of σ (yi) is a
more complex issue. As observed above, �σi is an unbiasedestimator of σ (yi) provided that zwdet is normally i.i.d. onthe level set Si. However, we cannot claim, in general,that zwdet is identically distributed on Si. We remark that
2The smoothness threshold τ (12) can be automatically increased in therare event of N < 2, i.e. when there are not enough non-trivial level sets forthe estimation. Note that Xsmo is monotonically enlarging to ↓2 X with τ ,Xsmo %
τ→∞↓2 X.
the assumed validity of (7)-(8) concerns individual points.It does not mean that std
©zwdet
ªis constant over Si. As
a matter of fact, especially for large ∆i, E {zwapp (x)} isnot constant for x ∈ Si, which implies that the standarddeviations of the wavelet detail coefÞcients (8) are not constantover Si. Lacking any particular hypothesis on the image y,it is nevertheless reasonable to assume that {E {zwapp (x)},x ∈ Si} has a symmetric (discrete) distribution centred at yi(with diameter bounded by ∆i). Because of (3) and (9), wehave that {var©zwdet (x)ª, x ∈ Si} has also a symmetricaldistribution, which is centred at var {yi}. This makes κ2ni�σ2ian unbiased3 estimator of var {yi} and, since κn →
n→∞ 1,�σi is an asymptotically unbiased estimator of σ (yi). Thisasymptotic unbiasedness is relevant in the practice, since alarge ∆i corresponds to large ni.We further note that, despite the segmentation and removal
of edges, the presence of sharp image features, singularities, oreven texture in the segment Si is not completely ruled out. Thiscan be effectively compensated by means of non-linear robustestimators of the standard deviation, such as the well-knownmedian of absolute deviations (MAD) [12]. For the sake ofexpository simplicity, in the current and in the next sectionwe restrict ourself to the basic estimator (16) and postponeconsiderations on robust estimation of the standard-deviationto Section VI.4) Variance of the estimates: The variance of the estimates
�yi and �σi depends directly on the variances of the samplesused for the estimation, which are degraded by independentnoise. With arguments similar to Section III-C.3, the variancesof the estimates can be expressed as
var {�yi} = σ2 (yi) ci, var {�σi} = σ2 (yi) di, (18)
ci =kϕk22ni
, di =1− κ2niκ2ni
=1
2ni+
5
8n2i+O
µ1
n3i
¶, (19)
where these expressions coincide with those for the perfectcase when var
©zwdet
ªand var {zwapp} are constant on Si [7].
5) Distribution of the estimates: The estimates �yi and �σiare distributed, respectively, following a normal distributionand a scaled non-central chi-distribution, which can alsobe approximated, very accurately for large ni, as a normaldistribution [7]. Thus, in what follows, we treat both �yi and�σi as normally distributed random variables and, in particular,as�yi ∼ N
¡yi, σ
2 (yi) ci¢, �σi ∼ N
¡σ (yi) , σ
2 (yi) di¢, (20)
where ci and di are deÞned as in (19).
D. Maximum-likelihood Þtting of a global parametric modelThe maximum-likelihood (ML) approach is used to Þt a
global parametric model of the function σ on the estimates{�yi, �σi}Ni=1. Depending on the parameters a and b, we haveσ2 (y) = ay + b. For reasons of numerical consistency (notethat formally this σ2 (y) may be zero or negative), for theÞtting we deÞne a simple regularized variance-function σ2regas
σ2reg (y) = max¡ε2reg, σ
2 (y)¢
(21)
3This can be proved easily since, for x ∈ Xsmo, we can treat E#zwdet (x)
$as zero.

6 IEEE TRANSACTIONS, TIP-03364-2007-FINAL
Fig. 5. Each dot of the scatter plot corresponds to a pair (�yi, �σi) of estimatesof yi and σ (yi). The solid line shows the maximum-likelihood estimate �σÞtof the true standard-deviation function σ. The plot of �σÞt overlaps perfectlywith that of the true σ (shown in Figure 1). The estimated parameters are�a = 0.01008 (�χ = 99.20) and �b = 0.001583 (
%�b = 0.03979). The
initialization parameters, found as the least-squares solution (26), were �a0 =0.00994 (�χ0 = 100.62) and �b0 = 0.001649 (
%�b0 = 0.04061).
where εreg > 0 is a small regularization parameter. Hence,the regularized standard-deviation σreg =
qσ2reg (y) is always
well deÞned, for any choice of a, b, and y.As discussed in Section III-C.5, we can assume normality
and unbiasedness for both �yi and �σi. Thus, the conditionalprobability densities of �yi and �σi given yi = y are, respec-tively,
℘ (�yi|yi = y) = 1√2πσ2reg(y)ci
e− 12σ2reg(y)ci
(�yi−y)2,
℘ (�σi|yi = y) = 1√2πσ2reg(y)di
e− 12σ2reg(y)di
(�σi−σreg(y))2.
Further, we observe that, because of the orthogonality of thewavelets, �yi and �σi are mutually independent4. Hence,℘ ((�yi, �σi) |yi = y) = ℘ (�yi|yi = y)℘ (�σi|yi = y) = (22)
=1
2π√cidi
1
σ2reg (y)e− 12σ2reg(y)
!(�yi−y)2
ci+(�σi−σreg(y))2
di
".
The posterior likelihood L is obtained by considering allmeasurements {(�yi, �σi)}Ni=1 and by integrating the densities℘ ((�yi, �σi) |yi = y) with respect to a prior probability density℘0 (y) of y,
L (a, b) =NYi=1
Z ∞
−∞℘ ((�yi, �σi) |yi = y)℘0 (y) dy. (23)
The integration copes with the fact that yi and y are unknown.For images in the range [0, 1], the simplest and most obviouschoice is ℘0 to be uniform on [0, 1], which implies that (23)becomes L (a, b) =
QNi=1
R 10℘ ((�yi, �σi) |yi = y) dy. In our
experiments with synthetic images we use this prior. However,we wish to note that other prior statistics have been shown tobe more representative of the histograms of natural images[10]. Let us observe that (�yi, �σi) and (�yj , �σj) , i 6= j, aremutually independent because the corresponding level sets Siand Sj are non-overlapping.
4This independence is a general property of the sample mean and sam-ple standard-deviation, which property holds also when the estimates arecomputed from the very same samples [7]. However, by sampling twoindependent sets of wavelet coefÞcients, we have that the two estimatesare necessarily independent, regardless of the particular mean and standard-deviation estimators used, a fact that comes useful for the forthcomingsections.
From (23), the sought parameter estimates �a and �b aredeÞned as the solution of³�a,�b´
= argmaxa,b
L (a, b) = argmina,b
− lnL (a, b) = (24)
= argmina,b
−NXi=1
ln
Z℘((�yi, �σi) |yi = y)℘0 (y) dy.
Hence, our Þnal estimate of the function σ is
�σÞt (y) =
rmax
³0, �ay +�b
´. (25)
Figure 5 shows the result of the above optimization forthe test example shown in Figure 2. It can be seen that theprocedure estimates the parameters of the noise with greataccuracy.1) Iterative solution and initialization: In our implementa-
tion, we solve the problem (24) numerically, using the Nelder-Mead iterative downhill simplex method [13] and evaluatingthe integrals as Þnite sums. As initial parameters �a0,�b0 forthis iterative optimization we take the least-squares solutionh�a0,�b0
i= argmin
a,b
¡[a b]ΦT−�v¢ ¡[a b]ΦT−�v¢T= (26)
= �vΦ¡ΦTΦ
¢−1 , (27)where
Φ =
�y1 1�y2 1...
...
, �v =£ÿκ2n1�σ
21 ÿκ2n2�σ
22 · · · ¤ , (28)
with the factors ÿκn deÞned as ÿκn = κn. The linear problem(26) allows a simple direct solution by means of the normalequations (27). While in (24) we aim at Þtting the standard-deviation curve σreg to the estimates {(�yi, �σi)}Ni=1, Equation(26) minimizes the residuals with respect to the variances �σ2,treated as a linear function of the parameters a and b. Here, thefactor ÿκ2ni makes ÿκ
2ni�σ
2i an unbiased estimate of the variance
(contrary to �σi (16), which is an unbiased estimate of thestandard deviation).
IV. CLIPPING (CENSORING)
A. Clipped observations model
In practice, the data range, or dynamic range, of acquisition,transmission, and storage systems is always limited. Withoutloss of generality, we consider data given on the normalizedrange [0, 1], where the extremes correspond to the maximumand minimum pixel values for the considered noisy image(e.g., raw data) format. Even if the noise-free image y iswithin the [0, 1] range, the noise can cause z to exceed thesebounds. We shall assume that values exceeding these boundsare replaced by the bounds themselves, as this corresponds tothe behavior of digital imaging sensors in the case of over-or underexposure. Thus, we deÞne the clipped (or censored5)
5Strictly speaking, the form of the so-called censored samples [2] is really�z = z if 0 ≤ z ≤ 1 and no sample (i.e., censoring) if z < 0 orz > 1. Usually, the amount of censored samples below and above theextrema are assumed as known (Type-1 censoring). Thus, clipped (29) andcensored observations can, in a sense, be considered as equivalent. However,the formulas and estimators for censored variables which can be found in theliterature cannot be used directly in the case of the clipped observations (29).

FOI ET AL., PRACTICAL POISSONIAN-GAUSSIAN NOISE MODELING AND FITTING FOR SINGLE-IMAGE RAW-DATA 7
observations �z as�z (x) = max (0,min (z (x) , 1)) , x ∈ X, (29)
where z is given by the signal-dependent noise model (1). Let�y (x) = E {�z (x)}. The corresponding noise model for theclipped observations (29) is
�z (x) = �y (x) + �σ (�y (x)) �ξ (x) , (30)
where again En�ξ (x)
o= 0, var
n�ξ (x)
o= 1, and the
function �σ : [0, 1]→ R+ is deÞned as �σ (�y (x)) = std {�z (x)}.In general, �y (x) = E {�z (x)} 6= E {z (x)} = y (x),
�σ (�y (x)) = std {�z (x)} 6= std {z (x)} = σ (y (x)), and, eventhough var
n�ξ (x)
o= var {ξ (x)} = 1, the distributions of ξ
and �ξ are different.In Figure 1 one can compare the standard-deviation func-
tions �σ (dashed line) and σ (solid line) for different combina-tions of the constants a and b in (4).In the next sections, we rely on the heteroskedastic normal
approximation (6) and hence treat z as a purely Gaussianvariable. Consequently, we model �z as a clipped (censored)normal variable. We note that this normal approximation isespecially relevant for values of y = E {z} close to 0 or 1,where the clipping effects may be dominant. For y close to 1,we have that (5) holds with the largest values of λ, hence isfor this values of y that the Gaussianization of the Poissoniancomponent ηp (y (x)) is most accurate. For y close to 0,although λ in (5) might not be large, the approximation holdsbecause the variance ay (x) of ηp (y (x)) becomes negligiblecompared to the variance b of the Gaussian part ηg (x). Thisis true provided that b 6= 0. However, if b = 0 the noise hasonly the Poissonian component ηp, which is always positive.It means that z ≥ 0 and, thus, �z = min (1, z). Therefore,if b = 0, for our purposes it is sufÞcient to consider only thenormal approximation for y close to 1, as no clipping happensat 0.
B. Expectations, standard deviations, and their transforma-tionsTo simplify the calculations, we shall assume that the two
clippings, the one from below (z < 0, �z = 0) and the one fromabove (z > 1, �z = 1), are not mixed by the randomness ofthe noise, and can thus be computed independently6. In otherwords, this means that, in practice, if y is close enough to 0 sothat it is possible that z < 0, then it is impossible that z > 1;similarly, if y is close enough to 1, so that z can be larger than1, then z cannot be smaller than 0; for intermediate values ofy, with 0 ¿ y ¿ 1, we have that 0 < z < 1, i.e. clipping isnot happening.In what follows, we therefore treat separately the two cases:
6Formally, this corresponds to assuming that, for a given y (x), theproduct probability P (z (x) > 1) · P (z (x) < 0) is negligibly small.This condition is satisÞed provided, e.g., the stronger condition thatP (z (x) < 0|y (x) > 1− 4) and P (z (x) > 1|y (x) < 4) are both negligi-bly small for 4 = 0.5. These conditions are all surely met in the practicalcases, since there the standard deviation σ (y (x)) of z (x) is always muchsmaller (in fact, several orders smaller) than 0.5 and its distribution does nothave heavy tails (note that [y − γσ (y) , y + γσ (y)] with γ ≥ 4 can be arather �safe� conÞdence interval for z, with higher than 99.99% conÞdencefor Gaussian distributions).
Fig. 6. The probability density function of �ν = max (0, ν), as deÞned byEquation (31). In this illustration µ = 1. The height of the impulse at 0 isequal to the area under the bell curve between −∞ and 0.
� clipping from below (left single censoring): y and z arenear 0 and z < 1, thus, �z = max (0, z);
� clipping from above (right single censoring): y and z arenear 1 and z > 0, thus, �z = min (z, 1).
Further, we combine the results for the two cases, soto obtain formulas which are valid for the case �z =max (0,min (z, 1)), where clipping can happen from aboveor below (double censoring).1) Clipping from below (left single censoring): Since �z =
max (0, z), we have that E {�z} ≥ E {z} = y.Let ν ∼ N (µ, 1) be a normally distributed random variable
with mean E {ν} = µ and unitary variance and �ν =max (0, ν).The probability density f�ν of �ν is a generalized function
deÞned as follows
f�ν (t) =
½φ (t− µ) +Φ (−µ) δ0 (t) t ≥ 0,0 t < 0,
(31)
where φ and Φ are the probability density and cumulativedistribution functions (p.d.f. and c.d.f.) of the standard normalN (0, 1) and δ0 is the Dirac delta impulse. This function isillustrated in Figure 6.Tedious but simple calculations (see, e.g., [7], or [8],
Chapter 20) show that the expectation E {�ν} and the variancevar {�ν} of the clipped �ν are
E {�ν} = Φ (µ)µ+ φ (µ) , (32)var {�ν} = Φ (µ) + φ (µ)µ− φ2 (µ) + (33)
+ Φ (µ)µ (µ−Φ (µ)µ− 2φ (µ)) .The plots of the expectation E {�ν} and of the standarddeviation std {�ν} = p
var {�ν} as functions Em and Sm ofµ = E {ν} are shown in Figure 7. Observe that E {�ν} isstrictly positive even for negative values of µ; it is convex andincreasing, E {�ν}→ 0 as µ→ −∞ and E {�ν} is asymptoticto µ = E {ν} as µ → +∞. The standard deviation std {�ν}approaches 1 = std {ν} as µ → +∞ and goes to zero as µdecreases.The normal approximation (6) gives that z ∼ N ¡
y, σ2 (y)¢.
�Standardization� of the noise is obtained dividing the vari-ables by σ (y), which gives z
σ(y) ∼ N³
yσ(y) , 1
´. It means that,
by taking µ = yσ(y) , we can write z = σ (y) ν, �z = σ (y) �ν.
It follows that �y (x) = E {�z (x)} = σ (y)E {�ν} and �σ (�y) =std {�z} = σ (y) std {�ν}. Exploiting this standardization, wecan formulate the direct and inverse transformations whichlink σ and y to �y and �σ.

8 IEEE TRANSACTIONS, TIP-03364-2007-FINAL
Fig. 7. Expectation E {�ν} and standard deviation std {�ν} of the clipped�ν = max (0, ν) as functions Em and Sm of µ, where µ = E {ν} andν ∼ N (µ, 1).
Fig. 8. Standard deviation std {�ν} of the clipped �ν = max (0, ν) as functionSe of its expectation E {�ν}. The numbers in italic indicate the correspondingvalue of µ, where µ = E {ν} and ν ∼ N (µ, 1).
a) Direct transformation (�y and �σ from y and σ): Fromthe above formulas we obtain
�y = σ (y) Emµ
y
σ (y)
¶, (34)
�σ (�y) = σ (y)Smµ
y
σ (y)
¶, (35)
which give an explicit expression for the clipped observationmodel (30), provided that σ (y) from the basic model (1) isknown. In particular, (34) and (35) deÞne the transformationsthat bring the standard deviation curve (y, σ (y)) to its clippedcounterpart (�y, �σ (�y)).The two plots in Figure 7 can be uniÞed, plotting std {�ν}
as a function of E {�ν}. This is shown by the function Se inFigure 8. Naturally, between Sm and Se there is only a changeof the independent variables, µ←→ E {�ν}, hence, from (35)follows that
�σ (�y) = σ (y)Seµ
�y
σ (y)
¶, (36)
where �y can be obtained from (34).
Fig. 9. Expectation E {�ν} and standard deviation std {�ν} of the clipped�ν = max (0, ν) as functions Er and Sr of ρ = E{�ν}
std{�ν} . The numbers initalic indicate the corresponding value of µ.
b) Inverse transformation (σ and y from �σ and �y): Asclearly seen in Figure 7, the plot of Se is strictly convex, whichimplies that the (incremental) ratio ρ = E{�ν}
std{�ν} =E{�ν}−0std{�ν}−0
is in bijection with µ. This means that µ can be univocallydetermined given ρ. Note that this ratio is scale-invariant andthat, in particular, ρ = E{�ν}
std{�ν} =�yσ−1(y)
�σ(�y)σ−1(y) =�y
�σ(�y) . Therefore,given both �y and �σ (�y), we can obtain µ and hence also E {�ν}and std {�ν}.In Figure 9 we show the plots of Er and Sr which representµ
E{�ν} =E{ν}E{�ν} and std {�ν} as functions of ρ, respectively.
From the deÞnition of Er follows that y = E {z} =σ (y)E {ν} = σ (y)µ = σ (y)E {�ν} Er (ρ). Substituting�y = E {�z} = σ (y)E {�ν} in the previous equation (observethat, at this stage, σ (y) is considered as unknown) we obtain
y = �yEr (ρ) = �yErµ
�y
�σ (�y)
¶. (37)
Analogously for the standard deviation, σ (y) = std {z} =σ (y) std {ν} = σ (y) std{�ν}Sr(ρ) . Substituting �σ (�y) = std {�z} =σ (y) std {�ν} we have
σ (y) = std {z} = �σ (�y)
Sr (ρ) =�σ (�y)
Sr³
�y�σ(�y)
´ . (38)
The Equations (37) and (38) deÞne the transformation thatbrings the clipped standard deviation curve (�y, �σ (�y)) to itsnon-clipped counterpart (y, σ (y)).2) Clipping from above (right single censoring): The case
of clipping from above, �z = min (1, z), can be treated exactlyas the clipping from below, provided simple manipulations andthe following obvious change of variables:
y ←→ 1− y, z ←→ 1− z,�y ←→ 1− �y, �z ←→ 1− �z.
FOI ET AL., PRACTICAL POISSONIAN-GAUSSIAN NOISE MODELING AND FITTING FOR SINGLE-IMAGE RAW-DATA 9
a) Direct transformation (�y and �σ from y and σ):
�y = 1− σ (y) Emµ1− yσ (y)
¶, (39)
�σ (�y) = σ (y)Smµ1− yσ (y)
¶, (40)
�σ (�y) = σ (y)Seµ1− �yσ (y)
¶. (41)
b) Inverse transformation (σ and y from �σ and �y):
y = 1− (1− �y) Erµ1− �y�σ (�y)
¶, (42)
σ (y) = std {z} = �σ (�y)
Sr³1−�y�σ(�y)
´ , (43)
3) Combined clipping from above and below (double cen-soring): The formulas for the two separate clippings, theone from below and the one from above, can be combinedinto �universal� formulas which can be applied to data whichis clipped in any of the two ways. Here, we undertakethe assumption, discussed in Section IV-B, that the productprobability of z being clipped both from above and from belowis negligibly small.
a) Direct transformation (�y and �σ from y and σ): Sinceonly one kind of clipping can happen for a given y, it meansthat either (34) or (39) is equal to y. Therefore, Equations(37) and (42) can be combined by summing the two right-hand sides and subtracting y,
�y = σ (y) Emµ
y
σ (y)
¶− y + 1− σ (y) Em
µ1− yσ (y)
¶. (44)
Similarly, (35) and (40) cannot be simultaneously differentthan σ (y). So do (36) and (41). It means that their combina-tions are simply the products of the respective factors in theright-hand sides:
�σ (�y) = σ (y)Smµ
y
σ (y)
¶Sm
µ1− yσ (y)
¶, (45)
�σ (�y) = σ (y)Seµ
�y
σ (y)
¶Seµ1− �yσ (y)
¶. (46)
b) Inverse transformation (σ and y from �σ and �y):Analogous considerations hold also for combining of Equation(37) with (42) and Equation (38) with (43). Consequently, wehave
y = �yErµ
�y
�σ (�y)
¶− �y + 1− (1− �y) Er
µ1− �y�σ (�y)
¶, (47)
σ (y) = std {z} = �σ (�y)
Sr³
�y�σ(�y)
´Sr³1−�y�σ(�y)
´ . (48)
C. Expectation and standard deviation in the wavelet domain
All the above results are valid also in the more general casewhere the mean and the standard deviation are not calculatedfor �ν, but rather from the corresponding detail or approxima-tion wavelet coefÞcients, respectively. More precisely,
E {�ν} = E {�ν ~ ϕ} , std {�ν} = std {�ν ~ ψ} ,since these equalities follow from the independence of �ν andon the normalizations
Pϕ = 1 and kψk2 = 1. Therefore,
in the next section, we consider the wavelet coefÞcients
calculated from the clipped observations:�zwdet =↓2 (�z ~ ψ) , �zwapp =↓2 (�z ~ ϕ) .
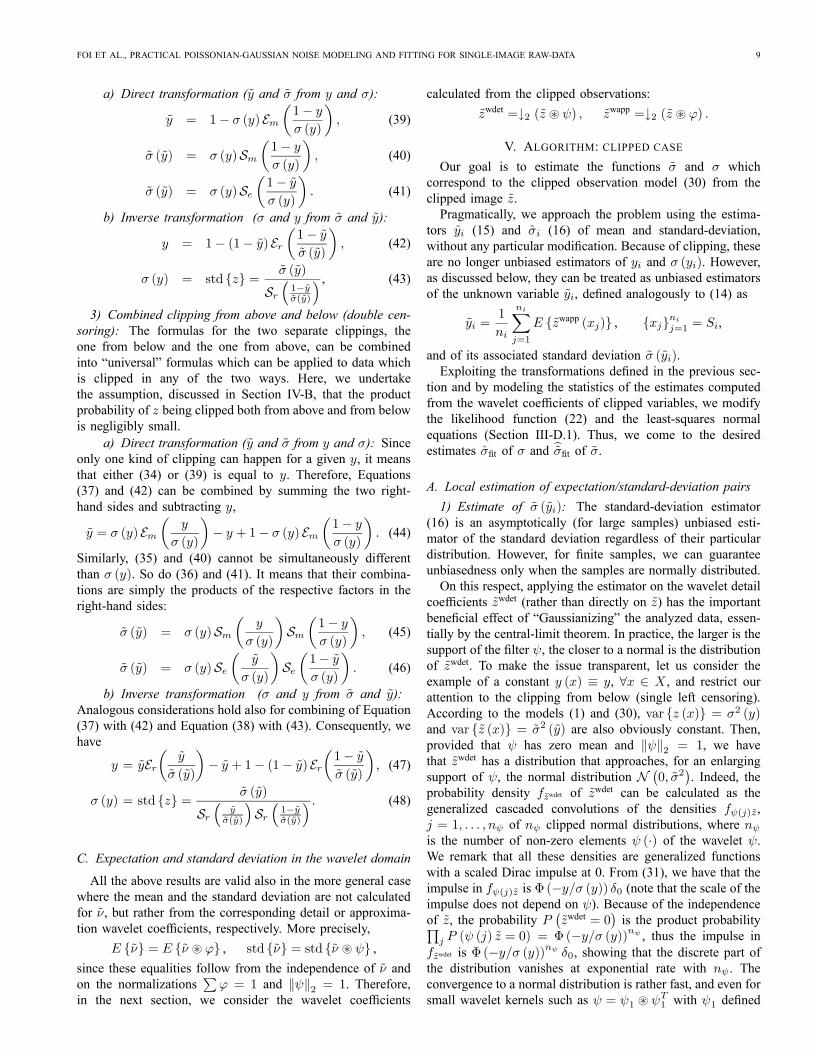
V. ALGORITHM: CLIPPED CASEOur goal is to estimate the functions �σ and σ which
correspond to the clipped observation model (30) from theclipped image �z.Pragmatically, we approach the problem using the estima-
tors �yi (15) and �σi (16) of mean and standard-deviation,without any particular modiÞcation. Because of clipping, theseare no longer unbiased estimators of yi and σ (yi). However,as discussed below, they can be treated as unbiased estimatorsof the unknown variable �yi, deÞned analogously to (14) as
�yi =1
ni
niXj=1
E {�zwapp (xj)} , {xj}nij=1 = Si,
and of its associated standard deviation �σ (�yi).Exploiting the transformations deÞned in the previous sec-
tion and by modeling the statistics of the estimates computedfrom the wavelet coefÞcients of clipped variables, we modifythe likelihood function (22) and the least-squares normalequations (Section III-D.1). Thus, we come to the desiredestimates �σÞt of σ and b�σÞt of �σ.A. Local estimation of expectation/standard-deviation pairs1) Estimate of �σ (�yi): The standard-deviation estimator
(16) is an asymptotically (for large samples) unbiased esti-mator of the standard deviation regardless of their particulardistribution. However, for Þnite samples, we can guaranteeunbiasedness only when the samples are normally distributed.On this respect, applying the estimator on the wavelet detail
coefÞcients �zwdet (rather than directly on �z) has the importantbeneÞcial effect of �Gaussianizing� the analyzed data, essen-tially by the central-limit theorem. In practice, the larger is thesupport of the Þlter ψ, the closer to a normal is the distributionof �zwdet. To make the issue transparent, let us consider theexample of a constant y (x) ≡ y, ∀x ∈ X , and restrict ourattention to the clipping from below (single left censoring).According to the models (1) and (30), var {z (x)} = σ2 (y)and var {�z (x)} = �σ2 (�y) are also obviously constant. Then,provided that ψ has zero mean and kψk2 = 1, we havethat �zwdet has a distribution that approaches, for an enlargingsupport of ψ, the normal distribution N ¡
0, �σ2¢. Indeed, the
probability density f�zwdet of �zwdet can be calculated as thegeneralized cascaded convolutions of the densities fψ(j)�z,j = 1, . . . , nψ of nψ clipped normal distributions, where nψis the number of non-zero elements ψ (·) of the wavelet ψ.We remark that all these densities are generalized functionswith a scaled Dirac impulse at 0. From (31), we have that theimpulse in fψ(j)�z is Φ (−y/σ (y)) δ0 (note that the scale of theimpulse does not depend on ψ). Because of the independenceof �z, the probability P
¡�zwdet = 0
¢is the product probabilityQ
j P (ψ (j) �z = 0) = Φ (−y/σ (y))nψ , thus the impulse inf�zwdet is Φ (−y/σ (y))nψ δ0, showing that the discrete part ofthe distribution vanishes at exponential rate with nψ . Theconvergence to a normal distribution is rather fast, and even forsmall wavelet kernels such as ψ = ψ1 ~ ψT1 with ψ1 deÞned

10 IEEE TRANSACTIONS, TIP-03364-2007-FINAL
Fig. 10. Probability densities of the clipped (from below) �ν = �z/σ (y)(thin lines) and of its wavelet detail coefÞcients �νwdet = �zwdet/σ (y) =↓2(�z ~ ψ) /σ (y) (thick lines) for different values of µ = y/σ (y), when ψ isthe 2-D Daubechies wavelet. The �Dirac peaks� at 0, characteristic of thesedensities, appear here as vertical asymptotes at 0 and cannot thus be seen inthe drawing.
as (10), for which nψ = 36, the distribution of �zwdet is verysimilar to a normal for values µ = y
σ(y) as low as 0 (observethat the larger is µ, the closer is the normal approximation),as shown in Figure 107. Note that for µ = −0.5, 0, 0.5, 1 andnψ = 36, the amplitudes of the step discontinuity at 0 in thedistribution of �zwdet are Φ (µ)nψ ' 1.7 ·10−6, 1.5 ·10−11, 4.1 ·10−19, 1.6 ·10−29, respectively, thus all these distributions arepractically continuous and therefore the plots in the Þgure area faithful illustration of the generalized probability densitiesf�zwdet .The described �Gaussianization� is important, because it
ensures that the bias due to Þnite samples is not signiÞcant,allowing to use the same constant κn (17) as in the non-clippedcase. As a rough quantitative Þgure of the error which maycome from this simpliÞcation, in Table I we give the valuesof the expectation8 E {�σi} /σ (yi) for different combinationsof µ = y/σ (y) and ni. The cases �ni = ∞� correspondto the true values of the standard deviation �σ (�y) /σ (y) =std {�z} /σ (y) = std {�ν} = Sm (µ) = Sm (y/σ (y)) of theclipped data, calculated from (33) and plotted in Figure 7.From the table one can see that a handful of samples are suf-Þcient for the Þnite-sample estimation bias E {�σi}− std {�ν}to be negligible.2) Estimate of �yi: Let us now consider the estimates of
the mean. Clearly, being a sample average, �yi is an unbiasedestimate of �yi, regardless of the number of samples ni or ofthe distribution of �z. The central-limit theorem and similararguments as above show that �zwapp and �yi are both normallydistributed with mean �yi.3) Variance of the estimates: Ignoring the possible depen-
dence of the noise in the wavelet coefÞcients (due to non-
7In [5], we consider the case where the wavelet ψ is replaced by the basiselements of the 2-D discrete cosine transform (DCT) and show analogousÞgures for µ = 0 and transforms of size n × n, n = 2, 3, 4. The�Gaussianization� is observable there as well, particularly for the AC terms.8The Þnite-sample numbers in Tables I and III are obtained by Monte
Carlo simulations. The simulations were computed with enough replicationsto have a sample standard-deviation of the averages lower than 0.0001. Thus,the numbers given in the tables can be considered as precise for all showndigits. The taken samples zwdet were contiguous in the set Si, therefore somedependence was present (exact independence is found only for samples fartherthan the diameter of the support of ψ, because in the considered case thedistribution of z is not normal), however, as ni grows the dependence becomesnegligible, since zwdet can be split in nψ/4 = 9 subsets, each with a growingnumber of fully independent samples.
Gaussianity of the clipped variables), simple estimates of thevariances of �yi and �σi can be obtained from the varianceskϕk22 �σ2 (�yi) and �σ2 (�yi) of the wavelet coefÞcients �zwapp and�zwdet, respectively, as in Section III-C.4.4) Distribution of the estimates: In conclusion, similar to
Section III-C.5, we model the distributions of the estimates �yiand �σi as the normal�yi ∼ N
¡�yi, �σ
2 (�yi) ci¢, �σi ∼ N
¡�σ (�yi) , �σ
2 (�yi) di¢, (49)
where the factors ci and di are deÞned as in (19).
B. Maximum-likelihood Þtting of the clipped modelIt is straightforward to exploit the above analysis for the
estimation of the functions �σ (30) and σ (1) from the clippeddata �z = max (0,min (z, 1)). In fact, for the ML solution(24), it sufÞces to introduce the functions Em and Sm intothe deÞnition of the function to be Þtted to the measureddata, which are pairs (�yi, �σi) centered�according to (49)�at(�yi, �σ (�yi)). From (45) follows that we can deÞne �σreg (�y) as
�σreg (�y) = σreg (y)Smµ
y
σreg (y)
¶Sm
µ1− yσreg (y)
¶, (50)
where the argument �y is, according to (44),
�y = σreg (y) Em³
yσreg(y)
´−y+1−σreg (y) Em
³1−yσreg(y)
´. (51)
The conditional probability density (22) is thus modiÞed into℘ ((�yi, �σi) |�yi = �y) = ℘ (�yi|�yi = �y)℘ (�σi|�yi = �y) = (52)
=1
2π√cidi
1
�σ2reg (�y)e− 12�σ2reg(�y)
!(�yi−�y)2
ci+(�σi−�σreg(�y))2
di
".
Analogously to (23), the posterior likelihood L is obtained byconsidering all measurements {(�yi, �σi)}Ni=1 and by integratingthe densities ℘ ((�yi, �σi) |�yi = �y) with respect to a prior ℘0 (y)as
�L (a, b) =NYi=1
Z℘ ((�yi, �σi) |�yi = �y)℘0 (y) dy. (53)
Note that the integration in (53) is still with respect to y andthat ℘ ((�yi, �σi) |�yi = �y) is itself an explicit function of y, as itis clear from Equations (50-52). Therefore, (53) allows fordirect calculation, and by solving (24) with the likelihood�L (a, b) in place of L (a, b) (23) we obtain the parameters �aand �b, which deÞne both the ML estimate �σÞt of σ, exactlyas in (25), and the ML estimate ��σÞt of �σ, which can beobtained from �σÞt by application of the transformations (44)and (45). Note that for the clipped raw-data it is unnaturalto assume that ℘0 is uniform on [0, 1], because in the caseof overexposure the true signal could be much larger than1. Therefore, for the clipped raw-data, we assume that allpositive values of y are equiprobable and we maximize9�L (a, b) =
QNi=1
R +∞0
℘ ((�yi, �σi) |�yi = �y) dy.1) Least-squares initialization: Similar to the non-clipped
case, we use a simple least-squares solution as the initialcondition for the iterative maximization of the likelihood9Equivalently, we maximize
�L (a, b) = limj→+∞
N&i=1
' 1+j
0℘ ((�yi, �σi) |�yi = �y)℘j (y) (1 + j) dy,
where ℘j is a uniform density on [0, 1 + j] and the normalization factor(1 + j) enables the convergence of the sequence of integrals.

FOI ET AL., PRACTICAL POISSONIAN-GAUSSIAN NOISE MODELING AND FITTING FOR SINGLE-IMAGE RAW-DATA 11
E {�σi} /σ (yi) for n <∞, �σ (�y) /σ (y) = std {�z} /σ (y) = Sm (y/σ (y)) for n =∞ni µ = −1 µ = −0.5 µ = 0 µ = 0.5 µ = 1 µ = 1.5 µ = 2 µ = 2.5 µ = 3 µ = 5
2 0.226 0.389 0.572 0.741 0.868 0.946 0.982 0.995 0.999 1.00010 0.247 0.404 0.580 0.743 0.867 0.944 0.981 0.995 0.999 1.00050 0.258 0.411 0.583 0.744 0.867 0.943 0.980 0.994 0.999 1.000100 0.260 0.412 0.583 0.744 0.867 0.943 0.980 0.994 0.999 1.000500 0.261 0.413 0.584 0.744 0.867 0.943 0.980 0.994 0.999 1.000∞ 0.262 0.413 0.584 0.744 0.867 0.943 0.980 0.994 0.999 1.000
TABLE IEXPECTATION E {�σi} /σ (yi) FOR DIFFERENT COMBINATIONS OF µ = yi/σ (yi) AND ni . THE CASES �ni =∞� CORRESPOND TO THE TRUE VALUES OFTHE STANDARD DEVIATION �σ (�y) /σ (y) = std {�z} /σ (y) = std {�ν} = Sm (µ) = Sm (y/σ (y)) OF THE CLIPPED DATA, CALCULATED FROM (33) AND
PLOTTED IN FIGURE 7.
Fig. 11. Estimation with clipped observations �z (Fig. 2): Least-squaresinitialization. Each dot of the scatter plot corresponds to a pair (�yi, �σi)of estimates of �yi and �σ (�yi). The circles indicate these pairs of estimatesafter inverse-transformation (see Eqs. (55) and (56)). The solid line showsthe square root of the least-squares estimate of the variance function σ2(see Section V-B.1), �a0 = 0.00945 (�χ0 = 105.82), �b0 = 0.001822
(%�b0 = 0.04268). The dotted line is the true σ, while the dashed-line is
the function �σreg with parameters �a0,�b0 used as initial condition for theiterative maximization of the likelihood (53).
function. We exploit the inverse transformations (47)-(48)from Section IV-B.3.b to attain a Þt of σ2 with respect tothe non-clipped variables. Hence, the initial parameters aregiven as
h�a0,�b0
i= �vΦ
¡ΦTΦ
¢−1, with the dependent andindependent variables transformed as
ρregi,0 =
sµ�yi�σi
¶2+ ε2reg, ρregi,1 =
sµ1− �yi�σi
¶2+ ε2reg, (54)
Φ=
�y1Er¡ρreg1,0
¢− �y1 + 1− (1− �y1) Er¡ρreg1,1¢ 1�y2Er
¡ρreg2,0
¢− �y2 + 1− (1− �y2) Er¡ρreg2,1¢ 1...
...
, (55)�v=
·ÿκ2n1 �σ
21
(Sr(ρreg1,0)Sr(ρreg1,1))2
ÿκ2n2 �σ22
(Sr(ρreg2,0)Sr(ρreg2,1))2 · · ·
¸. (56)
Figures 11 and 12 respectively show the initial �σreg, whichcorresponds to the parameters �a0,�b0, and the ML estimates�σÞt and ��σÞt found using �σreg as initialization in the iterativemaximization of the likelihood. In Figure 11 we can seethat the inverse transformations (47)-(48) used in (55) and(56) effectively move the clipped estimates pairs near to theirrespective �non-clipped� positions. Note also the increasedaccuracy of the ML estimates compared to that of the least-squares ones.
Fig. 12. Estimation with clipped observations �z (Fig. 2): ML solution. Eachdot of the scatter plot corresponds to a pair (�yi, �σi) of estimates of �yi and�σ (�yi). The solid line and dashed line show the maximum-likelihood estimates�σÞt and ��σÞt of the standard-deviation functions σ and �σ, respectively. �a =0.00995 (�χ = 100.52), �b = 0.001552 (
%�b = 0.03940). The plot of �σÞt
overlaps perfectly with that of the true σ.
VI. ROBUST ESTIMATESDespite the removal of edges from Xsmo, small singularities
or Þne textures and edges of the image can still be presentin zwdet, within Si. The accuracy of the sample standard-deviation estimator (16) is consequently degraded, since zwdetwould contain wild errors of large amplitude, which can causethe distribution of zwdet to become heavy-tailed. This typicallyleads to an over-estimate of the standard-deviation. It is well-known that robust estimators based on order-statistics caneffectively deal with these situations.
A. Robust standard-deviation estimatesTo reduce the inßuence of these wild errors, we replace
the sample standard-deviation estimator (16) with the robustestimator based on the median of the absolute deviations(MAD) [12], [9]10
�σmadi =1
κmadni
medianxj∈Si
©¯̄zwdet (xj)
¯̄ª, (57)
where κmadni is again a scaling factor to make the estimatorunbiased. It is well known that, for large normally i.i.d.samples, κmadn approaches Φ−1 (3/4) = 0.6745, where Φ−1is the inverse c.d.f. of the standard normal. For small Þnite10In its general form, this estimator is deÞned as1κni
medianxj∈Si(((zwdet (xj)−medianxj∈Si !zwdet (xj)"(((. However,
when used on wavelet detail coefÞcients, the subtraction of the median in thedeviation is often discarded, since its expected value for these coefÞcients istypically zero.

12 IEEE TRANSACTIONS, TIP-03364-2007-FINAL
n 1 2 3 4 5 6 7 8 9 10 11 12 13 14 15 16 17 18 19 20κmadn 0.798 0.732 0.712 0.702 0.696 0.693 0.690 0.688 0.686 0.685
TABLE IIBIAS FACTOR κmadn FOR THE MAD ESTIMATOR (57) FOR SMALL FINITE SAMPLES OF n INDEPENDENT NORMAL VARIABLES; κmad2n = κmad2n−1 .
E#�σmadi
$/σ (yi)
ni µ = −1 µ = −0.5 µ = 0 µ = 0.5 µ = 1 µ = 1.5 µ = 2 µ = 2.5 µ = 3 µ = 5
2 0.215 0.380 0.566 0.739 0.869 0.946 0.983 0.995 0.999 1.00010 0.168 0.341 0.543 0.733 0.872 0.952 0.985 0.997 0.999 1.00050 0.158 0.332 0.538 0.731 0.873 0.953 0.986 0.997 0.999 1.000100 0.156 0.330 0.537 0.731 0.873 0.953 0.986 0.997 0.999 1.000500 0.155 0.329 0.536 0.731 0.873 0.953 0.986 0.997 0.999 1.000500000 0.154 0.329 0.536 0.731 0.873 0.953 0.986 0.997 0.999 1.000
TABLE IIIEXPECTATION E
#�σmadi
$/σ (yi) FOR DIFFERENT COMBINATIONS OF µ = yi/σ (yi) AND ni .
samples, the values of κmadn are larger and up top2/π =
0.7979 (mean of absolute deviations of N (0, 1)); in Table IIwe give the values of κmadn for n = 1, . . . , 20. For larger n,we can approximate κmadn as κmadn ' 1
5n + Φ−1 (3/4). Note
that κmad2n = κmad2n−1; this is because in a set of 2n independentrandom variables, any individual variable has probability 0.5of belonging to the subset of n variables smaller (or larger)than the median value. Tables similar to Table II can be foundin [14] for a few other estimators of the standard deviation.1) Variance and distribution of the standard-deviation es-
timates: The variance of the robust estimates (57) can beapproximated11 as
varn�σmadi
o= σ2 (yi) d
madi , dmadi ' 1.35
ni + 1.5. (58)
Thus, we pay the increased robustness with respect to outlierswith a more than twice as large variance of the estimates, incomparison to (19) (this larger variance can be seen clearlyby visual comparison of Figures 12 and 14). However, inpractice, when working with many-megapixels images, thevariance (58) is often quite low, due to the large number ofsamples ni. Hence, the use of the robust estimator is ordinarilyrecommendable.Like the sample standard-deviation estimates, also the MAD
estimates (57) have a distribution which can be approximatedby a normal12. In particular (and analogous to (20)),
�σmadi ∼ N ¡σ (yi) , σ
2 (yi) dmadi
¢.
2) Estimates of the variance: An unbiased robust estimateof the variance (as used by the least-squares initialization (26))can be obtained from the squared
³�σmadi
´2(57), provided
multiplication with a bias correction factor. Using the samesymbols of Section III-D.1, we denote this estimate of thevariance as
³ÿκmadni �σ
madi
´2, where the factor
¡ÿκmadn
¢2 can be11The approximation of dmadi in (58) can be obtained by Monte Carlo
simulations. A table with few of these values is found also in [14].12The normal approximation can be easily veriÞed by numerical simula-
tions. Despite all the necessary ingredients for an analytical proof can befound in [7], it seems that that this result is not explicitly reported in theliterature.
approximated as¡ÿκmadn
¢2 ' 1 + 15n .
B. Maximum-likelihood Þtting (non-clipped)The ML solution is found exactly as in Section III-D,
provided that the estimates and factors �σi, di, ÿκni are replacedby their respective �mad� counterparts �σmadi , dmadi , ÿκmadni inEquations (22-24) and (28).
C. Clipped observationsLet us now apply the MAD estimator (57) to the wavelet
coefÞcients �zwdet =↓2 (�z ~ ψ) of the clipped observations �z,�σmadi =
1
κmadni
medianxj∈Si
©¯̄�zwdet (xj)
¯̄ª. (59)
Although robust with respect to outliers of large amplitude,the MAD estimator is sensitive to the asymmetry in thedistribution of the samples [14] and even the limiting valueΦ−1 (3/4) is, as one can expect from the presence of theinverse c.d.f. of the normal distribution, essentially correctfor normally distributed samples only. Thus, contrary to thesample standard-deviation, the MAD estimator is not asymp-totically unbiased:
limni→∞E
n�σmadi
o6= std©�zwdetª = lim
ni→∞E {�σi} . (60)
Let us investigate this estimation bias for large as well as forsmall Þnite samples. As in Section V-A, we restrict ourselvesto the case of clipping from below for a constant y (x) ≡ y,∀x ∈ X, and apply the estimator (57) to the corresponding�zwdet. In Table III, we give the expectations E
n�σmadi
o/σ (yi)
for different combinations of µ = yi/σ (yi) and ni. The sameconsiderations which we made commenting Table I can berepeated also for Table III.We use the expectations of large-sample estimates (values
with ni = 500000 in Table III) as a numerical deÞnitionof limni→∞E
n�σmadi
o. In this way, we deÞne the function
Smadm which gives limni→∞En�σmadi
oas a function of E {�ν}.
Hence, are also deÞned Smade , Smadr , and Emadr and the cor-responding analogs of the direct and inverse transformation

FOI ET AL., PRACTICAL POISSONIAN-GAUSSIAN NOISE MODELING AND FITTING FOR SINGLE-IMAGE RAW-DATA 13
Fig. 13. Large-sample asymptotic expectation limni→∞E#�σmadi
$of the
median of the absolute deviations (57) as a function Smade of the expectationE {�ν} = �yi/σ (yi) of the clipped variables. The dashed line corresponds tothe function Se from Fig. (8).
formulas (45)-(48). In particular, we deÞne �σmad by
�σmad (�y) = σ (y)Smadm
³y
σ(y)
´Smadm
³1−yσ(y)
´.
In Figure 13, we show the plot of Smade superimposed on theplot of Se (dashed line). The vertical difference between thetwo plots in the Figure is the bias13 of (57) as an estimatorof std {�ν} = std
©�zwdet
ª/σ (y). These differences can also
be seen (as a function of µ) by comparing the last rows ofthe Tables I and III, for the cases ni =∞ and ni = 500000,respectively.For the case of the MAD estimator, formula (49) needs
therefore to be modiÞed as follows:�σmadi ∼ N
³�σmad (�yi) ,
¡�σmad (�yi)
¢2dmadi
´.
The speciÞc Smadm allows us to take into account of thedifference �σmad (�yi) − �σ (�yi) (60) here and in the followingML estimation of the functions σ and �σ.1) Maximum-likelihood Þtting (clipped): The ML solution
is found exactly as in Section V-B, provided that the functionsSmadm , Smadr , and Emadr deÞned above and estimates and factors�σmadi , dmadi , ÿκmadni are used, in place of their respective �non-robust� counterparts, in the Equations (50), (52), (53), (54),(55), and (56). The found parameters �a and �b deÞne simultane-ously three functions: from (25) we obtain �σÞt, a ML estimateof σ; ��σÞt, a ML estimate of �σ; and ��σmadÞt , a ML estimate of�σmad,
�σmad (�y) = σ (y)Smadm
³y
σ(y)
´Smadm
³1−yσ(y)
´,
around which are scattered the estimates³�yi, �σ
madi
´.
In Figure 14 we show the ML estimates �σÞt and ��σmadÞtobtained for the clipped �z from Figure 2 using the MAD.We can see that, despite the larger variance of the estimates�σmadi (as compared to �σi in Figure 12), the Þnal estimatedparameters and the corresponding �σÞt are essentially the sameas those obtained using the sample standard-deviation. In theFigure, note the slightly different shape of the plot of ��σmadÞtcompared to ��σÞt.
13Although it is not insigniÞcant, this asymptotic bias is as not largeas it would be if applying the MAD (57) directly on �z instead of zwdet.In fact, it is easy to realize that median {�ν} = 0 for µ ≤ 0. Sinceobviously median {|�ν|} = median {�ν}, we have that median {|�ν|} =median {|�ν −median {�ν}|} = 0 for µ ≤ 0.
Fig. 14. Estimation with clipped observations �z and MAD estimator(59) (Fig. 2): Maximum-likelihood solution. Each dot of the scatter plotcorresponds to a pair (�yi, �σi) of estimates of �yi and �σ (�yi). The solid lineand dashed line show the maximum-likelihood estimates �σÞt and ��σmadÞt of thestandard-deviation functions σ and �σ, respectively. The plot of �σÞt overlapsperfectly with that of the true σ (shown in Figure 1). The estimated parametersare �a = 0.01000 (�χ = 100.04) and �b = 0.001594 (
%�b = 0.03992).
Fig. 15. The piecewise smooth test image of Fig. 2 with thin textsuperimposed: original y and observation z degraded by Poissonian andGaussian noise with parameters χ = 100 (a = 0.01) and b = 0.042.
D. Another exampleTo demonstrate a situation where the robust estimates are
remarkably more accurate than the non-robust ones, we in-troduce a number of thin and sharp discontinuities in the testimage, as shown in Figure 15. At many places, due to lowcontrast (and also due to the simplicity of our edge-detector),these discontinuities cannot be detected properly and are thuseventually incorporated in the smoothness set Xsmo. In Figure16, we show the estimates �σÞt and ��σÞt obtained using therobust and the non-robust estimator. As easily expected, theestimates �σi are inaccurate and typically biased in favour oflarger standard-deviation values. As a result, the �σÞt curvedoes not match with the true σ. The result obtained fromthe robust estimates �σmadi is essentially better, with only amild overestimation of the signal-dependent component of thenoise.
VII. EXPERIMENTS WITH RAW DATA
We performed extensive experiments with raw data14 ofvarious digital imaging sensors under different acquisitionparameters. The devices included three CMOS sensors from
14We reorder the raw-data pixels from color Þlter array (e.g., Bayer pattern)sensors in such a way to pack pixels of the same color channel together. Thus,the processed frame z is composed by four (Bayer pattern) or three (FujiÞlmSuperCCD) subimages, which portray the different chromatic components.The boundaries between the subimages are usually detected as edges, as canbe seen in Figure 17(right).

14 IEEE TRANSACTIONS, TIP-03364-2007-FINAL
Fig. 16. Robust (right) vs. non-robust (left) estimation with clipped observations �z (Fig. 15): ML solutions. Each dot of the scatter plot corresponds to apair (�yi, �σi) of estimates of �yi and �σ (�yi). The solid line and dashed line show the maximum-likelihood estimates �σÞt and ��σmadÞt of the standard-deviationfunctions σ and �σ, respectively. The dotted line is the true σ. The parameters estimated by the two methods are �a = 0.01415 (�χ = 70.68), �b = 0.000951
(%�b = 0.03084) and �a = 0.01108 (�χ = 90.29), �b = 0.001524 (
%�b = 0.03904), respectively.
Fig. 17. From left to right: out-of-focus image with under- and overexposure (Canon EOS 350D, ISO 100), a natural image (Canon EOS 350D, ISO 1600)and its wavelet detail coefÞcients zwdet restricted on the set of smoothness Xsmo (the four subimages are arranged as [R,B;G1,G2]).
Nokia cameraphones (300 Kpixel, 1.3 Mpixel, 5 Mpixel),Super CCD HR sensors [16] from FujiÞlm FinePix S5600(5 Mpixel) and S9600 (9.1 Mpixel) cameras, and two CMOSsensors from Canon EOS 350D and 400D SLR cameras (8Mpixel, 10 Mpixel). In all experiments we found near-perfectÞt of our proposed clipped Poissonian-Gaussian model to thedata. We also compared the parametric curves ��σÞt, estimatedfrom a single image by the proposed algorithm, with thenonparametric curves estimated by the algorithm [6] using 50images; we found the agreement to be very good, with minordifferences due to the fact that the present algorithm includesthe Þxed-pattern noise (FPN) in the noise estimate, whereas[6], being a pixelwise procedure, estimates only the temporalnoise. Because of length limitation, we present here only fewmost signiÞcant examples of the obtained results.First, we show the estimated curves for the raw-data of
Canon EOS 350D with ISO 100 and 1600 (lowest and highestuser-selectable analog-gain options). An out-of-focus, hencesmooth, target (shown in Figure 17,left) was used, withunder- and over-exposed parts, thus providing a complete andreliable coverage of the dynamic range and beyond. Besidesthe excellent match between the Þtted parametric curve ��σmadÞt
and the local estimates³�yi, �σ
madi
´, one should observe that
the curve accurately follows the estimates as these approach(1, 0), in agreement with our clipped data modeling. Nearlyidentical curves are found when the smooth out-of-focus targetis replaced by one, shown in Figure 17(center), which presentsvarious complex structures that may potentially impair theestimation. The wavelet coefÞcients zwdet are shown in Figure17(right). The estimated curves are shown in Figure 19, whereone can also observe the wider dispersion of the estimates
³�yi, �σ
madi
´(due to the much smaller number ni of usable
samples in the level sets Si) and that the �yi are not distributedover the full data-range. In Figure 20 we show a remarkableexample of clipping from above and from below within thesame frame, as it can be found with the FujiÞlm S5600 usingISO 1600. The plot on the left is estimated from the raw-data of an evenly exposed out-of-focus-target, shown in Figure21(left); observe that the Þt of the model to the data is againnearly perfect. The plot on the right is estimated from theraw-data of the dark image shown in Figure 21(center). Thecurves estimated in the two cases coincide. A further exampleof estimation from a dark image, showing the accuracy of theproposed model, is given in Figure 22 for the Canon EOS350D using ISO 1600. Even though in this case the estimates³�yi, �σ
madi
´are concentrated at one side of the diagram, this
plot and those shown in Figures 18(right) and 19(right) arenearly identical. Finally, a comparison with the nonparametricestimate �σnp obtained by the method [6] is given in Figure23. The curve �σnp was computed analyzing 50 shots of thesame target, whereas only one of these 50 images has beenused to estimate the function �σÞt with the proposed algorithm.The shots were acquired by a 1.3-Mpixel CMOS sensor of acameraphone, with an analog gain of 10dB. We note that thenonparametric method provides an estimate of σ (y) only forthe range of values y covered by the used images. Moreover,it produces erroneous results approaching the extrema of thisrange (about 0.07 and 0.41), due to lack of samples. Withinthese extrema (i.e., 0.07 < y < 0.41) the two plots arehowever very close, with minor differences due to the lackof FPN contribution to the �σnp estimate.

FOI ET AL., PRACTICAL POISSONIAN-GAUSSIAN NOISE MODELING AND FITTING FOR SINGLE-IMAGE RAW-DATA 15
Fig. 18. Estimation of the standard-deviation function σ from the raw-data of the out-of-focus image (Fig. 17,left).
Fig. 19. Estimation of the function σ from the raw-data of the natural image (Fig. 17,center). Compare with the corresponding plots in Fig. 18.
Fig. 20. Estimation from raw-data which exhibits both clipping from above (overexposure) and from below (underexposure), as with the FujiÞlm FinePixS5600 camera at ISO 1600. The plot on the left is estimated from raw-data of an evenly exposed out-of-focus image shown in Figure 21(left), the one on theright is estimated from the raw-data of the dark image shown in Figure 21(center). The curves estimated in the two cases coincide.
Fig. 21. From left to right: out-of-focus image with under- and over-exposure (FujiÞlm FinePix S5600, ISO 1600), and two largely underexposed dark shots(FujiÞlm FinePix S5600, ISO 1600, and Canon EOS 350D, ISO 1600).
VIII. COMMENTSA. Different parametric models for the σ functionWe remark that the proposed algorithm is not restricted to
the particular model (4). In fact, the parameters of any otherparametric model can be estimated in the same way. It issufÞcient to modify the expression of the function σreg in thelikelihood (23) according to the assumed parametric model.Therefore, our algorithm has a broader scope of applicationthan shown in this paper and can be applied for parameter
estimation of other signal-dependent noise models, which canbe approximated as heteroskedastic normal. Heuristic modelsfor σ, such as those found using the principal componentanalysis in [11], can also be exploited in our estimationframework.
B. Multiple imagesIf two or more independent realizations of the image z are
available, they can be easily exploited in a fashion similar to

16 IEEE TRANSACTIONS, TIP-03364-2007-FINAL
Fig. 22. Estimation from the raw-data of the dark image shown in Figure21(right) (Canon EOS 350D, ISO 1600); compare with plots in Figures18(right) and 19(right).
Fig. 23. Comparison between the parametric �σÞt, estimated from a singleimage, and the nonparametric curve �σnp [6] computed from 50 images.
[6]. Let us denote the different realizations as z1, . . . , zJ . From(1), we havezj (x) = y (x) + σ (y (x)) ξj (x) ∀x ∈ X , j = 1, . . . , J ,where ξ1, . . . , ξJ are mutually independent and, for a Þxedx, ξ1 (x) , . . . , ξJ (x) are i.i.d. random variables. Thus, byaveraging we obtain
zave(x) =JXj=1
zj (x)
J= y (x)+
σ (y(x))√J
ξ(x) , ∀x ∈ X, (61)
where ξ (x) has the same distribution as any ξj (x). Applyingthe proposed estimation procedure on zave permits to estimatethe function J− 1
2σ and hence σ. In principle, the advantage ofthe averaging (61) lies in the lower variance of the observationzave, which allows for better edge-removal and results inestimates (�yi, �σi) with lower variance. However, in practice, Jcannot be taken arbitrarily large because a very large J wouldrender the noise-to-signal ratio of zave too low for the noiseJ−
12σξ to be measured accurately. Hence, the averaging (61)
is valuable only provided that the true y is sufÞciently smoothand that the computational precision is high.
C. Denoising clipped signalsA generic denoising procedure can be modeled as an
operator whose output is an estimate of the expectation of thenoisy input. It means that when we denoise �z, as the outputwe do not get an estimate of y, but rather an estimate of �y.However, by applying (47) on the output, we can transform itto an estimate of y. In the same way, we can �take advantageof the noise� to obtain an image with a higher dynamic range,since the range of �z and �y is always smaller than that of y.The interested reader can refer to the recent work [5], where
a detailed discussion about the denoising of clipped noisyimages is given.
D. Interpolation of the functions Sm, Se, Sr, ErIn our current implementation of the algorithm, we use
interpolated values for the functions Sm, Se, Sr, Er, Smadm ,Smade , Smadr , and Emadr as no closed form expression is available.For practicality, we resort to indirect (nonlinear) polynomialinterpolation with exponential or logarithmic functions. Theparticular expressions of the used interpolant are as follows,
Sm (µ) ≈ 1+tanh(p(µ))2 , Se (ξ) ≈ 1− ep(
√ξ),
Er (ρ) ≈ 1− ep(log(ρ)), Sr (ρ) ≈ 1− ep(ρ),(62)
where p (t) =Pk pkt
k is a polynomial with coefÞcients pkas given in Table IV. For the MAD estimates �σmadi (57) andrelated functions Smadm , Smade , Smadr , and Emadr , we use the sameinterpolant expressions as in (62) but with different polynomialcoefÞcients, which are given in Table V.We note that, with (62) and the coefÞcients in Tables IV and
V, the interpolation achieved for Emadr and Sr is diverging atρ ' 0.5 and ρ ' 11.5, respectively. However, the interpolationis accurate for 0.65 ≤ ρ ≤ 11. Therefore, in our experimentswe constrain ρ within these bounds. Since ρ, Emadr , or Sr areused only for the weighted least-squares problem (26) and notfor the likelihood equation (23), the restriction on ρ does notaffect the Þnal estimation of the noise model parameters.The interpolants and tables presented in this paper comple-
ment and extend similar (although not equivalent) numericaldata found in the literature [2] (and references therein), [3]. Tothe best of the authors� knowledge, no other studies of indirect(e.g., in the wavelet domain) and robust (e.g., median-based)estimators of clipped samples have appeared to date and,although limited, the results in Tables III and V are thereforevaluable on their own. Further, we wish to emphasize thatthe various estimators proposed in the cited publications aredeveloped for censored Gaussian processes with Þxed meanand variance, and are thus not applicable to the more generalestimation problem considered by us.
E. Matlab softwareA MATLAB implementation of the algorithm is available at
http://www.cs.tut.fi/~foi/sensornoise.html
IX. ACKNOWLEDGEMENTThe Þrst author would like to thank Giacomo Boracchi for
his strenuous and accurate review of the very early drafts andfor the many constructive comments and suggestions whicheventually led to a substantial improvement of this paper.
X. CONCLUSIONWe presented and analyzed a Poissonian-Gaussian noise
model for clipped (and non clipped) raw-data. An algorithmfor the estimation of the model parameters from a singlenoisy image is proposed. The algorithm utilizes a specialML Þtting of the parametric model on a collection of localwavelet-domain estimates of mean and standard-deviation.

FOI ET AL., PRACTICAL POISSONIAN-GAUSSIAN NOISE MODELING AND FITTING FOR SINGLE-IMAGE RAW-DATA 17
Sm Se Er Srp10 � −5.7155077 · 10−3 � 2.3348876 · 10−7p9 1.4308530 · 10−6 9.9630886 · 10−2 � −8.7619300 · 10−6p8 3.2172868 · 10−7 −7.3358565 · 10−1 � 1.2534052 · 10−4p7 −2.6295693 · 10−5 2.9464712 · 100 −5.5320701 · 10−3 −7.0907114 · 10−4p6 −8.5123452 · 10−5 −6.9596693 · 100 −5.5542026 · 10−2 −1.4943642 · 10−3p5 −1.7851033 · 10−5 9.7330082 · 100 −2.0363415 · 10−1 4.5981260 · 10−2p4 2.0282884 · 10−3 −8.3760888 · 100 −3.4651219 · 10−1 −2.8638716 · 10−1p3 2.4377832 · 10−2 3.9881199 · 100 −4.1222715 · 10−1 8.5412513 · 10−1p2 3.7234715 · 10−2 −1.8598057 · 100 −9.1504182 · 10−1 −1.5725702 · 100p1 7.0309281 · 10−1 −7.0210049 · 10−1 −4.3779025 · 100 −5.2653050 · 10−1p0 1.6923658 · 10−1 −3.1389654 · 10−6 −1.5498697 · 100 −1.2319839 · 10−10
TABLE IVCOEFFICIENTS OF THE POLYNOMIAL p (t) =
)k pkt
k USED FOR INDIRECT INTERPOLATION OF THE FUNCTIONS Sm , Se , Sr , Er AS IN (62).
Smadm Smade Emadr Smadr
p10 � −2.0882655 · 101 � −6.8695634 · 10−1p9 6.8722511 · 10−4 1.5778478 · 102 −2.4852997 · 101 1.0659232 · 101p8 −3.3132811 · 10−3 −4.9232870 · 102 6.2356790 · 101 −7.1938586 · 101p7 4.6401970 · 10−4 8.1719776 · 102 −3.4588152 · 101 2.7680210 · 102p6 1.4193996 · 10−2 −7.7148949 · 102 −2.3467375 · 101 −6.6844401 · 102p5 −3.3370736 · 10−3 4.0631819 · 102 2.2066307 · 101 1.0501179 · 103p4 −4.0537889 · 10−2 −1.0564855 · 102 1.7531850 · 100 −1.0745079 · 103p3 7.8410754 · 10−2 8.7374360 · 100 −5.0041080 · 100 6.9444029 · 102p2 1.6003810 · 10−2 −1.6521034 · 100 1.3236318 · 10−1 −2.6249852 · 102p1 8.3418294 · 10−1 5.2647043 · 10−2 −4.7818191 · 100 4.5940232 · 101p0 7.0493620 · 10−2 −1.3640079 · 10−6 −1.4931770 · 100 −1.3097339 · 100
TABLE VCOEFFICIENTS OF THE POLYNOMIAL p (t) =
)k pkt
k USED FOR INDIRECT INTERPOLATION OF THE FUNCTIONS Smadm , Smade , Smadr , Emadr AS IN (62).
Experiments with synthetic images and real raw-data fromcamera sensors demonstrate the effectiveness and accuracy ofthe algorithm in estimating the model parameters and conÞrmthe validity of the proposed model.
REFERENCES[1] Blanksby, A.J., M.J. Loinaz, D.A. Inglis, and B.D. Ackland, �Noise
performance of a color CMOS photogate image sensor�, IEEE Int.Electron Devices Meeting 97 Tech. Dig., pp. 205-208, 1997.
[2] Cohen, A.C., Truncated and Censored Samples, CRC Press, 1991.[3] Khasawneh, M.T., S.R. Bowling, S. Kaewkuekool, B.R. Cho, �Tables of
a Truncated Standard Normal Distribution: A Singly Truncated Case�,Quality Engineering, vol. 17, no. 1, pp. 33-50, 2005.
[4] Donoho, D.L., and I.M. Johnstone, �Ideal spatial adaptation via waveletshrinkage�, Biometrika, n. 81, pp. 425-455, 1994.
[5] Foi, A., �Practical denoising of clipped or overexposed noisy images�,Proc. 16th European Signal Process. Conf., EUSIPCO 2008, Lausanne,Switzerland, August 2008.
[6] Foi, A., S. Alenius, V. Katkovnik, and K. Egiazarian, �Noise measure-ment for raw-data of digital imaging sensors by automatic segmentationof non-uniform targets�, IEEE Sensors Journal, vol. 7, no. 10, pp. 1456-1461, Oct. 2007.
[7] Johnson, N.L., S. Kotz, and N. Balakrishnan, Continuous UnivariateDistributions, 2nd ed., Wiley Series in Probability and Statistics, 1994.
[8] Greene, W.H., Econometric Analysis, 4th ed., Prentice Hall, 2000.[9] Hampel, F.R., �The inßuence curve and its role in robust estimation�,
Journal of American Statistical Association, 62, pp. 1179-1186, 1974.[10] Huang,. J., and D. Mumford, �Statistics of natural images and models�,
Proc. IEEE Conf. Computer Vision and Pattern Recognition, CVPR1999, vol. 1., pp. 541-547, June 1999.
[11] Liu, C., W.T. Freeman, R. Szeliski, and S.B. Kang, �Noise estimationfrom a single image�, Proc. IEEE Conf. Computer Vision and PatternRecognition, CVPR 2006, pp. 901-908, 2006.
[12] Mosteller, F., and J.W. Tukey, Data Analysis and Regression: A SecondCourse in Statistics, Addison Wesley, 1997.
[13] Nelder, J.A., and R. Mead, �A simplex method for function minimiza-tion�, The Computer Journal, vol. 7, pp. 308-313, 1965.
[14] Rousseeuw, P.J., and C. Croux, �Alternatives to the Median AbsoluteDeviation�, J. American Statistical Assoc., vol. 88, no. 424. pp. 1273-1283, December, 1993.
[15] Rhodes, H., G. Agranov, C. Hong, U. Boettiger, R. Mauritzson, J.Ladd, I. Karasev, J. McKee, E. Jenkins, W. Quinlin, I. Patrick, J. Li,X. Fan, R. Panicacci, S. Smith, C. Mouli, J. Bruce, �CMOS imagertechnology shrinks and image performance�, Proc. 2004 IEEE Workshopon Microelectronics and Electron Devices, WMED, pp. 7-18, April 2004.
[16] Tamayama, H., K. Ito, and T. Nishimura, �Technology trends of high-deÞnition digital still camera systems�, Sym. VLSI Circuits, Digest ofTechnical Papers, pp. 100-105, June 2002.
[17] Theuwissen, A., Course on camera system, Lecture notes, CEI-Europe,2005.
[18] Wong, H.-S., D.J. Frank, P. Solomon, C. Wann, and J. Wesler,�Nanoscale CMOS�, Proc. of the IEEE, vol. 87, no. 4, pp. 537-570,April 1999.
PLACEPHOTOHERE
A lessandro Foi received the M.Sc. degree in Math-ematics from the Università degli Studi di Milano,Italy, in 2001, the Ph.D. degree in Mathematicsfrom the Politecnico di Milano in 2005, and theD.Sc.Tech. degree in Signal Processing from Tam-pere University of Technology, Finland, in 2007.His research interests include mathematical and sta-tistical methods for signal processing, functionalanalysis, and harmonic analysis. Currently, he isa senior researcher at the Department of SignalProcessing, Tampere University of Technology. His
work focuses on spatially adaptive algorithms for digital image Þltering andon noise modeling for digital imaging sensors.

18 IEEE TRANSACTIONS, TIP-03364-2007-FINAL
PLACEPHOTOHERE
M ejdi Trimeche received the B.Sc. degree in elec-trical engineering from Bilkent University, Turkey,in 1998. In 2000, he received the M.Sc. degree withdistinction from Tampere University of Technology,Finland. Later in 2006, he received his Ph.D. fromthe same university. Since 2000, he is with NokiaResearch Center, Tampere, Finland. His research in-terests include image/video processing and computervision. In particular, he has been working on super-resolution, image restoration, video coding, visualcontent indexing and retrieval.
PLACEPHOTOHERE
V ladimir Katkovnik received the M.Sc., Ph.D.,and D.Sc. degrees in technical cybernetics from theLeningrad Polytechnic Institute, Leningrad, Russia,in 1960, 1964, and 1974, respectively. From 1964 to1991, he held the positions of Associate Professorand Professor at the Department of Mechanics andControl Processes, Leningrad Polytechnic Institute.From 1991 to 1999, he was a Professor of statisticswith the Department of the University of SouthAfrica, Pretoria. From 2001 to 2003, he was a Pro-fessor of mechatronics with the Kwangju Institute
of Science and Technology, Korea. From 2000 to 2001 and since 2003 heis a Research Professor with the Institute of Signal Processing, TampereUniversity of Technology, Tampere, Finland. He has published seven booksand more than 200 papers. His research interests include stochastic signalprocessing, linear and nonlinear Þltering, nonparametric estimation, imaging,nonstationary systems, and time-frequency analysis.
PLACEPHOTOHERE
K aren Egiazarian (SM�96) was born in Yerevan,Armenia, in 1959. He received the M.Sc. degree inmathematics from Yerevan State University in 1981,the Ph.D. degree in physics and mathematics fromMoscow State University, Moscow, Russia, in 1986,and the D.Tech. degree from the Tampere Universityof Technology (TUT), Tampere, Finland, in 1994.He has been Senior Researcher with the Departmentof Digital Signal Processing, Institute of InformationProblems and Automation, National Academy ofSciences of Armenia. Since 1996, he has been an
Assistant Professor with the Institute of Signal Processing, TUT, where he iscurrently a Professor, leading the Transforms and Spectral Methods Group. Hisresearch interests are in the areas of applied mathematics, signal processing,and digital logic.