ieee transactions on xxx, xxx, xxxx, october 2014 1 … · ieee transactions on xxx, xxx, xxxx,...
TRANSCRIPT

IEEE TRANSACTIONS ON XXX, XXX, XXXX, OCTOBER 2014 1
EPAS: A Sampling Based SimilarityIdentification Algorithm for the Cloud
Yongtao Zhou, Yuhui Deng, Member, IEEE, Junjie Xie, and Laurence T. Yang, Member, IEEE
Abstract—The explosive growth of data brings new challenges to the data storage and management in cloud environment. These datausually have to be processed in a timely fashion in the cloud. Thus, any increased latency may cause a massive loss to the enterprises.Similarity detection plays a very important role in data management. Many typical algorithms such as Shingle, Simhash, Traits andTraditional Sampling Algorithm (TSA) are extensively used. The Shingle, Simhash and Traits algorithms read entire source file tocalculate the corresponding similarity characteristic value, thus requiring lots of CPU cycles and memory space and incurringtremendous disk accesses. In addition, the overhead increases with the growth of data set volume and results in a long delay. Insteadof reading entire file, TSA samples some data blocks to calculate the fingerprints as similarity characteristics value. The overhead ofTSA is fixed and negligible. However, a slight modification of source files will trigger the bit positions of file content shifting. Therefore, afailure of similarity identification is inevitable due to the slight modifications. This paper proposes an Enhanced Position-AwareSampling algorithm (EPAS) to identify file similarity for the cloud by modulo file length. EPAS concurrently samples data blocks from thehead and the tail of the modulated file to avoid the position shift incurred by the modifications. Meanwhile, an improved metric isproposed to measure the similarity between different files and make the possible detection probability close to the actual probability.Furthermore, this paper describes a query algorithm to reduce the time overhead of similarity detection. Our experimental resultsdemonstrate that the EPAS significantly outperforms the existing well known algorithms in terms of time overhead, CPU and memoryoccupation. Moreover, EPAS makes a more preferable tradeoff between precision and recall than that of other similarity detectionalgorithms. Therefore, it is an effective approach of similarity identification for the cloud.
Index Terms—Similarity detection; Sampling; Shingle; Position-aware; Cloud.
F
1 INTRODUCTION
W ITH the explosive growth of data, the risk and costof data management are significantly increasing. In
order to address this problem, more and more users andenterprises transfer their data to the cloud and access thedata via Internet [1]. However, this approach often resultsin a large volume of redundant data in the cloud. Accordingto an IDC report, around 75% of the data are redundantacross the world [2]. ESG indicates that over 90% of theredundant data are in backup and archiving systems [3].The reason behind this is that multiple users tend to storesimilar files in the cloud. Unfortunately, the redundantdata not only consume significant IT resources and energybut also occupy expensive network bandwidth. Therefore,data deduplication is urgently required to alleviate theseproblems in the cloud.
Data deduplication calculates a unique fingerprint forevery data block by using hash algorithms such as MD5 andSHA-1. The calculated fingerprint is then compared againstother existing fingerprints in a database that dedicates forstoring the fingerprints. If the fingerprint is already in thedatabase, the data block does not need to be stored again, a
• Y. Deng� is with the Department of Computer Science, Jinan University,Guangzhou 510632, China, and also with the State Key Laboratory ofComputer Architecture, Institute of Computing Technology, Chinese A-cademy of Sciences, Beijing 100080, China. E-mail: [email protected].
• Y. Zhou and J. Xie are with the Department of Computer Science, Jinan U-niversity, Guangzhou, P.R.China 510632. E-mail: [email protected],[email protected].
• L. T. Yang is with the Department of Computer Science, St. Francis XavierUniversity, Antigonish, NS B2G 2W5, Canada. E-mail: [email protected].
pointer to the first instance is inserted in place of the dupli-cated data block. By doing so, data deduplication is able toeliminate the redundant data by storing only one data copy,thus reducing the cost of data management [4] and networkbandwidth [5]. However, data deduplication suffers diskbottleneck in the process of fingerprint lookup. This isbecause massive requests going to disk drives generate alarge volume of random disk accesses which significantlydecrease the throughput of deduplication and increases thesystem latency [6], [7]. In the cloud, any increased latencymay result in a massive loss to the enterprises [8]. Forexample, according to [9], [10], every 100 ms of increasedlatency would reduce 1% of sales for Amazon, and anextra 0.5 seconds in search page display time can cut downrevenues of Google by 20%. On the contrary, any decreasedlatency will bring huge benefits to the enterprises. Hamiltonet al. [11] note that only a speedup of 5 seconds at Shopzillwill bring about an increase of page view by 25% and taxesby 10% while a reduction of hardware by 50% and trafficfrom Google by 120%. Therefore, reducing the latency inthe cloud environment is very important for the enterpriseswho store their data in the cloud.
Similarity based data deduplication strategies [12], [13],[14], [15], [16] are very important methods to eliminate theredundant data. The essential of them is that similar files orsegments can share those identical data blocks. Therefore,they only store similarity characteristic values instead ofstoring all fingerprint indexes in memory. This methodcan significantly reduce the number of disk accesses whenperforming data deduplication. Since the effectiveness ofsimilarity detection has a significant impact on the perfor-

IEEE TRANSACTIONS ON XXX, XXX, XXXX, OCTOBER 2014 2
mance and deduplication ratio of this kind of deduplicationapproaches, improving the performance and accuracy ofsimilarity detection is very critical. Typical similarity de-tection algorithms such as Shingle [17], Simhash [18] andTraits [15] are widely used at present. When calculatingthe eigenvalues of similar files, these algorithms have toread entire source files, thus requiring lots of CPU cyclesand memory space. Furthermore, the latency is multiplyingwith the growth of the data set volume. When applyingthe similarity detection algorithms to the cloud, the high re-source occupation and latency would significantly decreasethe satisfaction of cloud users.
Although the community has made great strides inidentifying data similarity, there are still some challengesbrought by the explosive growth of data and the complicat-ed characteristics of data stored in the cloud. We summarizethe challenges as follows:
Challenge 1: Reducing the resource occupation of similaritydetection. Similarity identification algorithms belong to I/Obound and CPU-bound tasks. Thus calculating the eigenval-ues of similar files requires lots of CPU cycles and memoryspace and incurs large quantities of disk accesses. Sincethe disk accesses generated are usually random, this wouldincur significant performance degradation. Additionally, thecomputing overhead increases with the growth of data setvolume. All of the above issues indicate a significant delayin the cloud.
Challenge 2: Reducing the time overhead of similarity query.Similarity identification algorithms usually require a largeamount of time to perform detection, which incurs longdelays especially with large data sets. This makes it difficultto apply these algorithms to some applications requiringreal time and high throughput.
Challenge 3: Achieving both the efficiency and accuracy. Itis a challenge to achieve both the efficiency and accuracyof the similarity detection with low overhead. Similarityidentification algorithms have to make a tradeoff betweenthe efficiency and accuracy.
Traditional Sampling Algorithm (TSA) [19] does not readentire files, but samples some data blocks to calculate thefingerprints as similarity characteristic values. TSA is simpleand has a fixed overhead. However, a slight modificationwill incur a failure of similarity identification due to theshifted bit positions. In order to solve this problem, thispaper proposes an Enhanced Position-Aware Sampling al-gorithm (EPAS) to identify file similarity for the cloud.This approach modulos file length to amend the shiftedsampling positions. Furthermore, it concurrently samplesdata blocks from the head and the tail of the modulated fileto avoid position shift incurred by the modifications. Themajor contributions of this paper include:
• 1) We propose a new method EPAS to reduce theresource occupation when performing similarity de-tection. Instead of reading entire files, EPAS sam-ples several data blocks to calculate the fingerprintas similarity characteristic values, and amends filelength to avoid shifted positions of sampling bymodulo file length. Additionally, EPAS samples datablocks from the head and tail of the modulated filerespectively, which can specifically prevent the slight
modification of the file head from shifting the filecontent. Therefore, EPAS performs well in detectingsimilarity by employing these two methods with afixed overhead.
• 2) We design an effective query algorithm for EPASto locate those similar files with given files, thus re-ducing the time overhead of similarity query. Exper-imental results demonstrate that the designed querymethod achieves low query time with low overheadwhen comparing with Simhash, Traits and PAS.
• 3) We propose a new metric to judge similarity be-tween two files, thus achieving both the efficiencyand accuracy. The essence of similarity detectionis catching how many identical data blocks or at-tributes two files share. An optimal method shouldmake the detection probability close to the actualsimilarity degree of two files. Furthermore, in orderto ensure the efficiency and accuracy of EPAS, weemploy precision and recall to select a threshold val-ue to make a better tradeoff between them. Our ex-perimental results show that this metric can promotethe efficiency of similarity detection and acquire aclose detection probability to the actual similaritydegree of two files.
The remainder of this paper is organized as follows.We present related work in section 2. In section 3, wedescribe some background knowledge. Section 4 illustratesthe theory of new similarity metric. Section 5 introduces thebasic idea of EPAS algorithm. Section 6 shows the evaluationresults of EPAS algorithm. Section 7 concludes this paperand presents future work.
2 RELATED WORK
Over the past decade, a lot of research efforts have beeninvested in identifying data similarity. The existing workcan be classified into five categories.
The first one is similar web page detection with websearch engine. Detecting and removing similar web pagescan save network bandwidth, reduce storage consumption,and improve the quality of web search engine index. Andreiet al. [17], [20] proposed a similar web page detectiontechnique called Shingle algorithm which utilizes set op-eration to detect similarity. Shingle is a typical samplingbased approach employed to identify similar web pages. Inorder to reduce the size of shingle, Andrei presented Modmand Mins sampling methods. This algorithm is appliedto AltaVista web search engine at present. Manku et al.[21] applied a Simhash algorithm to detect similarity inweb documents belonging to a multi-billion page repos-itory. Simhash algorithm practically runs at Google websearch engine combining with Google file system [22] andMapReduce [23] to achieve batch queries. Elsayed et al. [24]presented a MapReduce algorithm for computing pairwisedocument similarity in large document collections.
The second one is similar file detection in storage sys-tems. In storage systems, data similarity detection andencoding play a crucial role in improving the resourceutilization. Forman [25] presented an approach for findingsimilar files and applied the method to document repos-itories. This approach brings a great reduction in storage

IEEE TRANSACTIONS ON XXX, XXX, XXXX, OCTOBER 2014 3
space consumption. Ouyang [26] presented a large-scale filecompression technique based on cluster by using Shinglesimilarity detection technique. Ouyang uses Min-wise [27]sampling method to reduce the overhead of Shingle algo-rithm. Han et al. [28] presented fuzzy file block matchingtechnique, which was first proposed for opportunistic useof content addressable storage. Fuzzy file block matchingtechnique employs Shingle to represent the fuzzy hashingof file blocks for similarity detection. It uses Mins samplingmethod to decrease the overhead of shingling algorithm.
The third one is plagiarism detection. Digital informa-tion can be easily copied and retransmitted. This featurecauses owners copyright be easily violated. In purposeof protecting copyright and other related rights, we needplagiarism detection. Baker [29] described a program calleddup which can be used to locate instances of duplication ornear duplication in a software. Shivakumar [30] presenteddata structures for finding overlap between documents andimplemented these data structures in SCAM.
The forth one is remote file backup. Traditional remotefile backup approaches take high bandwidth and consumea lot of resources. Applying similarity detection to remotefile backup can greatly reduce bandwidth consumption.Teodosiu et al. [15] proposed a Traits algorithm to find outthe client files which are similar to a given server file. Teo-dosiu implemented this algorithm in DFSR. Experimentalresults suggest that these optimizations may help reducethe bandwidth required to transfer file updates across anetwork. Muthitacharoen et al. [5] presented LBFS whichexploits similarity between files or versions of the same fileto save bandwidth. Cox et al. [31] presented a similarity-based mechanism for locating a single source file to performpeer-to-peer backup. They implemented a system prototypecalled Pastiche.
The fifth one is the similarity detection for specific do-mains. Hua et al. [32] explored and exploited data simi-larity which supports efficient data placement for cloud.They designed a novel multi-core-enabled and locality-sensitive hashing that can accurately capture the differen-tiated similarity across data. Biswas et al. [33] proposeda cache architecture called Mergeable. Mergeable detectsdata similarities and merges cache blocks so as to decreasecache storage requirements. Experimental evaluation sug-gested that Mergeable reduces off-chip memory accessesand overall power usage. Vernica et al. [34] proposed athree-stage approach for end-to-end setsimilarity joins inparallel using the popular MapReduce framework. Deng etal. [35] proposed a MapReducebased framework Massjoinfor scalable string similarity joins. The approach achievesboth set-based similarity functions and character-based sim-ilarity functions.
Most of the above work focus on a specific applica-tion scenario, and the computational or similarity detectionoverhead are increased with the growth of data volume. Inaddition, the similarity detection metric may not be ableto well measure the similarity between two files. Therefore,this paper proposes an EPAS algorithm and a new similaritydetection metric to identify file similarity for the cloud.According to the analysis (see Section 4 and 5.3) and ex-perimental results, it illustrates that the proposed similaritymetric catch the similarity between two files more accurately
that that of traditional metric. Furthermore, the overhead ofEPAS is fixed and minimized in contrast to previous work.
3 BACKGROUND
As introduced in Section 2, many research work have in-vestigated how to accurately identify file similarity, Shingle[17], Simhash [18] and Traits [15] are three widely used al-gorithms to perform the identification. Therefore, we detailthe three algorithms this section and compare them with theproposed EPAS in section 6.
3.1 ShingleAndrei et al. [17], [20] employed a mathematical methodto transform the similarity calculation problem into a setoperation problem. This approach is usually called Shinglealgorithm. Shingle mainly consists of three steps. Firstly, itemploys information retrieval method to handle file con-tents and ignore some irrelevant information (e.g., times-tamps, spaces). Secondly, after processing the file, it istreated as a canonical sequence of tokens which could bea letter, a word or a line. The contiguous subsequence inthe file is called Shingle. Thirdly, associate the file to a setof contiguous subsequences of tokens S(D,ω), where Drepresents the file, ω is a parameter defined as the size ofcontiguous subsequences. For example, given a documentD, we have D(a, rose, is, a, rose, is, a, rose), when ω equals to4, we can obtain a 4-shingle multiset {(a, rose, is, a), (rose, is,a, rose), (is, a, rose, is), (a, rose, is, a), (rose, is, a, rose)}. We canget S(D,ω) by marking each element of a ω-shingle with itsoccurrence number. Then, the set of file D is {(a, rose, is, a,1), (rose, is, a, rose, 1), (is, a, rose, is, 1), (a, rose, is, a, 2), (rose,is, a, rose, 2)}.
Given a file A and a file B, following the partition methodof Shingle algorithm, the similarity of the above two files isdefined as
rw(A,B) =|S(A,ω) ∩ S(B,ω)||S(A,ω) ∪ S(B,ω)|
. (1)
where ω is the shingle length and rw(A,B) lies between 0and 1. If the value of rw(A,B) is close to 1, it means file Aand file B are very similar, while if the value of rw(A,B)is close to 0, it indicates that file A and file B are definitelydifferent. However, if rw(A,B) equals to 1, it does not meanfile A and file B are identical but implies that file B is anarbitrary permutation of file A. For instance, (a, c, a, b, a) isa permutation of (a, b, a, c, a). Therefore, given a file A and afile B, we have two sets including set A(a, rose, is, a, rose, is, a,rose) and set B(a, rose, is, a, flower, which, is, a, rose). Accordingto the Shingle algorithm and formula (1), if ω equals to 1, 2,3, then rw(A,B) will be 70%, 50%, and 30%, respectively.
In order to reduce the size of Shingle W , Border [17],[20] proposed MINs and MODm sampling methods. Minsselect the smallest s elements from W as equation (2). Asdemonstrated in equation (3), MODm choice the elementsthat mod m equals to 0.
MINs(W ) =
the set of the smallests elements in W ,if |W | > s.
W ,otherwise.
(2)

IEEE TRANSACTIONS ON XXX, XXX, XXXX, OCTOBER 2014 4
C1
C2
C3
Cn
...
010 101
110 111
010 101
000 111
[-1,1,-1, ,1,-1,1]
[1,1,-1, ,1,1,1]
[-1,1,-1, ,1-1,1]
[-1,-1,-1, ,1,1,1]Chunks
[18,-8,16, ,5,10,6]101 111
1
0
0
1
[
1,
16
File
Fig. 1: Process of calculating Simhash fingerprint.
MODm(I) = the set of elements of
W that are 0 mod m.(3)
The Shingle algorithm is applied to identify similar webpages. It runs on the AltaVista web search engine. However,the overhead of Shingle algorithm increases with the growthof the file size [17], [20]. Therefore, it is not really favorablefor large files. Therefore, two important algorithms Simhash[18] and Traits [15] are proposed to handle the problemsincurred by the Shingle algorithm.
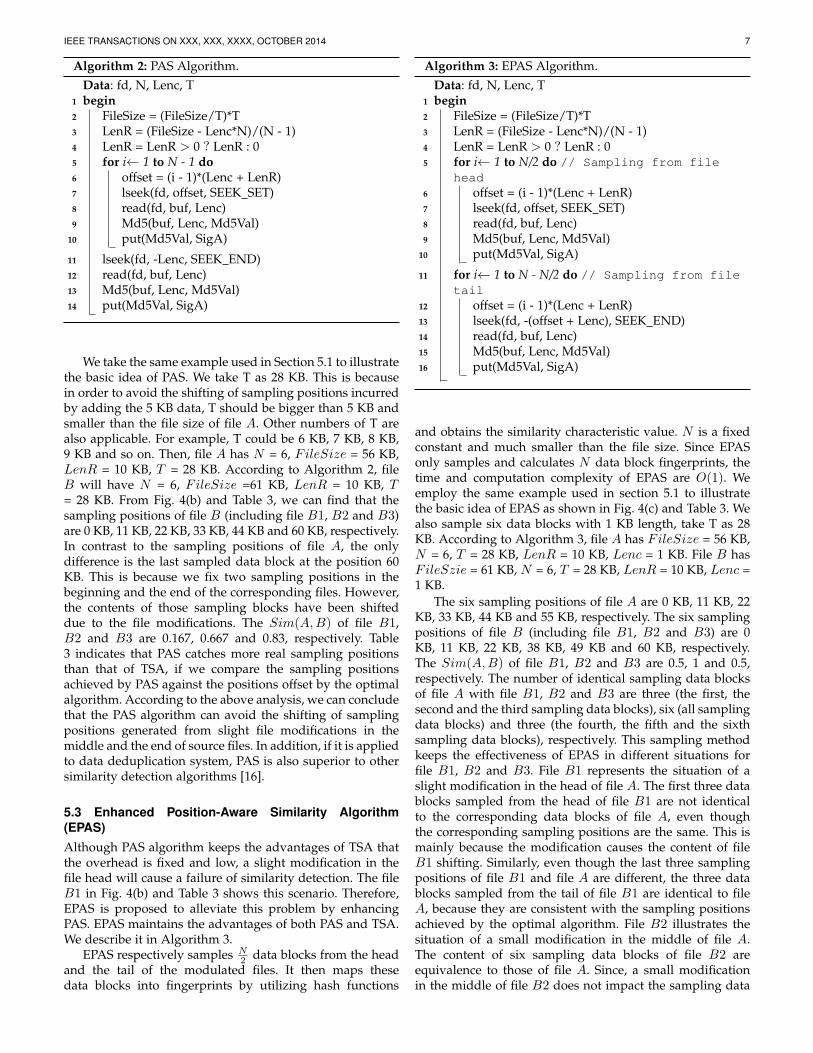
3.2 SimhashCharikar proposed a Simhash [21] algorithm. Manku et al.[18] applied the Simhash algorithm to identify similarity inweb documents belonging to a multi-billion page repository.Simhash is a member of the local sensitive hash [36]. It isdifferent from traditional hash functions whose signaturevalues are discrete and uniform distributed. When using thetraditional hash functions, if two files differ just a bit, theirhash signature values are almost different. On the contrary,Simhash has the property that the fingerprints of similarfiles only differ in a small number of bit positions. It can mapa file into f-bit fingerprints. After transferring the source filesinto m-bit fingerprints by using Simhash algorithm, we candetect the similarity through calculating the hamming dis-tance between two fingerprints. Fig. 1 shows the computingprocess of m-bit Simhash fingerprints. It can be described asfollows:
1) Employ a chunk algorithm to split files into a set ofdata blocks: C1, C2, . . . , Cn.
2) Define a m-dimension vector V , every dimension isinitialized as zero.
3) Calculate a m-bit signature of every data blockusing traditional hash functions. If the i-th bit ofa signature is positive, then the i-th dimension Vshould plus 1. Otherwise, it minus 1.
4) Generate a m-bit Simhash fingerprint f according toeach dimension of vector V . If the i-th dimensionof V is a positive number, then the i-th bit of f is 1.Otherwise, it will be 0.
After figuring out the Simhash fingerprints of files, wecan determine the similarity of those files by working outtheir Hamming distance.
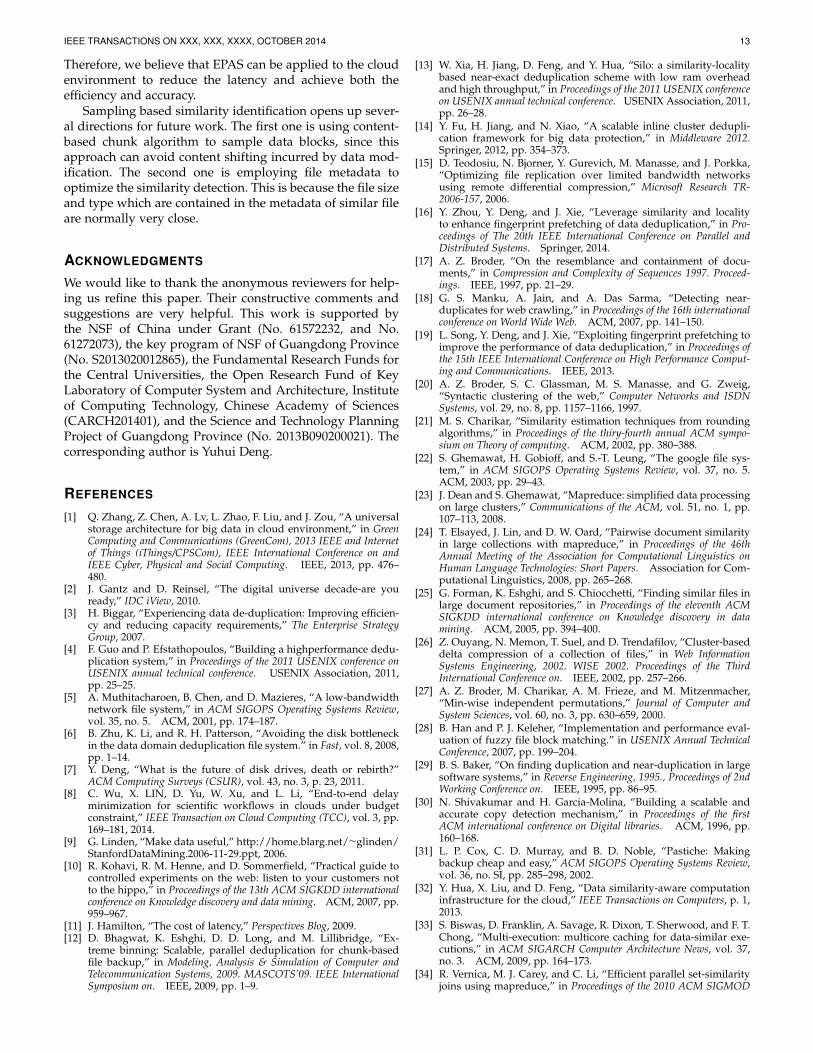
3.3 TraitsTeodosiu et al. [15] proposed a novel similarity detectionalgorithm Traits to find the most similar files in the clientto a given file in the server. Fig. 2 shows the computing
Sig1
H1(Sig1)
Sig2 Sig3 Sig4
) H1(Sig2)) H1(Sig3)) H1(Sig4)
Ht(Sig1)) Ht(Sig2)) Ht(Sig3)) Ht(Sig4)
Image
sets
File F
PT1
PTt
sel0..b-1
sel(t-1)b...b-1
min@2
min@4
1111
T1
Tt
Traits(F)
Fig. 2: Process of Calculating Traits.
process of the similarity characteristics value of Traits. It canbe described as follows:
1) Calculate t fingerprint image sets {IS1...ISt} ofsignature set {Sig1...Sign} by using t different hashfunctions H1...Ht. The size of each fingerprint im-age set is n:
IS1 = {H1(Sig1), ..., H1(Sign)}....
ISt = {Ht(Sig1), ..., Ht(Sign)}.2) Select the minimal element of each image set as the
pre-traits PT 1...PT t:
PT 1 = Sig1j where H1(Sig1j) = min(IS1)....
PT t = Sigtj where Ht(Sigtj) = min(ISt).
3) Get the traits T1...Tt by selecting b different bitsfrom each pre-traits PT 1...PT t. For example:
T1 = select0...b−1(PT 1)....
Tt = select(t−1)b...tb−1(PT t).
Given a file FS , after calculating the Traits value ofTraits(FS), we can determine the similarity of files in thefile set FC by using the equation as follows:
TraitsSim(FS , FC) = |{i | Ti(FC) = Ti(FS)}|.
SimTraits(FS , F ilesC , n, s) = {FC1, FC2, ..., FCk}.
Where set {FC1, FC2, ..., FCk} (contain (0 ≤ k ≤ n)files) is the subset of set FilesC . Each file FCi in the set{FC1, FC2, ..., FCk} has (TraitsSim(FS , FCi)/t) ≥ s, andfor all other files x in the Filesc has TraitSim(Fs, x) ≤TraitSim(Fs, FCi).
4 REDEFINING SIMILARITY
The symbols used in the following sections are summarizedin Table 1.
Similarity means that the majority of data blocks in thesimilar files are identical. The essence of similarity detectionis to catch how many identical data blocks or attributes twofiles have. However, there is no a general method to mea-sure the similarity between two files. An optimal methodshould make the detection probability close to the actualsimilarity degree of two files. This means that the detectionprobability should be close to the portion of identical datablocks two files actually share. The widely used methodis transforming the similarity detection problem into a setoperation problem described as equation (4) [17], [20]. The

IEEE TRANSACTIONS ON XXX, XXX, XXXX, OCTOBER 2014 5
TABLE 1: Symbols and the corresponding means used in thefollowing sections.
Symbol Meaning
FileSize File sizeδ The threshold of similarityN Number of sampling data blocksK Number of data blocks one files has
Lenc The length of sampling data blocksx The portion of matching chunk of two files
LenR The distance between two sampled data blocksT Sampling position impact factor of PAS and EPAS
value of Sim(A,B) lies between 0 and 1. If it is close to1, then file A and file B are very similar. If it is closeto 0, then file A and file B are essentially different. Afterselecting a threshold δ of the similarity, we can determinethat file A is similar to file B if Sim(A,B) ≥ δ is sat-isfied. Equation (4) can be transformed to a mathematicalform described as equation (5). If we use a hash set (O(1)lookup time) to store SigA(N,Lenc), the computationaltime complexities of |SigA(N,Lenc) ∩ SigB(N,Lenc)| and|SigA(N,Lenc)∪SigB(N,Lenc)| are both O(N). Therefore,the computational time complexity of equation (4) is O(N).
Sim(A,B) =|SigA(N,Lenc) ∩ SigB(N,Lenc)||SigA(N,Lenc) ∪ SigB(N,Lenc)|
. (4)
y =x
2N − x, (0 ≤ x ≤ N, 0 < N). (5)
However, this method may not be able to effectivelydetect similarity between two files. As illustrated in Table2, file A and file B share 90% (i.e. 9
10K) data blocks, theachieved Sim(A,B) is 0.818. If the shared data blocksis decreased to 50% (i.e. 5
10K), the calculated Sim(A,B)will be reduced to 0.333. This indicates that the detectionprobability of equation (4) is far from the actual similaritydegree of two files.
Sim(A,B) =|SigA(N,Lenc) ∩ SigB(N,Lenc)|
N. (6)
y =x
N, (0 ≤ x ≤ N, 0 < N). (7)
Therefore, we propose a new method illustrated in e-quation (6) to measure the similarity of EPAS. Equation (7)represents the mathematical form of the equation (6). If fileA and file B share 90% (i.e. 9
10K) data blocks, the calculatedSim(A,B) is 0.9 that is the same as the actual similaritydegree of two files, as demonstrated in Table 2. This alsoworks for other percentage of shared data blocks between t-wo files. This indicates that although the computational timecomplexity of equation (6) is O(N) (the same as equation(4)), it can accuately catch the file similarity.
In order to explain the reason, we suppose that file Aand file B both have K data blocks and x is the portionof identical chunks of two files. The portion of matchingchunks of file A and file B is also figured out by the equation(7). The difference between equation (5) and equation (7) ispresented as equation (8) by calculus. Equation (8) shows
TABLE 2: The detection probability of equation (4) and (6)under portions of identical blocks.
The percentage of identicaldata block
110
K 310
K 510
K 710
K 910
K
Equation (4) 0.052 0.176 0.333 0.538 0.818Equation (6) 0.1 0.3 0.5 0.7 0.9
0 5 10 15 200.0
0.2
0.4
0.6
0.8
1.0
The
sim
ilarit
y pr
obab
ility
of tw
o fil
es
The number of identical blocks
K=10, y=x/10, eq(4) K=10, y=x/(20-x), eq(2) K=20, y=x/20, eq(4) K=20, y=x/(40-x), eq(2)
Fig. 3: Compare equation (6) against equation (4).
that the different increases with the growth of K. As illus-trated in Fig. 3, the gap between equation (5) and equation(7) grows when K varies from 10 to 20. This means thatequation (4) is not suitable for similarity detection especiallywhen K is very large. The reason is because the detectionprobability of equation (4) is gradually far from the actualportion of similarity of two files.∫ K
0
(x
K− x
2K − x)dx
=x2
2K|K0 −
∫ 2K
K
2K − u
udu
=x2
2K|K0 − 2K lnu|2KK + u|2KK
= K(K
2− 2.386).
(8)
Furthermore, we can transform equation (6) into theequation as follows:
|SigA(N,Lenc)∩
SigB(N,Lenc)| ≥ Nδ.
When |SigA(N,Lenc)∩SigB(N,Lenc)| ≥ Nδ is sat-
isfied, then file A is similar to file B. Therefore, we cansimplify the process of similarity detection in comparisonwith the original equation (4).
5 SAMPLING BASED SIMILARITY IDENTIFICATION
In order to effectively detect file similarity with low over-head and high accuracy, we propose and introduce EPAS inthis section.
5.1 Traditional Sampling Algorithm (TSA)TSA is described in Algorithm 1 by using pseudo-code. Wesample N data blocks from file A, inject each data blocksizing Lenc to a hash function. We then obtain N fingerprintvalues that are collected as a fingerprint set SigA(N,Lenc).
IEEE TRANSACTIONS ON XXX, XXX, XXXX, OCTOBER 2014 6
0KB 11KB 22KB 33KB 44KB 55KB
0KB 12KB 24KB 36KB 48KB 60KB
0KB 12KB 24KB 36KB 48KB 60KB48KB
0KB 12KB 24KB 36KB 60KB
File A
File B1
File B2
File B3
Sampling chunk Increasing chunk
48KB
(a) TSA
0KB 11KB 22KB 33KB 44KB 55KB
0KB 11KB 22KB 33KB 44KB 60KB
0KB 11KB 22KB 33KB 44KB 60KB44KB
0KB 11KB 22KB 33KB 60KB
File A
File B1
File B2
File B3
Sampling chunk Increasing chunk
44KB
(b) PAS
0KB 11KB 22KB 33KB 44KB 55KB
0KB 11KB 22KB 38KB 49KB 60KB
0KB 11KB 22KB 38KB 49KB 60KB49KB
0KB 11KB 22KB 38KB 60KB
File A
File B1
File B2
File B3
Sampling chunk Increasing chunk
49KB
(c) EPAS
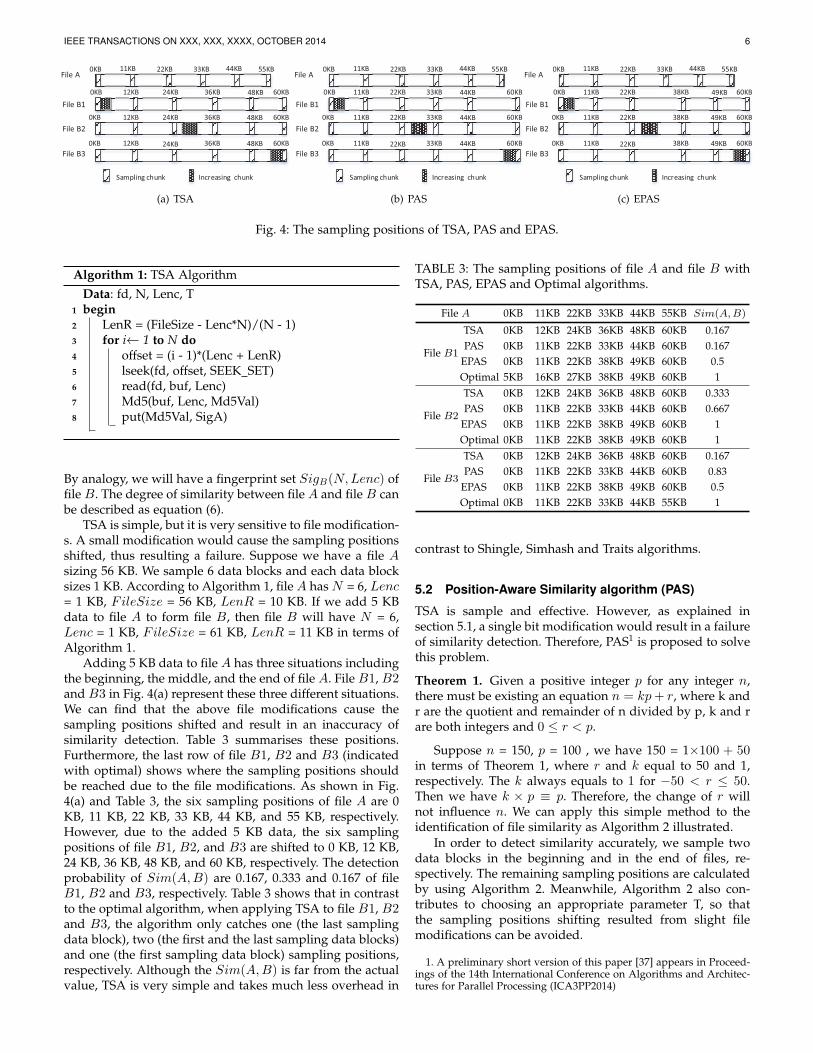
Fig. 4: The sampling positions of TSA, PAS and EPAS.
Algorithm 1: TSA AlgorithmData: fd, N, Lenc, T
1 begin2 LenR = (FileSize - Lenc*N)/(N - 1)3 for i← 1 to N do4 offset = (i - 1)*(Lenc + LenR)5 lseek(fd, offset, SEEK SET)6 read(fd, buf, Lenc)7 Md5(buf, Lenc, Md5Val)8 put(Md5Val, SigA)
By analogy, we will have a fingerprint set SigB(N,Lenc) offile B. The degree of similarity between file A and file B canbe described as equation (6).
TSA is simple, but it is very sensitive to file modification-s. A small modification would cause the sampling positionsshifted, thus resulting a failure. Suppose we have a file Asizing 56 KB. We sample 6 data blocks and each data blocksizes 1 KB. According to Algorithm 1, file A has N = 6, Lenc= 1 KB, FileSize = 56 KB, LenR = 10 KB. If we add 5 KBdata to file A to form file B, then file B will have N = 6,Lenc = 1 KB, FileSize = 61 KB, LenR = 11 KB in terms ofAlgorithm 1.
Adding 5 KB data to file A has three situations includingthe beginning, the middle, and the end of file A. File B1, B2and B3 in Fig. 4(a) represent these three different situations.We can find that the above file modifications cause thesampling positions shifted and result in an inaccuracy ofsimilarity detection. Table 3 summarises these positions.Furthermore, the last row of file B1, B2 and B3 (indicatedwith optimal) shows where the sampling positions shouldbe reached due to the file modifications. As shown in Fig.4(a) and Table 3, the six sampling positions of file A are 0KB, 11 KB, 22 KB, 33 KB, 44 KB, and 55 KB, respectively.However, due to the added 5 KB data, the six samplingpositions of file B1, B2, and B3 are shifted to 0 KB, 12 KB,24 KB, 36 KB, 48 KB, and 60 KB, respectively. The detectionprobability of Sim(A,B) are 0.167, 0.333 and 0.167 of fileB1, B2 and B3, respectively. Table 3 shows that in contrastto the optimal algorithm, when applying TSA to file B1, B2and B3, the algorithm only catches one (the last samplingdata block), two (the first and the last sampling data blocks)and one (the first sampling data block) sampling positions,respectively. Although the Sim(A,B) is far from the actualvalue, TSA is very simple and takes much less overhead in
TABLE 3: The sampling positions of file A and file B withTSA, PAS, EPAS and Optimal algorithms.
File A 0KB 11KB 22KB 33KB 44KB 55KB Sim(A,B)
File B1
TSA 0KB 12KB 24KB 36KB 48KB 60KB 0.167PAS 0KB 11KB 22KB 33KB 44KB 60KB 0.167
EPAS 0KB 11KB 22KB 38KB 49KB 60KB 0.5Optimal 5KB 16KB 27KB 38KB 49KB 60KB 1
File B2
TSA 0KB 12KB 24KB 36KB 48KB 60KB 0.333PAS 0KB 11KB 22KB 33KB 44KB 60KB 0.667
EPAS 0KB 11KB 22KB 38KB 49KB 60KB 1Optimal 0KB 11KB 22KB 38KB 49KB 60KB 1
File B3
TSA 0KB 12KB 24KB 36KB 48KB 60KB 0.167PAS 0KB 11KB 22KB 33KB 44KB 60KB 0.83
EPAS 0KB 11KB 22KB 38KB 49KB 60KB 0.5Optimal 0KB 11KB 22KB 33KB 44KB 55KB 1
contrast to Shingle, Simhash and Traits algorithms.
5.2 Position-Aware Similarity algorithm (PAS)
TSA is sample and effective. However, as explained insection 5.1, a single bit modification would result in a failureof similarity detection. Therefore, PAS1 is proposed to solvethis problem.
Theorem 1. Given a positive integer p for any integer n,there must be existing an equation n = kp+ r, where k andr are the quotient and remainder of n divided by p, k and rare both integers and 0 ≤ r < p.
Suppose n = 150, p = 100 , we have 150 = 1×100 + 50in terms of Theorem 1, where r and k equal to 50 and 1,respectively. The k always equals to 1 for −50 < r ≤ 50.Then we have k × p ≡ p. Therefore, the change of r willnot influence n. We can apply this simple method to theidentification of file similarity as Algorithm 2 illustrated.
In order to detect similarity accurately, we sample twodata blocks in the beginning and in the end of files, re-spectively. The remaining sampling positions are calculatedby using Algorithm 2. Meanwhile, Algorithm 2 also con-tributes to choosing an appropriate parameter T, so thatthe sampling positions shifting resulted from slight filemodifications can be avoided.
1. A preliminary short version of this paper [37] appears in Proceed-ings of the 14th International Conference on Algorithms and Architec-tures for Parallel Processing (ICA3PP2014)
IEEE TRANSACTIONS ON XXX, XXX, XXXX, OCTOBER 2014 7
Algorithm 2: PAS Algorithm.Data: fd, N, Lenc, T
1 begin2 FileSize = (FileSize/T)*T3 LenR = (FileSize - Lenc*N)/(N - 1)4 LenR = LenR > 0 ? LenR : 05 for i← 1 to N - 1 do6 offset = (i - 1)*(Lenc + LenR)7 lseek(fd, offset, SEEK SET)8 read(fd, buf, Lenc)9 Md5(buf, Lenc, Md5Val)
10 put(Md5Val, SigA)
11 lseek(fd, -Lenc, SEEK END)12 read(fd, buf, Lenc)13 Md5(buf, Lenc, Md5Val)14 put(Md5Val, SigA)
We take the same example used in Section 5.1 to illustratethe basic idea of PAS. We take T as 28 KB. This is becausein order to avoid the shifting of sampling positions incurredby adding the 5 KB data, T should be bigger than 5 KB andsmaller than the file size of file A. Other numbers of T arealso applicable. For example, T could be 6 KB, 7 KB, 8 KB,9 KB and so on. Then, file A has N = 6, FileSize = 56 KB,LenR = 10 KB, T = 28 KB. According to Algorithm 2, fileB will have N = 6, FileSize =61 KB, LenR = 10 KB, T= 28 KB. From Fig. 4(b) and Table 3, we can find that thesampling positions of file B (including file B1, B2 and B3)are 0 KB, 11 KB, 22 KB, 33 KB, 44 KB and 60 KB, respectively.In contrast to the sampling positions of file A, the onlydifference is the last sampled data block at the position 60KB. This is because we fix two sampling positions in thebeginning and the end of the corresponding files. However,the contents of those sampling blocks have been shifteddue to the file modifications. The Sim(A,B) of file B1,B2 and B3 are 0.167, 0.667 and 0.83, respectively. Table3 indicates that PAS catches more real sampling positionsthan that of TSA, if we compare the sampling positionsachieved by PAS against the positions offset by the optimalalgorithm. According to the above analysis, we can concludethat the PAS algorithm can avoid the shifting of samplingpositions generated from slight file modifications in themiddle and the end of source files. In addition, if it is appliedto data deduplication system, PAS is also superior to othersimilarity detection algorithms [16].
5.3 Enhanced Position-Aware Similarity Algorithm(EPAS)Although PAS algorithm keeps the advantages of TSA thatthe overhead is fixed and low, a slight modification in thefile head will cause a failure of similarity detection. The fileB1 in Fig. 4(b) and Table 3 shows this scenario. Therefore,EPAS is proposed to alleviate this problem by enhancingPAS. EPAS maintains the advantages of both PAS and TSA.We describe it in Algorithm 3.
EPAS respectively samples N2 data blocks from the head
and the tail of the modulated files. It then maps thesedata blocks into fingerprints by utilizing hash functions
Algorithm 3: EPAS Algorithm.Data: fd, N, Lenc, T
1 begin2 FileSize = (FileSize/T)*T3 LenR = (FileSize - Lenc*N)/(N - 1)4 LenR = LenR > 0 ? LenR : 05 for i← 1 to N/2 do // Sampling from file
head6 offset = (i - 1)*(Lenc + LenR)7 lseek(fd, offset, SEEK SET)8 read(fd, buf, Lenc)9 Md5(buf, Lenc, Md5Val)
10 put(Md5Val, SigA)
11 for i← 1 to N - N/2 do // Sampling from filetail
12 offset = (i - 1)*(Lenc + LenR)13 lseek(fd, -(offset + Lenc), SEEK END)14 read(fd, buf, Lenc)15 Md5(buf, Lenc, Md5Val)16 put(Md5Val, SigA)
and obtains the similarity characteristic value. N is a fixedconstant and much smaller than the file size. Since EPASonly samples and calculates N data block fingerprints, thetime and computation complexity of EPAS are O(1). Weemploy the same example used in section 5.1 to illustratethe basic idea of EPAS as shown in Fig. 4(c) and Table 3. Wealso sample six data blocks with 1 KB length, take T as 28KB. According to Algorithm 3, file A has FileSize = 56 KB,N = 6, T = 28 KB, LenR = 10 KB, Lenc = 1 KB. File B hasFileSzie = 61 KB, N = 6, T = 28 KB, LenR = 10 KB, Lenc =1 KB.
The six sampling positions of file A are 0 KB, 11 KB, 22KB, 33 KB, 44 KB and 55 KB, respectively. The six samplingpositions of file B (including file B1, B2 and B3) are 0KB, 11 KB, 22 KB, 38 KB, 49 KB and 60 KB, respectively.The Sim(A,B) of file B1, B2 and B3 are 0.5, 1 and 0.5,respectively. The number of identical sampling data blocksof file A with file B1, B2 and B3 are three (the first, thesecond and the third sampling data blocks), six (all samplingdata blocks) and three (the fourth, the fifth and the sixthsampling data blocks), respectively. This sampling methodkeeps the effectiveness of EPAS in different situations forfile B1, B2 and B3. File B1 represents the situation of aslight modification in the head of file A. The first three datablocks sampled from the head of file B1 are not identicalto the corresponding data blocks of file A, even thoughthe corresponding sampling positions are the same. This ismainly because the modification causes the content of fileB1 shifting. Similarly, even though the last three samplingpositions of file B1 and file A are different, the three datablocks sampled from the tail of file B1 are identical to fileA, because they are consistent with the sampling positionsachieved by the optimal algorithm. File B2 illustrates thesituation of a small modification in the middle of file A.The content of six sampling data blocks of file B2 areequivalence to those of file A. Since, a small modificationin the middle of file B2 does not impact the sampling data

IEEE TRANSACTIONS ON XXX, XXX, XXXX, OCTOBER 2014 8
99
67
34
N=3
ID=10
99
67
34
1
3,4
1,3
fingerprint ID
1
3
4
2
2
1
ID
Occurrence
number
Combine results
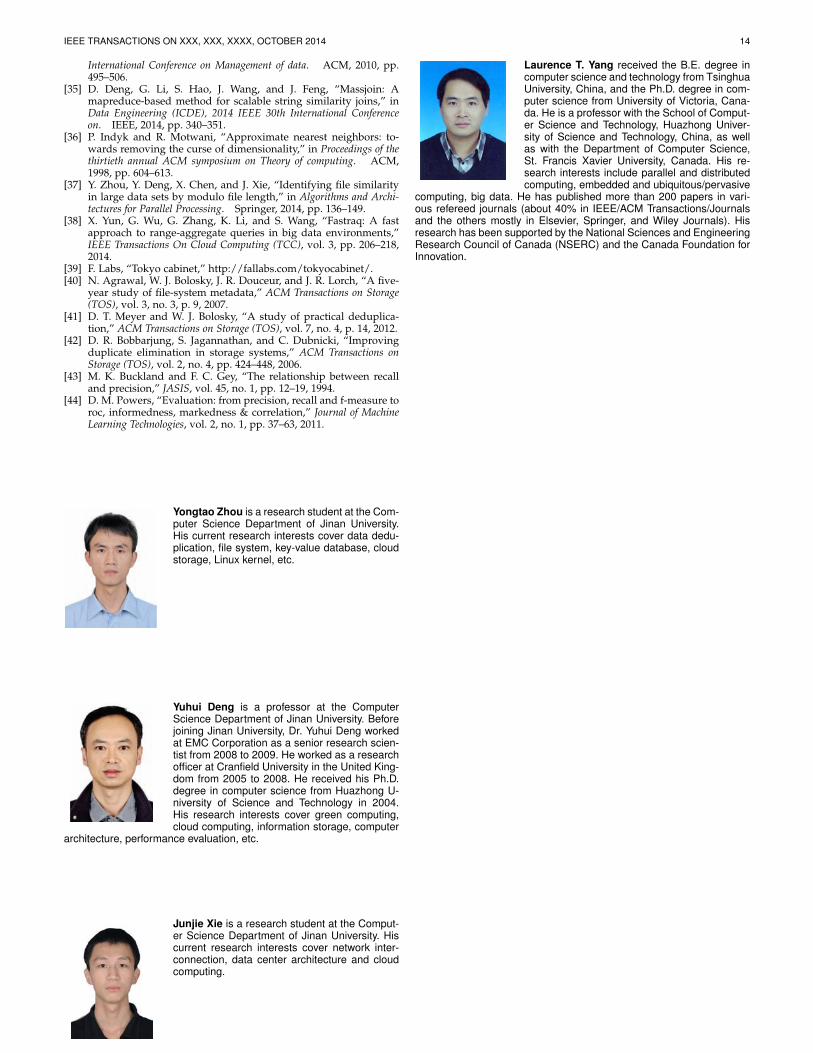
Fig. 5: The query algorithm of EPAS.
blocks when applying PEAS. File B3 represents the modifi-cation in the tail of file A. The three data blocks sampledfrom the head of file B3 are identical to those of file A,whereas the content of last three data blocks are different tothose of file A. According to the three different modificationsituations of file B1, B2 and B3, we can draw the conclusionthat EPAS has desirable performance in detecting similaritybetween two files. EPAS ensures that at least one half ofsampling data blocks are identical in different modificationsituations. Therefore, we have Sim(A,B) ≥ 50% accordingto equation (6) in contrast to the Sim(A,B) ≥ 33% viaequation (4). This makes EPAS more effective and accurate.
The similarity algorithms including Shingle, Simhashand Traits need to split files into chunks by using Rabinhash functions. These algorithms neglect the sequence offile contents. However, an important point about similarfiles is that the orders of content are roughly the same. Forexample, (a, c, a, b, a) is similar to (a, b, a, c, a) by usingShingle when w is determined as 2, although the order of (a,c, a, b, a) is different to (a, b, a, c, a). On the contrary, slightlymodifying the order of file content has a significant effect onthe performance of EPAS, Since the EPAS detects similaritybased on sampling.
5.4 Querying algorithm for EPAS
After calculating the similarity characteristic value withAlgorithm 3, we can determine that file A is similar to fileB if Sim(A,B) ≥ δ is satisfied in terms of equation (6).Given a file A and a data set Set(K) (contains K files), weneed to find the files in the Set(K) that are similar to thefile A. A simple approach is to traverse the files in Set(K)for every query. The time complexity of this method isO(K), and it increases with the growth of Set(K). However,traversing the whole Set(K) can not accommodate thecloud environment which requires low latency and quickresponse [38].
In order to solve this problem, we build a mappingrelationship of fingerprints to the ID of correspondingfile (fingerprint→ID). Fig. 5 shows the process of queryingsimilar files in the Set(K) to a given file A, where the ID offile A is 10. We suppose that N equals to 3 and the similaritycharacteristic value of file A is (99, 67, 34). This process canbe described as follows:
1) For each fingerprint value in the set (99, 67, 34), wefind the file ID which has identical fingerprint valuewith that of file A. In this step, we need N queries.
2) Combine the result of pervious queries, we need torecord the occurrence number of every ID. For ex-ample, we get the result {(99→1), (67→3, 4), (34→1,3)}. And then combine the results, we can obtain
0K-12K 12K-32K 32K-2M 2M-128M 128M-1G0
2000
4000
File
Num
ber
File Size
Fig. 6: The file size distribution of data set D1.
TABLE 4: The profile of data set D1.
Popularity Storage Space
Rank Ext. %Occur Ext. %Storage1 h 55.30 pdf 77.522 pdf 14.70 mkv 4.383 jpg 5.34 rar 4.244 c 4.28 mp3 4.015 mp3 3.48 zip 2.39
Total – 83.1 – 92.54
the ID and the corresponding occurrence number{(1:2), (3:2), (4:1)}.
3) For each occurrence number of each ID, we divideit by N . This follows equation (6) to calculate thesimilarity probability. For simplicity, we only needto judge if the occurrence number of each ID isgreater than N ∗ δ. In this example, we take δ as0.1. It is very easy to find that file 1, 3 and 4 aresimilar to file A(2>0.3, 2>0.3, 1>0.3).
Furthermore, we can use a key-value database to buildthis mapping relationship. In section 6, we employ the key-value database Tokyo Cabinet [39] to build the mappingrelationship. The query response time of Tokyo Cabinet isvery short. In addition, the memory overhead of TokyoCabinet is fixed. This is mainly because Tokyo Cabinet doesnot cache any data in memory. Therefore, Tokyo Cabinet isvery suitable for the cloud environment with low latencyand quick response.
6 EVALUATION
6.1 Evaluation environment
The experiments in this paper are performed in a Ubuntuoperation system (kernel version is 2.6.32). The hardwareconsists of 1 GB memory, 2.0 GHZ Intel(R) Pentium(R)CPU. We adopt Tokyo Cabinet (1.4.48) [39] to store EPASfingerprint sets.
In order to measure the performance of EPAS algorithm,we employ two data sets D1 and D2 to perform the eval-uation. Data set D1 is collected from a Linux server in ourresearch lab and a personal cloud DropBox. D1 has 2756 fileswith total size of 11.5 GB. Table 4 summarizes the profile of

IEEE TRANSACTIONS ON XXX, XXX, XXXX, OCTOBER 2014 9
D1. It shows that the top five popular files are those withthe suffix of .h, .pdf, .jpg, .c and .mp3. Table 4 also indicatesthat the files with suffix .pdf consumes the highest portionof storage capacity. Fig. 6 shows the distribution of file size.It implies that the highest portion of file size ranges from 0KB to 4 KB. The file size distribution in Fig. 6 is consistentwith the investigation of Agrawal et al. [40] and Meyeretet al. [41]. Therefore, we believe that data set D1 is veryrepresentative.
Similarly, we build another data set D2 to determinethe optimal parameters of EPAS. The files in D2 consist oforiginal files and the augmented files that are modified inthe beginning, the middle, and the end of the correspondingoriginal files. D2 is made up of 14 txt files. The total size is128 MB.
6.2 Parameters selectionSince the parameters T , Lenc, N and threshold δ have agreat impact on the performance of EPAS, it is meaningfulto determine the optimal parameters. We compare the detec-tion probability of EPAS with the actual portion of matchingchunks in data set D2. Because the actual portion of match-ing chunks is the up bound of the similarity between twofiles, the optimal parameters should get the closest detec-tion probability of EPAS to the actual portion of matchingchunks. In order to obtain the actual portion of matchingchunks, we separate files into variable-size chunks by usinga content defined chunking algorithm which can effectivelyavoid misaligned file content [42], [5]. These chunks are thenmapped into fingerprints with hash functions to obtain afingerprint set. Applying this method to file A and file B, wehave two fingerprint sets Finger(A) and Finger(B). Theactual portion of matching chunk fingerprints of file A andfile B is described with equation (9), where Match(A,B)lies between 0 to 1. This is consistent with equation (4). IfMatch(A,B) reaches 1, this indicates that most chunks offile A and file B are matching, vice verse.
Match(A,B) =|Finger(A) ∩ Finger(B)||Finger(A) ∪ Finger(B)|
. (9)
Comparing Match(A,B) in equation (9) with Sim(A,B)in equation (6), we can determine optimal parameters. Forexample, if Match(A,B) = Sim(A,B), this implies thatthe EPAS algorithm catches the real similarity of file A andfile B.
6.2.1 Sampling position impact factor TTable 5 illustrates the impact of T on the detection prob-ability, where Lenc equals to 32 B, N equals to 8, and Tis assigned with 2 KB, 8 KB, 32 KB, 128 KB and 512 KB,respectively. It is very interesting to observe that when Tis defined as 2 KB and 8 KB, the corresponding value gofar from the portion of actual matching chunk fingerprintMatch(A,B). At this point, the values of actual matchingchunk fingerprint Match(A,B) range from 0.48 to 0.97,while the values of detection probability Sim(A,B) floataround 0.25. In this situation, the failure ratio of detectionis rather high. Because even though most data blocks oftow files are identical, the detection probability is still verylow. When T is set as 32 KB, 128 KB and 512 KB, the
TABLE 5: The impact of T on the detection probability (Lenc= 32 B, N = 8, T = 2 KB, 8 KB, 32 KB, 128 KB, 512 KB). ρrepresents the value of Match(A,B) in equation (9).
HHHHρT 2 KB 8 KB 32 KB 128 KB 512 KB
0 0 0 0 0 00.48 0.25 0.25 0.63 0.63 0.630.54 0.25 0.25 0.38 0.38 0.380.56 0.25 0.25 0.38 0.38 0.380.65 0.25 0.25 0.38 0.38 0.380.73 0.25 0.25 0.38 0.38 0.380.82 0.25 0.75 0.75 0.75 0.750.82 0.25 0.25 0.25 0.38 0.380.89 0.25 0.63 0.63 0.63 0.630.89 0.13 0.5 0.5 0.5 0.50.95 0.25 0.88 0.88 0.88 0.880.97 0.13 0.5 0.5 0.5 0.5
1 1 1 1 1 1
TABLE 6: The impact of Lenc on the detection probability(T = 521 KB, N = 8, Lenc = 32 B, 128 B, 512 B, 2 KB, 8 KB. ρrepresents the value of Match(A,B) in equation (9).
PPPPPPρLenc 8 B 32 B 128 B 512 B 2 KB 8 KB
0 0 0 0 0 0 00.48 0.63 0.63 0.63 0.63 0.63 0.630.54 0.38 0.38 0.38 0.38 0.38 0.380.56 0.38 0.38 0.38 0.38 0.38 0.380.65 0.38 0.38 0.38 0.38 0.38 0.380.73 0.38 0.38 0.38 0.38 0.25 0.250.82 0.75 0.75 0.75 0.75 0.75 0.750.82 0.38 0.38 0.38 0.38 0.38 0.250.89 0.63 0.63 0.63 0.63 0.63 0.630.89 0.5 0.5 0.5 0.5 0.5 0.50.95 0.88 0.88 0.88 0.88 0.88 0.880.97 0.5 0.5 0.5 0.5 0.5 0.5
1 1 1 1 1 1 1
corresponding values are very close to the Match(A,B).However, the detection probability is extremely low whenthe Match(A,B) equals to 0.8 and T is determined as 32KB. This proves that 32 KB is not the optimal parameterfor T . From Table 5, we observe the fluctuation of detectionprobability Sim(A,B). According to Algorithm 3, the detec-tion probability of EPAS is at least greater than 0.5 when themodifications are in the head and tail of the correspondingfiles, so EPAS is somewhat less than the actual portion ofidentical data blocks contained in two files, which will incursome fluctuation of the detection probability Sim(A,B).This also supports that EPAS can effectively detect similar-ity when comparing with PAS. Therefore, we believe thatEPAS can ensure efficiency and accuracy. In the followingexperiments, we take T = 512 KB.
According to Algorithm 3, we know that T has no impacton the overhead of EPAS, so we will not discuss any morein this subsection about overhead.

IEEE TRANSACTIONS ON XXX, XXX, XXXX, OCTOBER 2014 10
8 B 32 B 128 B 512 B 2 KB 8 KB
0
500
1000
1500
2000
2500
3000
3500
4000
!"#$%&#'(#)*+,-.
Sampling data block lengths Lenc
Fig. 7: The time overhead with different Lenc (T = 512 KB,N = 8, Lenc = 32 B, 128 B, 512 B, 2 KB, 8 KB).
TABLE 7: The impact of N on the detection probability (T= 512 KB, Lenc = 32 B, N = 4, 6, 8, 10, 12, 14, 16, 18). ρrepresents the value of Match(A,B) in equation (9).
HHHHρN 4 6 8 10 12 14 16 18
0 0 0 0 0 0 0 0 00.48 0.75 0.67 0.63 0.6 0.67 0.57 0.56 0.560.54 0.5 0.5 0.38 0.3 0.33 0.29 0.31 0.280.56 0.5 0.33 0.38 0.3 0.25 0.26 0.25 0.220.65 0.5 0.5 0.38 0.4 0.33 0.36 0.38 0.330.73 0.5 0.5 0.38 0.4 0.33 0.36 0.31 0.330.82 0.75 0.67 0.75 0.7 0.75 0.71 0.69 0.720.82 0.5 0.33 0.38 0.3 0.25 0.21 0.25 0.220.89 0.75 0.67 0.63 0.6 0.67 0.64 0.63 0.610.89 0.5 0.5 0.5 0.5 0.5 0.5 0.5 0.50.95 0.75 0.83 0.88 0.8 0.83 0.86 0.81 0.830.97 0.5 0.5 0.5 0.5 0.5 0.5 0.5 0.5
1 1 1 1 1 1 1 1 1
6.2.2 Size of sampling data blocks
Table 6 demonstrates the impact of sampling data blocklength on the detection probability, where T equals to 512KB, N equals to 8, and Lenc is set as 8 B, 32 B, 128 B, 512 B,2 KB and 8 KB, respectively. Similarly, when Lenc is definedas 2 KB and 8 KB, the corresponding values Sim(A,B) gofar from the Match(A,B). This is because the probability ofreading the modified data blocks increases with the growthof Lenc, thus resulting in different fingerprints. When Lencis set as 8 B, 32 B, 128 B and 512 B, the corresponding valuesof Sim(A,B) are identical.
Fig. 7 depicts that the time overhead grows with theincrease of Lenc when Lenc ranges from 8 B to 32 B, 128B, 512 B, 2 KB and 8 KB. Although we can observe alittle bit fluctuation of the time overhead, the main trendis very clear. According to Algorithm 3, we can discoverseveral reasons behind the fluctuations in Fig. 7. The firstone is that the MD5 hash function we used in experimentinfluences the computation overhead. The second one is theread ahead strategy of file system and the operation processschedule method. Taking all things from Table 6 and Fig.7 into consideration, we adopt Lenc as 32 B in subsequent
4 6 8 10 12 14 16 180
1000
2000
3000
4000
5000
6000
7000
8000
Tim
e ov
erhe
ad(
s)
Sampling data block numbers
Fig. 8: The time overhead with different N (T = 512 KB,Lenc = 32 B, N = 4, 6, 8, 10, 12, 14, 16, 18).
experiments. In this case, the time overhead is minimumand the detection probability is close to the actual matchingfingerprint Match(A,B).
6.2.3 Number of sampled data blocksTable 7 describes the impact of the number of sampling datablocks N on the detection probability, where T equals to 512KB, Lenc equals to 32 B, and N is determined as 4, 6, 8,10, 12, 14, 16 and 18, respectively. When N is set as 8, 10,12, 14, 16 and 18, the corresponding values go far from theMatch(A,B). In addition, the detection error of Algorithm3 grows with the increase of N . When N is defined as4 and 6, the values Sim(A,B) become very close to theMatch(A,B), which means that we can take 4 or 6 as theoptimal parameter.
A basic trend of Fig. 8 is that the time overhead growswith the increase of N . Since Table 7 indicates the detectionaccuracy of EPAS, we have to make a balance between thedetection accuracy and the time overhead. N = 4 can achievethis balance in terms of our investigation.
6.3 Threshold δ of EPAS algorithm
Consider a file A and a file B, Sim(A,B) ≥ δ indicatesthat file A is similar to file B, where δ is the thresholdof similarity. We employ precision and recall introducedin [43], [44] to select an optimal threshold δ. The preci-sion and recall are defined in equation (10) and equation(11), respectively, where u represents a file set, A denotesthe file required to detect similarity among the file set u,Query(A, u) means a file set extracted by similarity de-tection algorithms, and that file set is similar to the file Aamong the file set u. Matchall(A, u) indicates a file set,which is actually similar to file A among the file set u,|Matchall(A, u)∩Query(A, u)| implies that a detection fileset is actually similar to file A.
Precision =|Matchall(A, u) ∩Query(A, u)|
|Query(A, u)|. (10)
Recall =|Matchall(A, u) ∩Query(A, u)|
|Matchall(A, u)|. (11)
As formula (10) and (11) indicate, precision is the fractionof detection instances which are actually similar, while recall

IEEE TRANSACTIONS ON XXX, XXX, XXXX, OCTOBER 2014 11
0.0 0.1 0.2 0.3 0.4 0.5 0.6 0.7 0.8 0.9 1.00.0
0.1
0.2
0.3
0.4
0.5
0.6
0.7
0.8
0.9
1.0
Prec
isio
n an
d R
ecal
l
SPAS similarity threshold
Precision Recall
Fig. 9: The precision and recall of EPAS algorithm.
is the fraction of actually similar instances that are retrieved,their values are both between 0 to 1. If the precision valueis close to 1, it means that most detection instances areactually similar. On the contrary, if the precision value isclose to 0, which indicates that most detection instances arenot similar. By analogy, if the recall value is close to 1, itimplies that we detect most actually similar instances. If therecall value is close to 0, it denotes that just detect very fewsimilar instances.
According to the above analysis, we expect to have highprecision and recall that are close to 1. Unfortunately, it isvery hard to achieve this goal. If we want to detect moreactually similar files, we have to relax the limit of thresholdvalue δ. However, reducing the threshold value δ incursmore actual instances that are not similar in the detection re-sults. This will decrease the precision value. Expecting mostdetection results are actually similar means that we needto restrict the limit of threshold value δ. This will reducethe actually similar instances detected, thus decreasing therecall value. Therefore, we have to make a tradeoff betweenthe precision and recall.
Fig. 9 shows the impact of similarity threshold δ on theprecision and recall under EPAS algorithm, where T equalsto 512 KB, Lenc is 32 B and N is defined as 4. We canobserve that with the growth of δ, the precision increases,while the recall decreases. According to Fig. 9, we determinethat the optimal similarity threshold value is 0.5, for bothof the precision and recall can achieve a relatively highvalue. Therefore, if file A and file B satisfy the equationSim(A,B) ≥ 0.5, we treat them as similar.
6.4 EPAS algorithm evaluation
In this section, we evaluate the time overhead, query time,memory and CPU utilization, precision and recall of EPASagainst the well-known similarity detection algorithms suchas Shingle, Simhash and Traits. The Lenc, N , and δ are setas 32 B, 4, and 0.5, respectively. According to the work in[18], hamming distance is selected as 3, and the number ofstored tables is determined as 4. All the measurements inthis section are performed with data set D1. In addition, wewill also compare EPAS with PAS.
In order to reduce the storage consumption, EPAS algo-rithm uses 8 bits to store a fingerprint. Therefore, it takes 32
2MB 5MB 10MB0
2
4
600120018002400300036004200
Tim
e ov
erhe
ad(m
s)
File size
Shingle Simhash Traits PAS EPAS
Fig. 10: The time overhead of EPAS, Shingle, Simhash, Traitsand PAS algorithm with different file size 2 MB, 5 MB, and10 MB.
D10
100
200
300
400
500
600
700
Tim
e ov
erhe
ad(s
)
Simhash Traits PAS EPAS
Fig. 11: The time overhead of Simhash, Traits, PAS and EPASalgorithm with data set D1.
37
48
1560
38
D2
0
10
20
30
40
50
1400
1600
Querytime(ms)
Simhash
Traits
PAS
EPAS
Fig. 12: The query time of Simhash, Traits, PAS and EPASalgorithm with data set D2.
bits for each file. However, the redundant tables of Simhashneed 256 bits to store the fingerprints of each file.
6.4.1 Time overheadThe time overhead is evaluated with three different filesize including 2 MB, 5 MB and 10 MB. Fig. 10 shows thatthe time overhead of EPAS is much smaller than that ofShingle, Simhash, Traits and PAS. It also proves that thetime overhead of Shingle is the largest one. This is mainly

IEEE TRANSACTIONS ON XXX, XXX, XXXX, OCTOBER 2014 12
0 20 40 60 80 200 400 600 800 10000.0
0.1
0.2
0.3
102030405060708090
CPU
and
Mem
ory
over
head
(%)
Time(s)
Simhash CPU Traits CPU PAS CPU EPAS CPU Simhash Mem Traits Mem PAS Mem EPAS Mem
Fig. 13: CPU and memory utilization of EPAS, Simhash, PASand Traits with data set D1.
because Shingle needs a lot of time to read file contentsand calculate the fingerprints by using MD5 hash functions,as introduced in Section 3.1. Fig. 11 investigates the timeoverhead with a real data set D1. It shows the same trendas Fig. 10. Because the overhead of Shingle is too highto be printed on the figure, we omit it in the followingexperiments.
6.4.2 Query timeFig. 12 demonstrates the query time of Simhash, Traits, PASand EPAS. The query time of PAS is the largest one amongthem. When querying similarity characteristic value, PASneeds to traverse the whole set. This will cause multipledisk accesses which generate long latency to read the cor-responding data from disk drive. The query time of EPASis between Simhash and Traits. In order to enhance theperformance of query, Simhash uses multiple redundanttables to store similarity characteristic value, but at thecost of consuming more memory resource. In contrast toSimhash, EPAS and Traits only store one copy of similari-ty characteristics value in memory. Compared with EPAS,Traits needs to compare multiple pre-traits PT 1...PT t, andit consumes more time to accomplish similarity detection.Instead of traversing the whole set, EPAS builds a map-ping relationship of fingerprints to the ID of correspondingfile. This method reduces the time overhead of queryingand comparing. Therefore, the performance of EPAS is en-hanced.
6.4.3 CPU and Memory utilizationFig. 13 illustrates the CPU and memory utilization ofSimhash, Traits, PAS and EPAS. In this figure, the CPUutilization of Traits, Simhash, PAS and EPAS are about 80%,44%, 13% and 15%, respectively. This indicates that Traitsand Simhash are more computation intensive than PAS andEPAS. Specially, Traits needs more CPU cycles to calculatefingerprints than what Simhash requires. According to Al-gorithm 2 and 3, the CPU overhead of PAS and EPAS isroughly identical.
From Fig. 13, we can find that the memory utilizationof Traits slightly exceeds those of other algorithms andincreases with time goes by. There are two reasons for
TABLE 8: The precision and recall of Traits, Simhash, PASand EPAS.
Precision Recall
Simhash 0.66 0.666Traits 0.888 0.888PAS 1 0.333
EPAS 0.75 1.0
this phenomenon. The first one is that Traits uses a lotof memory space to store the temp fingerprint sets whencalculating the similarity characteristic value. The secondreason is that the similarity characteristic value of Traits arestored in memory. Hence, the memory utilization of EPASand PAS are much less than that of Traits. Both PAS andEPAS algorithms adopt Tokyo Cabinet to store fingerprintsets, and the Tokyo Cabinet maps data files into memoryas much as possible, so that the PAS and EPAS algorithmstake more memory space than that of Simhash. However,the memory utilization of PAS and EPAS is relatively stable.This is because Tokyo Cabinet does not store any data incache, while Simhash algorithm stores all fingerprints inmemory and keeps redundant fingerprints.
6.4.4 Precision and RecallTable 8 indicates the precision and recall of Simhash, Traits,PAS and EPAS with data set D2. From Table 8, we can findthat Traits makes a good tradeoff between precision andrecall, which means that Traits can find more actual similarinstances and keep the accuracy. However, the computingoverhead of Traits is rather large. As described in section3, Traits needs to compute t groups of fingerprint sets, ittakes a large volume of memory space and CPU cycles. Theprecision and recall of Simhash are less than that of Traitsand EPAS. This is mainly because Simhash employs a fixed-size partition algorithm. This makes the Simhash algorithmmore sensitive to the file modifications. One single bit mod-ification makes the fingerprints of the two correspondingfiles completely distinct. Although PAS maintains a highvalue of precision, the recall is very low. This means PAS cannot find the most actual similar instances. This is becausePAS is incapable of detecting the situation of slight modifi-cations in the file head. Despite EPAS is able to find the mostsimilar files, some false alarms still exist. It is noteworthythat the overhead of EPAS is the smallest one among thosealgorithms. Therefore, we believe that EPAS is a practicaland applicable solution for the file similarity detection.
7 CONCLUSION AND FUTURE WORK
In this paper, we propose an Enhanced Position-Aware Sam-pling algorithm (EPAS) for the cloud environment. Com-prehensive experiments are performed to select optimal pa-rameters for EPAS. Corresponding analysis and discussionof the parameter selection are introduced in this paper. Theevaluation of precision and recall demonstrates that EPASis very effective in detecting file similarity in contrast toShingle, Simhash, Traits and PAS. The experimental resultsalso suggest that the time overhead, CPU and memory occu-pation of EPAS are much less than that of those algorithms.
IEEE TRANSACTIONS ON XXX, XXX, XXXX, OCTOBER 2014 13
Therefore, we believe that EPAS can be applied to the cloudenvironment to reduce the latency and achieve both theefficiency and accuracy.
Sampling based similarity identification opens up sever-al directions for future work. The first one is using content-based chunk algorithm to sample data blocks, since thisapproach can avoid content shifting incurred by data mod-ification. The second one is employing file metadata tooptimize the similarity detection. This is because the file sizeand type which are contained in the metadata of similar fileare normally very close.
ACKNOWLEDGMENTS
We would like to thank the anonymous reviewers for help-ing us refine this paper. Their constructive comments andsuggestions are very helpful. This work is supported bythe NSF of China under Grant (No. 61572232, and No.61272073), the key program of NSF of Guangdong Province(No. S2013020012865), the Fundamental Research Funds forthe Central Universities, the Open Research Fund of KeyLaboratory of Computer System and Architecture, Instituteof Computing Technology, Chinese Academy of Sciences(CARCH201401), and the Science and Technology PlanningProject of Guangdong Province (No. 2013B090200021). Thecorresponding author is Yuhui Deng.
REFERENCES
[1] Q. Zhang, Z. Chen, A. Lv, L. Zhao, F. Liu, and J. Zou, “A universalstorage architecture for big data in cloud environment,” in GreenComputing and Communications (GreenCom), 2013 IEEE and Internetof Things (iThings/CPSCom), IEEE International Conference on andIEEE Cyber, Physical and Social Computing. IEEE, 2013, pp. 476–480.
[2] J. Gantz and D. Reinsel, “The digital universe decade-are youready,” IDC iView, 2010.
[3] H. Biggar, “Experiencing data de-duplication: Improving efficien-cy and reducing capacity requirements,” The Enterprise StrategyGroup, 2007.
[4] F. Guo and P. Efstathopoulos, “Building a highperformance dedu-plication system,” in Proceedings of the 2011 USENIX conference onUSENIX annual technical conference. USENIX Association, 2011,pp. 25–25.
[5] A. Muthitacharoen, B. Chen, and D. Mazieres, “A low-bandwidthnetwork file system,” in ACM SIGOPS Operating Systems Review,vol. 35, no. 5. ACM, 2001, pp. 174–187.
[6] B. Zhu, K. Li, and R. H. Patterson, “Avoiding the disk bottleneckin the data domain deduplication file system.” in Fast, vol. 8, 2008,pp. 1–14.
[7] Y. Deng, “What is the future of disk drives, death or rebirth?”ACM Computing Surveys (CSUR), vol. 43, no. 3, p. 23, 2011.
[8] C. Wu, X. LIN, D. Yu, W. Xu, and L. Li, “End-to-end delayminimization for scientific workflows in clouds under budgetconstraint,” IEEE Transaction on Cloud Computing (TCC), vol. 3, pp.169–181, 2014.
[9] G. Linden, “Make data useful,” http://home.blarg.net/∼glinden/StanfordDataMining.2006-11-29.ppt, 2006.
[10] R. Kohavi, R. M. Henne, and D. Sommerfield, “Practical guide tocontrolled experiments on the web: listen to your customers notto the hippo,” in Proceedings of the 13th ACM SIGKDD internationalconference on Knowledge discovery and data mining. ACM, 2007, pp.959–967.
[11] J. Hamilton, “The cost of latency,” Perspectives Blog, 2009.[12] D. Bhagwat, K. Eshghi, D. D. Long, and M. Lillibridge, “Ex-
treme binning: Scalable, parallel deduplication for chunk-basedfile backup,” in Modeling, Analysis & Simulation of Computer andTelecommunication Systems, 2009. MASCOTS’09. IEEE InternationalSymposium on. IEEE, 2009, pp. 1–9.
[13] W. Xia, H. Jiang, D. Feng, and Y. Hua, “Silo: a similarity-localitybased near-exact deduplication scheme with low ram overheadand high throughput,” in Proceedings of the 2011 USENIX conferenceon USENIX annual technical conference. USENIX Association, 2011,pp. 26–28.
[14] Y. Fu, H. Jiang, and N. Xiao, “A scalable inline cluster dedupli-cation framework for big data protection,” in Middleware 2012.Springer, 2012, pp. 354–373.
[15] D. Teodosiu, N. Bjorner, Y. Gurevich, M. Manasse, and J. Porkka,“Optimizing file replication over limited bandwidth networksusing remote differential compression,” Microsoft Research TR-2006-157, 2006.
[16] Y. Zhou, Y. Deng, and J. Xie, “Leverage similarity and localityto enhance fingerprint prefetching of data deduplication,” in Pro-ceedings of The 20th IEEE International Conference on Parallel andDistributed Systems. Springer, 2014.
[17] A. Z. Broder, “On the resemblance and containment of docu-ments,” in Compression and Complexity of Sequences 1997. Proceed-ings. IEEE, 1997, pp. 21–29.
[18] G. S. Manku, A. Jain, and A. Das Sarma, “Detecting near-duplicates for web crawling,” in Proceedings of the 16th internationalconference on World Wide Web. ACM, 2007, pp. 141–150.
[19] L. Song, Y. Deng, and J. Xie, “Exploiting fingerprint prefetching toimprove the performance of data deduplication,” in Proceedings ofthe 15th IEEE International Conference on High Performance Comput-ing and Communications. IEEE, 2013.
[20] A. Z. Broder, S. C. Glassman, M. S. Manasse, and G. Zweig,“Syntactic clustering of the web,” Computer Networks and ISDNSystems, vol. 29, no. 8, pp. 1157–1166, 1997.
[21] M. S. Charikar, “Similarity estimation techniques from roundingalgorithms,” in Proceedings of the thiry-fourth annual ACM sympo-sium on Theory of computing. ACM, 2002, pp. 380–388.
[22] S. Ghemawat, H. Gobioff, and S.-T. Leung, “The google file sys-tem,” in ACM SIGOPS Operating Systems Review, vol. 37, no. 5.ACM, 2003, pp. 29–43.
[23] J. Dean and S. Ghemawat, “Mapreduce: simplified data processingon large clusters,” Communications of the ACM, vol. 51, no. 1, pp.107–113, 2008.
[24] T. Elsayed, J. Lin, and D. W. Oard, “Pairwise document similarityin large collections with mapreduce,” in Proceedings of the 46thAnnual Meeting of the Association for Computational Linguistics onHuman Language Technologies: Short Papers. Association for Com-putational Linguistics, 2008, pp. 265–268.
[25] G. Forman, K. Eshghi, and S. Chiocchetti, “Finding similar files inlarge document repositories,” in Proceedings of the eleventh ACMSIGKDD international conference on Knowledge discovery in datamining. ACM, 2005, pp. 394–400.
[26] Z. Ouyang, N. Memon, T. Suel, and D. Trendafilov, “Cluster-baseddelta compression of a collection of files,” in Web InformationSystems Engineering, 2002. WISE 2002. Proceedings of the ThirdInternational Conference on. IEEE, 2002, pp. 257–266.
[27] A. Z. Broder, M. Charikar, A. M. Frieze, and M. Mitzenmacher,“Min-wise independent permutations,” Journal of Computer andSystem Sciences, vol. 60, no. 3, pp. 630–659, 2000.
[28] B. Han and P. J. Keleher, “Implementation and performance eval-uation of fuzzy file block matching.” in USENIX Annual TechnicalConference, 2007, pp. 199–204.
[29] B. S. Baker, “On finding duplication and near-duplication in largesoftware systems,” in Reverse Engineering, 1995., Proceedings of 2ndWorking Conference on. IEEE, 1995, pp. 86–95.
[30] N. Shivakumar and H. Garcia-Molina, “Building a scalable andaccurate copy detection mechanism,” in Proceedings of the firstACM international conference on Digital libraries. ACM, 1996, pp.160–168.
[31] L. P. Cox, C. D. Murray, and B. D. Noble, “Pastiche: Makingbackup cheap and easy,” ACM SIGOPS Operating Systems Review,vol. 36, no. SI, pp. 285–298, 2002.
[32] Y. Hua, X. Liu, and D. Feng, “Data similarity-aware computationinfrastructure for the cloud,” IEEE Transactions on Computers, p. 1,2013.
[33] S. Biswas, D. Franklin, A. Savage, R. Dixon, T. Sherwood, and F. T.Chong, “Multi-execution: multicore caching for data-similar exe-cutions,” in ACM SIGARCH Computer Architecture News, vol. 37,no. 3. ACM, 2009, pp. 164–173.
[34] R. Vernica, M. J. Carey, and C. Li, “Efficient parallel set-similarityjoins using mapreduce,” in Proceedings of the 2010 ACM SIGMOD
IEEE TRANSACTIONS ON XXX, XXX, XXXX, OCTOBER 2014 14
International Conference on Management of data. ACM, 2010, pp.495–506.
[35] D. Deng, G. Li, S. Hao, J. Wang, and J. Feng, “Massjoin: Amapreduce-based method for scalable string similarity joins,” inData Engineering (ICDE), 2014 IEEE 30th International Conferenceon. IEEE, 2014, pp. 340–351.
[36] P. Indyk and R. Motwani, “Approximate nearest neighbors: to-wards removing the curse of dimensionality,” in Proceedings of thethirtieth annual ACM symposium on Theory of computing. ACM,1998, pp. 604–613.
[37] Y. Zhou, Y. Deng, X. Chen, and J. Xie, “Identifying file similarityin large data sets by modulo file length,” in Algorithms and Archi-tectures for Parallel Processing. Springer, 2014, pp. 136–149.
[38] X. Yun, G. Wu, G. Zhang, K. Li, and S. Wang, “Fastraq: A fastapproach to range-aggregate queries in big data environments,”IEEE Transactions On Cloud Computing (TCC), vol. 3, pp. 206–218,2014.
[39] F. Labs, “Tokyo cabinet,” http://fallabs.com/tokyocabinet/.[40] N. Agrawal, W. J. Bolosky, J. R. Douceur, and J. R. Lorch, “A five-
year study of file-system metadata,” ACM Transactions on Storage(TOS), vol. 3, no. 3, p. 9, 2007.
[41] D. T. Meyer and W. J. Bolosky, “A study of practical deduplica-tion,” ACM Transactions on Storage (TOS), vol. 7, no. 4, p. 14, 2012.
[42] D. R. Bobbarjung, S. Jagannathan, and C. Dubnicki, “Improvingduplicate elimination in storage systems,” ACM Transactions onStorage (TOS), vol. 2, no. 4, pp. 424–448, 2006.
[43] M. K. Buckland and F. C. Gey, “The relationship between recalland precision,” JASIS, vol. 45, no. 1, pp. 12–19, 1994.
[44] D. M. Powers, “Evaluation: from precision, recall and f-measure toroc, informedness, markedness & correlation,” Journal of MachineLearning Technologies, vol. 2, no. 1, pp. 37–63, 2011.
Yongtao Zhou is a research student at the Com-puter Science Department of Jinan University.His current research interests cover data dedu-plication, file system, key-value database, cloudstorage, Linux kernel, etc.
Yuhui Deng is a professor at the ComputerScience Department of Jinan University. Beforejoining Jinan University, Dr. Yuhui Deng workedat EMC Corporation as a senior research scien-tist from 2008 to 2009. He worked as a researchofficer at Cranfield University in the United King-dom from 2005 to 2008. He received his Ph.D.degree in computer science from Huazhong U-niversity of Science and Technology in 2004.His research interests cover green computing,cloud computing, information storage, computer
architecture, performance evaluation, etc.
Junjie Xie is a research student at the Comput-er Science Department of Jinan University. Hiscurrent research interests cover network inter-connection, data center architecture and cloudcomputing.
Laurence T. Yang received the B.E. degree incomputer science and technology from TsinghuaUniversity, China, and the Ph.D. degree in com-puter science from University of Victoria, Cana-da. He is a professor with the School of Comput-er Science and Technology, Huazhong Univer-sity of Science and Technology, China, as wellas with the Department of Computer Science,St. Francis Xavier University, Canada. His re-search interests include parallel and distributedcomputing, embedded and ubiquitous/pervasive
computing, big data. He has published more than 200 papers in vari-ous refereed journals (about 40% in IEEE/ACM Transactions/Journalsand the others mostly in Elsevier, Springer, and Wiley Journals). Hisresearch has been supported by the National Sciences and EngineeringResearch Council of Canada (NSERC) and the Canada Foundation forInnovation.