ieee transactions on software … transactions on software engineering 1 sintef, norway. e...
TRANSCRIPT

IEEE TRANSACTIONS ON SOFTWARE ENGINEERING 1
Quantifying the Effect of Code Smells on Maintenance Effort
Dag I.K. Sjøberg, Member, IEEE, Aiko Yamashita, Student Member, IEEE, Bente Anda,
Audris Mockus, Member, IEEE and Tore Dybå, Member, IEEE
Abstract—Context: Code smells are assumed to indicate bad design that leads to less maintainable code. However, this
assumption has not been investigated in controlled studies with professional software developers. Aim: This paper investigates
the relationship between code smells and maintenance effort. Method: Six developers were hired to perform three maintenance
tasks each on four functionally equivalent Java systems originally implemented by different companies. Each developer spent
three to four weeks. In total, they modified 298 Java files in the four systems. An Eclipse IDE plug-in measured the exact
amount of time a developer spent maintaining each file. Regression analysis was used to explain the effort using file properties,
including the number of smells. Results: None of the 12 investigated smells was significantly associated with increased effort
after we adjusted for file size and the number of changes; Refused Bequest was significantly associated with decreased effort.
File size and the number of changes explained almost all of the modeled variation in effort. Conclusion: The effects of the 12
smells on maintenance effort were limited. To reduce maintenance effort, a focus on reducing code size and the work practices
that limit the number of changes may be more beneficial than refactoring code smells.
Index Terms—Maintainability, object-oriented design, product metrics, code churn
—————————— ——————————
1 INTRODUCTION
major challenge in the modern information society is ensuring the maintainability of increasingly large and complex software systems. Many measures have
been proposed to predict software maintainability [37], but the empirical quantification linking maintainability and measurable attributes of software, such as code smells, remains elusive.
The concept of code smell was introduced as an indicator of problems within the design of software [16]. Detection of code smells have become an established method to indicate software design issues that may cause problems for further development and maintenance [16], [24], [31]. Consequently, the consensus is that code with smells should be refactored to prevent or reduce such problems [29]. However, refactoring entails both costs and risks. Thus, empirical evidence quantifying the relationship between code smells and software maintenance effort is needed to weigh the risks and benefits.
A recent systematic review [46] found only five studies that investigated the impact of code smells on maintenance. Most of the studies on code smells that were identified in the review focused on tools and methods used to detect such smells automatically. In this
article, we extend that review by considering a longer time span and more sources. Overall, the results from these studies are inconclusive; little evidence exists for the extent to which and under what circumstances various code smells are harmful.
Furthermore, we are unaware of any controlled in vivo studies with professional developers on the effect of code smells on maintenance effort. Therefore, we conducted a controlled study to quantify the relationship between code smells and maintenance effort in an industrial setting with professional developers. Our particular research question focused on the extent to which the following 12 code smells affect the maintenance effort: Data Class, Data Clump, ”Duplicated code in conditional branches”, Feature Envy, God Class, God Method, Interface Segregation Principle (ISP) Violation, Misplaced Class, Refused Bequest, Shotgun Surgery, “Temporary variable used for several purposes” and “Implementation used instead of interface”. These smells are described briefly in Table 9 of the Appendix. A detailed description of most of these smells can be found in [8] and [16].
This study was conducted on four different but functionally equivalent (with the same requirements specifications) web-based information systems originally implemented (primarily in Java) by different contractors [3]. A study on the maintainability of these four systems compared structural measures and expert assessments [2] before the systems became operational.
The four systems were operated in parallel once they were completed. The internal and external users were automatically assigned to one of the systems. Every time a particular user logged in, he or she was given access to the same system based on the IP address of the user's
xxxx-xxxx/0x/$xx.00 © 2012 IEEE
A
————————————————
Dag I.K. Sjøberg is with the Department of Informatics, University of Oslo, PO Box 1080 Blindern, NO-0316, Oslo, Norway. E-mail: [email protected].
Aiko Yamashita is with the Department of Informatics, University of Oslo, Norway. E-mail: [email protected].
B.C.D. Anda is with the Department of Informatics, University of Oslo, Norway. E-mail: [email protected].
A. Mockus is with Avaya Labs Research, Basking Ridge, NJ 07920. E-mail: [email protected].
Tore Dybå is with the Department of Informatics, University of Oslo and SINTEF, Norway. E-mail: [email protected].

D.I.K. SJØBERG, A. YAMASHITA, B. ANDA, A. MOCKUS, T. DYBÅ: QUANTIFYING THE EFFECT OF CODE SMELLS ON MAINTENANCE EFFORT 2
computer. However, after two years of operation, changes in the underlying platform required adaptive changes in all four systems to continue operation in the new environment. We used these adaptive maintenance tasks and a request for a new functionality as an opportunity to quantify the relationship between code smells and maintenance effort. Six developers were hired to conduct three maintenance tasks each on one system and then
repeat the same tasks on a second system. A plug-in to an Eclipse IDE measured the duration of time (effort) that a developer spent on each file. We investigated how this duration was affected by the code smells that were present in the Java files before the start of the maintenance tasks.
We also investigated the degree to which the effort was explained by file size and the number of changes
TABLE 1 STUDIES ON THE EFFECTS OF CODE SMELLS ON MAINTAINABILITY
Code Smell
Study Findings Method
Duplicated Code
1. Monden et al., 2002 [32]
The modules with duplicated code were more reliable but less maintainable than the modules without such code.
Descriptive analysis of one COBOL legacy system with 2000 modules
2. Kim et al. 2005 [22]
36 percent of the duplicated code needed to be changed consistently; the remainder of the duplicated code did not need to be changed in the same direction.
Descriptive analysis of the two medium-sized Java OSSs Carol and dnsjava
3. Lozano et al., 2008 [27]
At least 50 percent of the methods with duplicated code required more change effort (partly significant) than the methods without such code.
Nonparametric hypothesis testing of the OSSs GanttProj, jEdit, Freecol, Jboss
4. Kapser et al., 2008 [21]
Some of the duplicated code was considered beneficial. Consequently, the authors suggest that not all duplicated code requires refactoring.
Academic experts judged whether Duplicated Code was harmful in pieces of the OSSs Apache and Gnumeric
5. Jürgens et al.2009 [19]
In the Java and C# code, the inconsistently changed duplicated code contained more faults than average code. In the COBOL code, inconsistent changes did not lead to more faults.
Descriptive analysis of 3 industrial C# systems, 1 OSS Java system and 1 industrial COBOL system
6. Rahman et al. 2010 [36]
Most of the defective code was not significantly associated with duplicated code. The code that was duplicated less frequently across the system was more error-prone than the code that was duplicated more frequently.
Descriptive analysis and nonparametric hypothesis testing of code and bug tracker in the OSSs Apache httpd, Nautilus, Evolution and Gimp
God Class
7. Deligiannis et al., 2003 [10]
A design (not code) without a God Class was judged and measured to be better (in terms of time and quality) than a design for the same system with a God Class.
Observational case study with four academics as participants
8. Deligiannis et al., 2004 [11]
A design (same the design in Study 7) without a God Class had better completeness, correctness and consistency than a design with a God Class.
Controlled experiment over 1.5 hours with 22 undergraduate students as participants
9. Olbrich et al., 2009 [34]
The God Classes and classes with Shotgun Surgery were changed more frequently (indicating more maintenance effort) than the other classes. The God Classes had larger churn size, whereas the Shotgun Surgery classes had smaller churn size.
Post-development analysis of the OSSs Lucene and Xerces
10. Olbrich et al., 2010 [35]
The God Classes and Brain Classes were changed less frequently and had fewer defects (indicating less maintenance effort) than the other classes.
Nonparametric hypothesis testing of the code and bug-tracker information in the OSSs Lucene, Xerces and Log4j
God Method
11. Abbes et al., 2011 [1]
The God Classes and God Methods alone had no effect, but compared with the code without both of these smells, the code with the combination of God Class and God Method had a statistically significant increase in effort and a statistically significant decrease in the percentage of correct answers.
Experiment in which 24 students and professionals were asked questions about the code in the OSSs YAMM, JVerFileSystem, AURA, GanttProject, JFreeChart and Xerces
Feature Envy
12. D’Ambros et al., 2010 [9]
Feature Envy was not consistently correlated with defects across systems.
Nonparametric hypothesis testing of the code in the OSSs Lucene, Maven, Mina, CDT, PDE, UI, Equinox
13. Li et al., 2007 [26]
Feature Envy was not associated significantly with software faults. Analysis of the code and bug-tracker information in the OSS Eclipse
Shotgun Surgery
12. D’Ambros et al., 2010 [9]
Shotgun Surgery was not consistently correlated with defects across systems.
See above
13. Li et al., 2007 [26]
Shotgun Surgery was positively associated with software faults.
See above Data Class Data Class was not associated significantly with software faults.
Refused Bequest
Refused Bequest was not associated significantly with software faults.

D.I.K. SJØBERG, A. YAMASHITA, B. ANDA, A. MOCKUS, T. DYBÅ: QUANTIFYING THE EFFECT OF CODE SMELLS ON MAINTENANCE EFFORT 3
(revisions), which we use to operationalize task quality. Furthermore, given that the number of changes and code churn (the sum of the lines added, deleted or modified) are used as surrogates for effort in software engineering (e.g., in [9] and [10] but not in our study), we also provide correlations between effort and these surrogates.
Another study on the same maintenance tasks was earlier carried out to investigate whether commonly used maintenance metrics are consistent among themselves and the extent to which they predict maintenance effort at the entire system level [41].
The remainder of this article is organized as follows. Section 2 describes related work. Section 3 describes the design of the study. Section 4 reports the results. Section 5 interprets the results and outlines their implications for research and practice. Section 6 discusses limitations, and Section 7 concludes.
2 RELATED WORK
This section reviews previously published studies on the effect of code smells. A systematic literature review on code smells and refactoring covered papers published by IEEE and six leading software engineering journals from January 2000 to June 2009 [46]. That review found that only three empirical studies have investigated the claimed effects of code smells. Nearly half of the 39 identified papers described methods or tools used to detect code smells. One-third examined the understanding of code smells, and six papers examined the understanding of refactoring.
Given our focus on empirical studies that investigate the effect of code smells only (i.e., not refactoring), we complemented this systematic review by using the search engines ACM Digital Library and ISI Web of Knowledge in addition to IEEE Xplore. We also extended the time span by more than two years (i.e., to October 2011). Table 1 shows the studies identified in the systematic review (Studies 1, 4 and 13) and the ones resulting from our additional search (Studies 2, 3 and 5-12).
The overall findings were as follows. Four studies on Duplicated Code (Studies 1-4) found that, although some duplicated code led to more change effort and less maintainable code, much of the copied code did not affect effort. Nevertheless, Study 5 stated that, on average, the duplicated code that was inconsistently maintained led to more defects than the remaining code. However, Study 6 found no strong evidence associating duplicated code with defective code.
Studies 7 and 8 found that God Classes had negative effects, whereas Study 10 found positive effects. Study 11 studied God Classes and God Methods (denoted “Blob” and “Spaghetti code”, respectively, by the authors). This study concluded that their presence alone did not affect
comprehension but that their combination tended to increase the developers’ effort on comprehension tasks. Studies 12 and 13 found that Feature Envy was not significantly associated with defects. Study 13 found that Data Classes were not associated with significantly more faults than the other classes. Study 13 also found that Refused Bequest was not positively associated with faults. Study 12 found that Shotgun Surgery was not associated with faults, whereas Study 13 found that it was associated with faults.
Consequently, the existing studies give no clear indications about whether any of the code smells are harmful. Some studies have contradictory conclusions (e.g., Studies 7-8 vs. Study 10 on God Class and Study 12 vs. Study 13 on Shotgun Surgery), and confirmatory studies are scarce (with the exception of the results on the COBOL systems from Studies 1 and 5). A potential reason for the inconclusive results is the variation in the dependent (outcome) variables and in the level of control over the relationships among them.
Existing studies have two primary categories of dependent variables: effort (the amount of time spent to finish the tasks) and quality of the resulting product. Only Studies 7 and 11 measured effort directly; that is, the actual amount of time spent was recorded (Study 7 used video recordings, whereas Study 11 used IDE instrumentation). Studies 3, 9 and 10 purported to measure effort, but because of the lack of direct measurements, they used surrogates. Study 3 used change likelihood (the ratio between the number of revisions to the method and the number of revisions to the overall system) and change impact (the average percentage of the number of co-changed methods). Studies 9 and 10 used change frequency (in terms of the number of revisions) and change size (in terms of code churn size). These studies did not reference earlier work that had validated these measures as surrogates for effort. To help interpret the results from these earlier studies, we report the correlations between these measures and the implementation effort in our context in Section 4.3.
TABLE 2 VARIABLES INVOLVED IN THE STUDY
Type Variables
Dependent variable Effort (seconds spent maintaining a file)
Independent variable Number of smells of 12 types in the files on
which the developers worked on during the
maintenance tasks.
Control variables System, Developer, Round, File size (LOC),
Revisions (predictor of quality)
Context variables Task, Density of smells (no. of smells per
KLOC of code)
D.I.K. SJØBERG, A. YAMASHITA, B. ANDA, A. MOCKUS, T. DYBÅ: QUANTIFYING THE EFFECT OF CODE SMELLS ON MAINTENANCE EFFORT 4
The quality measures also varied substantially among the studies (see Table 1). Studies 7, 8 and 11 assessed quality in terms of correctness. Studies 7 and 8 also defined completeness and consistency as part of quality. The remaining studies measured the number of defects, faults or errors per class or line. Study 1 used the number of revisions as a dependent variable that represented quality. That study argued that a module is, on average, less maintainable the more times that the module has been revised.
Other reasons for the inconsistent results in the existing work may be the variations in the context [12] and in the rigor of the research method [23]. The context variations include the domain and size of the systems, the type and size of the tasks, the subjects conducting these tasks and the smell detection procedures. The research methods for the studies in Table 1 include two controlled experiments (Study 8 lasted one and a half hours and was conducted with students, whereas Study 11 was conducted with students and professionals who were given a few questions related to the comprehension of code; each question took 2-5 minutes to answer), one case study (Study 7), two studies that analyzed existing code in commercial systems (Studies 1 and 5) and nine studies of OSS (Studies 2-4, 6 and 9-13). To clarify some of the inconsistencies in the extant literature, we conducted the study reported in this article.
3 STUDY DESIGN
We hired six developers who performed three maintenance tasks each on two of four functionally
equivalent but independently developed Java systems. The maintenance tasks were two adaptive ones (platform adjustments) and one perfective one (functionality for tailored reports). The amount of time that each developer spent on each file was recorded automatically. We analyzed whether the number of smells in the file affected effort. Hence, the unit of analysis was the Java file. In total, 298 of the 379 distinct Java files in the four systems were modified by at least one developer during the course of the maintenance tasks. Table 2 shows the variables in the study. The remainder of this section describes the variables that we measured and analyzed, the tools that we selected for smell detection, the practical context of the study and our modeling approach.
3.1 Dependent, Independent and Control Variables
To measure the exact amount of time (effort) that a developer spent maintaining each file, we instrumented Eclipse with a plug-in called Mimec [25], which can capture various IDE events, including editing, executing, navigating, reading and searching.
Note that many factors unrelated to code smells may affect the effort to implement a modification to a file. Some systems may be more difficult to understand than others, some developers might be faster than others, and developers may be faster in the second round than in the first round. Therefore, we included System, Developer and Round as variables to control for their potential confounding effects.
Maintaining larger units of software generally requires more effort. Thus, it would not be surprising to find that a developer spends more time on larger files. Because of
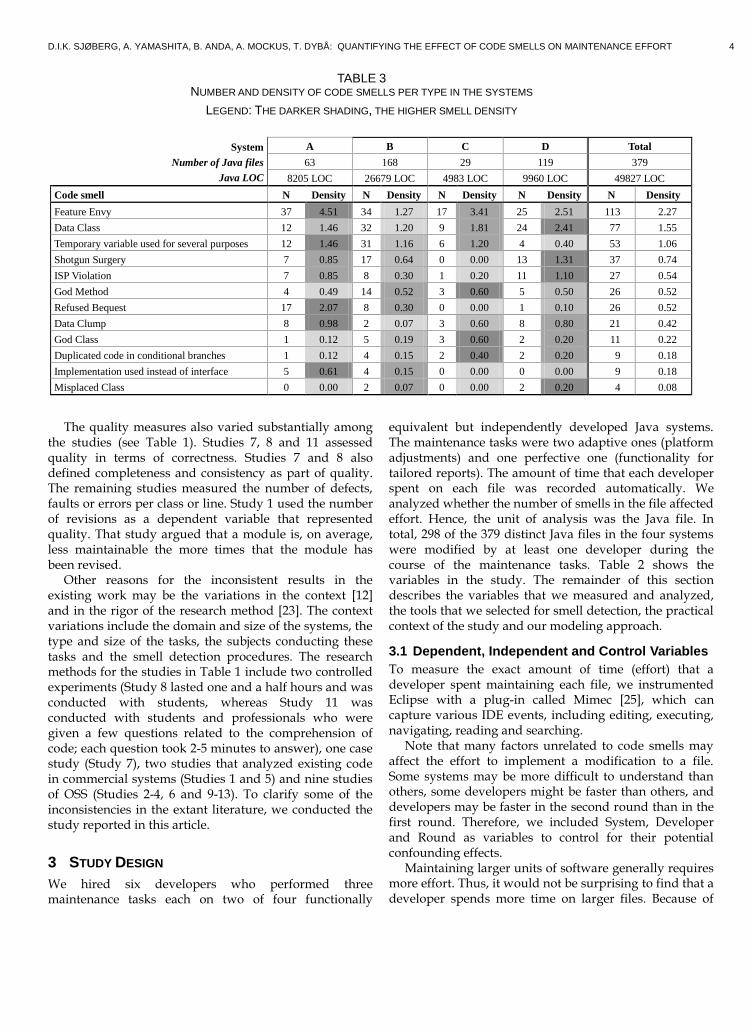
TABLE 3 NUMBER AND DENSITY OF CODE SMELLS PER TYPE IN THE SYSTEMS
LEGEND: THE DARKER SHADING, THE HIGHER SMELL DENSITY
System
Number of Java files
Java LOC
A B C D Total
63 168 29 119 379
8205 LOC 26679 LOC 4983 LOC 9960 LOC 49827 LOC
Code smell N Density N Density N Density N Density N Density
Feature Envy 37 4.51 34 1.27 17 3.41 25 2.51 113 2.27
Data Class 12 1.46 32 1.20 9 1.81 24 2.41 77 1.55
Temporary variable used for several purposes 12 1.46 31 1.16 6 1.20 4 0.40 53 1.06
Shotgun Surgery 7 0.85 17 0.64 0 0.00 13 1.31 37 0.74
ISP Violation 7 0.85 8 0.30 1 0.20 11 1.10 27 0.54
God Method 4 0.49 14 0.52 3 0.60 5 0.50 26 0.52
Refused Bequest 17 2.07 8 0.30 0 0.00 1 0.10 26 0.52
Data Clump 8 0.98 2 0.07 3 0.60 8 0.80 21 0.42
God Class 1 0.12 5 0.19 3 0.60 2 0.20 11 0.22
Duplicated code in conditional branches 1 0.12 4 0.15 2 0.40 2 0.20 9 0.18
Implementation used instead of interface 5 0.61 4 0.15 0 0.00 0 0.00 9 0.18
Misplaced Class 0 0.00 2 0.07 0 0.00 2 0.20 4 0.08

D.I.K. SJØBERG, A. YAMASHITA, B. ANDA, A. MOCKUS, T. DYBÅ: QUANTIFYING THE EFFECT OF CODE SMELLS ON MAINTENANCE EFFORT 5
the way most smells are defined, larger files are also more likely to contain (more) smells. In fact, one of the systems (System C, Table 3) had a few large files with much functionality in each file, whereas the remaining systems distributed the same functionality across many smaller files. Of course, these larger files generally had more smells than the smaller files. Files with at least one smell were, on average, twice as long as files without any smell. The Spearman correlation between file size and the 12 smells was 0.53, on average, in the four systems.
Furthermore, code smells are measures that are specific to object-oriented languages, whereas the size of a code unit can be defined more generally. Consequently, it makes little sense to consider the code smells as predictors of effort without first adjusting for a more fundamental predictor such as file size. Therefore, we included file (class) size as a control variable. A further discussion on the effect of file (class) size on code metrics can be found in [15]. Note that the notion of smell density was also introduced to adjust the number of smells with respect to code size; see Tables 2 and 3.
A particular task may be implemented with varying levels of quality, which may affect the effort it takes to complete the task. In general, an individual may sacrifice quality to complete a task sooner; that is, more time spent on a task may increase the quality of the result. However, given that the task may be implemented in different ways, less optimal implementations are more likely to be both more difficult and more fault-prone. For example, if the initial approach does not work, a developer may need to reimplement it. Reimplementation leads to more effort and leaves less time to ensure that the working implementation is thoroughly verified. (See [7] for a further discussion of the relationship between time and quality in software engineering.) Therefore, we adjusted for work quality to ensure that the impact of smells does not simply reflect variations in the quality of a developers’ work.
Perhaps the most commonly used quality attribute in software engineering is the number of defects. However, the acceptance tests showed few defects in the systems after the maintenance tasks had been performed. Therefore, it was not meaningful to use defects as a quality indicator at the file level. Instead, we used the number of changes completed in the course of the task as a quality indicator. The number of changes is typically found to be a good predictor of later defects, with more changes increasing fault-proneness [17], [33], [13]. Consequently, we also included the number of changes (revisions) performed to implement the tasks as the last control variable. The numbers were calculated using SVNKit [44], which is a Java library for obtaining information from the Subversion version control system. The developers were asked to commit at least once a day
and ensure that the revision would compile without errors before the commit.
3.2 Tools for Smell Detection
As noted above, a large fraction of research on code smells is devoted to methods and tools that detect the smells. Consequently, available tools often operationalize the same smell differently. For the smell detection in this study, we aimed to find tools that reveal how they detect the smells and, preferably, tools that implement the strategies for smell detection that are described by Marinescu and Lanza in their comprehensive work in this area [28] [24].
We found and used the tools InCode [18] and Borland Together™ [8]. The 12 smells investigated in this study were those that these tools detected in the four Java systems used in our study. InCode detects the smells Data Class, Feature Envy and God Class and found all of them in our systems.
Borland’s Together detected these smells as well (and returned results that were consistent with those of InCode) but also detected the other nine smells listed in Table 9 in the Appendix. The other smells that Together can detect but did not find in our systems were Long Message Chain, Switch Statements, “Subclasses Differ only in Methods returning Constant values" and "Subclasses have the Same Member".
InCode is provided by the company Intooitus (Marinescu is a co-founder) and can be downloaded for free. Borland’s Together license cost us 700 euros. Consequently, using the same tools in replications of our work should be straightforward.
3.3 Context
The cost of developing the four systems varied widely: €18,000, €25,000, €52,000 and €61,000 [3]. The systems also varied in size and in the number and density of smells (Table 3). Table 3 is sorted by the number of occurrences of each smell. Feature Envy is at the top with 113 occurrences and Misplaced Class is at the bottom with only four occurrences. Feature Envy and Data Class are the most common smells in all of the systems. In contrast, Refused Bequest has 17 and 8 occurrences in Systems A and B, respectively, but only one and no occurrences in Systems C and D, respectively.
Three developers from a software company in the Czech Republic and another set of three developers from a software company in Poland were hired to perform the maintenance tasks. The developers were recruited from a pool of 65 participants in an earlier study on programming skill [6], which also included maintenance tasks. Based on the results of that study, these six developers were selected because they could program reliably at medium to high levels of performance, reported high levels of motivation to participate in the

D.I.K. SJØBERG, A. YAMASHITA, B. ANDA, A. MOCKUS, T. DYBÅ: QUANTIFYING THE EFFECT OF CODE SMELLS ON MAINTENANCE EFFORT 6
study and were available to take part in new studies. In this case, the results of the former study became the pre-test measures for our study. In general, using pre-test measures to maximize interpretability of the results is recommended [20].
The developers implemented two adaptive tasks that were needed to allow the systems to become operational again. Additionally, the developers implemented a third task requested by the users. Each developer conducted the same three tasks on two different systems. There were two reasons for having the same developer maintain two systems. First, the relative impact of a system could be separated from the impact of the developer. Second, we could observe the developers’ learning process when they implemented the same tasks the second time. These two rounds also correspond to two different settings commonly found in maintenance work: maintainers who are newcomers to a system and maintainers who are already familiar with the system. We could then observe the relative impacts of developer/system/round. Although the systems were assigned randomly to each developer, the four systems had to be maintained the same number of times (two) by each developer, and all of the systems had to be maintained at least once in each round; see Table 4. Note that, although Developer 6 was allocated to System B in the second round, the developer did not manage to finish all of the tasks in the second round. Thus, the corresponding measures were excluded, resulting in a total of 11 Developer x System combinations.
One or two of the authors were physically present during the maintenance work, which lasted three to four weeks in the Czech Republic and three weeks in Poland. The second author conducted an acceptance test once all the tasks were completed for one system. The set of test cases was based on different scenarios that considered the following aspects: functionality, performance, browser compatibility and security. The following checklist was
used for each scenario to ensure correct functioning of the system: internal/external links, absence of broken links, field validation, error message for wrong input, validation of mandatory fields, database integrity, database volume robustness (e.g., large attachment files), access to functionality according to the user role and browser compatibility (Internet Explorer, Firefox and Safari).
3.4 Modeling Approach
We used a multiple linear regression model to represent the relationship between the hypothesized predictor and response (cf. the independent and dependent variables in Table 2). The control variables were added to the regression model as covariates.
Software engineering data is often highly skewed, and a few outlier observations may substantially affect the results. Our data was not an exception. Therefore, we applied the natural logarithm to the number of smells, effort, file size and the number of changes to render the data suitable for multiple regression analysis. Using the natural logarithm reduces the skew of the response and predictors (linear regression assumptions include normal distribution of the residuals). Also, the effort models are, by their nature, multiplicative (e.g., COCOMO), and the logarithmic transformation converts them into additive models suitable to be fit via linear regression. All statistical analyses were performed using R [43].
3.5 Qualitative Data
To track the progress and to record any difficulties encountered during the maintenance tasks, we conducted daily interviews (20-30 minutes) with each developer and longer interviews (60 minutes) after they had finished the tasks for one system. The developers did not recognize or formulate problems in terms of code smells, but the problems that they reported related to factors that may be associated with various smells. Note that identifying the
TABLE 4 NUMBER OF FILES AND EFFORT (HOURS)
System Round Developer
Modified files Read files Created files Total
N Effort N Effort N LOC Effort N Effort
A
1 1 28 19.2 (73%) 18 0.5 (2%) 9 588 6.6 (25%) 55 26.3
1 6 46 3.1 (21%) 4 0.6 (4%) 50 2425 10.9 (75%) 100 14.6
2 2 37 7.5 (86%) 2 0.0 (0%) 8 2080 1.1 (13%) 47 8.7
B
1 2 46 24.1 (60%) 63 6.1 (15%) 17 1947 9.8 (25%) 126 40.0
2 5 53 9.7 (58%) 42 0.5 (3%) 30 2860 6.6 (39%) 125 16.8
C
1 3 9 4.1 (38%) 9 0.1 (1%) 15 537 6.6 (61%) 33 10.8
1 5 24 8.5 (48%) 0 0 (0%) 14 829 9.3 (52%) 38 17.8
2 4 10 5.4 (92%) 6 0.0 (0%) 5 450 0.5 (8%) 21 5.9
D
1 4 26 9.5 (60%) 36 1.2 (8%) 19 1439 5.3 (33%) 81 15.9
2 1 76 15.9 (75%) 8 0.1 (0.5%) 24 1167 5.1 (24%) 108 21.1
2 3 20 7.1 (62%) 46 1.5 (13%) 22 1188 2.9 (25%) 88 11.5
Total 375 114.1 (60%) 234 10.6 (6%) 213 15510 64.6 (34%) 822 189.4

D.I.K. SJØBERG, A. YAMASHITA, B. ANDA, A. MOCKUS, T. DYBÅ: QUANTIFYING THE EFFECT OF CODE SMELLS ON MAINTENANCE EFFORT 7
effect of individual smells may be difficult because several smells are often lumped together in the same file. The analysis and discussion of the qualitative interview data is reported in another paper [45].
4 RESULTS
4.1 Distribution of Effort
During the work on the maintenance tasks, some existing files in the system were modified, and some files were only looked at. Additionally, new files were created. Table 4 shows the number of files and the amount of effort spent on the files in each of these categories. The highest effort ratio for two developers who worked on the same system in the same round was almost two; that is, one developer spent almost twice the time of another developer.
The table also reveals that the developers used different strategies with respect to the relative effort spent on the various file categories. For example, on System A in Round 1, Developer 1 spent 73 percent of the effort on
modifying the existing files, whereas Developer 6 spent 21 percent of the effort doing the same. The average percent of effort spent on modifying the existing files ranged from 21 to 76 percent. Only two developers spent more than 10 percent of their time reading the existing files without modifying them. No correlation was observed between the overall effort and the proportion of effort spent on modifying files or on creating new files. On average, the effort declined by approximately 40 percent from the first round to the second round.
Table 4 also shows that the number of created files varied from 5 to 50. The reason for this substantial variation was partly driven by the developers’ programming style. At the extreme was Developer 2, who created eight new files in System A with an average size of 260 LOC, and Developer 3, who created 15 files in System C with an average of 36 LOC.
4.2 Regression Analysis
Table 5 shows the four regression models that we fitted in this study. Model 0 tries to explain the maintenance effort based on our control variables: Developer, System and
TABLE 5 RESULTS OF REGRESSION ANALYSIS
Measure Model 0 Model 1 Model 2 Model 3
Developer (p-value for F-statistic) 1.5e-08*** 2.7e-11*** 1.7e-12*** 3.9e-17***
System (p-value for F-statistic) .0004*** 2.7e-05*** 8e-06*** 7e-08***
Round (p-value for F-statistic) .0071** .002** .0011** .00013***
File size§ NA NA .76 .12(7e-10)*** .58 .1(4e-8)***
Changes (Revisions)§ NA NA NA 2.2 .19(2e-27)***
Data Class§ NA .25 .21(.24) .21 .2(.31) .25 .17(.15)
Data Clump§ NA .2 .34(.55) .083 .32(.8) -.28 .28(.3)
Duplicated code in conditional branches§ NA .25 .4(.53) .57 .38(.14) .19 .33(.56)
Feature Envy§ NA .72 .18(7e-5)*** .37 .18(.041)* .02 .16(.9)
God Class§ NA 1.4 .44(.002)** .71 .43(.1) .57 .36(.12)
God Method§ NA .0085 .3(.98) -.18 .28(.52) -.32 .24(.18)
ISP Violation§ NA .37 .36(.3) .07 .34(.84) .0015 .29(1)
Misplaced Class§ NA -.71 .87(.42) -.46 .82(.58) -.3 .7(.67)
Refused Bequest§ NA -.76 .31(.015)* -.81 .29(.0057)** -.65 .25(.0089)**
Shotgun Surgery§ NA .66 .33(.05)* .57 .32(.074) .11 .27(.7)
Temporary variable used for several purposes§ NA .56 .28(.046)* .12 .27(.67) .012 .23(.96)
Implementation used instead of interface§ NA .71 .36(.048)* .61 .34(.072) .54 .29(.064)
Model fit (adjusted R2) .15 .36 .42 .58
Legend: “***” indicates α = .001, “**“ α = .01 and “*“ α = .05 §If applicable, for each model, estimate | stdev(significance) is shown
(+) A positive estimate indicates that more effort is required
(–) A negative estimate indicates that less effort is required

D.I.K. SJØBERG, A. YAMASHITA, B. ANDA, A. MOCKUS, T. DYBÅ: QUANTIFYING THE EFFECT OF CODE SMELLS ON MAINTENANCE EFFORT 8
Round. An adj-R2 of only 0.15 indicates that these variables do not fully explain the maintenance effort. In turn, this finding suggests that developer performance and differences among the systems and rounds were insufficient to explain the observed variations in effort. This result is not particularly surprising, because the developers were selected based on their pre-test scores, which suggests that they had relatively similar skills, and all of the systems had the same functionality. Furthermore, the model was fit at the file level, and the variations among the files may have been more important for explaining the variation in maintenance effort than the variation among the systems; that is, if the file properties are known, the additional information about the system to which the file belongs may not be important.
Model 1 introduces the effect of the various code smells (with Developer, System and Round as co-variates). The table shows that Feature Envy and, to some extent, God Class were associated with more effort. To a lesser extent, the same was also true for “Temporary variable used for several purposes”, “Implementation used instead of interface” and Shotgun Surgery. In contrast, the Refused Bequest classes indicated a small decrease in effort. Note that we essentially performed a multiple comparisons test by including all of the smells in the model. In other words, after a suitable Bonferroni correction, the predictors at the α = 0.05 level will no longer be statistically significant. Furthermore, the adj-R2 was not high at 0.36.
We included the results of Model 1 to allow for comparisons with earlier work that did not consider file size or any quality indicator as a predictor of maintenance effort. The relatively low adj-R2 of Model 1 suggests that code smells have limited impacts on maintenance effort.
Model 2 adds file size to Model 1 and improved the model fit (adj-R2 = 0.42). However, the negative effect of the smells was reduced. Feature Envy was now significant at α = 0.05, and God Class, “Temporary variable used for several purposes”, “Implementation used instead of interface” and Shotgun Surgery appeared to have no effect. However, the positive effect (decrease in effort) for classes with Refused Bequest was now significant at α = 0.01.
Model 3 adjusted for file size and the number of changes and substantially improved the fit (adj-R2 = 0.58). We were concerned that the larger files would have lower quality, which would manifest itself in a greater number of changes, but the collinearity measured via Variance Inflation Factor (VIF) was only 1.6. Only Refused Bequest was still a significant predictor of effort at α = 0.01 in Model 3. Hence, the interpretation is that if we keep file size and the number of changes constant, then only the Refused Bequest smells in the file will significantly affect the effort needed to maintain the file but in a positive
direction: effort will decrease. If we exclude the smells from Model 3, the adj-R2
remains at 0.58. This finding implies that the model fit does not increase by adding smell measures to file size and quality. In other words, code smells are not needed to explain the maintenance effort if we adjust for file size and the number of changes. If we exclude the smells and the changes from Model 3 (i.e., only file size remains), the adj-R2 becomes 0.38. This result indicates that a single predictor of file size achieves a better fit than all of the smell predictors. We argued above for including file size and the number of changes (as an indicator of quality) in the regression model, and our analysis confirmed that file size and the number of changes were both significant (α = 0.001) predictors of effort; see Models 2 and 3. Thus, code smells need to add explanatory power even after adjusting for these more fundamental parameters to be relevant. In our study, this did not happen.
The regression diagnostics did not show surprises: A QQ plot showed approximately normal residuals, the largest VIF was 2.98 for ISP Violation (well below 10, which is considered to indicate a serious collinearity issue), and the residual plot did not reveal patterns or a suggestion of a non-constant variance. The only Spearman correlations above 0.5 in Model 3 were between ISP Violation and Shotgun Surgery (0.68) and between God Method and God Class (0.64).
4.3 Churn and Revisions as Surrogates for Effort
Many studies in software engineering use code churn or revisions as surrogate measures of effort (e.g., Studies 3, 9 and 10 in Table 1). However, we found only two studies that investigated the association between effort and code churn or effort and revisions at the file (module) level. Specifically, El Emam [14] analyzed 98 corrective maintenance tasks in a 40 KSLOC systems application written in C. He found a moderate, significant correlation (Spearman's ρ = 0.36) between maintenance effort and code churn. Mockus and Votta [30] investigated 170 tasks in a very large commercial system. They found that churn (added and deleted lines), duration and type of the task were needed to explain effort with large and corrective tasks requiring more effort. Our study found a large correlation (Spearman's ρ = 0.59); see Table 6.
TABLE 6 CORRELATION EFFORT AND CHURN/REVISIONS
Files Variable by Variable ρ Prob>|ρ|
Modified Effort Code churn 0.59 <.0001*
(N=375) Effort Revisions 0.47 <.0001*
Revisions Code churn 0.65 <.0001*
New Effort Code churn 0.66 <.0001*
(N=213) Effort Revisions 0.53 <.0001*
Revisions Code churn 0.56 <.0001*
TABLE 7 LOC AND EFFORT IN THE FOUR SYSTEMS
System # Files
total
LOC
per
File
Total
LOC
Mean Total
Effort
(hours)
Effort
adj. wrt
round
A 107 149 15943 22 24
B 161 189 30429 31 39
C 58 180 10440 16 17
D.I.K. SJØBERG, A. YAMASHITA, B. ANDA, A. MOCKUS, T. DYBÅ: QUANTIFYING THE EFFECT OF CODE SMELLS ON MAINTENANCE EFFORT 9
One reason for the difference among the studies may be that the maintenance tasks were corrective in study [14], whereas they were adaptive and perfective in our study and of all types in study [30]. It may generally be the case that the number of lines changed per unit of effort is smaller for corrective maintenance tasks than for adaptive and perfective maintenance tasks [30]. For the changes in the new files, we found an even higher correlation between effort and code churn (0.66).
Based on his result, Emam stated that “analysts should be discouraged from using surrogate measures, such as code churn, unless there is evidence that they are indeed good surrogates” [14]. We agree that one should be cautious when using surrogates for effort, but given the lack of real effort data, our results indicate that code churn may be a reasonable surrogate for non-corrective maintenance effort.
5 DISCUSSION
After adjusting for file size and the number of changes, we found that among the 12 common code smells, none of them were associated with more effort. In contrast, Refused Bequest was associated with less effort. Only minor improvements in model fit were due to code smells. Just two predictors, file size and the number of changes, explained approximately twice as much of the variance in the regression models as the code smells with 12 predictors did. Therefore, if Occam’s razor approach is used (i.e., ceteris paribus, choose a simpler explanation rather than a complex one), the 12 code smells that we investigated appear to be superfluous for explaining maintenance effort. Consequently, although some code smells appear to measure aspects of “bad design“ beyond what file size and file size in combination with the number of changes can capture, our results indicate that the present focus in research and industry on “bad design” as operationalized by code smells may be misdirected.
5.1 Large Class and Long Method
Our results indicate that size is an important driver of effort. There is a medium to large, significant (p < 0.01) correlation between size (LOC) of files and effort (System A: ρ = 0.37; System B: ρ = 0.61; System C: ρ = 0.58; System D: ρ = 0.48). One might then argue that it is likely that the smells Large Class and Long Method [16] would be significantly associated with effort. We did not investigate those smells because the tools we used (InCode and Borland Together) do not support them. Instead, these tools support God Class and God Method. Conceptually, a Large Class is defined to have many instance variables and many long methods [16], whereas a God Class controls much of the processing in a system [38]. God Classes may be detected by the use of metrics
such as Weighted Method Count (WMC), Tight Class Cohesion (TCC) and Access To Foreign Data (ATFD) [24]. In practice, God Classes are often large, and The Borland Together White Sheet rephrases Marinescu’s statement that the design problem represented by God Classes “can be partially assimilated with Fowler’s Large Class bad-smell” [28].
The difference between God Method and Long Method is similar to the difference between God Class and Large Class. Long Methods have a large number of lines of code. In addition to being long, God Methods have many branches and use many attributes, parameters and local variables.
Nevertheless, we found that the aspects of God Classes unrelated to size are not associated with increased effort. Therefore, at least in our context, the corresponding size-only-defined smells Large Class and Long Methods would probably be good indicators of code that requires more effort to maintain.
5.2 Smell Addition and Removal During Maintenance Tasks
After conducting the regression analysis, we investigated whether the developers increased or reduced the number of smells while implementing their maintenance tasks. Table 8 shows the increase in percentage in LOC, the total number of smells and the four smells that were indicated with an effect (even small) in Model 3 of Table 5. A minus indicates a reduction. Note that the developers themselves initiated all refactoring during the projects and were not aware that the study was concerned with the effect of smells on maintenance effort.
A six percent reduction in the number of smells was observed. The smell that had the highest association with increased effort (Feature Envy) in Models 1 and 2 was also the smell that was subject to the most refactoring (reduced by 26 percent on average). Interestingly, there were large differences between the systems. Besides System A, the developers who modified the same system consistently increased or reduced the number of smells. For example, the total number of smells in the whole system increased from 111 to 133 (a 19 percent average increase in each file) in System C but declined from 172 to 116 (35 percent average decrease in each file) in System D. (Feature Envy increased by 21 percent in C and decreased by 94 percent in D.)
Moreover, a medium to large correlation (Spearman ρ = 0.5) was observed between the number of changes (revisions) and the increase in the total number of smells. This finding indicates that the developers who revised most often also introduced the most smells. However, there were great variations among the systems. No correlation was observed in System D between the number of revisions and increase in smells.

D.I.K. SJØBERG, A. YAMASHITA, B. ANDA, A. MOCKUS, T. DYBÅ: QUANTIFYING THE EFFECT OF CODE SMELLS ON MAINTENANCE EFFORT 10
Hence, in future work, we will explore in more detail how various smells may affect the way maintenance is conducted over time. In particular, we will investigate how the relationship between the various code smells, file size and system size affects refactoring strategies.
5.3 Implications for Research
After adjusting for size, the results of our study contrast with most of the results in other empirical studies on the effect of code smells on effort. For example, the significant effect for God Classes and the small effect for Shotgun Surgery disappeared when we adjusted for file size.
Without accounting for the size of the software unit, many studies on code smells have found that large systems, classes and methods (e.g., God Classes, Brain Classes and God Methods) are subject to more effort, changes and defects than smaller systems, classes and methods. The fact that the effort, change frequency and the number of defects measured in absolute terms (i.e., not per size unit, such as LOC and function points) are higher in larger units than in smaller ones is a trivial result. Therefore, to determine the incremental effect of a code smell (or any other code metrics), researchers should use a measure of size as a covariate [39].
Given the focus on code smells and refactoring within the context of agile methods, we call for replications of our study in other controlled industrial settings. Furthermore, given the impact of file size on maintenance effort, we also encourage research on methods, techniques and tools to reduce code size without compromising other aspects of quality (e.g., avoid reducing the size of large files by creating smaller additional files or by reducing functionality or comprehensibility).
5.4 Implications for Practice
Our analyses indicate that refactoring classes with the 12 investigated code smells is unlikely to reduce effort. Consequently, developers should not be concerned with these smells in their code for the purpose of reducing effort. Instead, effort may decrease by reducing file size (which is a basic file property that is always available) and improving work processes to reduce the number of revisions. Of course, the methods by which developers should achieve these tasks are not trivial. For example, reducing the amount of functionality in one file (for example, refactoring a God Class) will also lead to a higher number of total files or larger other files. At the system level, the increased risks caused by creating more files in a system may offset the savings achieved by reducing the size of a large file. The distribution of the same functionality over more files may also fail to reduce maintenance effort. Although large files may be eliminated, many more files will be created, with each file requiring a smaller amount of maintenance effort. These
smaller efforts may add up to a greater amount of total effort than the larger efforts needed for a few large files. Note that whether centralization or delegation is more beneficial may depend on developer skill level. In an experiment on the effect of a centralized versus delegated control style, the former was better for the junior and intermediate consultants, whereas the latter was better for the senior consultants [5].
This tradeoff can be illustrated by comparing Systems C and D. Table 7 shows that the system with the most LOC in total (System B) required the most effort, whereas the one with the fewest LOC (System C) required the least amount of effort. (Table 7 pertains to the files in all of the used languages, not only Java. The effort in the last column was adjusted to account for the fact that some systems had more second round developers than other systems. This disparity led to an imbalance in the measured effort.) Table 7 also shows that, although Systems C and D had approximately the same number of LOC in total, the files in System C were twice as large as those in System D. In this case, it seemed better to have fewer but larger files.
6 Limitations
6.1 External Effects
This study analyzed the relationship between the amount of effort spent on maintaining a file and the presence of code smells in that file. However, developers may work around smelly files; that is, instead of modifying a smelly file, developers could find it easier to duplicate code fragments of the file. If a piece of code is copied into a new file and the modified functionality is implemented there, the effort for the modification would be associated with the new file instead of the smelly one. To investigate this potential threat, we identified the code that was copied across files in the four systems by using the Simian tool [40]. We found that the probability of such copying was independent of the smell density in the file (i.e., only file size mattered). Additionally, no correlation existed between the size or number of code fragments copied from a file and the smell density of that file. Furthermore, we suspect that the developers did not work around high-smell files because the number of smells in the files
TABLE 7 LOC AND EFFORT IN THE FOUR SYSTEMS
System # Files
total
LOC
per
File
Total
LOC
Mean Total
Effort
(hours)
Effort
adj. wrt
round
A 107 149 15943 22 24
B 161 189 30429 31 39
C 58 180 10440 16 17
D 127 89 11303 19 28

D.I.K. SJØBERG, A. YAMASHITA, B. ANDA, A. MOCKUS, T. DYBÅ: QUANTIFYING THE EFFECT OF CODE SMELLS ON MAINTENANCE EFFORT 11
was mostly reduced as a result of the maintenance work; see Section 5.2.
The effect of some smells may be restricted to the particular file in which the smell occurs (e.g., God Class). Conversely, other types of smells may hinder maintenance outside of a particular file’s scope. For example, a file with Feature Envy uses more data in another file (class) than that particular file does. However, measuring the effort on a file that may be due to a smell in another file is far from trivial.
6.2 Detection of Code Smells
Operationalizing the definitions of the various code smells to render them automatically detectable is a subjective exercise. A discussion of such operationalizations is beyond the scope of this article. In this study, we utilized the tools InCode [18] and Borland Together™ [8] to compute the number of each type of smell in each Java file. These tools do not provide parameter settings by the user. Although this makes the tool developers fully in charge of the threshold values for detecting smells, the given values for detection would be consistent for all researchers who want to use the same tools (and same version) in replications of our work. Using other tools with other operationalizations of smell definitions and other strategies for smell detection might have produced different results.
6.3 Smells versus Maintained Code
We found that the effort to change code with smells was not significantly higher than the effort to change code without smells. However, an issue is whether the specific maintenance tasks required mostly changes to code without smells by chance or whether the developers chose to work around code with smells. First, we consider smells defined at the class (file) level. Our analysis includes only files on which developers spent some effort. Some of these files were modified, and some were only read. While 70 percent of the modified files had at least one smell, only 47 percent of all read but not modified files had at least one smell. The fractions were significantly different (Fisher test p-value = 0.006), which suggests that among the worked-on files, the files with smells were more likely to be modified. On average, 61 percent of the smelly files were modified during the maintenance tasks, whereas 43 percent of the non-smelly files were modified. This means that the developers did not work around smells but, in fact, were more likely to work on files with smells.
However, this analysis may be too simplistic, because files with smells were larger and larger files had more smells. Thus, we may obtain the result that files with smells were more likely to be modified but only to the extent that they were larger. The proportion of code in worked-on files that had smells was 75 percent. The
proportion of code in worked-on files that were modified was 77 percent. Consequently, if we adjust for size, the files with smells do not appear to be more (or less) likely to be modified because these two code proportions are very similar.
Our infrastructure did not allow measuring the effort of changing a single method for smells defined at the level of method, only the effort of changing the entire class (file). Consequently, it is conceivable that the changes in classes with smelly methods were concentrated on the non-smelly methods; thus, not leading to higher effort and indicating a threat to validity of the results concerning method-level smells.
Nevertheless, we believe that it is unlikely that the well-defined, comprehensive maintenance tasks systematically required less change to parts of classes containing methods without smells. Furthermore, if developers managed to perform the given tasks efficiently by avoiding code with smells, one may nevertheless argue that the smells may not be that harmful.
6.4 Long-Term Effects of Code Smells
The maintenances tasks performed in this study were the first major changes to the code base after the systems became operational. Therefore, the software had not had a chance to “decay” at the time when we investigated the effect of smells. We cannot exclude the possibility that the effect of smells may manifest itself only after multiple rounds of maintenance.
6.5 Subjects, Tasks, System and Smells
We selected developers who had relatively similar skill levels to reduce the likelihood that skill would affect the results. Still, the external validity would have been greater with a larger sample of subjects. However, almost all other studies of this kind used convenience sampling. In contrast, we sampled six developers from a pool of 65 developers based on a single criterion. We hired the selected developers for a total cost of approximately 50,000 euros. Increasing the number of subjects would have increased the costs beyond the available funds.
Similar to using professional developers, we wanted the tasks that they perform to represent “typical” tasks in the industry [4]. However, no well-defined way of identifying representative or typical tasks exists in software engineering. Additionally, no standard taxonomy for classifying task complexity is available [42]. Nevertheless, in our study, we did not need to look for (artificial) representative tasks. We used real tasks. The two adaptive tasks had to be performed to allow the systems to become operational again, and the third task was requested by users of the systems.
Furthermore, the scope of this study was real, albeit small, web-based information systems primarily

D.I.K. SJØBERG, A. YAMASHITA, B. ANDA, A. MOCKUS, T. DYBÅ: QUANTIFYING THE EFFECT OF CODE SMELLS ON MAINTENANCE EFFORT 12
implemented in Java. The 12 smells identified in these systems constitute a subset of all the smells defined in the literature. Whether the results of this study are valid for other developers, tasks (including corrective and preventive maintenance tasks) and systems with other smells must be explored in other studies.
7 CONCLUSIONS
We conducted the first empirical study on the effect of code smells on software maintenance effort in a controlled industrial setting. We used multiple linear regression analysis in which all of the smells were investigated in the same model. We found that without any adjustments, files with Feature Envy and God Class (to a lesser extent) and (to an even lesser extent) “Temporary variable used for several purposes”, “Implementation used instead of interface” and Shotgun Surgery were associated with more effort than files without these smells. The smell Refused Bequest was associated with a small reduction in effort.
However, after adjusting for file size and the number of changes (revisions) as quality predictor, we found that none of the code smells remained a significant driver of effort. In contrast, the code smell Refused Bequest contributed significantly to less effort. File size and the number of revisions were responsible for almost all of the variance explained by the model.
Given that refactoring software is a time-consuming and error-prone activity, one should investigate when refactoring is beneficial. In our study, the 12 types of code smells turned out to be harmless with respect to effort. Other types of smells and the same 12 types in other settings may still be harmful.
Overall, if more follow-up studies with professionals as subjects support our results, it may be questioned whether the present focus in research and industry on
“bad design” as operationalized by code smells is misdirected. Focusing more on code size and the work practices that limit the number of changes may prove more beneficial for reducing maintenance effort.
APPENDIX
The 12 code smells investigated in this study are explained in Table 9.
ACKNOWLEDGMENTS
The authors thank G. Bergersen for providing useful discussions and support in selecting the developers, H.C. Benestad for providing technical support during the planning stage of the study and the anonymous referees for their comments. This study was partly funded by the Research Council of Norway through the projects AGILE, grant 179851/I40, and TeamIT, grant 193236/I40.
REFERENCES
[1] M. Abbes, F. Khomh, Y-C. Gueheneuc and G. Antoniol, “An
Empirical Study of the Impact of Two Antipatterns Blob and
Spaghetti Code on Program Comprehension”, Proc. European
Conf. Softw. Maint. and Reengineering, pp. 181-190, 2011.
[2] B. Anda, “Assessing Software System Maintainability using
Structural Measures and Expert Assessments”, Proc. Int'l Conf.
Softw. Maint., pp. 204-213, 2007.
[3] B. Anda, D.I.K. Sjøberg and A. Mockus, “Variability and
Reproducibility in Software Engineering: A Study of Four
Companies that Developed the Same System”, IEEE Trans.
Softw. Eng., 35(3): pp. 407-429, 2009.
[4] E. Arisholm and D.I.K. Sjøberg, “Towards a Framework for
Empirical Assessment of Changeability Decay”, J. Syst. Softw.,
53(1): pp. 3-14, 2000.
[5] E. Arisholm and D. I. K. Sjøberg, “Evaluating the Effect of a
Delegated versus Centralized Control Style on the
Maintainability of Object-Oriented Software”, IEEE Trans.
TABLE 8 INCREASE IN LOC AND NUMBER OF SMELLS IN PERCENT BETWEEN INITIAL SYSTEM AND AFTER MAINTENANCE
System Round Developer Avg. Changes
(Revisions) per file
LOC Total #
smells
Feature
Envy
ISPV Data
Clump
God
Class
A
1 1 2.7 7 14 3 100 0 100
6 2.2 -20 -22 -34 -17 -20 0
2 2 2.3 -2 -7 -10 17 0 0
B 1 2 1.8 -2 -5 -9 13 200 0
2 5 1.6 7 -3 -20 25 100 0
C 1 3 2.1 -1 24 25 100 150 0
5 3.0 12 24 31 100 67 0
2 4 2.7 4 8 6 0 0 0
D 1 4 2.1 5 -38 -90 0 0 -100
2 1 2.0 9 -25 -95 27 -17 -100
3 1.7 2 -41 -96 0 0 -100
Total average 2.2 2 -6 -26 33 44 -18

D.I.K. SJØBERG, A. YAMASHITA, B. ANDA, A. MOCKUS, T. DYBÅ: QUANTIFYING THE EFFECT OF CODE SMELLS ON MAINTENANCE EFFORT 13
Softw. Eng., 30(8): pp. 521-534, 2004.
[6] G.R. Bergersen and J.E. Gustafsson, “Programming Skill,
Knowledge and Working Memory Among Professional
Software Developers from an Investment Theory Perspective”,
J. Individual Differences, 32(4): pp. 201-209, 2011.
[7] G.R., Bergersen, J.E. Hannay, D.I.K. Sjøberg, T. Dybå and A.
Karahasanovic, “Inferring Skill from Tests of Programming
Performance: Combining Time and Quality”, Proc. Int‘l Symp.
Emp. Softw. Eng. and Measurement, pp. 305–314, 2011.
[8] Borland Together 2008 [cited 2008 September]. Available:
http://www.borland.com/us/products/together
[9] M. D'Ambros, A. Bacchelli and M. Lanza, “On the Impact of
Design Flaws on Software Defects”, Proc. Int'l Conf. Quality
Softw., pp. 23-31, 2010.
[10] I. Deligiannis, M. Shepperd, M. Roumeliotis and I. Stamelos,
“An Empirical Investigation of an Object-Oriented Design
Heuristic for Maintainability”, J. Syst. Softw., 65(2): pp. 127-139,
2003.
[11] I. Deligiannis, I. Stamelos, L. Angelis, M. Roumeliotis and M.
Shepperd, “A Controlled Experiment Investigation of an
Object-Oriented Design Heuristic for Maintainability”, J. Syst.
Softw., 72(2): pp. 129-143, 2004.
[12] T. Dybå, D.I.K. Sjøberg and Daniela S. Cruzes, “What Works for
Whom, Where, When, and Why? On the Role of Context and
Contextualization in Empirical Software Engineering”, Proc.
Int’l Symp. on Emp. Softw. Eng. and Measurement, 2012.
[13] S. G. Eick, T. L. Graves, A. F. Karr, J. S. Marron and A. Mockus,
“Does code decay? Assessing the Evidence from Change
Management Data,” IEEE Trans. Softw. Eng., 27(7): pp. 1-12,
2001.
[14] K. El Emam, A Methodology for Validating Software Product
Metrics, Technical Report NRC 44142, Nat’l Research Council
of Canada, June 2000.
[15] K. El Emam, S. Benlarbi, N. Goel and S.N. Rai, “The
Confounding Effect of Class Size on the Validity of Object-
Oriented Metrics”, IEEE Trans. Softw. Eng., 27(7): pp. 630-650,
2001.
[16] M. Fowler, “Refactoring: Improving the Design of Existing
Code”. 1999. Addison-Wesley.
[17] T. Hall, S. Beecham, D. Bowes, D. Gray and S. Counsell, “A
Systematic Review of Fault Prediction Performance in Software
Engineering”, IEEE Trans. Softw. Eng., 2011 (preprint).
[18] Intooitus. “InCode 2.0.7”. 2009 [Cited 2010 July 5]. Available:
http://www.intooitus.com/inCode.html.
[19] E. Jürgens, F. Deissenboeck, B. Hummel and S. Wagner, “Do
Code Clones Matter?”, Proc. Int'l Conf. Softw. Eng., pp. 485-495,
2009.
[20] V.B. Kampenes, T. Dybå, J.E. Hannay and D.I.K. Sjøberg, “A
Systematic Review of Quasi-Experiments in Software
Engineering”. Inf. and Softw. Tech., 51: pp. 71-82, 2009.
TABLE 9 DESCRIPTION OF 12 CODE SMELLS PARTLY BASED ON [8] AND [16]
Code Smell Description
Data Class Classes with only data fields and/or access methods.
Data Clump Clumps of data items that are always found together within classes or between classes. It may be
better if the clump forms a new (small) class.
Duplicated code in conditional branches Conditional statements in which both branches have the same code.
Feature Envy
A method that seems more interested in the attributes of another class than in the attributes of its own
class. It may be better to move the method to the class that contains most of the attributes that the
method needs.
God Class
A God Class takes too many responsibilities relative to the classes with which it is coupled.
Centralizing the system functionality into God Classes contradicts the design principle of
decomposition.
God Method God Methods are much larger than the other methods in the same class; the functionality of the class
is centralized in God Methods.
Interface Segregation Principle (ISP) Violation
The Interface Segregation Principle states that many client-specific interfaces are better than one
general-purpose interface; that is, clients should not be forced to depend on methods that they do not
use because this dependency creates unnecessary coupling.
Misplaced Class A class is misplaced if it depends more on the classes in another package than on those in its own
package.
Refused Bequest Subclasses do not want or need everything that they inherit; the class hierarchy may be inappropriate.
Shotgun Surgery Implementing a single change in a coherent manner requires making a number of small changes to a
number of different areas in the code.
Temporary variable used for several purposes Instead of using the same temporary variable for several different purposes, developers should use
the variable for only one purpose.
Implementation used instead of interface To increase the abstraction level of the code, developers should invoke methods by using interfaces
instead of the classes implemented by these interfaces.

D.I.K. SJØBERG, A. YAMASHITA, B. ANDA, A. MOCKUS, T. DYBÅ: QUANTIFYING THE EFFECT OF CODE SMELLS ON MAINTENANCE EFFORT 14
[21] C. Kapser and M. Godfrey, ““Cloning Considered Harmful”
Considered Harmful: Patterns of Cloning in Software”,
Empirical Softw. Eng., 13(6): pp. 645-692, 2008.
[22] M. Kim, V. Sazawal, D. Notkin and G. Murphy, “An Empirical
Study of Code Clone Genealogies”, Proc. European Conf. Softw.
Eng., pp. 187-196, 2005.
[23] B.A. Kitchenham, “What's up with Software Metrics? – A
Preliminary Mapping Study”, J. Syst. and Softw. 83(1): pp. 37-51.
2010.
[24] M. Lanza and R. Marinescu, “Object-Oriented Metrics in
Practice: Using Software Metrics to Characterize, Evaluate and
Improve the Design of Object-Oriented Systems”. Springer
2006.
[25] L.M. Layman, L.A. Williams and R.S. Amant, “MimEc:
Intelligent User Notification of Faults in the Eclipse IDE”, Proc.
Int'l Ws. Cooperative and Human Aspects of Softw. Eng., pp. 73-76,
2008.
[26] W. Li and R. Shatnawi, “An Empirical Study of the Bad Smells
and Class Error Probability in the Post-Release Object-Oriented
System Evolution”, J. Syst. Softw., 80(7): pp. 1120-1128, 2007.
[27] A. Lozano and M. Wermelinger, “Assessing the Effect of Clones
of Changeability”, Proc. Int'l Conf. Softw. Maint., pp. 227-236,
2008.
[28] R. Marinescu, “Measurement and Quality in Object-Oriented
Design”, Ph.D. dissertation, Politehnica University of Timisoara,
June 2002.
[29] T. Mens and T. Tourwé, “A Survey of Software Refactoring”,
IEEE Trans. Softw. Eng., 30(2): pp. 126-139, 2004.
[30] A. Mockus and L.G. Votta. “Identifying Reasons for Software
Change using Historic Databases”, Proc. Int’l Conf. on Softw.
Maint., pp. 120–130, 2000.
[31] N. Moha, Y-G. Gueheneuc, L. Duchien and A-F. Le Meur,
“DECOR: A Method for the Specification and Detection of
Code and Design Smells”, IEEE Trans. Softw. Eng., 36(1): pp. 20-
36, 2010.
[32] A. Monden, D. Nakae, T. Kamiya, S. Sato and K. Matsumoto,
“Software Quality Analysis by Code Clones in Industrial
Legacy Software”, Proc. Int'l Symp. Softw. Metrics, pp. 87-94,
2002.
[33] N. Nagappan and T. Ball, “Using Software Dependencies and
Churn Metrics to Predict Field Failures: An Empirical Case
Study”, Proc. Int'l Symp. Emp. Softw. Eng. and Measurement, pp.
364-373, 2007.
[34] S. Olbrich, D.S. Cruzes, V. Basili and N. Zazworka, “The
Evolution and Impact of Code Smells: A Case Study of two
Open Source Systems”, Proc. Int'l Symp. Emp. Softw. Eng. and
Measurement, pp. 390-400, 2009.
[35] S. Olbrich, D.S. Cruzes and D.I.K. Sjøberg, “Are all Code Smells
Harmful? A Study of God Classes and Brain Classes in the
Evolution of three Open Source Systems”, Proc. Int'l Conf. Softw.
Maint., pp. 1-10, 2010.
[36] F. Rahman, C. Bird and P. Devanbu. “Clones: What is that
Smell?”, Proc. 7th IEEE Working Conf. on Mining Softw.
Repositories, pp. 72-81, 2010.
[37] M. Riaz, M. Mendes and E.D. Tempero. “A Systematic Review
of Software Maintainability Prediction and Metrics,” Proc 3rd
Int'l Symp. Emp. Softw. Eng. and Measurement, pp. 367-377, 2009.
[38] A. J. Riel, Object-Oriented Design Heuristics. Addison-Wesley,
1996.
[39] J. Rosenberg, “Some Misconceptions About Lines of Code”,
Proc. Int'l Symp. Softw. Metrics, pp. 137-142, 1997.
[40] “Simian”. [ 2012 January 5]. Available:
http://www.harukizaemon.com/simian/index.html
[41] D.I.K. Sjøberg, B. Anda and A. Mockus, “Questioning Software
Maintenance Metrics: A Comparative Case Study”, Proc. Int’l
Symp. on Emp. Softw. Eng. and Measurement, pp. 107-110, 2012.
[42] D.I.K. Sjøberg, T. Dybå and M. Jørgensen, “The Future of
Empirical Methods in Software Engineering Research”, Proc.
Future of Software Engineering, pp. 358-378, 2007.
[43] The-R-Foundation. “The R Project for Statistical Computing”.
2011 [Cited 2011 August, 29]. Available: http://www.r-
project.org/index.html.
[44] TMate-Sofware. “SVNKit - Subversioning for Java”. 2010 [Cited
June 2010]; Available from: http://svnkit.com/.
[45] A. Yamashita and L. Moonen. “Do Code Smells Reflect
Important Maintainability Aspects?”, Proc. Int’l Conf. on Softw.
Maint. pp. 306-315, 2012.
[46] M. Zhang, T. Hall and N. Baddoo, “Code Bad Smells: A Review
of Current Knowledge”, J. Softw. Maint. 23(3): pp. 179–202,
2011.

D.I.K. SJØBERG, A. YAMASHITA, B. ANDA, A. MOCKUS, T. DYBÅ: QUANTIFYING THE EFFECT OF CODE SMELLS ON MAINTENANCE EFFORT 15
Dag Sjøberg received the MSc degree in computer science from the University of Oslo in 1987 and the PhD degree in computing science from the University of Glasgow in 1993. He has five years of industry experience as a consultant and group leader. He is professor of software engineering in the Department of Informatics, University of Oslo. In 2001 he
founded the Software Engineering Department at Simula Research Laboratory and was its leader until 2008, when it was number 1 in a ranking by the Journal of Systems and Software. He was on the editorial board of Empirical Software Engineering from 2002 to 2009. Since 2010, he has been on the editorial board IEEE Transactions on Software Engineering. Among his research interests are agile and lean processes, software quality and empirical research methods.
Aiko Yamashita received the MSc degree from University of Gothenburg in 2007 and the PhD degree from the Department of Informatics, University of Oslo in 2012. She has worked five years as a software engineer and consultant in Costa Rica, USA, Sweden and Norway within diverse organizations. Her research interests include
empirical software engineering, software quality, psychology of programming, HCI and agile methods. She is an IEEE Student Member.
Bente Anda received her MSc in 1991 and her PhD in 2003, both from the Department of Informatics, University of Oslo. From 2002 to 2008 she worked as research scientist at Simula Research Laboratory, Norway. She also has several years industry experience as consultant. Currently she works as senior advisor at the Norwegian Tax Administration and as adjunct professor in the
Department of Informatics, University of Oslo. Her
research interests include empirical software engineering, requirements engineering, effort estimation, software quality and software process improvement
Audris Mockus studies software developers' culture and behavior through the recovery, documentation, and analysis of digital remains. These digital traces reflect projections of collective and individual activity. He reconstructs the reality from these projections by designing data mining methods to
summarize and augment these digital traces, interactive visualization techniques to inspect, present, and control the behavior of teams and individuals, and statistical models and optimization techniques to understand the nature of individual and collective behavior. Audris Mockus received B.S. and M.S. in Applied Mathematics from Moscow Institute of Physics and Technology in 1988. In 1991 he received M.S. and in 1994 he received Ph.D. in Statistics from Carnegie Mellon University. He works at Avaya Labs Research. Previously he worked at Software Production Research Department of Bell Labs.
Tore Dybå received the Msc degree in electrical engineering and computer science from the Norwegian Institute of Technology in 1986 and the Dr. Ing. degree in computer and information science from the Norwegian University of Science and Technology in 2001. He is Chief Scientist at SINTEF ICT and Professor at the University
of Oslo. He has eight years of industry experience from Norway and Saudi Arabia. His research interests include evidence-based software engineering, software process improvement, and agile software development. Dr. Dybå is the author and coauthor of more than 100 refereed publications appearing in international journals, books, and conference proceedings. He is associate editor-in-chief of IEEE Software and member of the editorial boards of Empirical Software Engineering and Information and Software Technology. He is a member of the IEEE and IEEE Computer Society.