ieee sensors journal · 10/21/2014 7 source-normalised impact per paper (snip) by the centre for...
TRANSCRIPT
IEEE Sensors Journal Editor-in-Chief Report
Krikor B Ozanyan
IEEE Sensors Council AdCom Meeting
1 November 2014

Outline
5 years’ review of IEEE SJ
Impact factor update
Analyses of Editorial activity – YTD
IEEE Sensors J Editorial Board meeting –
Monday 3 Nov 15:00 Room 9
10/21/2014
2

5 years’ review of IEEE Sensors J - February 2014 Comments and recommendations by PRAC
“…
This journal appears to be well-run in terms of intellectual content, timeliness and management. The volunteers are dedicated to producing a very top notch publication.
Consider recruiting editors from industry in order to broaden participation beyond academia.
Very good broad geographical distribution of AEs.
Immediate rejects: at least two other people examine and agree, pass the reasons for rejection to the author.
Consider splitting into SENSORS A, SENSORS B, … Journal to publish more without sacrifice in quality.
…“
Next review - in 2019
10/21/2014
3
10/21/2014
4
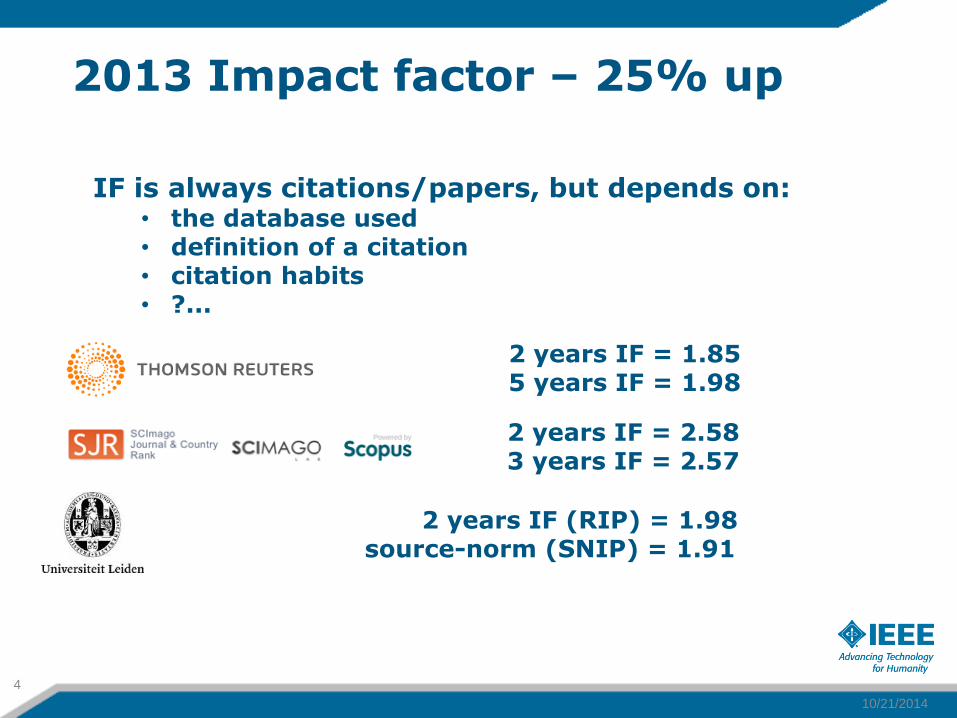
2013 Impact factor – 25% up
2 years IF = 1.85 5 years IF = 1.98
2 years IF = 2.58 3 years IF = 2.57
2 years IF (RIP) = 1.98 source-norm (SNIP) = 1.91
IF is always citations/papers, but depends on: • the database used • definition of a citation • citation habits • ?...

10/21/2014
5
IEEE Sensors J 2013 IF: Th-R
Th-R Journal categories: • Engineering, electrical & electronic 71/247 • Instruments & Instrumentation 13/57 • Physics, applied 48/136
Journal ‘relatedness’ SJ to j j to SJ
SENSOR MATER 9.8 25.7 15.9
SENSOR REV 10.33 16.36 6.03
J MICRO-NANOLITH MEM 2.52 8.32 5.8
MICROSYST TECHNOL 3.98 9.18 5.2
FLOW MEAS INSTRUM 3.48 8.29 4.81
IEEE INSTRU MEAS MAG 14.7 19.43 4.73
ANALOG INTEGR CIRC S 1.54 6.12 4.58
OPT FIBER TECHNOL 6.63 10.9 4.27
INT J DISTRIB SENS N 0.56 4.49 3.93
SMART STRUCT SYST 3.59 7.37 3.78
CHIN OPT LETT 1.16 4.62 3.46
SENSORS-BASEL 7.27 10.66 3.39
SENSOR LETT 4.54 7.8 3.26
Journal ‘relatedness’ SJ to j j to SJ
IEEE T ANTENN PROPAG 3.77 0.61 -3.16
IEEE T SYST MAN CY-S 4.28 0.95 -3.33
IEEE T CIRCUITS-I 7.15 3.16 -3.99
IEEE T VEH TECHNOL 4.82 0.81 -4.01
IEEE COMMUN SURV TUT 4.69 0.49 -4.2
IEEE PHOTONIC TECH L 10.72 6.19 -4.53
IEEE J SEL TOP QUANT 5.38 0.8 -4.58
IEEE J SEL AREA COMM 5.2 0.53 -4.67
IEEE T NANOTECHNOL 6.22 1.45 -4.77
IEEE T POWER DELIVER 5.85 0.72 -5.13
IEEE T WIREL COMMUN 6.3 0.6 -5.7
IEEE T CONSUM ELECTR 9.64 3.53 -6.11
IEEE T ELECTRON DEV 9.2 2.33 -6.87
IEEE T MICROW THEORY 10.39 3.34 -7.05
IEEE T ULTRASON FERR 11.67 3.48 -8.19
IEEE T AERO ELEC SYS 12.03 3.8 -8.23
IEEE T BIO-MED ENG 12.13 2.1 -10.03
IEEE T PATTERN ANAL 10.57 0.32 -10.25
IEEE T SIGNAL PROCES 11.91 0.47 -11.44
IEEE T INSTRUM MEAS 27.99 11.32 -16.67
IEEE J QUANTUM ELECT 19.49 1.35 -18.14
IEEE J SOLID-ST CIRC 27 2.44 -24.56
IEEE T ROBOT 33.98 2.51 -31.47
P IEEE 38.47 0.63 -37.84
Th-R ‘Journal relatedness’ allows to capture citations asymmetry between journals Most of the IEEE Trans cite us less than we cite them!
10/21/2014
6
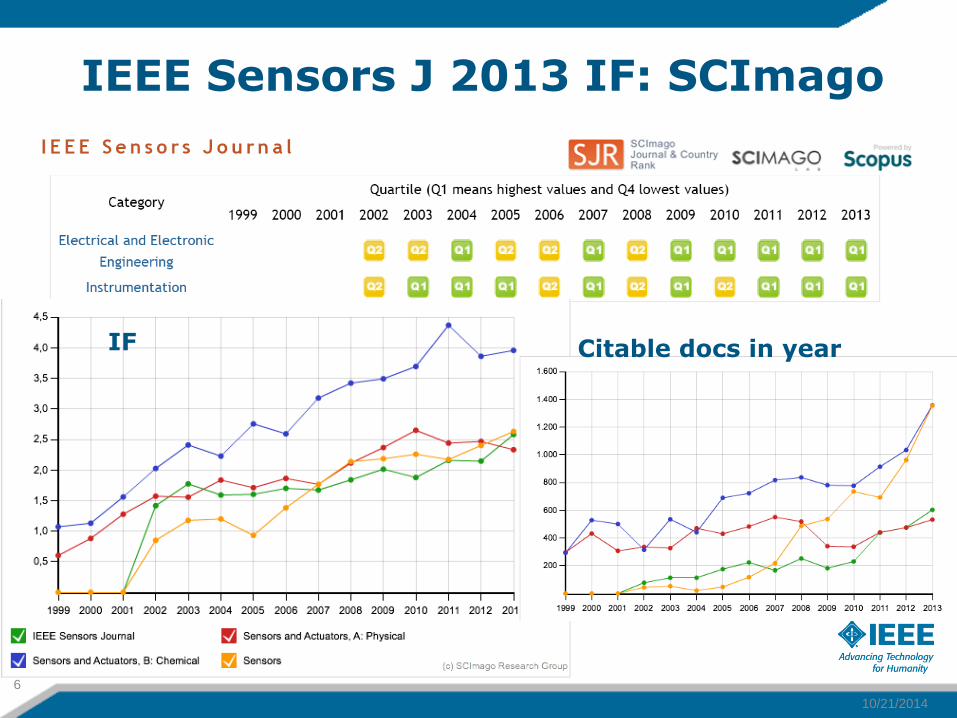
IF Citable docs in year
IEEE Sensors J 2013 IF: SCImago
10/21/2014
7
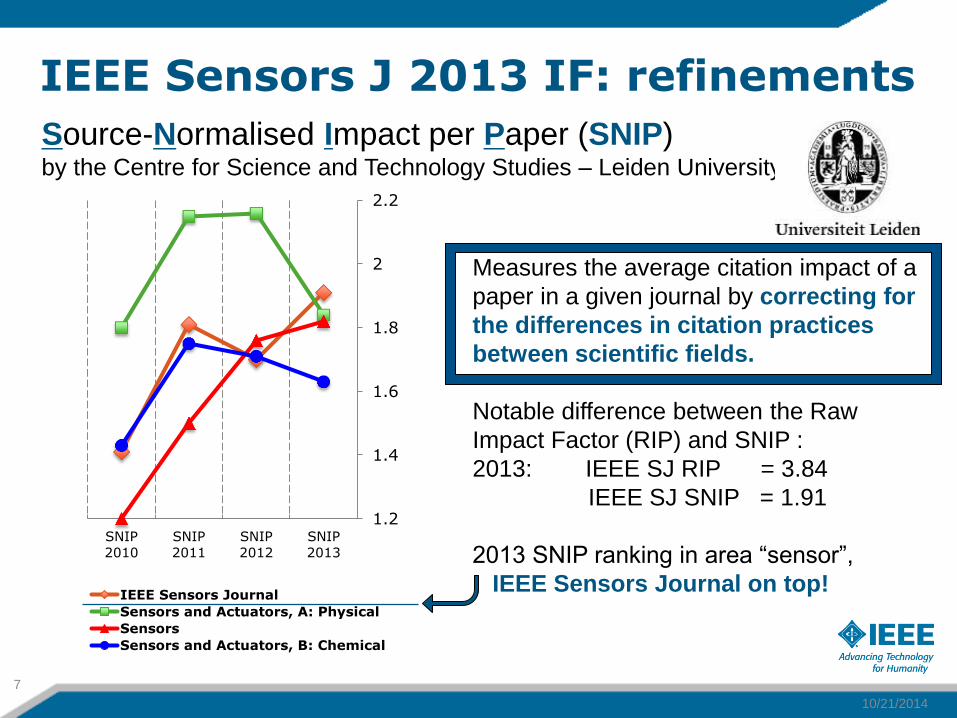
Source-Normalised Impact per Paper (SNIP) by the Centre for Science and Technology Studies – Leiden University
Measures the average citation impact of a
paper in a given journal by correcting for
the differences in citation practices
between scientific fields.
Notable difference between the Raw
Impact Factor (RIP) and SNIP :
2013: IEEE SJ RIP = 3.84
IEEE SJ SNIP = 1.91
2013 SNIP ranking in area “sensor”,
IEEE Sensors Journal on top!
1.2
1.4
1.6
1.8
2
2.2
SNIP
2013
SNIP
2012
SNIP
2011
SNIP
2010
IEEE Sensors Journal
Sensors and Actuators, A: Physical
Sensors
Sensors and Actuators, B: Chemical
IEEE Sensors J 2013 IF: refinements
10/21/2014
8
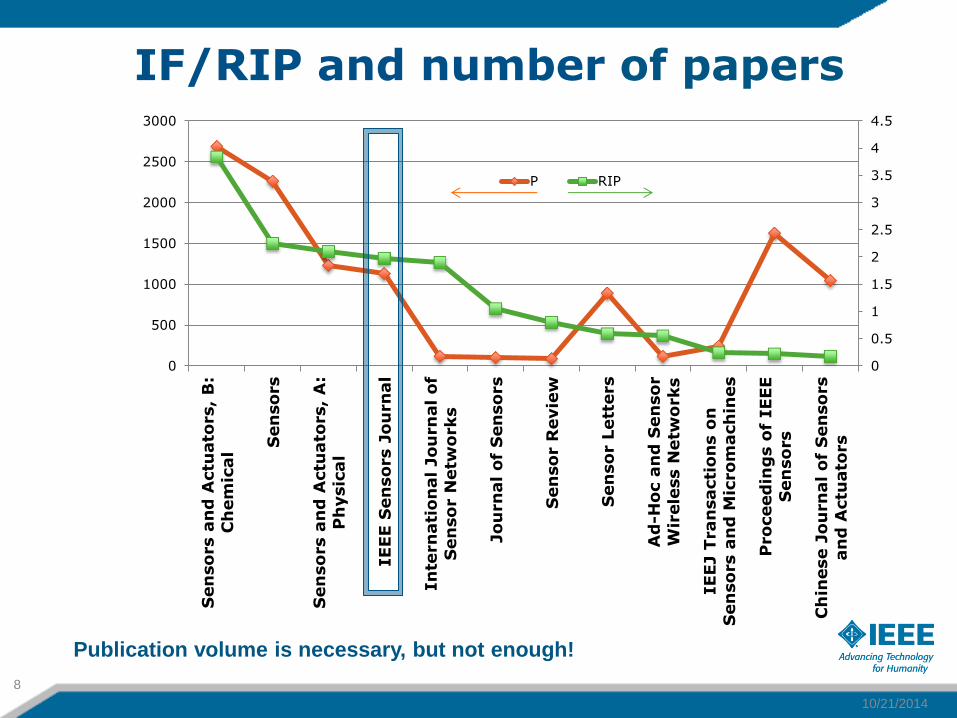
IF/RIP and number of papers
0
0.5
1
1.5
2
2.5
3
3.5
4
4.5
0
500
1000
1500
2000
2500
3000
Sen
so
rs a
nd
Actu
ato
rs,
B:
Ch
em
ical
Sen
so
rs
Sen
so
rs a
nd
Actu
ato
rs,
A:
Ph
ysic
al
IEEE S
en
sors J
ou
rn
al
In
tern
ati
on
al Jou
rn
al
of
Sen
so
r N
etw
orks
Jou
rn
al
of
Sen
sors
Sen
so
r R
evie
w
Sen
so
r L
ett
ers
Ad
-Ho
c a
nd
Sen
so
r
Wir
ele
ss N
etw
orks
IEEJ T
ran
sacti
on
s o
n
Sen
so
rs a
nd
Mic
rom
ach
ines
Pro
ceed
ing
s o
f IEEE
Sen
so
rs
Ch
inese J
ou
rn
al o
f S
en
so
rs
an
d A
ctu
ato
rs
P RIP
Publication volume is necessary, but not enough!

10/21/2014
9
2013 IF change from 2012 [%]
IF ranking among IEEE
SJ bibliometrics: is IF inflating?
Publication power (papers * ‘quality’= citations) - position is not changed, suggesting that what matters
is the absolute number of citations!

IF conclusions – where are we?
10/21/2014
10
The IF rise is genuine and we have moved up ‘above inflation’.
The IF rise is sustainable, as it correlates with our increased volume and short decision time.
Still about 50 IEEE Js with higher IF; citations asymmetry with them is not in our favour.
Looking for ways to understand better how interdisciplinarity affects our IF position.

Analyses of Editorial activity
Submission numbers and distribution
Editorial flow schedule
Editorial load and AE/TE performance
Assess the relative value of Special Issue vs Regular Papers
10/21/2014
11

Topical teams – Topical Editors, core and pool AEs
10/21/2014
12
Current EB structure

Editorial performance - yearly manuscript flux
Total number of submitted manuscripts: 2457
Of these: 1946 were original (first time) submissions
508 were revisions
Acceptance rate: 22%
Acceptance rate with revisions ignored: 28%
Sub-to-first decision time: 58 days
With 52 AEs (47 M/S.year-1.AE-1) the editorial load is:
– 4.2 new M/S are received by an average AE each month
– 8 M/S are with an average AE at any time
10/21/2014
13

Editorial load by Topical Area
The spread of the load is not strictly even, but still in balance
Deviations can be compensated by topical team size
10/21/2014
14
288
207
338
245
302
293
183 Carrara
Kim
Etienne-Cummings
Chao
Matias
Mukhopadhyay
Vellekoop
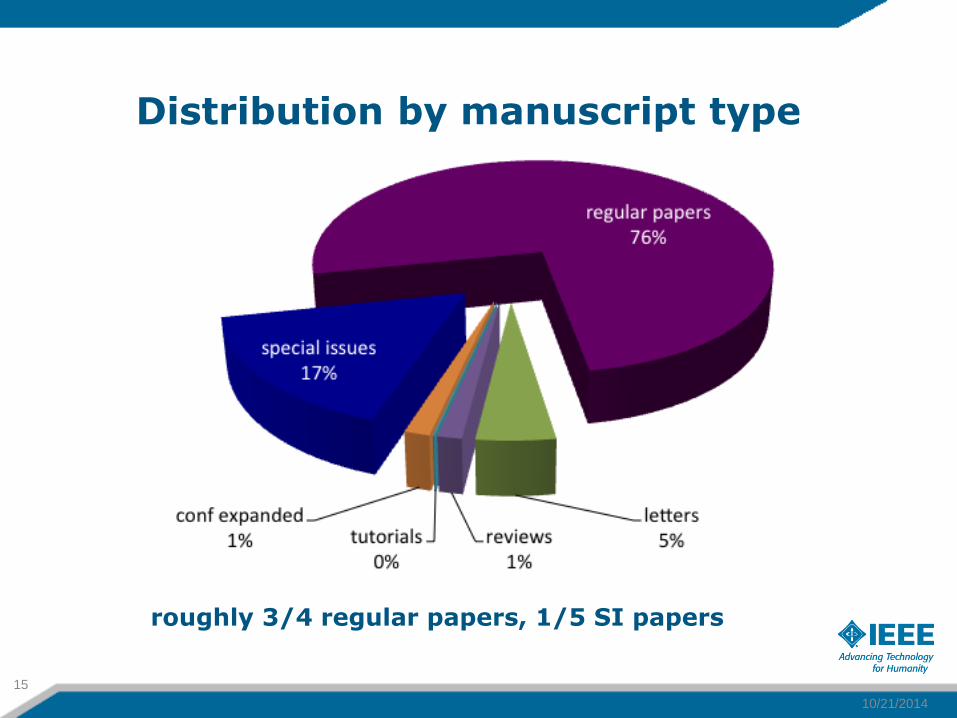
Distribution by manuscript type
10/21/2014
15
roughly 3/4 regular papers, 1/5 SI papers
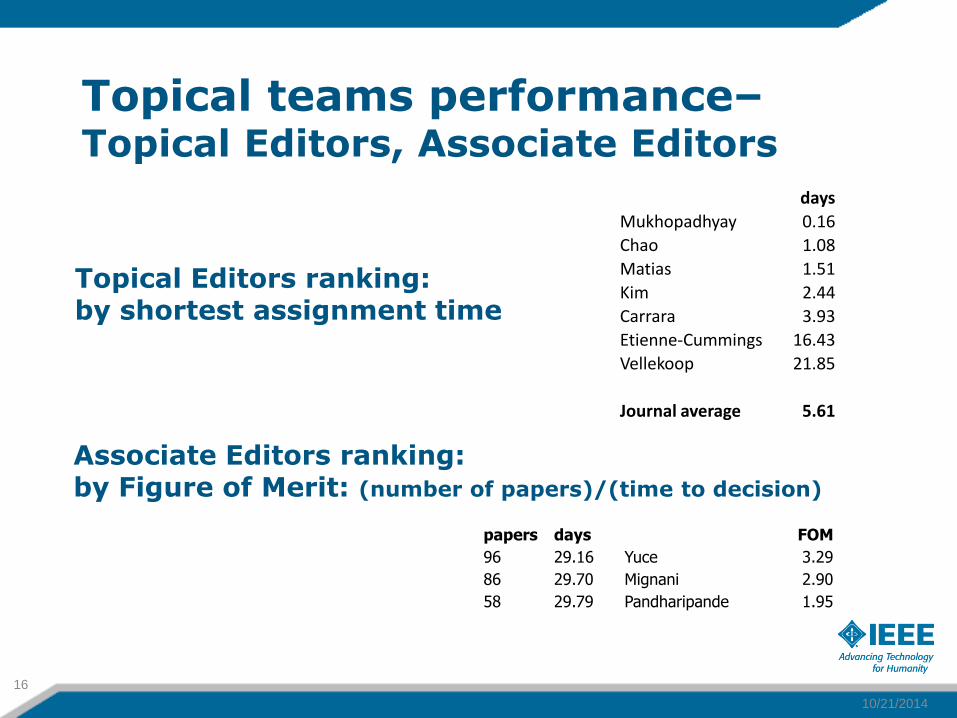
Topical teams performance– Topical Editors, Associate Editors
10/21/2014
16
days
Mukhopadhyay 0.16
Chao 1.08
Matias 1.51
Kim 2.44
Carrara 3.93
Etienne-Cummings 16.43
Vellekoop 21.85
Journal average 5.61
papers days FOM
96 29.16 Yuce 3.29
86 29.70 Mignani 2.90
58 29.79 Pandharipande 1.95
Topical Editors ranking: by shortest assignment time
Associate Editors ranking: by Figure of Merit: (number of papers)/(time to decision)
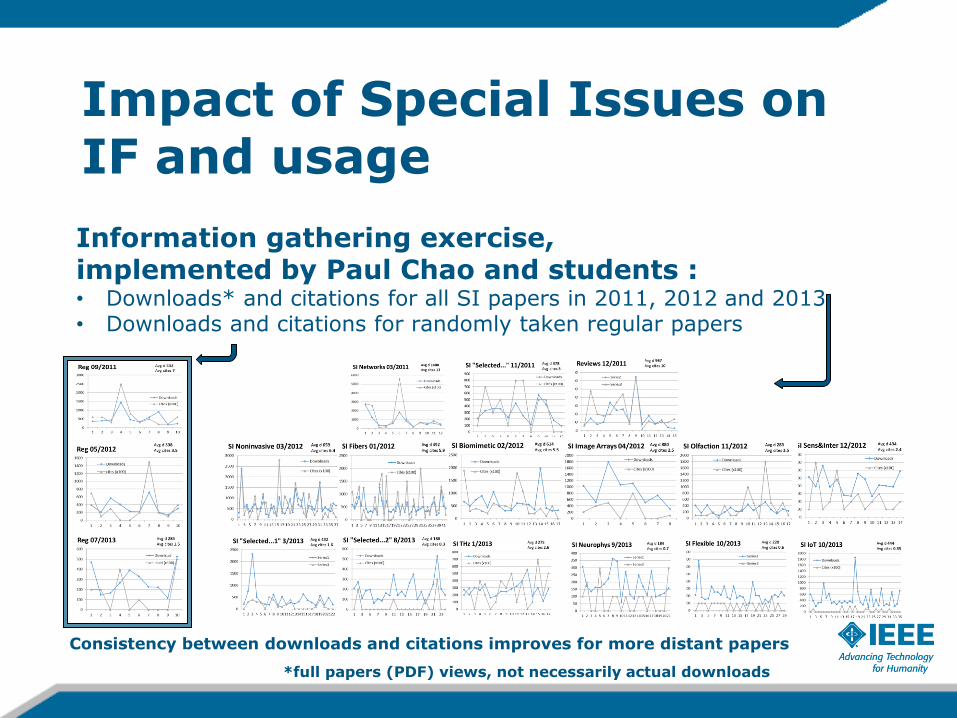
Impact of Special Issues on IF and usage
Information gathering exercise, implemented by Paul Chao and students : • Downloads* and citations for all SI papers in 2011, 2012 and 2013 • Downloads and citations for randomly taken regular papers
Consistency between downloads and citations improves for more distant papers
*full papers (PDF) views, not necessarily actual downloads

Impact of Special Issues on IF and usage
Data: SI 2011 Reg2011 SI 2012 Reg2012 SI 2013 Reg2013
Downloads 933 532 544 338 300 285
Citations 9.3 6.6 5.1 3.5 0.9 1.4
Clear benefit of SIs in terms of usage and citation numbers, increasing for earlier years (but probably saturates at half-life)
If we “pick-and-choose” Special Issues, w what could have been* our 2013 IF=1.85 ?
• Without any SIs -IF=1.73 • Without the ‘Selected…2010’ -IF=1.88 • Without the better-performing SIs -IF=1.42 • Without the the worse-performing SIs -IF=1.86
*substantial dependence on citation models to get year distribution of total cites to date