ieee presentation november 2012 - engineers australia
TRANSCRIPT

© NBN Co Limited 20121
DisclaimerThis document sets out NBN Co’s proposals in respect of certain aspects of the National Broadband Network. The contents of this document represent NBN Co’s current position on the subject matter of this document. The contents of this document should not be relied upon by our stakeholders (or any other person) as representing NBN Co’s final position on the subject matter of this document, except where stated otherwise. NBN Co’s position on the
subject matter of this document may also be impacted by legislative and regulatory developments in respect of the National Broadband Network. All prices shown in this document are exclusive of any GST. © NBN Co Limited 2011
IEEE Presentation November 2012
Peter FERRIS EGM, Planning & Design

© NBN Co Limited 20122
What’s there to talk about regarding Network Planning
and Design?
What do we build?
Where do we build?
When do we build?
© NBN Co Limited 20123
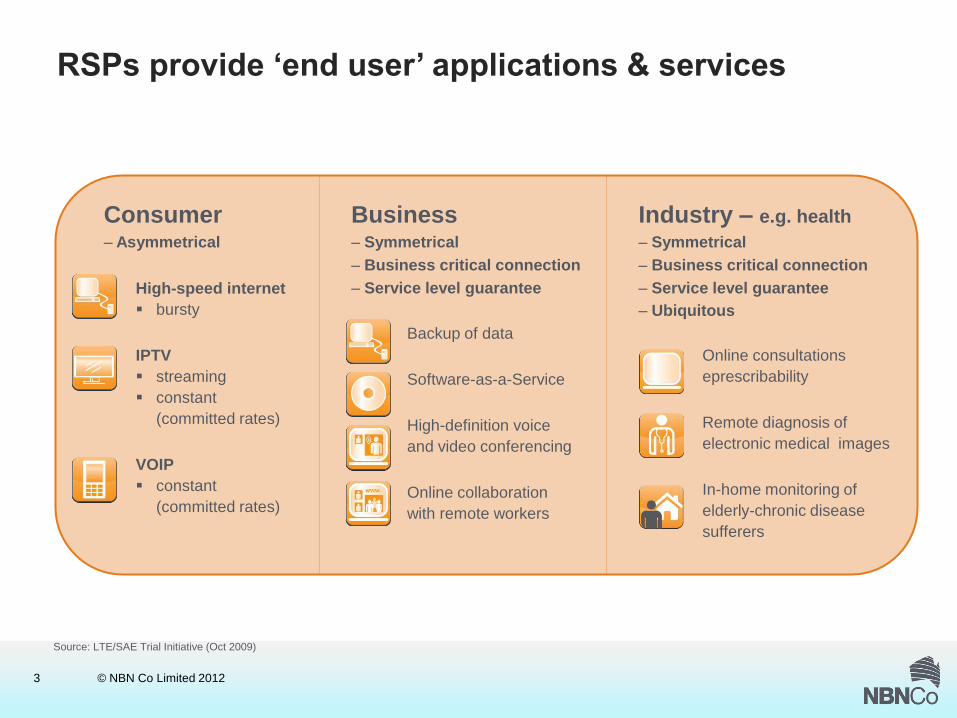
RSPs provide ‘end user’ applications & services
Source: LTE/SAE Trial Initiative (Oct 2009)
Consumer– Asymmetrical
Business– Symmetrical– Business critical connection– Service level guarantee
Industry – e.g. health– Symmetrical– Business critical connection– Service level guarantee– Ubiquitous
High-speed internet bursty
IPTV streaming constant
(committed rates)
VOIP constant
(committed rates)
Backup of data
Software-as-a-Service
High-definition voice and video conferencing
Online collaboration with remote workers
Online consultations eprescribability
Remote diagnosis of electronic medical images
In-home monitoring of elderly-chronic disease sufferers
© NBN Co Limited 20124
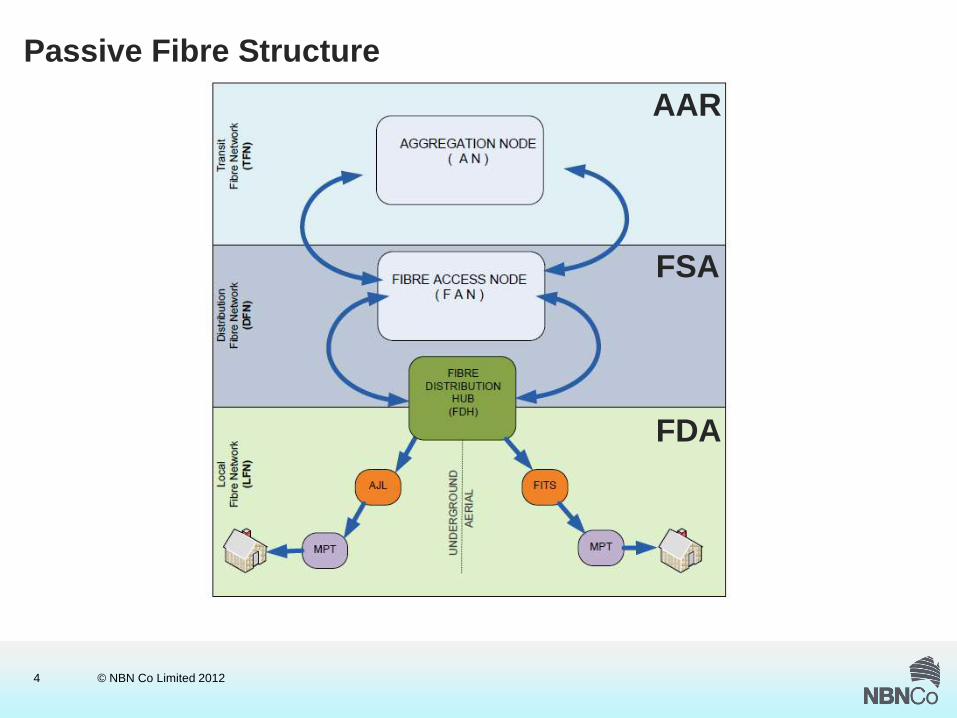
Passive Fibre Structure
AAR
FSA
FDA
© NBN Co Limited 20125
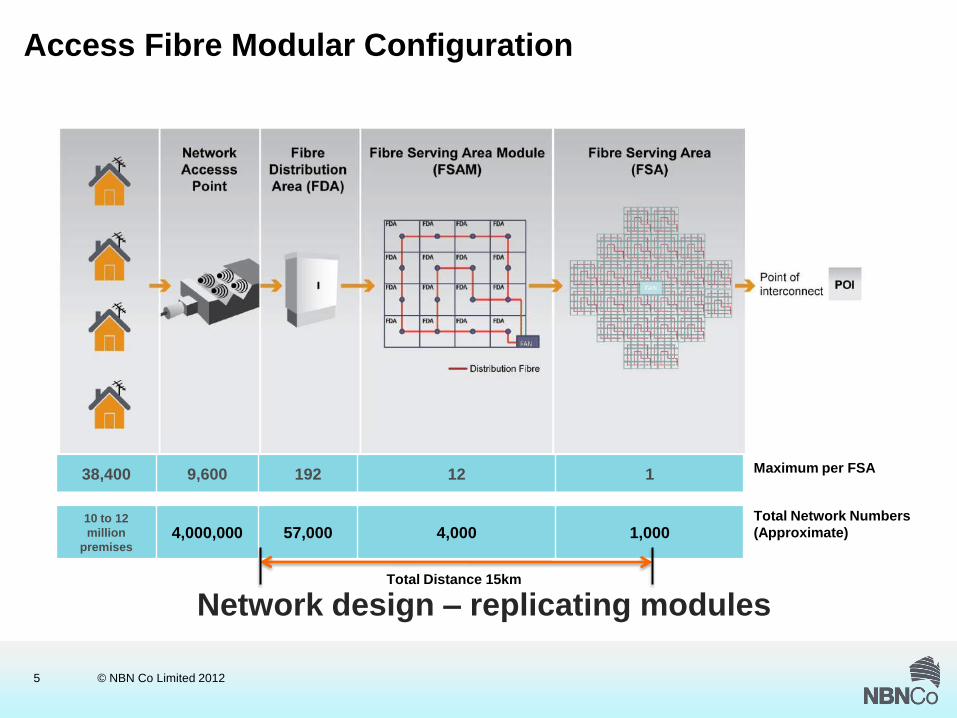
38,400 9,600 192 12 1
10 to 12 million
premises4,000,000 57,000 4,000 1,000
Total Distance 15km
Maximum per FSA
Total Network Numbers (Approximate)
Network design – replicating modules
Access Fibre Modular Configuration

© NBN Co Limited 20126
Fibre Structure—Underground
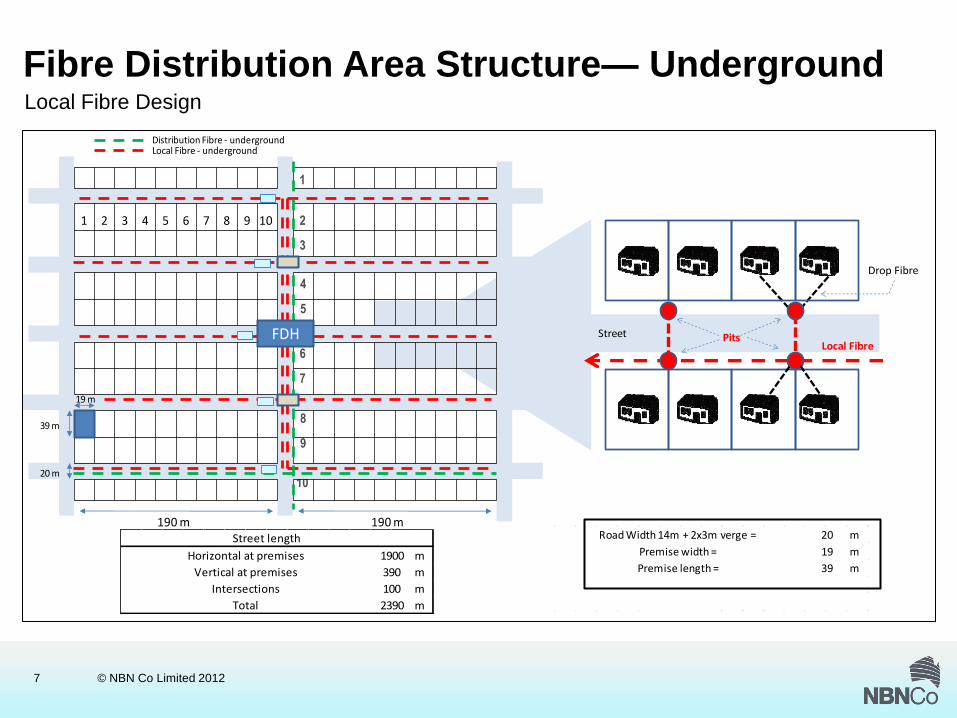
The configuration for underground local fibre is shown below, where the local access joint is used to provide the multiport tethers from a central pit, feeding pits located at the property boundary and multiport terminals utilised to provide the ‘plug and play’
connections .
Local Fibre Allocation
2 fibres allocated per
address
1 tube (12 fibres) allocated to
each multiport
2 2
2 2
8 fibres allocated per NAP for
addresses, 4 spare
12
FDH
© NBN Co Limited 20127
Fibre Distribution Area Structure— UndergroundLocal Fibre Design
1
2
3
4
5
6
7
8
9
10
m
m
m
m
1900
390
100
2390
Street length
Horizontal at premises
Vertical at premises
Intersections
Total
m
m
mPremise length = 39
Road Width 14m + 2x3m verge = 20
Premise width = 19
Local Fibre
Drop Fibre
PitsStreet
39 m
190 m
1 42 53 6 87 9 10
190 m
19 m
FDH
20 m
Local Fibre - undergroundDistribution Fibre - underground
© NBN Co Limited 20128
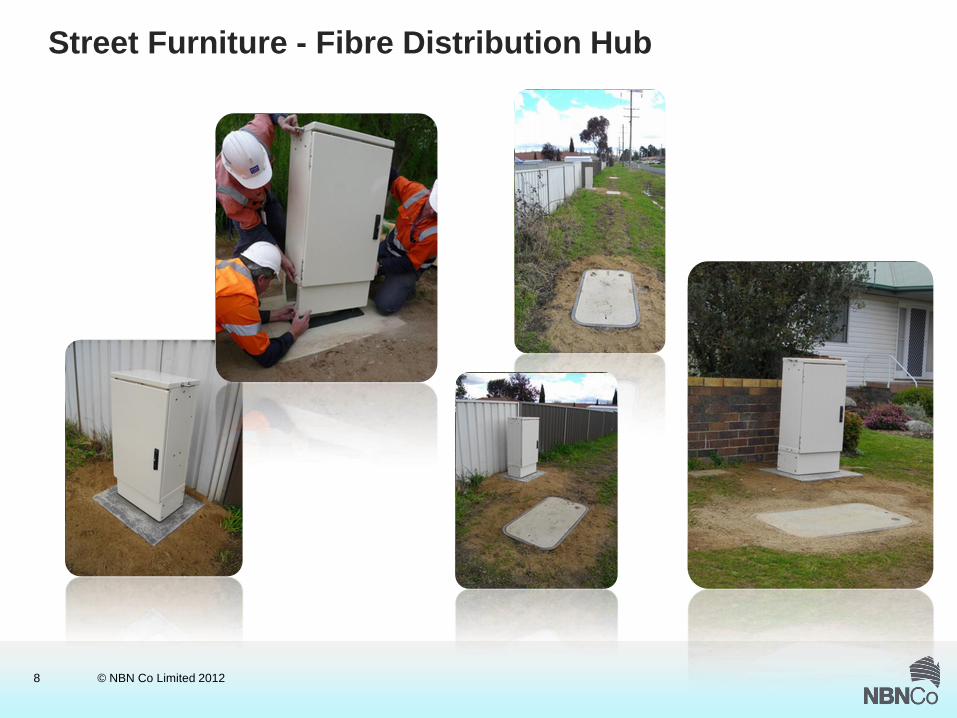
Street Furniture - Fibre Distribution Hub

© NBN Co Limited 20129
Fibre Serving Area Structure
11
Urban FSA 768 sq km192 FDAs covered
Average 38,400 GNAFs
Fibre Serving Area Module
4
For planning purposes a rectilinear estimation of a Fibre Serving Area can be generated to provide an estimated distance of distribution fibre. Note that the fibre cable may contain tubes for local, distribution & trunk fibres.
Distribution Fibre Design

© NBN Co Limited 201210
Fibre Optic Network Design Optimisation[FOND]
Technical Overview
Copyright Biarri Pty Ltd 2011
© NBN Co Limited 201211
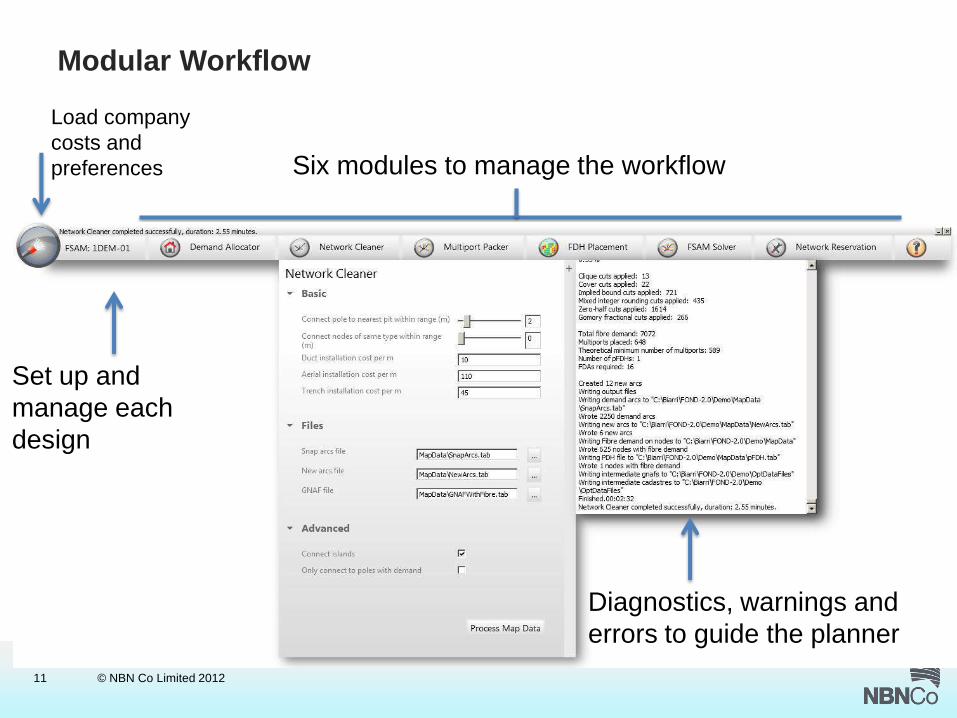
Modular Workflow
Diagnostics, warnings and errors to guide the planner
Six modules to manage the workflow
Set up and manage each design
Load company costs and preferences
© NBN Co Limited 201212
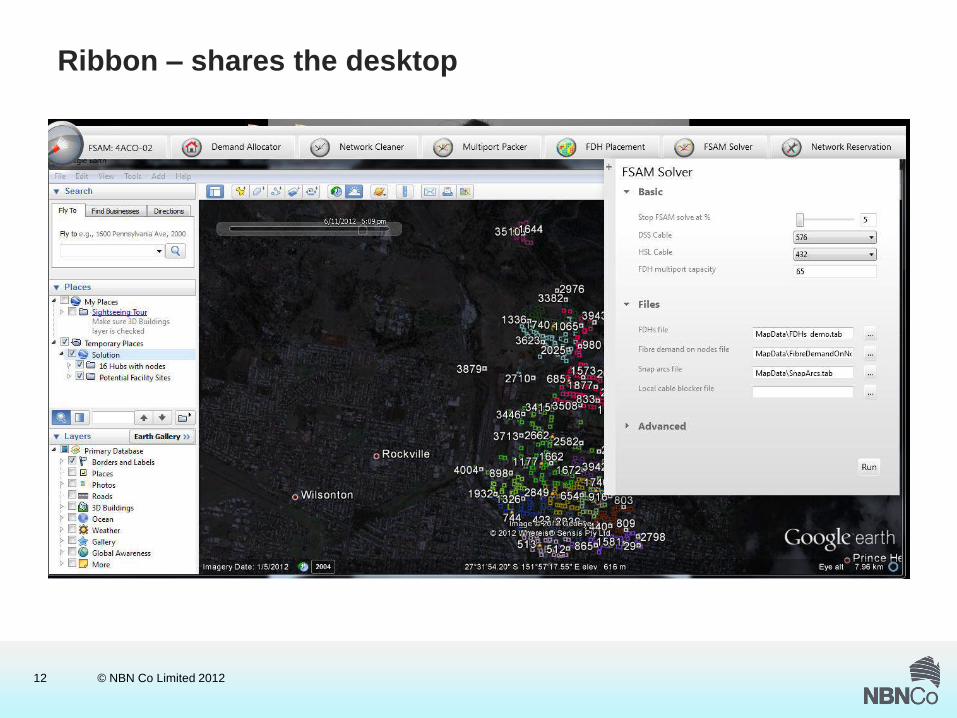
Ribbon – shares the desktop
© NBN Co Limited 201213
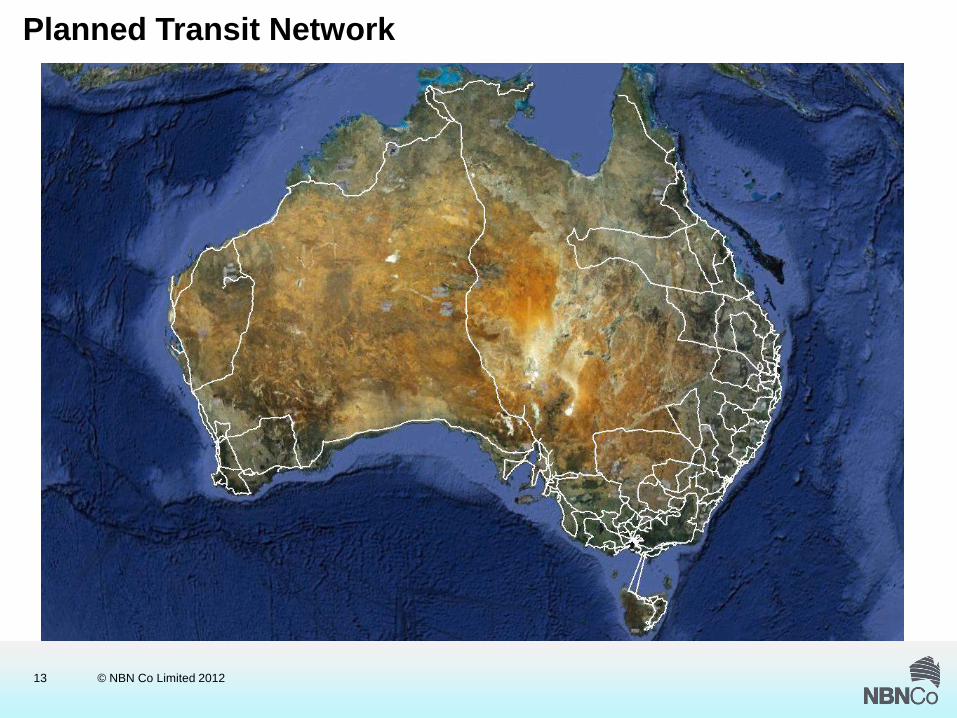
Planned Transit Network
© NBN Co Limited 201214
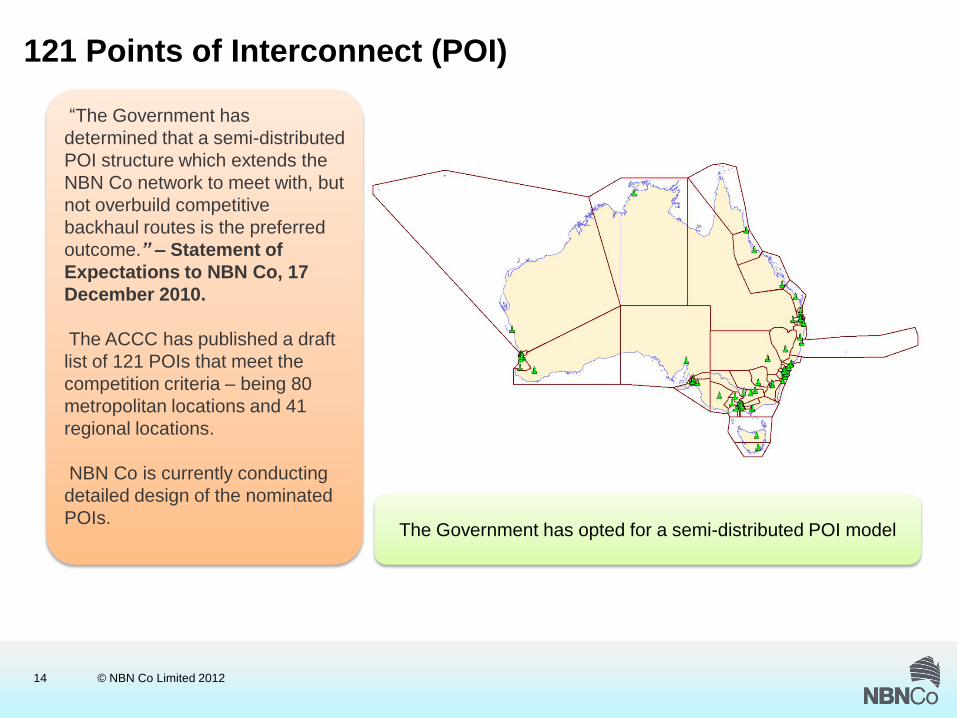
The Government has opted for a semi-distributed POI model
“The Government has determined that a semi-distributed POI structure which extends the NBN Co network to meet with, but not overbuild competitive backhaul routes is the preferred outcome.” – Statement of Expectations to NBN Co, 17 December 2010.
The ACCC has published a draft list of 121 POIs that meet the competition criteria – being 80 metropolitan locations and 41 regional locations.
NBN Co is currently conducting detailed design of the nominated POIs.
121 Points of Interconnect (POI)

© NBN Co Limited 201215
1,490 nm
1,310 nm
Fibre Access Node
Typically up to 20 km (28 dB)
Voice , Data, and Video
Passive Outside Plant
2.5Gb/s
1.2Gb/s
splitters
Ethernet Aggregation Switch (data, inc. video & voice)
OpticalLine
TerminalSingle family homes
Multi-dwelling units
Small/Medium Enterprises
Single fibre optic cable for all services (voice, data and video)
Passive Optical Network (PON) - Active Architecture

© NBN Co Limited 201216
Capacity Evolution
Source: Ciena, Coherent Optical Networking poster, 2011

© NBN Co Limited 201217
PON Evolutionary Paths
Wavelengths per direction
Tota
l PO
N b
and
wid
th (G
bp
s)
10G PON
2.5G PON
4λ x 10G PON
(40Gbps)
4λ x 2.5G PON
(10Gbps)
0 1 2 3 4 5
10
100
10G TDM PON electronics technical challenges are being worked on by the
industry—will take net 2–3 years for maturity
TDM GPON is starting mass
deployment now and has a long life to go
Hybrid GPON may be a practical
evolutionary step
Longer-term evolution to 40Gbps is planned
© NBN Co Limited 201218 18
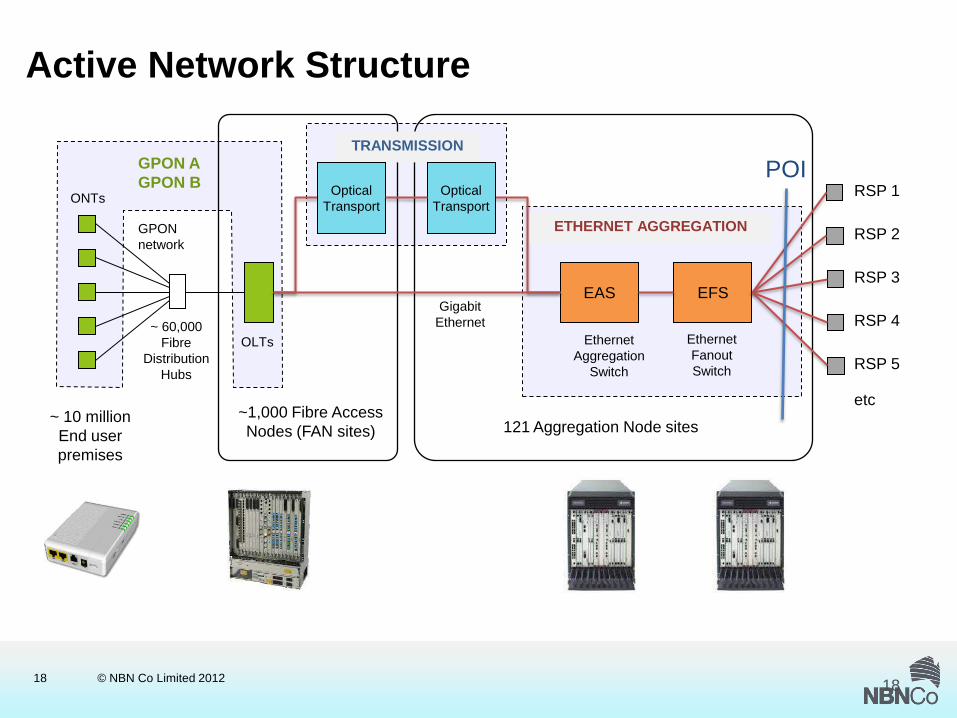
Active Network Structure
GPON AGPON B
GPON network
OLTs~ 60,000
Fibre Distribution
Hubs
ONTs
EAS
Ethernet Aggregation
Switch
EFS
Ethernet Fanout Switch
~ 10 millionEnd userpremises
~1,000 Fibre AccessNodes (FAN sites) 121 Aggregation Node sites
RSP 1
RSP 2
RSP 3
RSP 4
RSP 5
TRANSMISSION
OpticalTransport
OpticalTransport
ETHERNET AGGREGATION
etc
Gigabit Ethernet
POI

© NBN Co Limited 201219
‘End to End’ Active Architecture
© NBN Co Limited 201220
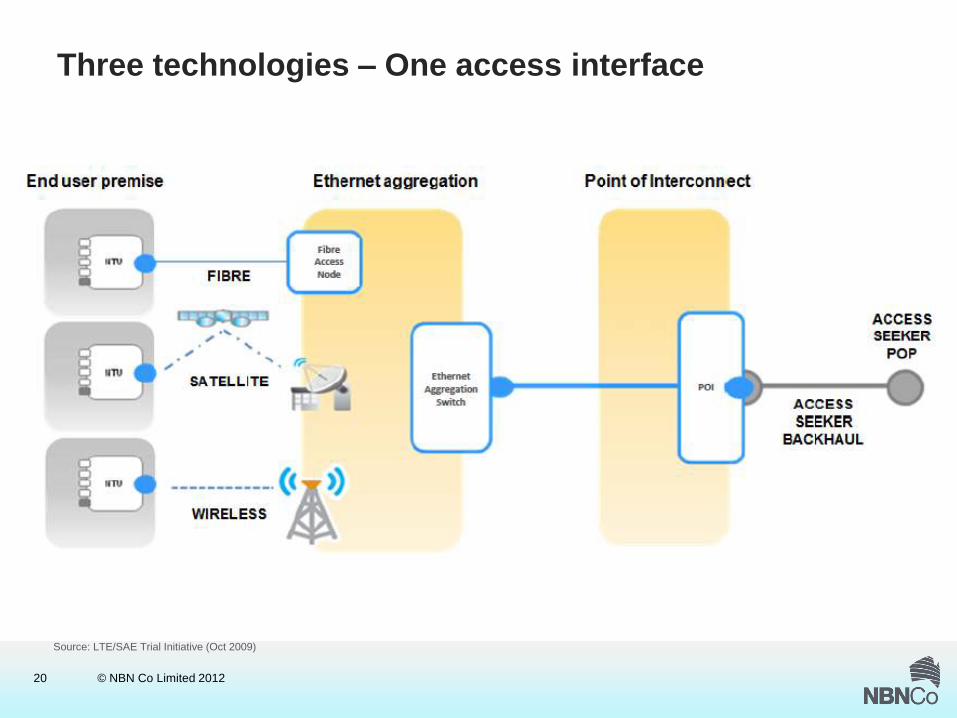
Three technologies – One access interface
Source: LTE/SAE Trial Initiative (Oct 2009)

© NBN Co Limited 201221
What’s there to talk about regarding Network Planning
and Design?
What do we build?
Where do we build?
When do we build?
© NBN Co Limited 201222
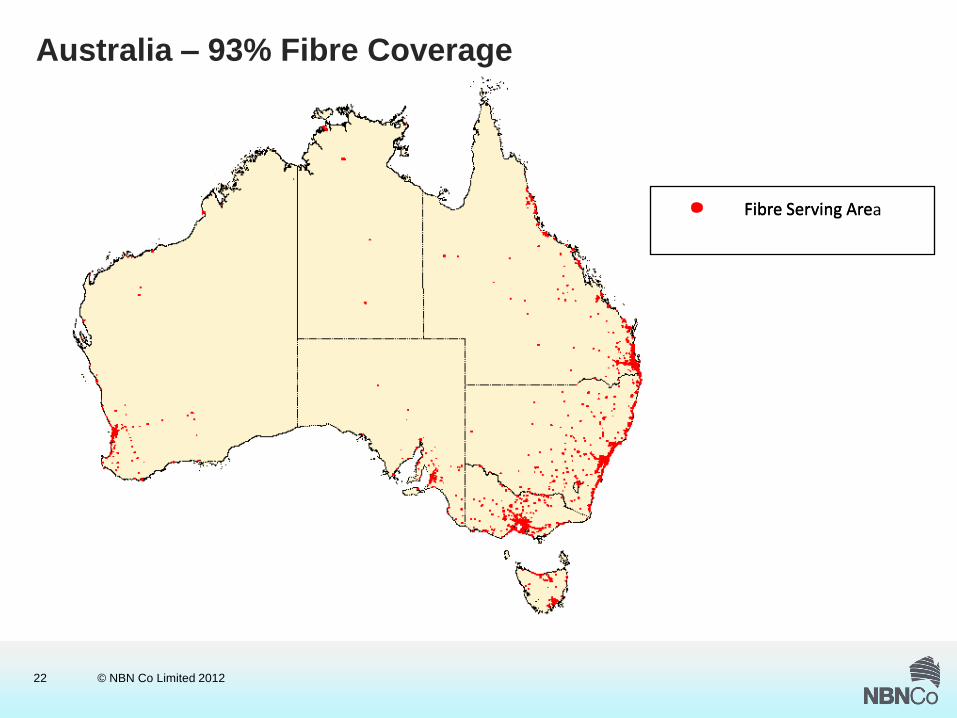
Australia – 93% Fibre Coverage
Fibre Serving AreaFibre Serving Are
© NBN Co Limited 201223
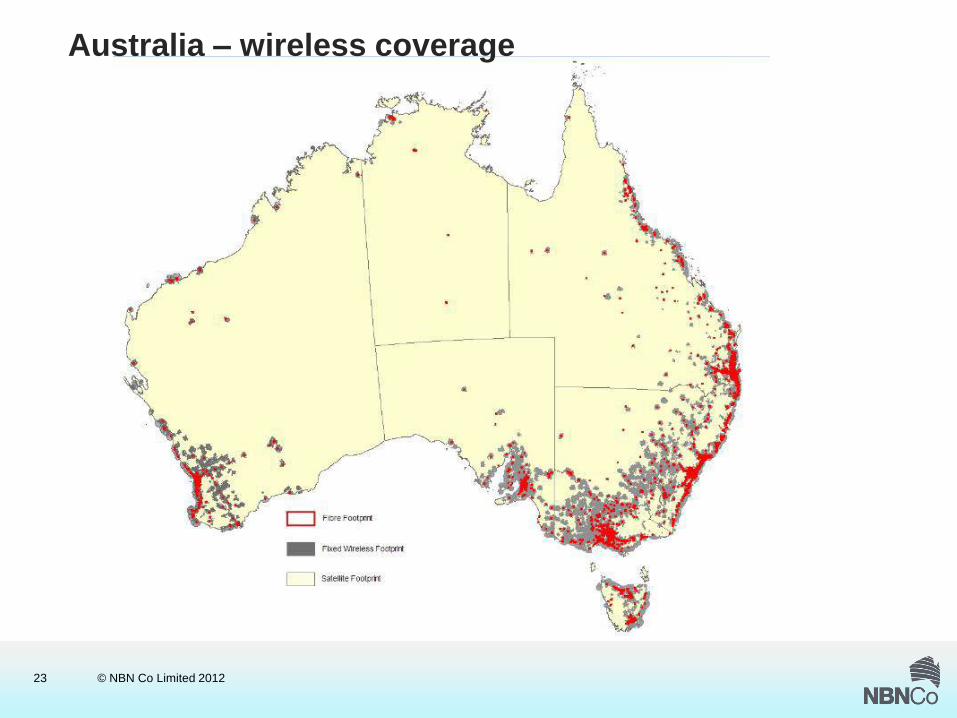
Australia – wireless coverage

© NBN Co Limited 201224
Fibre network + wireless + satellite

© NBN Co Limited 201225
Step 1 – least cost density
Generate density graph
for whole country
Select GNAFs from densest regions. Stop when Param1
% selected
Param1 %
Set selected GNAFs as visited and included
93%
Step 1 Step 3
Modify density
Run DBSCAN
Iterate density to minimise service cost
Step 2

© NBN Co Limited 201226
Step 2 – select GNAFs to target coverage
Generate clusters for
whole country
Cost clusters
Selected Clusters
Step 1
Iterate until target coverage reached
Step 2
Update infrastructure(FANS, trunk)
Sort and Select least cost
cluster

© NBN Co Limited 201227
What’s there to talk about regarding Network Planning
and Design?
What do we build?
Where do we build?
When do we build?

© NBN Co Limited 201228
End-to-end view
FIRL (Forecast Infrastructure Requirements List) – Telstra/NBN CO DA document Telstra Rollout Plan – Telstra Deployment programme with deliverable datesNIP – NBN Co Network Implementation Plan (full network planned view)POW – NBN Co Programme of Works (Deployment schedule)POM – NBN Co Program Outcomes Matrix
CONTRACTOR CAPABILITY
CONSTRAINTS
POW
DEMAND FORECAST
WORKFORCE PLAN
HR PLANNING
POM
CONTRACTOR SCHEDULES
KPI REPORTING
PROJECT SCHEDULES/
MGT.
NIP
ACCESS PLANNING
GREENFIELDS PLANNING
SATELLITE PLANNING
WIRELESS PLANNING
TRANSIT PLANNING
PCCC PLANNING
TELSTRA ROLLOUT
PLANFIRL
© NBN Co Limited 201229
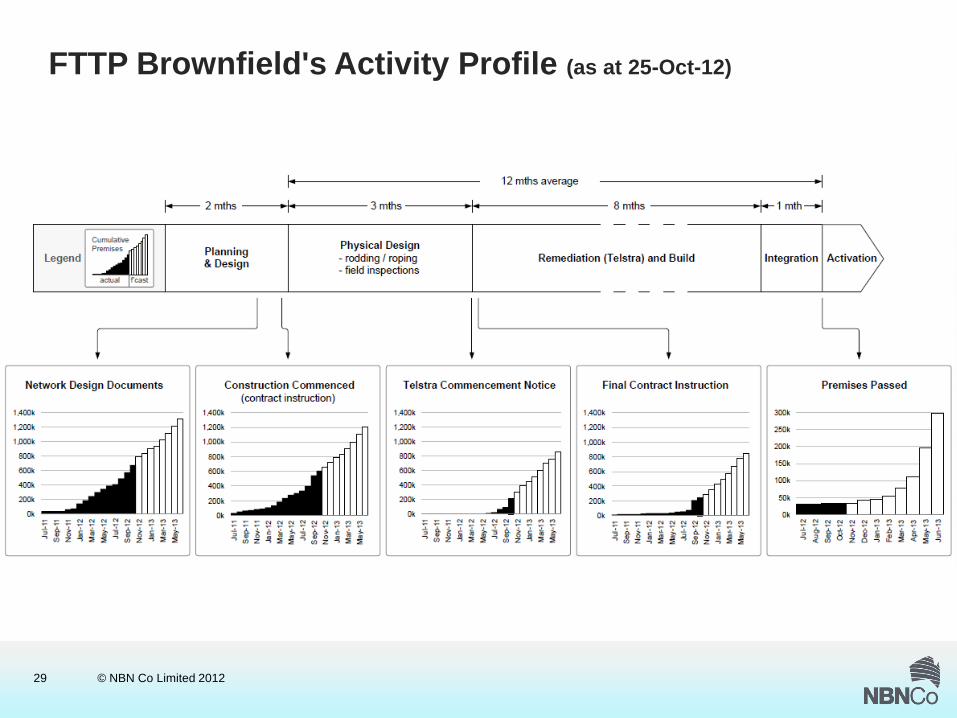
FTTP Brownfield's Activity Profile (as at 25-Oct-12)
© NBN Co Limited 201230
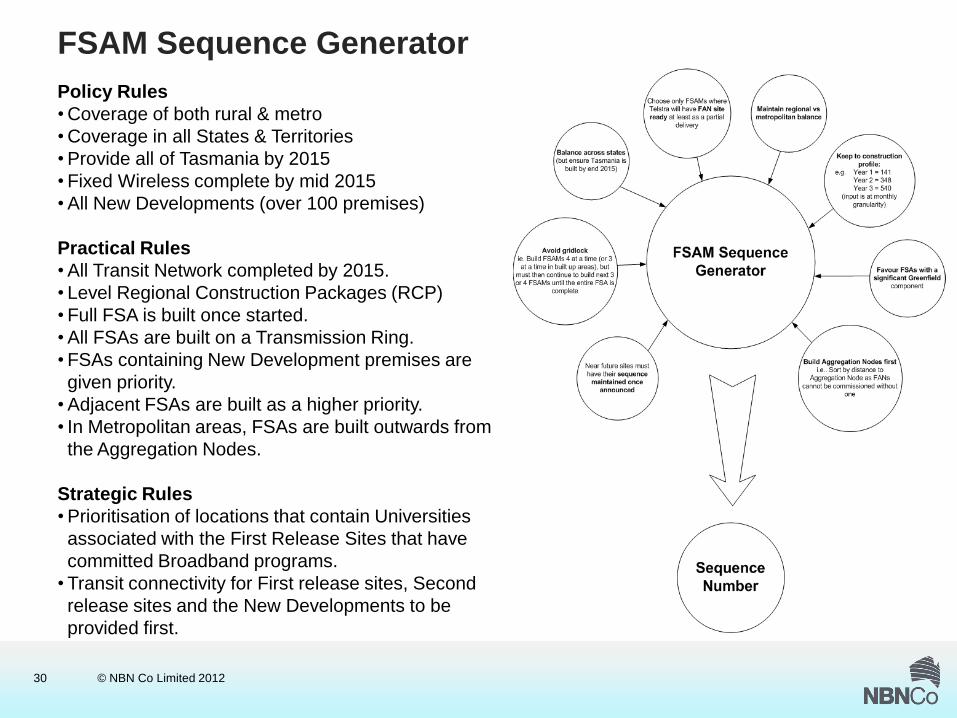
FSAM Sequence GeneratorPolicy Rules• Coverage of both rural & metro• Coverage in all States & Territories• Provide all of Tasmania by 2015• Fixed Wireless complete by mid 2015• All New Developments (over 100 premises)
Practical Rules• All Transit Network completed by 2015.• Level Regional Construction Packages (RCP)• Full FSA is built once started.• All FSAs are built on a Transmission Ring.• FSAs containing New Development premises are given priority.
• Adjacent FSAs are built as a higher priority.• In Metropolitan areas, FSAs are built outwards from the Aggregation Nodes.
Strategic Rules• Prioritisation of locations that contain Universities associated with the First Release Sites that have committed Broadband programs.
• Transit connectivity for First release sites, Second release sites and the New Developments to be provided first.

© NBN Co Limited 201231
FSAM Rollout

© NBN Co Limited 201232
Questions?