iec 60815-1
TRANSCRIPT

36/187/CDCOMMITTEE DRAFT (CD)
IEC/TC or SC:36
Project numberIEC 60815-1 TS Ed. 1.0
Title of TC/SC:Insulators
Date of circulation2002-05-17
Closing date for comments2002-08-23
Also of interest to the following committees
Supersedes document36/153/NP & 36/157/RVN
Functions concerned: Safety EMC Environment Quality assurance
Secretary:Mr B Lester [email protected]
THIS DOCUMENT IS STILL UNDER STUDY AND SUBJECT TOCHANGE. IT SHOULD NOT BE USED FOR REFERENCE PURPOSES.RECIPIENTS OF THIS DOCUMENT ARE INVITED TO SUBMIT, WITHTHEIR COMMENTS, NOTIFICATION OF ANY RELEVANT PATENTRIGHTS OF WHICH THEY ARE AWARE AND TO PROVIDESUPPORTING DOCUMENTATION.
Title:Selection and dimensioning of high-voltage insulators for polluted conditions -Part 1: Definitions, information and general principles
(Titre) :
Introductory notePage 6 of this document has an introduction from the project leader giving planned progress of the variousparts of the revision of IEC 60815.
FORM CD (IEC)2002-01-15© International Electrotechnical Commission, IEC

36/187/CD2
CONTENTS
FOREWORD........................................................................................................................... 4Introduction from the Project Leader ....................................................................................... 61 Scope and object..............................................................................................................82 Normative references ....................................................................................................... 93 Definitions ........................................................................................................................ 94 Abbreviations ................................................................................................................. 105 Proposed approaches for the selection and dimensioning of an insulator ....................... 116 Input parameters for the selection and dimensioning of insulators .................................. 127 System requirements...................................................................................................... 138 Environmental conditions ............................................................................................... 14
8.1 Identification of types of pollution .......................................................................... 148.1.1 Type A pollution ........................................................................................ 148.1.2 Type B pollution ........................................................................................ 15
8.2 Pollution Severity .................................................................................................. 159 Evaluation of site pollution severity ................................................................................ 15
9.1 Site pollution severity measurement ...................................................................... 159.2 Site pollution severity classes ............................................................................... 16
10 Insulation selection and dimensioning ............................................................................ 1810.1 General description of the process ........................................................................ 1810.2 General guidance on profiles................................................................................. 1810.3 Considerations for exceptional or specific applications or environments ................ 19
10.3.1 Hollow core insulators ............................................................................... 1910.3.2 Arid areas.................................................................................................. 19
FIGURES.............................................................................................................................. 20Annex A Pollution Flashover mechanisms............................................................................. 23A.1 Description of the pollution flashover mechanism under type A pollution ........................ 23A.2 Description of the pollution flashover mechanism under type B pollution ........................ 24
A.2.1 Conductive Fog ..................................................................................................... 24A.2.2 Bird Streamers ...................................................................................................... 24
A.3 The pollution flashover mechanism on hydrophobic surfaces.......................................... 25Annex B Measurement of ESDD and NSDD .......................................................................... 26B.1 Introduction .................................................................................................................... 26B.2 Necessary equipment to measure pollution degree......................................................... 26B.3 Pollution collection methods for ESDD and NSDD measurement .................................... 27
B.3.1 Procedure using a swab technique ........................................................................ 27B.3.2 Procedure using washing technique ...................................................................... 27
B.4 Determining ESDD and NSDD ........................................................................................ 27B.4.1 ESDD calculations................................................................................................. 27B.4.2 NSDD calculations ................................................................................................ 30
B.5 Chemical analysis of pollutants ...................................................................................... 30Annex C Evaluation of SES pollution severity ....................................................................... 31C.1 Measurement of surface conductance ............................................................................ 31C.2 Measurement of surface leakage currents ...................................................................... 31Annex D Directional Dust Deposit Gauge Measurements ...................................................... 32D.1 Introduction .................................................................................................................... 32

36/187/CD3
D.2 Test equipment .............................................................................................................. 33D.3 Test procedure ............................................................................................................... 33D.4 Determination of SPS class from DDDG measurements ................................................. 33Annex E Use of laboratory test methods ............................................................................... 34E.1 General outline of the procedure .................................................................................... 34
E.1.1 Introduction ........................................................................................................... 34E.1.2 Determination of the Site Pollution Severity and pollution type .............................. 34E.1.3 Determination of the co-ordination pollution severity withstand level ..................... 34E.1.4 Determination of the required pollution severity withstand level ............................. 35
E.2 Use of pollution withstand tests ...................................................................................... 35E.2.1 Standard pollution withstand tests ......................................................................... 35E.2.2 Additional tests ..................................................................................................... 36E.2.3 Alternative tests .................................................................................................... 36
Annex F Example of a questionnaire to collect information on the behaviour of insulators inpolluted areas ................................................................................................................ 37
Annex G Bibliographic References........................................................................................ 40

36/187/CD4
INTERNATIONAL ELECTROTECHNICAL COMMISSION
____________
IEC 60815: Selection and dimensioning of high-voltage insulators for pollutedconditions -
Part 1: Definitions, information and general principles
FOREWORD1) The IEC (International Electrotechnical Commission) is a worldwide organization for standardization comprising all
national electrotechnical committees (IEC National Committees). The object of the IEC is to promote international co-operation on all questions concerning standardization in the electrical and electronic fields. To this end and in additionto other activities, the IEC publishes International Standards. Their preparation is entrusted to technical committees;any IEC National Committee interested in the subject dealt with may participate in this preparatory work. International,governmental and non-governmental organizations liaising with the IEC also participate in this preparation. The IECcollaborates closely with the International Organization for Standardization (ISO) in accordance with conditionsdetermined by agreement between the two organizations.
2) The formal decisions or agreements of the IEC on technical matters express, as nearly as possible, an internationalconsensus of opinion on the relevant subjects since each technical committee has representation from all interestedNational Committees.
3) The documents produced have the form of recommendations for international use and are published in the form ofstandards, technical specifications, technical reports or guides and they are accepted by the National Committees inthat sense.
4) In order to promote international unification, IEC National Committees undertake to apply IEC International Standardstransparently to the maximum extent possible in their national and regional standards. Any divergence between theIEC Standard and the corresponding national or regional standard shall be clearly indicated in the latter.
5) The IEC provides no marking procedure to indicate its approval and cannot be rendered responsible for any equipmentdeclared to be in conformity with one of its standards.
6) Attention is drawn to the possibility that some of the elements of this technical specification may be the subject ofpatent rights. The IEC shall not be held responsible for identifying any or all such patent rights.
The main task of IEC technical committees is to prepare International Standards. In exceptionalcircumstances, a technical committee may propose the publication of a technical specification when
• the required support cannot be obtained for the publication of an International Standard, despiterepeated efforts, or
• The subject is still under technical development or where, for any other reason, there is thefuture but no immediate possibility of an agreement on an International Standard.
Technical specifications are subject to review within three years of publication to decide whetherthey can be transformed into International Standards.
IEC 60815-1, which is a technical specification, has been prepared by technical committee 36:Insulators.
The text of this technical specification is based on the following documents:
Enquiry draft Report on voting
XX/XX/DTS XX/XX/RVC
Full information on the voting for the approval of this technical specification can be found in thereport on voting indicated in the above table.
This publication has been drafted in accordance with the ISO/IEC Directives, Part 2.
The committee has decided that the contents of this publication will remain unchanged until ______.At this date, the publication will be
• reconfirmed;• withdrawn;

36/187/CD5
• replaced by a revised edition, or• amended.

36/187/CD6
Introduction from the Project Leader
Schedule
The following table shows the planned progress of the revision work. This schedule is based on theavailability of resources within Working Group 11 and an average of two meetings per year. Sincemuch of the content of the revision is based on the work of CIGRE TF 33.13.01, the schedule alsotakes into account the project plans of this Task Force.
The dates concerning progress of work on the successive parts (3 to 5) of IEC 60815 will depend onthe degree of acceptance of the first drafts of parts 1 and 2.
Part Expected availability
1st complete draft Part I (1CD) – Guide for the choice of insulators under pollutedconditions – Part 1: Definitions, information and general principles
April 2002
Draft outline for Part II (DC) – Part 2: Porcelain and glass insulators for a.c.systems
April 2002
1st complete draft Part II (1CD) – Part 2: Porcelain and glass insulators for a.c.systems
December 2002
1st complete draft Part III (1CD) ) – Part 3: Polymer insulators for a.c. systems End 2003
1st complete draft Part IV (1CD) ) – Part 4: Porcelain and glass insulators for d.c.systems
End 2004
1st complete draft Part V (1CD) ) – Part 5: Polymer insulators for d.c. systems End 2004
Content and orientation
In addition to the strategy and layout given by the task in 36/157/RVN, the orientation of the workon the revision of IEC 60815 is also based largely on the following list of areas where IEC60815:1986 was perceived to be weak by CIGRE [1]:
• Performance of polymeric insulators• Insulator orientation and mounting angle• Extension of applicability to voltages above 525 kV a.c.• Design for d.c. application• Insulators with semi-conducting glaze• Surge arrester housing performance, particularly with reference to polymeric materials• Longitudinal breaks in interrupter equipment• Radio interference, television interference, and audible noise of polluted insulators• Effect of altitude• Effect of heavy wettingThe revision of IEC 60815:1986 to take into account current experience, knowledge and practicerelated to polluted insulators in general and specifically to include polymer insulators and to coverd.c. systems requires subdivision of the guide into the following five parts:
Part 1: Definitions, information and general principlesPart 2: Ceramic and glass insulators for a.c. systemsPart 3: Polymer insulators for a.c. systemsPart 4: Ceramic and glass insulators for d.c. systemsPart 5: Polymer insulators for d.c. systems

36/187/CD7
As work on part 1 has progressed, it has become evident that the requirements for evaluation andmeasurement of site severity were a major concern. The content of part 1 now principally coverssite pollution severity determination, description of the flashover mechanism, approaches forselection and dimensioning and testing techniques.
An draft layout for Part 2 is being circulated with this draft in order to allow the reader to see howthe content of Part 1 will be applied and used.
The correction factors for material, voltage, profile, diameter, position etc. are currently underdiscussion in the working group and could not be finalised for this CD. A companion document(circulated as a DC – document for comment – showing the general principles of IEC 60815 Part 2(and following parts) is available and gives the typical correction factors. Similarly, the relativeapplicability of profile parameters to different insulators, materials and technologies will now bedealt with in the succeeding parts.
The following major changes have been made:
• Encouragement of the use of site pollution severity measurements, preferably over at least ayear, in order to classify a site instead of the previous qualitative assessment;
• Recognition that “solid” pollution has two components, one soluble quantified by ESDD, theother insoluble quantified by NSDD;
• Recognition that in some cases measurement of layer conductivity should be used for siteseverity;
• Use of the results of natural and artificial pollution tests to help with dimensioning;• Recognition that creepage length is not always the sole determining parameter;• Recognition of the influence other geometry parameters and of the varying importance of
parameters according to the size and type of insulation.• Recognition of the varying importance of parameters according to the type of pollution.
36/187/CD8
IEC 60815: Selection and dimensioning of high-voltage insulators for pollutedconditions -
Part 1: Definitions, information and general principles
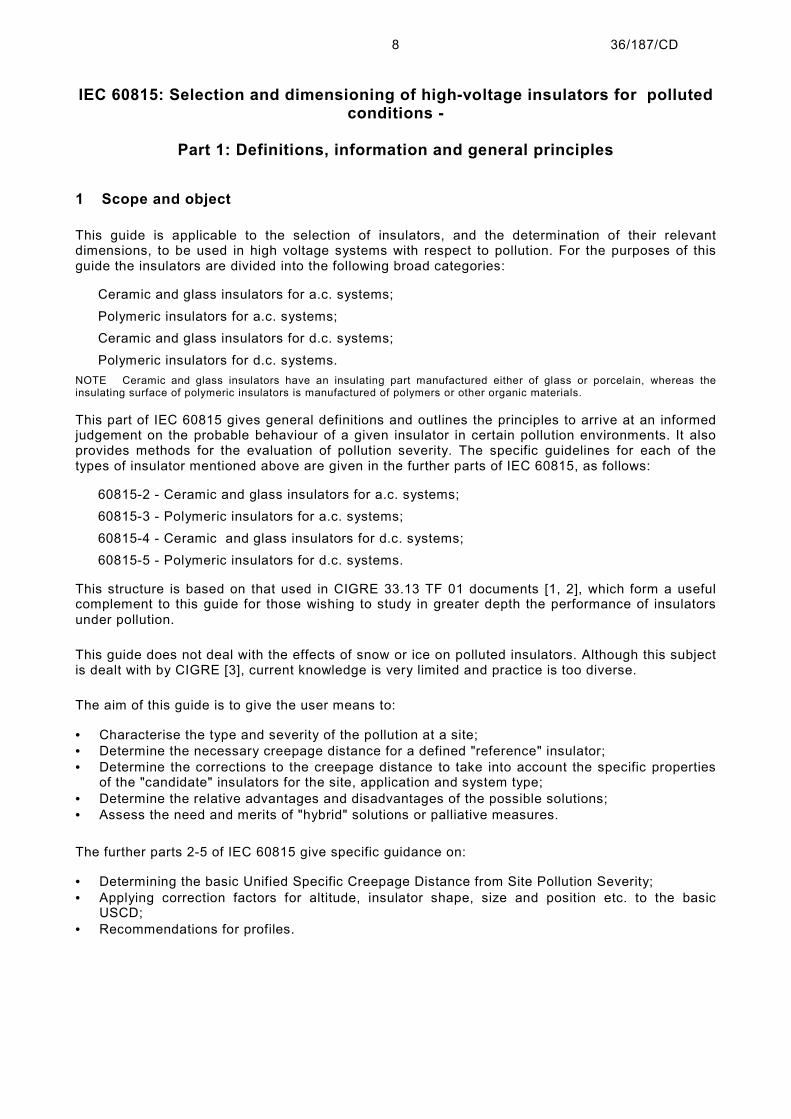
1 Scope and object
This guide is applicable to the selection of insulators, and the determination of their relevantdimensions, to be used in high voltage systems with respect to pollution. For the purposes of thisguide the insulators are divided into the following broad categories:
Ceramic and glass insulators for a.c. systems;Polymeric insulators for a.c. systems;Ceramic and glass insulators for d.c. systems;Polymeric insulators for d.c. systems.
NOTE Ceramic and glass insulators have an insulating part manufactured either of glass or porcelain, whereas theinsulating surface of polymeric insulators is manufactured of polymers or other organic materials.
This part of IEC 60815 gives general definitions and outlines the principles to arrive at an informedjudgement on the probable behaviour of a given insulator in certain pollution environments. It alsoprovides methods for the evaluation of pollution severity. The specific guidelines for each of thetypes of insulator mentioned above are given in the further parts of IEC 60815, as follows:
60815-2 - Ceramic and glass insulators for a.c. systems;60815-3 - Polymeric insulators for a.c. systems;60815-4 - Ceramic and glass insulators for d.c. systems;60815-5 - Polymeric insulators for d.c. systems.
This structure is based on that used in CIGRE 33.13 TF 01 documents [1, 2], which form a usefulcomplement to this guide for those wishing to study in greater depth the performance of insulatorsunder pollution.
This guide does not deal with the effects of snow or ice on polluted insulators. Although this subjectis dealt with by CIGRE [3], current knowledge is very limited and practice is too diverse.
The aim of this guide is to give the user means to:
• Characterise the type and severity of the pollution at a site;• Determine the necessary creepage distance for a defined "reference" insulator;• Determine the corrections to the creepage distance to take into account the specific properties
of the "candidate" insulators for the site, application and system type;• Determine the relative advantages and disadvantages of the possible solutions;• Assess the need and merits of "hybrid" solutions or palliative measures.
The further parts 2-5 of IEC 60815 give specific guidance on:
• Determining the basic Unified Specific Creepage Distance from Site Pollution Severity;• Applying correction factors for altitude, insulator shape, size and position etc. to the basic
USCD;• Recommendations for profiles.
36/187/CD9
2 Normative references
The following referenced documents are indispensable for the application of this document. Fordated references, only the edition cited applies. For undated references, the latest edition of thereferenced document (including any amendments) applies.
IEC 60071-1:1993, Insulation co-ordination - Part 1: Definitions, principles and rules
IEC 60305:1995, Insulators for overhead lines with a nominal voltage above 1000 V - Ceramic orglass insulator units for a.c. systems - Characteristics of insulator units of thecap and pin type
IEC 60433:1998, Insulators for overhead lines with a nominal voltage above 1 000 V - Ceramicinsulators for a.c. systems - Characteristics of insulator units of the long rodtype
IEC 60507:1991, Artificial pollution tests on high voltage insulators to be used on a.c. systems
IEC 61245:1993, Artificial pollution tests on high-voltage insulators to be used on d.c. systems
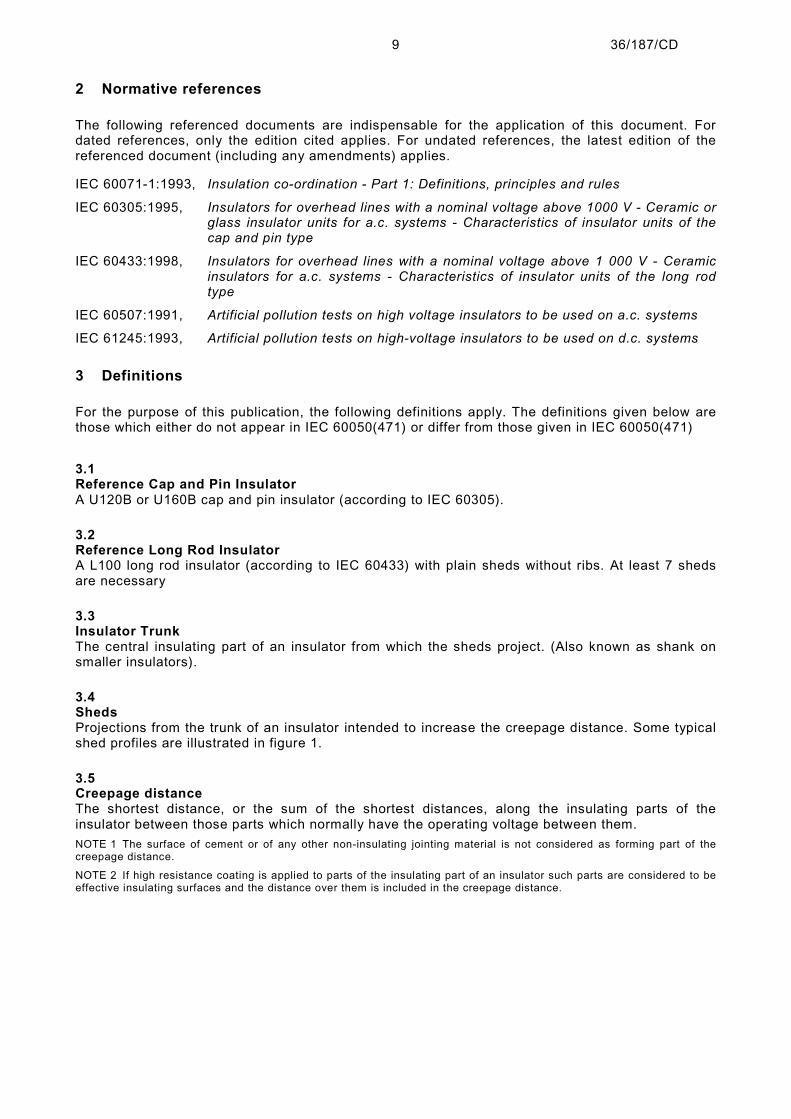
3 Definitions
For the purpose of this publication, the following definitions apply. The definitions given below arethose which either do not appear in IEC 60050(471) or differ from those given in IEC 60050(471)
3.1Reference Cap and Pin InsulatorA U120B or U160B cap and pin insulator (according to IEC 60305).
3.2Reference Long Rod InsulatorA L100 long rod insulator (according to IEC 60433) with plain sheds without ribs. At least 7 shedsare necessary
3.3Insulator TrunkThe central insulating part of an insulator from which the sheds project. (Also known as shank onsmaller insulators).
3.4ShedsProjections from the trunk of an insulator intended to increase the creepage distance. Some typicalshed profiles are illustrated in figure 1.
3.5Creepage distanceThe shortest distance, or the sum of the shortest distances, along the insulating parts of theinsulator between those parts which normally have the operating voltage between them.NOTE 1 The surface of cement or of any other non-insulating jointing material is not considered as forming part of thecreepage distance.
NOTE 2 If high resistance coating is applied to parts of the insulating part of an insulator such parts are considered to beeffective insulating surfaces and the distance over them is included in the creepage distance.
36/187/CD10
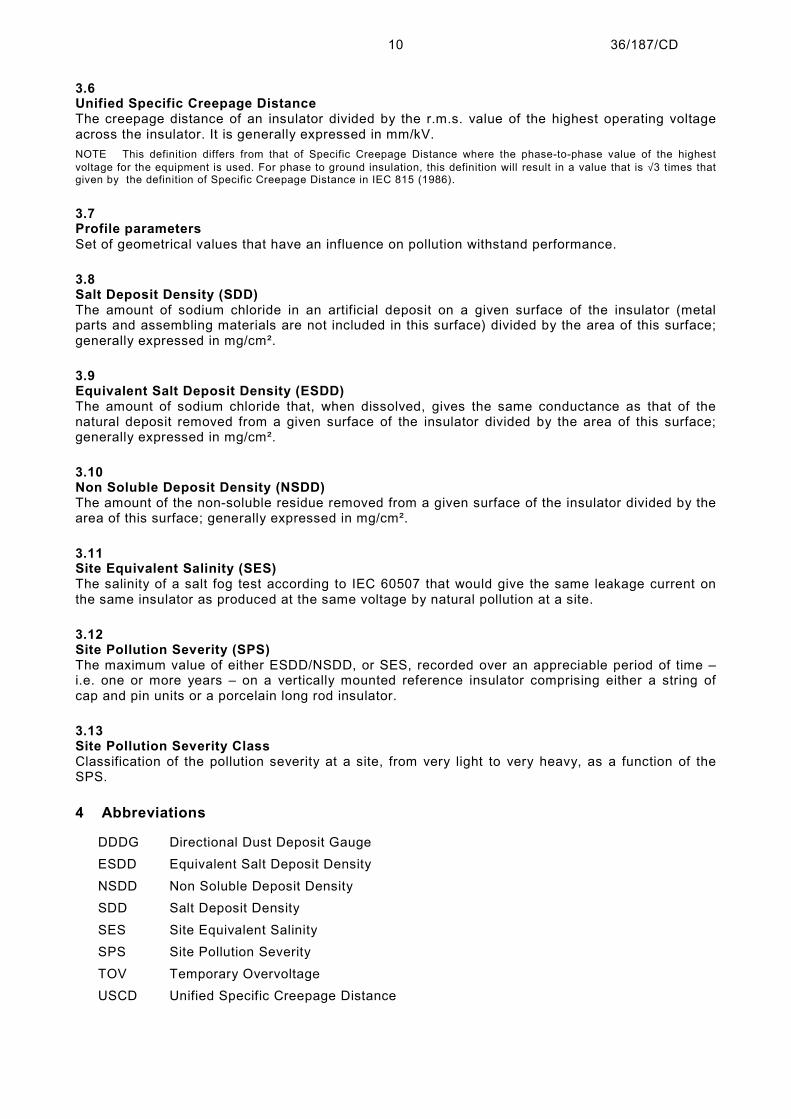
3.6Unified Specific Creepage DistanceThe creepage distance of an insulator divided by the r.m.s. value of the highest operating voltageacross the insulator. It is generally expressed in mm/kV.NOTE This definition differs from that of Specific Creepage Distance where the phase-to-phase value of the highestvoltage for the equipment is used. For phase to ground insulation, this definition will result in a value that is √3 times thatgiven by the definition of Specific Creepage Distance in IEC 815 (1986).
3.7Profile parametersSet of geometrical values that have an influence on pollution withstand performance.
3.8Salt Deposit Density (SDD)The amount of sodium chloride in an artificial deposit on a given surface of the insulator (metalparts and assembling materials are not included in this surface) divided by the area of this surface;generally expressed in mg/cm².
3.9Equivalent Salt Deposit Density (ESDD)The amount of sodium chloride that, when dissolved, gives the same conductance as that of thenatural deposit removed from a given surface of the insulator divided by the area of this surface;generally expressed in mg/cm².
3.10Non Soluble Deposit Density (NSDD)The amount of the non-soluble residue removed from a given surface of the insulator divided by thearea of this surface; generally expressed in mg/cm².
3.11Site Equivalent Salinity (SES)The salinity of a salt fog test according to IEC 60507 that would give the same leakage current onthe same insulator as produced at the same voltage by natural pollution at a site.
3.12Site Pollution Severity (SPS)The maximum value of either ESDD/NSDD, or SES, recorded over an appreciable period of time –i.e. one or more years – on a vertically mounted reference insulator comprising either a string ofcap and pin units or a porcelain long rod insulator.
3.13Site Pollution Severity ClassClassification of the pollution severity at a site, from very light to very heavy, as a function of theSPS.
4 Abbreviations
DDDG Directional Dust Deposit GaugeESDD Equivalent Salt Deposit DensityNSDD Non Soluble Deposit DensitySDD Salt Deposit DensitySES Site Equivalent SalinitySPS Site Pollution SeverityTOV Temporary OvervoltageUSCD Unified Specific Creepage Distance
36/187/CD11
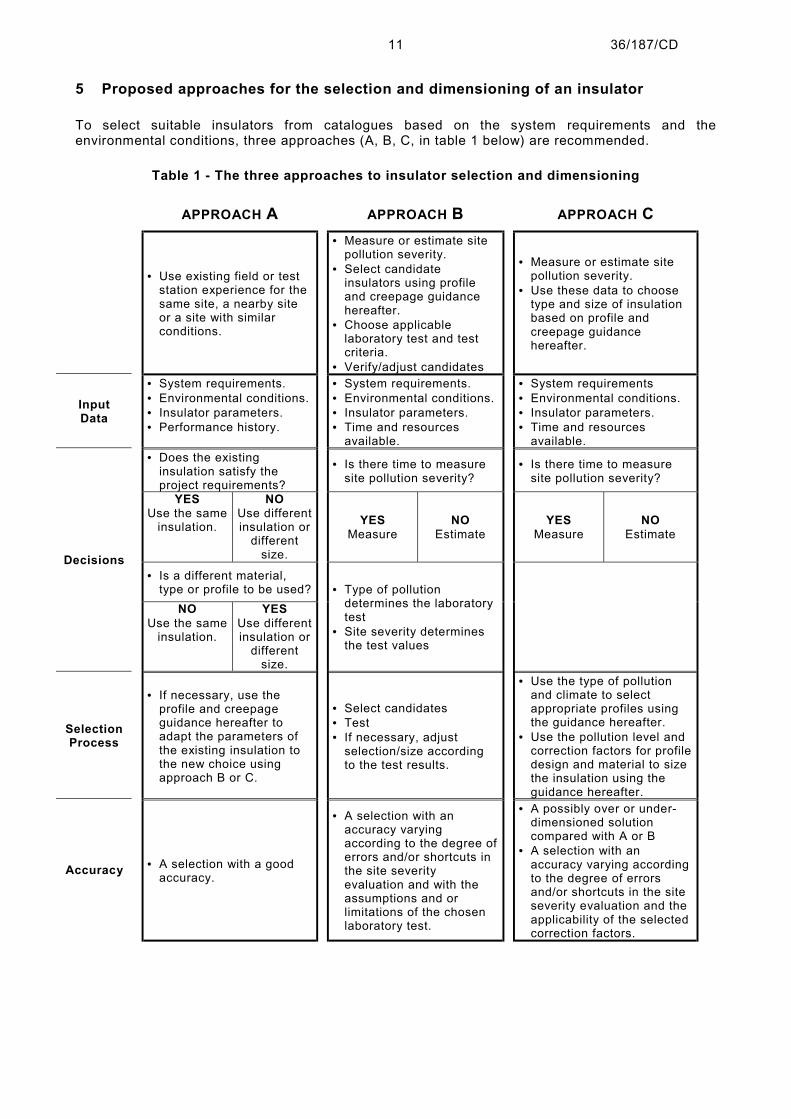
5 Proposed approaches for the selection and dimensioning of an insulator
To select suitable insulators from catalogues based on the system requirements and theenvironmental conditions, three approaches (A, B, C, in table 1 below) are recommended.
Table 1 - The three approaches to insulator selection and dimensioning
APPROACH A APPROACH B APPROACH C
• Use existing field or teststation experience for thesame site, a nearby siteor a site with similarconditions.
• Measure or estimate sitepollution severity.
• Select candidateinsulators using profileand creepage guidancehereafter.
• Choose applicablelaboratory test and testcriteria.
• Verify/adjust candidates
• Measure or estimate sitepollution severity.
• Use these data to choosetype and size of insulationbased on profile andcreepage guidancehereafter.
InputData
• System requirements.• Environmental conditions.• Insulator parameters.• Performance history.
• System requirements.• Environmental conditions.• Insulator parameters.• Time and resources
available.
• System requirements• Environmental conditions.• Insulator parameters.• Time and resources
available.• Does the existing
insulation satisfy theproject requirements?
• Is there time to measuresite pollution severity?
• Is there time to measuresite pollution severity?
YESUse the same
insulation.
NOUse differentinsulation or
differentsize.
YESMeasure
NOEstimate
YESMeasure
NOEstimate
• Is a different material,type or profile to be used?
Decisions
NOUse the same
insulation.
YESUse differentinsulation or
differentsize.
• Type of pollutiondetermines the laboratorytest
• Site severity determinesthe test values
SelectionProcess
• If necessary, use theprofile and creepageguidance hereafter toadapt the parameters ofthe existing insulation tothe new choice usingapproach B or C.
• Select candidates• Test• If necessary, adjust
selection/size accordingto the test results.
• Use the type of pollutionand climate to selectappropriate profiles usingthe guidance hereafter.
• Use the pollution level andcorrection factors for profiledesign and material to sizethe insulation using theguidance hereafter.
Accuracy • A selection with a goodaccuracy.
• A selection with anaccuracy varyingaccording to the degree oferrors and/or shortcuts inthe site severityevaluation and with theassumptions and orlimitations of the chosenlaboratory test.
• A possibly over or under-dimensioned solutioncompared with A or B
• A selection with anaccuracy varying accordingto the degree of errorsand/or shortcuts in the siteseverity evaluation and theapplicability of the selectedcorrection factors.
36/187/CD12
The applicability of each approach depends on available data, time and economics involved in theproject. The degree of confidence that the correct type and size of insulator has been selectedvaries also according to the decisions taken during the process. It is intended that if “shortcuts”have been taken in the selection process, then the resulting solution will represent over-designrather than one with a high failure risk in service. Table 1 shows the data and decisions neededwithin each approach.
In reality, the pollution performance of the insulator is determined by complicated and dynamicinteractions between the environment and the insulator. Annex A gives a brief summary of thepollution flashover mechanism. In approach A such interactions are well represented on anoperating line or substation and can also be represented in a test station. In approach B theseinteractions cannot be fully represented by laboratory tests, e.g. the tests specified in IEC 60507and IEC 61245. In approach C, such interactions can only be represented and catered for to alimited degree by the correction factors. Approach C is simple and cheap for the dimensioningprocess but the overall costs, including imposed performance requirements, have to be consideredwhen choosing from the three approaches. Whenever circumstances permit, approach A should beadopted.
The following clauses give more information on system requirements, environment and site pollutionseverity determination.
An example of a questionnaire that can be used in approach A to obtain operational experiencefrom an existing line or substation is given in annex F.
Guidelines for using laboratory tests in approach B are described in general terms in Annex E anddetails for the selection of the parameters and appropriate test methods are given in the relevantfurther parts of this publication.
For approach C, required minimum unified specific creepage distance and correction factors aregiven in the relevant further parts if this publication.
6 Input parameters for the selection and dimensioning of insulators
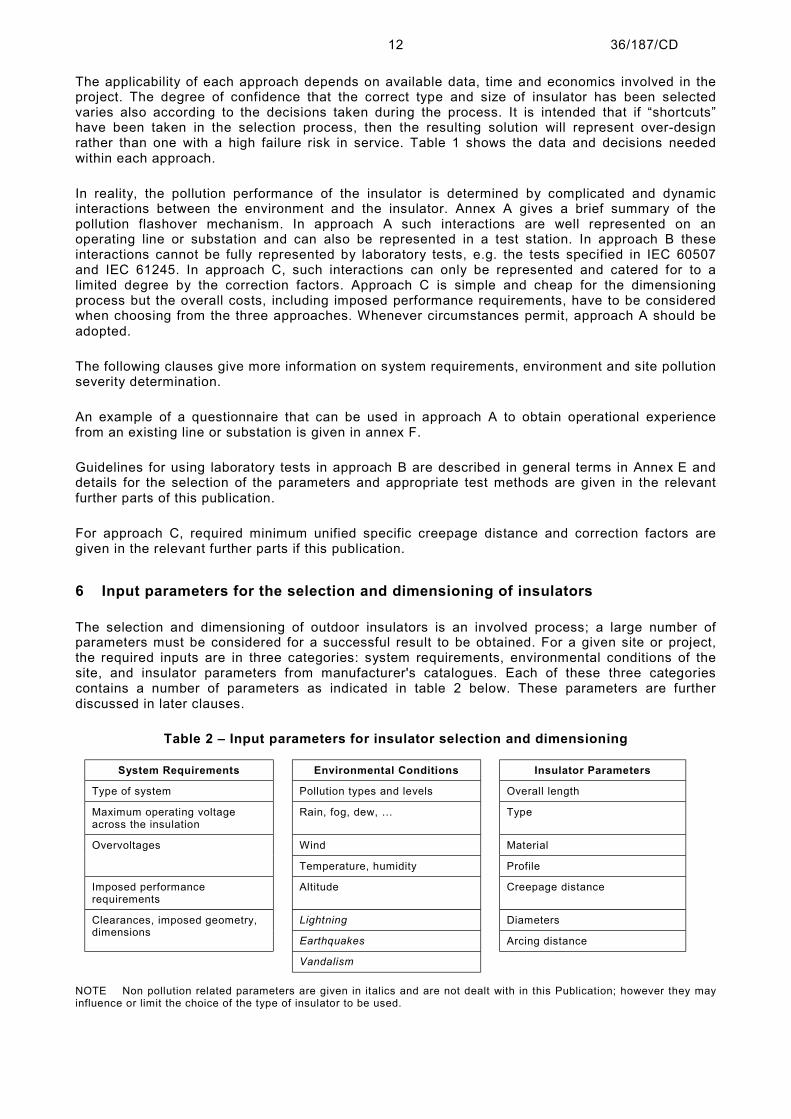
The selection and dimensioning of outdoor insulators is an involved process; a large number ofparameters must be considered for a successful result to be obtained. For a given site or project,the required inputs are in three categories: system requirements, environmental conditions of thesite, and insulator parameters from manufacturer's catalogues. Each of these three categoriescontains a number of parameters as indicated in table 2 below. These parameters are furtherdiscussed in later clauses.
Table 2 – Input parameters for insulator selection and dimensioning
System Requirements Environmental Conditions Insulator Parameters
Type of system Pollution types and levels Overall length
Maximum operating voltageacross the insulation
Rain, fog, dew, … Type
Wind MaterialOvervoltages
Temperature, humidity Profile
Imposed performancerequirements
Altitude Creepage distance
Lightning DiametersClearances, imposed geometry,dimensions
Earthquakes Arcing distance
Vandalism
NOTE Non pollution related parameters are given in italics and are not dealt with in this Publication; however they mayinfluence or limit the choice of the type of insulator to be used.
36/187/CD13
7 System requirements
System requirements have to be taken into account for the selection and dimensioning of outdoorinsulation. The following points may strongly influence insulator dimensioning and therefore need tobe considered.
• Type of system (a.c. or d.c.)It is well known from service and from laboratory test results that, for the same pollutionconditions, d.c. insulation requires a much higher value of unified specific creepage distancecompared to a.c. insulation. This effect is dealt with in detail in parts 4 and 5 of this publication.
• Maximum operating voltage across the insulationUsually an a.c. system is characterised by the highest voltage for equipment Um, see IEC60071-1.
Phase-to-earth insulation is stressed with the phase-to-earth voltage Uph-e = Um/√3.Phase-to-phase insulation is stressed with the phase-to-phase voltage Uph-ph = Um.Longitudinal insulation can be stressed up to a value of x times the phase to earth voltage. Thevalue of x can reach two during synchronisation.In the case of a d.c. system, usually the maximum system voltage is equal to the maximum line-to-earth voltage.
• OvervoltagesThe effects of transient overvoltages need not be considered due to their short duration.Temporary overvoltages (TOV) may occur due to a sudden load release of generators and linesor line-to-earth faults. The duration of the TOV depends on the structure of the system and canlast for up to a half an hour, or even longer in the case of an isolated neutral system.Depending on the duration of the TOV and its probability of occurrence the combined effect ofTOV and insulator pollution may have to be considered. CIGRE 158 [1] gives information on thissubject.
• Imposed performance requirementsSome customers may require performance guarantees for outdoor insulation with regard toavailability, maintainability and reliability. This may be specified, for example, as the maximumnumber of pollution flashovers allowed per station, or per 100 km line length, over a given time.Such requirements may also include a maximum outage time after a flashover.In addition to the insulator dimensioning according to the site conditions, these demands couldbecome the controlling factor for the insulator parameters.
• Clearances, imposed geometry and dimensionsThere could be several cases, or a combination thereof, where special solutions for insulationtypes and dimensions are required.
Examples are:
• compact lines;• unusual position of an insulator;• unusual design of towers and substations;• Insulated conductors;• lines or substations with a low visual impact.

36/187/CD14
8 Environmental conditions
8.1 Identification of types of pollution
There are two main basic types of insulator pollution that can lead to flashover:
Type A - Solid-layer type: where solid pollution with a non-soluble component is deposited ontothe insulator surface. This deposit becomes conductive when wetted. This type of pollution can bebest characterised by ESDD and NSDD measurements.
Type B - Salt-fog type: where liquid electrolytes are deposited on the insulator with very little or nonon-soluble components. This type of pollution can be best characterised by conductance orleakage current measurements.
Combinations of the two types can arise.
Annex A gives a short description of the pollution flashover mechanisms for type A and type Bpollution.
8.1.1 Type A pollution
Type A pollution is most often associated with inland, desert or industrially polluted areas. Solid-layer type A pollution is classified into two main categories, namely active pollution that forms aconductive layer, and inert pollution that forms a binding layer for the conductive pollution. Thesecategories are described below.
• Active pollution:Active pollution is subdivided into conductive pollution (which is permanently conductive e.g.pollution with metallic conductive particles), high solubility salts (e.g. salts that dissolve readilyinto water), and low solubility salts (that need a large volume of water to dissolve). Activepollution is measured in terms of an Equivalent Salt Deposit Density (ESDD) in mg/cm2.
• Inert pollutionExamples of inert pollution are dust, sand, clay, oils etc. Inert pollution is measured in terms ofNon-soluble Deposit Density (NSDD) in mg/cm2.
Reference [1] gives more information on the influence of types of inert and active materials.
Type A pollution can also arise in coastal areas in cases where a dry salt layer builds up and thenrapidly becomes wetted by dew, mist, fog or drizzle.
Examples of possible sources of Type A insulator pollutants are given below.
• The ground, such as salt pans or some deserts;• Roads and railways;• Factories emitting contaminants;• Mining activities that produce dust-containing substances such as gypsum;• Agricultural activities such as crop spraying or ploughing;• The sea;• Bird droppings.

36/187/CD15
8.1.2 Type B pollution
Type B pollution is most often associated with coastal areas where salt water or conductive fog isdeposited onto the insulator surface.
Examples of possible sources of Type B insulator pollutants are given below.
• The sea;• Factories emitting gaseous contaminants such as SO2 that can dissolve to form conductive
layers during acid rain conditions;• Road salting.
8.2 Pollution SeverityPollution severity at a site (SPS) is expressed in terms of:
ESDD and NSDD for Type A pollution;Site Equivalent Salinity (SES) for Type B pollution.
Pollution severity on naturally polluted insulators is expressed in terms of:ESDD and NSDD for Type A pollution;Surface conductivity for Type B pollution.
NOTE In some cases ESDD measurements can be used for type B pollution.
Pollution severity in artificial pollution tests on insulators is expressed in terms of:SDD and NSDD for solid layer methods;Fog salinity (kg/m³) for salt-fog methods.
9 Evaluation of site pollution severity
9.1 Site pollution severity measurement
The Site Pollution Severity (SPS) is the maximum value(s) of either ESDD and NSDD, or SES,recorded over an appreciable period of time – i.e. one or more years – on a vertically mountedreference insulator.
If rain occurs during this measuring period, the measurements should be repeated at appropriateintervals to determine the effect of natural washing; SPS is then the largest value recorded duringthis series of measurements.
NOTE 1 Even if the highest values of ESDD and NSDD do not occur at the same time, then SPS is – nonetheless – takenas the combination of these highest values.
NOTE 2 When there is no natural washing during the measuring period, the maximum value of ESDD and NSDD can beestimated from the plot of deposit density as a function of the logarithm of time.
The application of this guide is directly related to the knowledge, or estimation, of the pollutionseverity of the site where the insulators are to be installed.
The evaluation of the pollution severity can be made with a decreasing degree of confidence :
1) from measurements in situ;2) from information on the behaviour of insulators from lines and substations already in service
on or close to the site (see annex F);3) from simulations that calculate the pollution level from weather and other environmental
parameters (See CIGRE 158 [1]);4) If not otherwise possible, qualitatively from indications given in table 3.

36/187/CD16
For measurements in situ, different methods are generally used. They are :
• either,ESDD and NSDD on the insulator surface of reference insulators (see annex B) for Type Apollution sites;
orSES from on-site current/surface conductance of reference insulators or a monitor (seeannex B) for Type B pollution sites;
• volume conductivity and sediment analysis for the pollutant collected by means of directionalgauges (see annex D);
• total number of flashovers of insulators of various lengths;• leakage current of sample insulators.The first three methods do not require expensive equipment and can be easily performed. Thevolume conductivity method gives no direct information by itself on the frequency and on theseverity of the contamination events on a natural site. The ESDD/NSDD method characterises thepollution severity of the site. Information on wetting should be separately obtained.
The accuracy of all these methods depends upon the frequency of measurement and the duration ofthe study.
The method based on total flashovers needs expensive test facilities. Reliable information can beobtained from test insulators having a length close to the projected length and flashing over at avoltage near the actual operating voltage.
The last two methods, which need a power source and special recording equipment, have theadvantage that the effects of pollution are continuously monitored. They have been developed toassess the rate of pollution build-up. When related to test data, they can be used to indicate thatthe pollution is still at a safe level or to signal that washing or another palliative is required. Thesetwo methods allow direct determination of the minimum USCD necessary for the tested insulators atthe site.
When measurements are carried out on reference insulators it can be very useful to includeinsulators with other profiles and orientations in order to study the deposit and self-cleaningmechanisms for the site. This information can then be used to refine the choice of an appropriateprofile.
Pollution events are often seasonal and related to the climate; therefore a measurement period of atleast one year is necessary to take into account any seasonal effects. Longer periods may benecessary to take exceptional pollution events into account or to identify trends. Equally it may benecessary to measure over at least three years for arid areas (see 10.3.2).
9.2 Site pollution severity classes
For the purposes of standardisation, five classes of pollution characterising the site severity arequalitatively defined, from very light pollution to very heavy pollution as follows:
a – Very lightb – Lightc – Mediumd – Heavye – Very heavy.
NOTE These letter classes do not correspond directly to the previous number classes of IEC 60815:1986.
For type A pollution, figures 2 and 3 show the ranges of ESDD/NSDD values corresponding to eachSPS class for the reference cap and pin and long rod insulators respectively. These values arededuced from field measurements, experience and pollution tests. The values are the maximumvalues that can be found from regular measurements taken over a minimum one year period.
NOTE Separate figures are given for the two types of reference insulator, since in the same environment they do notpick up the same quantity of pollution.
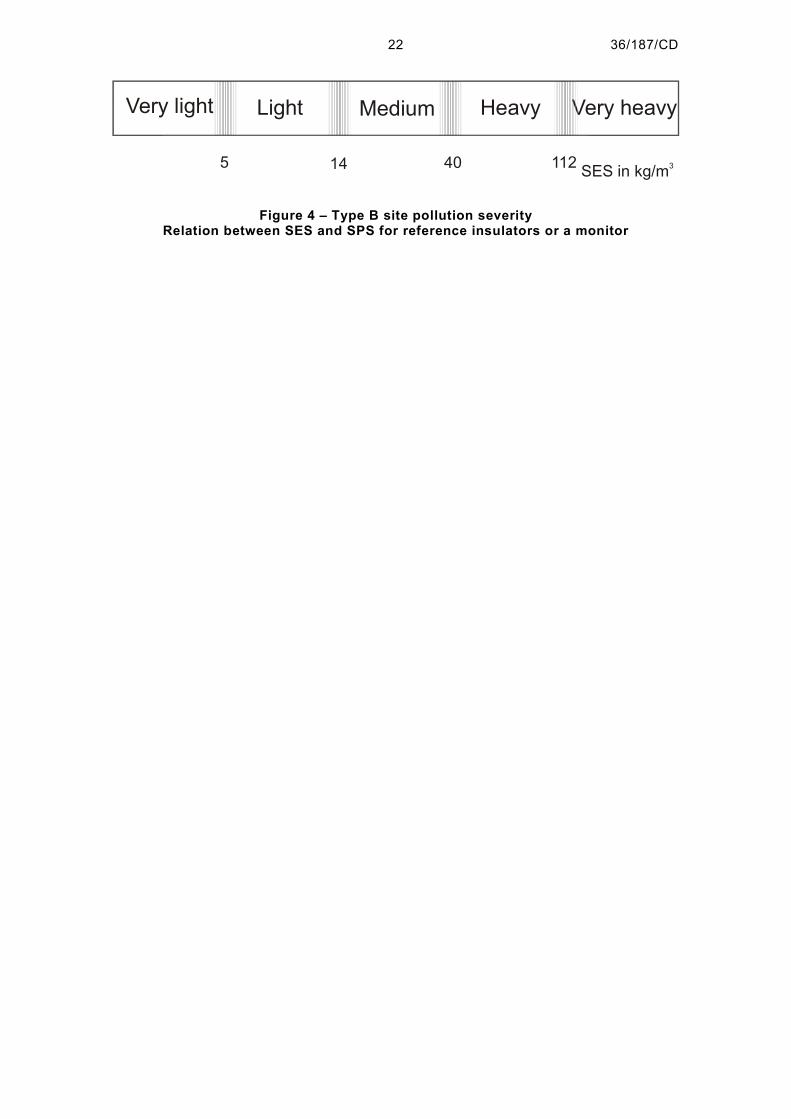
For type B pollution, figure 4 shows the correspondence between SES measurements and SPSclass for both types of reference insulator.
36/187/CD17
The transition from SPS class to another is not abrupt, hence the boundary between each class infigures 2 to 4 is shaded.
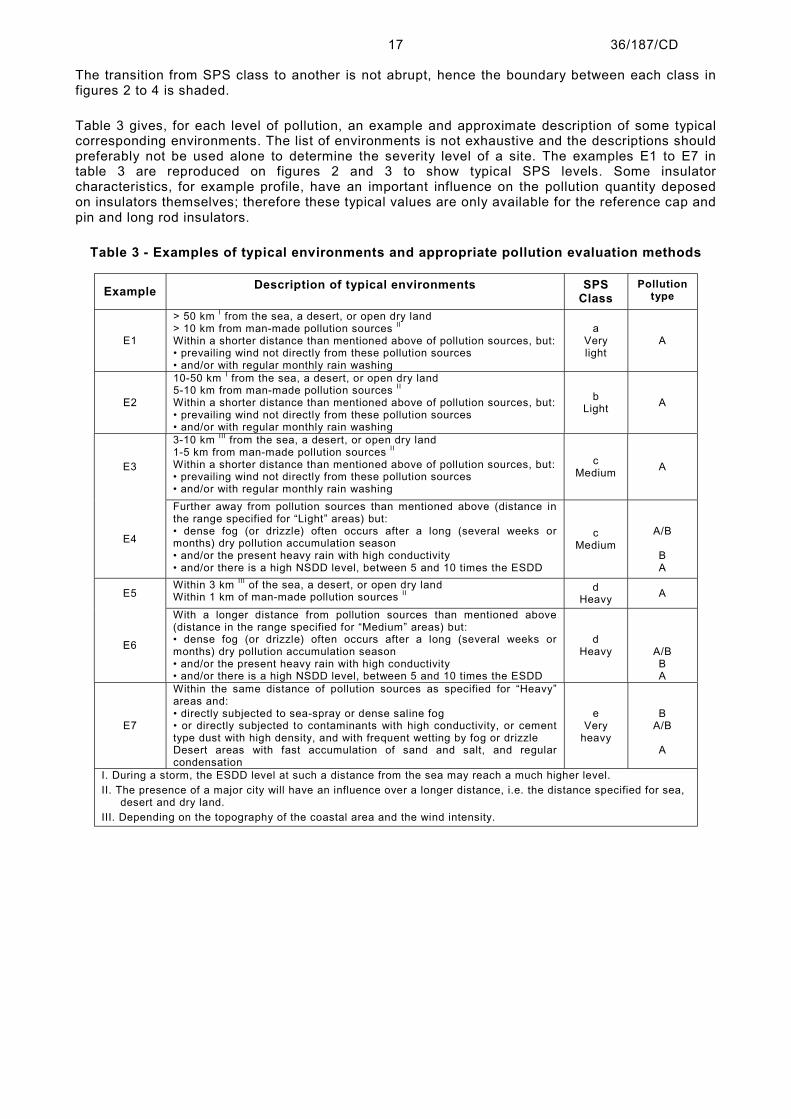
Table 3 gives, for each level of pollution, an example and approximate description of some typicalcorresponding environments. The list of environments is not exhaustive and the descriptions shouldpreferably not be used alone to determine the severity level of a site. The examples E1 to E7 intable 3 are reproduced on figures 2 and 3 to show typical SPS levels. Some insulatorcharacteristics, for example profile, have an important influence on the pollution quantity deposedon insulators themselves; therefore these typical values are only available for the reference cap andpin and long rod insulators.
Table 3 - Examples of typical environments and appropriate pollution evaluation methods
Example Description of typical environments SPSClass
Pollutiontype
E1
> 50 km I from the sea, a desert, or open dry land> 10 km from man-made pollution sources II
Within a shorter distance than mentioned above of pollution sources, but:• prevailing wind not directly from these pollution sources• and/or with regular monthly rain washing
aVerylight
A
E2
10-50 km I from the sea, a desert, or open dry land5-10 km from man-made pollution sources II
Within a shorter distance than mentioned above of pollution sources, but:• prevailing wind not directly from these pollution sources• and/or with regular monthly rain washing
bLight A
E3
3-10 km III from the sea, a desert, or open dry land1-5 km from man-made pollution sources II
Within a shorter distance than mentioned above of pollution sources, but:• prevailing wind not directly from these pollution sources• and/or with regular monthly rain washing
cMedium A
E4
Further away from pollution sources than mentioned above (distance inthe range specified for “Light” areas) but:• dense fog (or drizzle) often occurs after a long (several weeks ormonths) dry pollution accumulation season• and/or the present heavy rain with high conductivity• and/or there is a high NSDD level, between 5 and 10 times the ESDD
cMedium
A/B
BA
E5Within 3 km III of the sea, a desert, or open dry landWithin 1 km of man-made pollution sources II d
Heavy A
E6
With a longer distance from pollution sources than mentioned above(distance in the range specified for “Medium” areas) but:• dense fog (or drizzle) often occurs after a long (several weeks ormonths) dry pollution accumulation season• and/or the present heavy rain with high conductivity• and/or there is a high NSDD level, between 5 and 10 times the ESDD
dHeavy A/B
BA
E7
Within the same distance of pollution sources as specified for “Heavy”areas and:• directly subjected to sea-spray or dense saline fog• or directly subjected to contaminants with high conductivity, or cementtype dust with high density, and with frequent wetting by fog or drizzleDesert areas with fast accumulation of sand and salt, and regularcondensation
eVery
heavy
BA/B
A
I. During a storm, the ESDD level at such a distance from the sea may reach a much higher level.II. The presence of a major city will have an influence over a longer distance, i.e. the distance specified for sea,
desert and dry land.III. Depending on the topography of the coastal area and the wind intensity.

36/187/CD18
10 Insulation selection and dimensioning
10.1 General description of the process
The overall process of insulation selection and dimensioning can be summarised as follows:
• Determination of the appropriate approach A, B or C as a function of available knowledge, timeand resources;
• Collection of the necessary input data, notably whether a.c. or d.c. energisation, system voltage,insulation application type (line, post, bushing etc.);
• Collection of the necessary environmental data, notably site pollution severity and class;
• Preliminary choice of possible candidate insulators suitable for the environment (see clause10.2);
• Determination of the basic Unified Specific Creepage Distance for the insulator types andmaterials, either using the indications in the relevant parts 2 to 5 of this Publication, or fromservice or test station experience in the case of Approach A;
• Modification, where necessary, of the basic USCD by factors depending on the size, profile,orientation etc. of the candidate insulator;
• Verification of the dimensioning, in the case of Approach B, by laboratory tests (see annex E).
10.2 General guidance on profiles
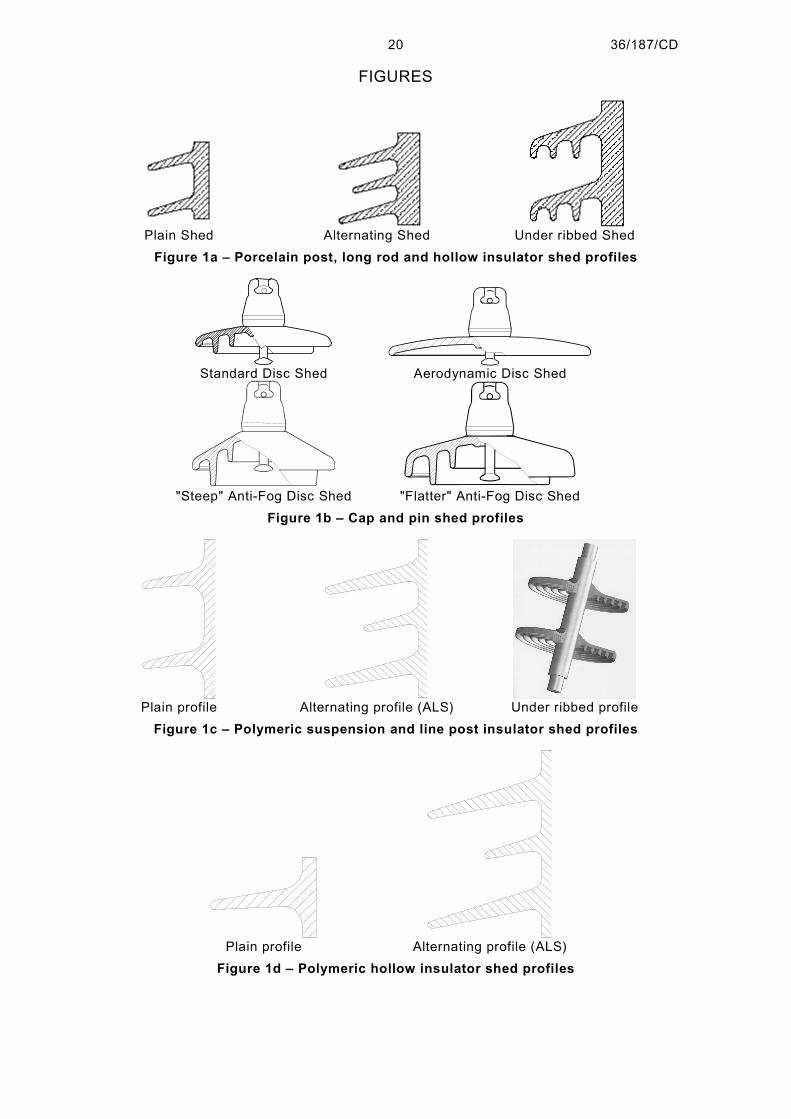
See figure 1 for typical profiles.
Different types of insulator and even different orientations of the same insulator type mayaccumulate pollution at different rates in the same environment. In addition, variations in the natureof the pollutant may make some shapes of insulator more effective than others. A condensed guideto the selection of profile is provided in the following.
Aerodynamic or open profiles prove to be beneficial in areas where the pollution is deposited ontothe insulator by wind, such as deserts, heavily polluted industrial are as or coastal areas whichare not directly exposed to salt spray. This type of profile is especially effective in areas that arecharacterised by extended dry periods. Open profiles are also accessible for easy cleaning undermaintenance.
The use of steep anti fog profiles or shed profiles with deep under-ribs, are beneficial in areasexposed to a salt water fog or spray, or to other pollutants in the dissolved state. These profilesmay also be effective in areas with a particulate pollution precipitation containing slow dissolvingsalts.
More recent flatter anti-fog profiles with fewer or shallower under-ribs can be beneficial in areas ofheavy industrial pollution, notably where string length is limited; however deep under-ribs should beavoided on horizontal insulators.
Alternating long and short sheds are beneficial in areas where heavy wetting can occur.
Standard profiles are effective for use in 'very light' to 'medium' polluted areas where a longcreepage distance or aerodynamically effective profile is not required.
More advice on profiles is given in the relevant further parts of this publication.

36/187/CD19
10.3 Considerations for exceptional or specific applications or environments
10.3.1 Hollow core insulators
Polymeric and porcelain hollow core insulators are used for apparatus insulators, bushings and alsoas station posts. They are used, for example, as housings for capacitors, surge arresters, breakerchambers and supports, cable terminations, wall bushings, transformer bushings, measuringtransformers and optical measuring devices.
The pollution performance of complete hollow core insulators is not only a function of profile andleakage distance but also function of uniformity of voltage distribution. Care should be taken todesign accordingly, especially at lower pollution levels where the effect of non-uniformity is morecritical and can reduce flashover performance and also increase the risk of puncture.
10.3.1.1 Internal components
The presence of a conductor, shielding or grading devices within the insulator housing can greatlyaffect the electrical performance of the assembly. In addition to the known behaviour difference ofempty housings and complete units during impulse, dry or wet flashover tests [1], there are similardifferences when subjecting empty and complete housings to pollution tests.
The best performance (high flashover voltage and low risk of puncture) is generally obtained onhousings with a uniform axial and radial voltage distribution, typically on devices with capacitivegrading.
The effect of non-uniformity of voltage distribution is more evident at lower pollution levels (ESDD0,01 to 0,03 mg/cm²). The weaker resistive leakage currents cannot compensate for, correct orrectify sufficiently, the non-uniformity of voltage distribution.For higher pollution levels, the resistive surface currents become more dominant and thereforereduce the effect of non-uniformity of voltage distribution. This effect is observed during laboratorytests, where similar results are obtained on both empty insulator housings and complete ones.
10.3.1.2 Non-uniform wetting and uneven pollution deposit
In some positions the operating temperature of bushings can induce uneven wetting of the insulatorby simple drying. Furthermore, uneven pollution deposits can occur in natural conditions. Therefore,even at higher pollution levels, the observed cancellation of non-uniform voltage distribution effectmight not be as effective.
10.3.2 Arid areas
Arid areas pose particular difficulties when selecting and dimensioning insulators. The long dryspells may lead to extreme ESDD and NSDD levels even in areas that are not in the direct vicinityof the coast. This is because the surrounding sand may have a high salt content.
The use of aerodynamic "self-cleaning" profiles can help reduce the impact of the pollutiondeposition in such cases as can the use of polymeric insulators. Equally, a semi-conducting glazeon porcelain insulators provides a continuous flow of current of about 1 mA, which helps to avoiddew formation.
36/187/CD20
FIGURES
Plain Shed Alternating Shed Under ribbed ShedFigure 1a – Porcelain post, long rod and hollow insulator shed profiles
Standard Disc Shed Aerodynamic Disc Shed
"Steep" Anti-Fog Disc Shed "Flatter" Anti-Fog Disc ShedFigure 1b – Cap and pin shed profiles
Plain profile Alternating profile (ALS) Under ribbed profileFigure 1c – Polymeric suspension and line post insulator shed profiles
Plain profile Alternating profile (ALS)Figure 1d – Polymeric hollow insulator shed profiles

36/187/CD21
Very light
Light
Medium
Heavy
Very heavy
ESDD mg/cm²
NSD
D m
g/cm
²
Figure 2 – Type A site pollution severityRelation between ESDD/NSDD and SPS for the reference cap and pin insulator
Verylight
Light
Medium
Heavy
Very heavy
ESDD mg/cm²
NSD
D m
g/cm
²
Figure 3 – Type A site pollution severityRelation between ESDD/NSDD and SPS for the reference long rod insulator
36/187/CD22
Very light Light Medium Heavy Very heavy
5 14 40 112 SES in kg/m3
Figure 4 – Type B site pollution severityRelation between SES and SPS for reference insulators or a monitor
36/187/CD23
Annex A Pollution Flashover mechanisms
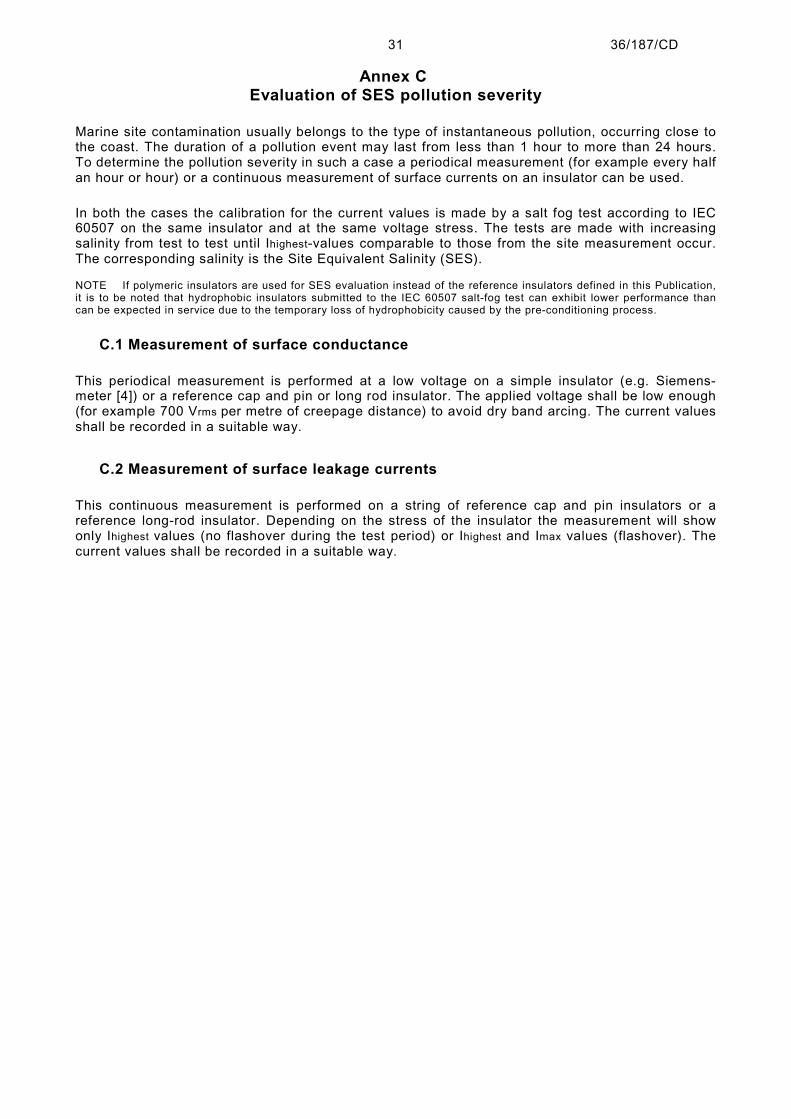
A.1 Description of the pollution flashover mechanism under type A pollution
For ease of understanding the pre-deposit pollution (type A) flashover process, it is divided into sixphases described separately below. In nature these phases are not distinct but may tend to merge.
The pollution flashover process of insulators is greatly affected by the insulator’s surface properties.Two surface conditions are recognised: either hydrophilic or hydrophobic. A hydrophilic surface isgenerally associated with glass and ceramic insulators whereas a hydrophobic surface is generallyassociated with polymeric insulators, especially silicone rubber. Under wetting conditions - such asrain, mist etc. - hydrophilic surfaces will wet out completely so that an electrolyte film covers theinsulator. In contrast, water beads into distinct droplets on a hydrophobic surface under suchwetting conditions.
The pollution flashover process is also significantly affected by the voltage waveform, a.c. or d.c. Ithas been amply demonstrated experimentally that, for the same pollution severity, the peak a.c.withstand voltage far exceeds the corresponding value under d.c. conditions. Arc-propagationacross the insulator surface can take several cycles and, therefore, the arc is subject to anextinction and re-ignition process at around current zero.
A complicating feature is the breakdown of the air between neighbouring points of the insulatorprofile (e.g. between ribs or sheds) which reduces the flashover performance by shorting out someof the insulator surface. In addition, drops or streams of water may facilitate this reduction inperformance.
The process is described below as encountered on hydrophilic surfaces, such as ceramic materials.
Phase 1: The insulator becomes coated with a layer of pollution. If the pollution is non-conductive(high resistance) when dry, some wetting process (phase 2) is necessary before flashover willoccur.
Phase 2: The surface of the polluted insulator becomes wetted. The wetting of an insulator canoccur in the following ways: by moisture absorption, condensation and precipitation. Heavy rain(precipitation) may wash away the electrolytic components of part or the entire pollution layerwithout initiating other phases in the breakdown process, or it may promote flashover by bridgingthe gaps between sheds. Moisture absorption occurs during periods of high relative humidity(>75%RH) when the temperature of the insulator and ambient air are the same. Condensationoccurs when the moisture in the air condenses on a surface whose temperature is lower than thedew point. This condition usually occurs at sunrise or just before.
Phase 3: Once an energised insulator is covered with a conducting pollution layer, surface leakagecurrents flow and their heating effect starts within a few power frequency cycles to dry out parts ofthe pollution layer. This occurs where the current density is highest i.e. where the insulator is at itsnarrowest. These result in the formation of what are known as dry bands.
Phase 4: The pollution layer never dries uniformly, and in places the conducting path becomesbroken by dry bands which interrupt the flow of leakage current.

36/187/CD24
Phase 5: The line-to-earth voltage appearing across dry bands (which may be only a fewmillimetres wide) causes air breakdown and the dry bands are bridged by arcs which are electricallyin series with the resistance of the undried and conductive portion of the pollution layer. Thiscauses a surge of leakage current each time the dry bands on an insulator spark over.
Phase 6: If the resistance of the still wet and conductive part of the pollution layer is low enough,the arcs bridging the dry bands are sustained and will continue to extend along the insulator,bridging more and more of its surface. This in turn decreases the resistance in series with the arcs,increasing the current and permitting them to bridge even more of the insulator surface. Ultimately,it is completely bridged and a line-to-earth fault (flashover) is established.
One can summarise the whole process as an interaction between the insulator, pollutants, wettingconditions, and applied voltage (and source impedance in laboratory conditions).The likelihood of flashover increases with higher leakage current, and it is mainly the surface layerresistance that determines the current magnitude. It can therefore be concluded that the surfacelayer resistance is the underlying factor determining whether an insulator will flash over or not, interms of the above model.
Pollution flashover can be a problem in very dry areas such as deserts. The explanation often lieswith the “thermal lag” at sunrise between the temperature of the surface of the insulator and therapidly rising temperature of the ambient air. This difference in temperature need only be a fewdegrees centigrade for substantial condensation to take place, even at fairly low values of relativehumidity. The thermal capacity and thermal conductivity of the insulating material control the rate atwhich its surface warms up.
More information on pollution flashover processes and models is available in CIGRE 158 [1].
A.2 Description of the pollution flashover mechanism under type B pollution
A.2.1 Conductive Fog
Type B ‘Instantaneous pollution’ refers to a contamination of high conductivity which quicklydeposits on insulator surfaces, resulting in the condition where the insulator changes from anacceptably clean, low conductive state to flashover in a short (< 1 hour) time and then returns to alow conductive state when the event has passed.
For ease of understanding the instantaneous pollution flashover the same process as described inA.1 applies. However, the instantaneous pollution is normally deposited as a highly conductive layerof liquid electrolyte, e.g. salt spray, salt fog or industrial acid fog, thus the process begins at phase3 above and can progress rapidly to phase 6. In nature these phases are not distinct but they domerge. These only refer to hydrophilic surfaces. Areas most at risk are those situated closechemical plants, or areas close to the coast with a known history of temperature inversions.
A.2.2 Bird Streamers
A particular case of type B pollution is a bird streamer. This is a type of bird excrement, which, onrelease, forms a continuous, highly (20-40 kΩ/m) conductive stream of such length that the air gapis sufficiently reduced to cause flashover. In this case, the insulator geometry and characteristicsplay little or no role and the best solution may be to fit dissuasive devices or alternate perches

36/187/CD25
A.3 The pollution flashover mechanism on hydrophobic surfaces
Due to the dynamic nature of a hydrophobic surface and the resulting complex interaction withpollutants - both conducting and non-conducting - and wetting agents, there exists today nogenerally adopted model of pollution flashover for hydrophobic insulator surfaces However, aqualitative picture for the pollution flashover mechanism is emerging which involves such elementsas the migration of salt into water drops, water drop instability, formation of surface liquid filamentsand discharge development between filaments or drops when the electric field is sufficiently high.
However, in service the hydrophobic materials are submitted to a dynamic process of pollutiondeposition, wetting, localised discharges or high electric field which can combine to cause parts orthe entire surface to become temporarily more hydrophilic. Thus much of the physics of theflashover process of hydrophilic surfaces also applies, albeit locally or for limited periods of time, tonominally "hydrophobic" materials or surfaces.
36/187/CD26
Annex B Measurement of ESDD and NSDD
B.1 Introduction
When anti-pollution design of the insulator is made, it is indispensable to determine pollutiondegree. The pollution degree is generally determined by measuring equivalent salt deposit density(ESDD) on the insulators which are removed from the existing transmission lines and/or field testingstations. In addition to ESDD, non-soluble material deposit density (NSDD) should be measured,especially in case that much dust or sand is estimated to accumulate on the insulator surface insuch an area as desert or industrial factories. This annex describes how to measure ESDD andNSDD, and how to make chemical analysis of the pollutants.
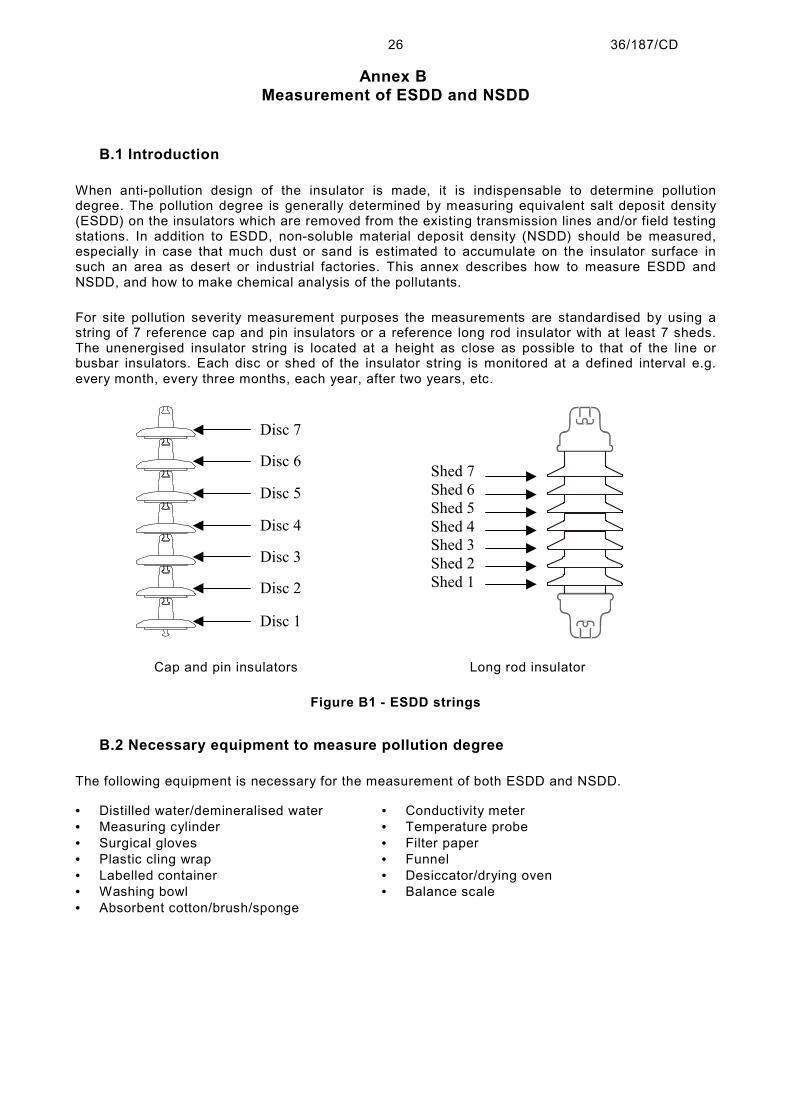
For site pollution severity measurement purposes the measurements are standardised by using astring of 7 reference cap and pin insulators or a reference long rod insulator with at least 7 sheds.The unenergised insulator string is located at a height as close as possible to that of the line orbusbar insulators. Each disc or shed of the insulator string is monitored at a defined interval e.g.every month, every three months, each year, after two years, etc.
Disc 7
Disc 6
Disc 5
Disc 4
Disc 3
Disc 2
Disc 1
Shed 3 Shed 2 Shed 1
Shed 4 Shed 5 Shed 6 Shed 7
Cap and pin insulators Long rod insulator
Figure B1 - ESDD strings
B.2 Necessary equipment to measure pollution degree
The following equipment is necessary for the measurement of both ESDD and NSDD.
• Distilled water/demineralised water• Measuring cylinder• Surgical gloves• Plastic cling wrap• Labelled container• Washing bowl• Absorbent cotton/brush/sponge
• Conductivity meter• Temperature probe• Filter paper• Funnel• Desiccator/drying oven• Balance scale

36/187/CD27
B.3 Pollution collection methods for ESDD and NSDD measurement
The surfaces of the insulator should not be touched to avoid any loss of pollution.
Wear clean surgical gloves.
A container, a measuring cylinder, etc. shall be washed well enough to remove any electrolytesprior to the measurement.
B.3.1 Procedure using a swab technique• Distilled water of 100 - 300 cm3 (or more if required) shall be put into labelled containers and
absorbent cotton shall be immersed into the water (other tools such as a brush or a sponge maybe used). The conductivity of the water with the immersed cotton shall be less than 0.001 S/m.
• The pollutants shall be wiped off separately from the top and the bottom surfaces of a cap andpin type insulator with the squeezed cotton. In the case of a long-rod or a post insulator,pollutants shall usually be collected from a part of the shed as shown in figure B2.
• The cotton with pollutants shall be put back into the labelled containers. The pollutants are thendissolved into the water by shaking and squeezing the cotton in the water.
• Wiping shall be repeated until no further pollutants remain on the insulator surface. If pollutantsremain even after wiping several times, pollutants shall be removed by a spatula and be put intothe water containing the pollutants.
• Attention should be taken not to lose any water. That is, the quantity shall not be changed verymuch before and after collecting pollutants.
Figure B2 - Wiping of pollutants on insulator surface
B.3.2 Procedure using washing technique
• Cover the cap and pin respectively with plastic cling wrap without covering the insulator surface.• Ensure that the bowl in which the discs are to be washed in is clean.• Measure down 500 - 1000 cm3 of distilled water (<0.001 S/m) and pour into the bowl.• Place the test insulator on its cap in the water and wash the non-ribbed surface with gentle
hand strokes up to the rim.• Gently shake off any remaining water remove the insulator from bowl and pour the water into a
labelled container. Take care that all deposits are removed from the bowl.• Rinse and clean the bowl.• Measure down 500 - 1000 cm3 of distilled water (<0.001 S/m) and pour into bowl.• Place the same insulator as mentioned above on its cap in the bowl and gently wash pollution
off the under surface with gentle hand strokes.• Pour the water in second labelled container taking care again that no deposits remain in the
bowl.
B.4 Determining ESDD and NSDD
B.4.1 ESDD calculations
The conductivity and the temperature of the water containing the pollutants shall be measured. Themeasurements are made after enough stirring of the water. A short stirring time, e.g., a fewminutes, is required for high solubility pollutants. The low solubility pollutants generally requirelonger stirring time, e.g., 30 - 40 minutes.

36/187/CD28
The conductivity correction shall be made using the formula (1). This calculation is based on Clause16.2 and Clause 7 of IEC 60507.
[ ])20(120 −−= θσσ θ b (1)
where:
θ is the solution temperature (C).
θσ is the volume conductivity at temperature of θ C (S/m).
20σ is the volume conductivity at temperature of 20C (S/m).
b is the factor depending on temperature of θ , as obtained by the formula (2), and asshown in figure B3.
242538 10544,310272,810032,110200,3 −−−− ×+×−+×+×−= θθθb (2)
0,015
0,02
0,025
0,03
0,035
5 15 25 35
θ (solution temperature), C
b (F
acto
r dep
endi
ng o
n te
mpe
ratu
re θ
)
Figure B3 - Value of b

36/187/CD29
The ESDD on the insulator surface shall be calculated by the formulas (3) and (4). This calculationis based on Clause 16.2 of IEC 60507. The relation between σ20 and Sa (Salinity, kg/m3) is shown infigure B4.
Sa = 03,120 )7,5( σ (3)
ESDD = AVSa • (4)
where:
20σ is the volume conductivity at temperature of 20C (S/m).ESDD is Equivalent salt deposit density (mg/cm²).V is the volume of distilled water (cm³).A is the area of the insulator surface for collecting pollutants (cm²).
0,001
0,01
0,1
1
0,001 0,01 0,1
σ20, S/m
Sa, k
g/m
3
Figure B4 - Relation between 20σ and Sa
NOTE 1 For a close ESDD measurement in the range of 0.001 mg/cm2, it is recommended to use very low conductivitywater, e.g., less than a few 10-4 S/m. Normal distilled/demineralized water less than 0.001 S/m also can be used for thispurpose by subtracting the equivalent salt amount of the water itself from the measured equivalent salt amount of thewater containing pollutants.
NOTE 2 Quantity of the distilled/demineralized water depends on kind and amount of pollutants. Large quantity of water isrecommended for measurements of very heavy pollution or low solubility pollutants. In practice, 2-10 litres of water per m2
of the cleaned surface can be used. In order to avoid underestimating the amount of pollutants, the quantity of the waterwould be so increased to have the conductivity less than around 0.2 S/m. If very high conductivity is measured, theremight be some doubt of remaining pollutants not dissolved due to small amount of water.
NOTE 3 Stirring time before conductivity measurement depends on kind of pollutants. For low solubility pollutants,conductivity is measured at some interval with time up to about 30 - 40 minutes and is determined when the measuredvalues level off. To dissolve pollutants quickly, special methods such as boiling method and ultrasonic method can also beused.

36/187/CD30
B.4.2 NSDD calculations
The water containing pollutants after measuring ESDD shall be filtered out by using a funnel andpre-dried and weighed filter paper (grade GF/A 1,6 µm or similar).
The filter paper containing pollutants (residuum) shall be dried, and then be weighed as shown infigure B5.
The NSDD shall be calculated by the formula (5).
NSDD = AWW if /)(1000 − (5)
where:
NSDD is non-soluble material deposit density (mg/cm2).
fW is the weight of the filter paper containing pollutants under dry condition (g).
iW is the initial weight of the filter paper under dry condition (g).A is the area of the insulator surface for collecting pollutants (cm2).
Figure B5 - Procedure of measuring NSDD
B.5 Chemical analysis of pollutants
Quantitative chemical analysis can be made on pollutants for close examination of pollutionconditions. The analysis can be useful to identify chemical components of soluble salts. Chemicalanalysis of soluble salts is made by using solution after ESDD measurement by means of ion-exchange chromatography(IC), inductive coupled plasma-optical emission analyticalspectrometry(ICP), etc. The analysis results can show amounts of positive ions, e.g. Na+, Ca2
+, K+,Mg2
+, and negative ions, e.g. Cl-, SO4-, NO3
-.
36/187/CD31
Annex C Evaluation of SES pollution severity
Marine site contamination usually belongs to the type of instantaneous pollution, occurring close tothe coast. The duration of a pollution event may last from less than 1 hour to more than 24 hours.To determine the pollution severity in such a case a periodical measurement (for example every halfan hour or hour) or a continuous measurement of surface currents on an insulator can be used.
In both the cases the calibration for the current values is made by a salt fog test according to IEC60507 on the same insulator and at the same voltage stress. The tests are made with increasingsalinity from test to test until Ihighest-values comparable to those from the site measurement occur.The corresponding salinity is the Site Equivalent Salinity (SES).
NOTE If polymeric insulators are used for SES evaluation instead of the reference insulators defined in this Publication,it is to be noted that hydrophobic insulators submitted to the IEC 60507 salt-fog test can exhibit lower performance thancan be expected in service due to the temporary loss of hydrophobicity caused by the pre-conditioning process.
C.1 Measurement of surface conductance
This periodical measurement is performed at a low voltage on a simple insulator (e.g. Siemens-meter [4]) or a reference cap and pin or long rod insulator. The applied voltage shall be low enough(for example 700 Vrms per metre of creepage distance) to avoid dry band arcing. The current valuesshall be recorded in a suitable way.
C.2 Measurement of surface leakage currents
This continuous measurement is performed on a string of reference cap and pin insulators or areference long-rod insulator. Depending on the stress of the insulator the measurement will showonly Ihighest values (no flashover during the test period) or Ihighest and Imax values (flashover). Thecurrent values shall be recorded in a suitable way.

36/187/CD32
Annex D Directional Dust Deposit Gauge Measurements
D.1 Introduction
Four dust gauges, each gauge set to one of the four cardinal points of the compass, are used tocollect the pollution particles carried in the atmosphere. The pollution is collected in the four plasticcontainers attached to the bottom of the gauges. At monthly intervals these containers are removedand the contents collected are mixed with 500 ml of distilled water. The conductivity of this solutionis measured and the pollution index is defined as the mean of the conductivities of the four gaugesexpressed in µS/cm and normalised to a 30-day interval.
The advantage of this technique is its simplicity and the fact that it can be used at an unenergisedsite without insulators or facilities other than those required for the mounting of the gauges.
40 mm
351 mm 500 mm
30 mm
Figure D1: Directional Dust Deposit Gauges
The nominal dimensions are a 40mm wide slot with 20mm radii at each end. The distance betweenthe centres of the radii is 351mm. (The overall slot length thus being 391mm). The tube is at500mm long with 75mm outside diameter. The distance from the top of the tube to the top of theslot is 30mm. The tubes are mounted with the bottom of the slot approximately 3 metres from theground. This keeps the gauge out of reach of casual tampering but the jars can be easily and safelychanged.
The major disadvantage with the dust gauge is that actual insulators are not used and therefore it isnot possible to assess the self-cleaning properties of insulators and the effect of the shed profile onthe deposition process on the insulator surface. In areas of high rainfall, a higher index can betolerated, whereas in areas of low rainfall but with a high occurrence of fog, the actual severity ishigher than that indicated by the gauges.
36/187/CD33
D.2 Test equipment
• Clip board, pencil and paper: To record raw data results.• Portable ladder: 2.5 metre ladder to reach dust containers.• Spray Bottle: To spray residual pollutants from each dust gauge cylinders into container, using
distilled water.• Measuring Cylinder: To measure 500 ml distilled water to be poured into each container.• Distilled water: Average 3 litres of water per set of containers. Volume conductivity should not
exceed 5µS/cm.• Portable conductivity meter: Values are given in µS/cm and are usually compensated to 20°C. If
the meter is not compensated to 20°C, specify conductivity and temperature readings in report.• Temperature probe: Used to measure temperature of dust gauge solution if conductivity meter is
not compensated to 20°C.• Tap water: Used to clean vertical slots and containers after measurements have been taken.• Paper towels: Used if additional cleaning is necessary.• Thick, black waterproof marker pen: Used to mark location and date of testing on containers.• Extra set of containers: If containers are taken back to the laboratory, a replacement set is
needed, otherwise the current set is cleaned and replaced onto the dust gauge cylinders aftermeasurements have been taken.
D.3 Test procedure
• The gauge slots to which the containers are connected are sprayed with a little distilled water sothat any residual pollutants in each dust gauge cylinder rinses into its container. This preventsany deposit build up from previous months washing into the container when rain occurs.
• Remove the four containers from the slots facing the four dominant wind directions, noting thedate of instalment on the data result sheet
• Pour 500 ml of distilled water into each container and swirl contents to ensure that the solubledeposits are totally dissolved.
• Measure the conductivity of the distilled water, as well as its temperature if the meter is notcompensated to 20°C
• Measure the volume conductivity of the solution in the containers with the hand-held probe andrecord results.
• Record the number of days since the previous test measurement. The typical time interval isbetween 20 days and 40 days
• Wash and clean the vertical slots and containers with tap water after the measurements havebeen taken and install clean containers to the dust gauges.
D.4 Determination of SPS class from DDDG measurements
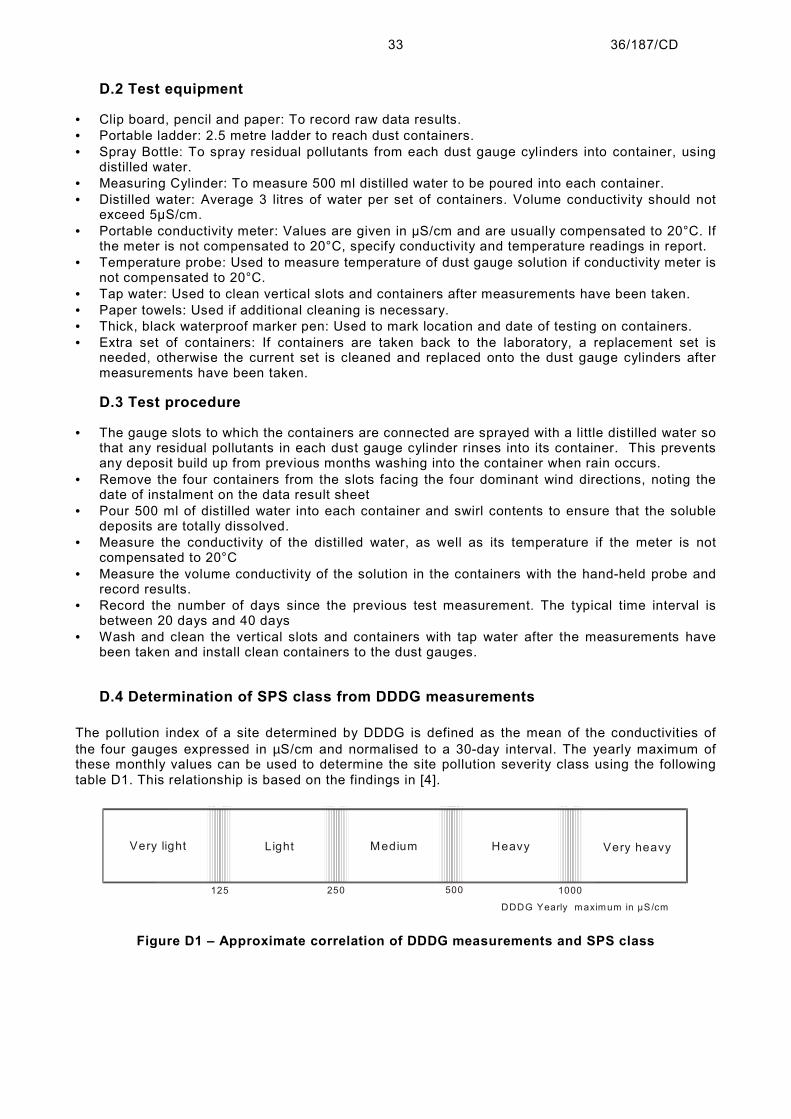
The pollution index of a site determined by DDDG is defined as the mean of the conductivities ofthe four gauges expressed in µS/cm and normalised to a 30-day interval. The yearly maximum ofthese monthly values can be used to determine the site pollution severity class using the followingtable D1. This relationship is based on the findings in [4].
DDDG Yearly maximum in µS/cm
125 250 500 1000
Very light Light Medium Heavy Very heavy
Figure D1 – Approximate correlation of DDDG measurements and SPS class

36/187/CD34
Annex E Use of laboratory test methods
E.1 General outline of the procedure
E.1.1 Introduction
In polluted conditions, insulators are required to continuously withstand the highest system voltagewith an acceptable risk of flashover. In order to specify a laboratory pollution test, it is necessary tospecify both a long duration power frequency co-ordination withstand voltage, as defined in IEC60071-1, and a pollution severity withstand level.
The long duration power frequency co-ordination withstand voltage normally corresponds to thehighest system voltage, for insulators connected phase-to-phase, and this value divided by √3 forinsulators connected phase-to-earth.
The pollution severity withstand level characterises the pollution performance of the insulation whenenergised to the co-ordination withstand voltage. The pollution severity withstand level isdetermined from the site pollution severity with the aid of a set of correction factors (moreinformation in this regard can be found in CIGRÉ guidelines document [2]). This is done in threesteps:
i) The pollution type present and the site pollution severity are determined by assessing thepollution at a site.
ii) The site pollution severity level is corrected for any deficiency or inaccuracy in thedetermination of the SPS. This corrected value is named the co-ordination pollutionseverity withstand level.
iii) The required pollution severity withstand level, which is the severity at which thelaboratory test is performed is derived from the co-ordination pollution severity withstandlevel to compensate for the differences between the actual in-service conditions of theinsulation and those in the standard withstand tests.
The general principles of this process are dealt with in this section while details and guidance onthe choice of values for the correction factors for the various types of energisation and insulator areprovided in the further parts of this publication.
E.1.2 Determination of the Site Pollution Severity and pollution type
The determination of the site pollution severity level is described in clause 9 and annexes B and C.
E.1.3 Determination of the co-ordination pollution severity withstand level
The determination of the co-ordination pollution severity withstand level consists of determining thelowest value of the withstand severity of the insulation which will meet the performance criterionwhen it is subjected to the highest voltage for the equipment.
The co-ordination pollution severity withstand level is obtained by multiplying the site pollutionseverity by a co-ordination factor. The value of the co-ordination factor depends on the accuracy ofthe evaluation of the site pollution severity and whether an empirical or statistical appraisal of thedistribution of the pollution severity, the insulator characteristics and the required performancecriterion are used.

36/187/CD35
E.1.4 Determination of the required pollution severity withstand level
The determination of the required pollution severity withstand level consists of converting the co-ordination pollution severity withstand level to the appropriate conditions for the standard pollutionwithstand test. This is accomplished by multiplying the co-ordination pollution severity withstandlevel by factors which compensate for the differences between the actual in-service conditions ofthe insulation and those in the standard withstand tests.
The factors to be applied shall compensate for:
• Differences in pollution catch of the insulator used for the site pollution severity measurementand the insulator to be tested;
• Differences in the uniformity of the pollution deposit at site and in the test;• Differences in the wetting conditions in service and those during the test;• Differences in energisation of the insulator used for the site pollution severity measurement and
the insulator to be tested;• The differences in the equipment assembly;• The dispersion in the product quality;• The effect of ageing on the pollution catch and wettability of the insulation during the expected
lifetime;• The statistical uncertainty of performing a limited number of tests to verify the required pollution
severity withstand level;• Other influences of importance.
E.2 Use of pollution withstand tests
E.2.1 Standard pollution withstand tests
Standard pollution withstand tests are performed to demonstrate, with a suitable confidence, thatthe insulator can withstand the specified pollution type and severity while energised to the co-ordination withstand voltage.
The relevant test method to be used is selected according to the type of pollution at the site, thetype of insulator and the type of energisation. The tests given in IEC 60507 and IEC 61245 aredirectly applicable to ceramic and glass insulators. These standards are currently not suitable fordirect application to polymeric insulators; in this case it is recommend to refer to the CIGRÉguidelines document [2].
As a general rule, the solid layer test is recommended for type A pollution and the salt-fog test fortype B pollution.
The applicability of the required pollution severity withstand level to a specific site is:
• dependent on whether the test method used can be considered representative of the intendedenvironment and;
• restricted by the approximation and limitations inherent to the chosen laboratory test method.Guidance to the selection of the appropriate laboratory test methods is provided in the further partsof this publication.

36/187/CD36
E.2.2 Additional tests
Since the number of pollution tests performed during a standard pollution withstand test is limited,little to no useful statistical information regarding the actual withstand voltage of the equipment canbe deduced. If such information is required, additional tests can be performed at either a higherpollution level or test voltage when practical. More information in this regard can be found in theCIGRÉ 158 [1].
E.2.3 Alternative tests
The use of non standard, or customised, laboratory pollution test methods may be considered if thesite of interest is not adequately represented by a standard laboratory test method, or if theavailable standard tests do not provide enough statistical information or are regarded as non-costeffective. More information on such methods can be found in CIGRÉ 158 [1].

36/187/CD37
Annex F Example of a questionnaire to collect information on the behaviour of
insulators in polluted areas
Company: Country
Identification of the project and/or location:Line or substation
Contact person,address,fax, telephone, email:
1 – System Data/Requirements (see clause 7 of IEC 60815)
Nominal voltage of the system and highest voltage for equipment
Value and duration of temporary overvoltages
Strategic importance
Date of construction
Type of system
Maintenance (not involvingrefurbishment)
Date of energizing
Cleaning yes/no frequency:
Washing yes/no frequency:
Greasing yes/no frequency:
Overhead lines Substations
Type of tower (include sketch)
Number of circuits
Ground clearance
Type of insulator sets
Insulator protective fittings
Type of apparatus:
Clearances
2 – Environmental and pollution conditions (see clause 8 of IEC 60815)
General information
Map of areas crossed, routing and altitudes of the line
Different climatic zones crossed by the line
Place orientation and altitude of substations (show wall bushing orientation with respect to prevailingwinds)
Climate
Type of climate: temperate, tropical, equatorial, continental…
Time without rainfall, in months
Annual rainfall (mm): Monthly rainfall (if available)
Dominant wind: direction, average speed (km/h): Monthly data (if available)
Dew: yes/no frequency
Fog: yes/no frequency
Humidity: Monthly peak and average (if available)

36/187/CD38
Pollution types
Type A
Sand-based pollution or ground dust (e.g. desert)
Industrial pollution with large amounts of solid deposits (except cement)
Industrial pollution with large amounts of cement (or other slow dissolving salts)
Chemical or industrial pollution, smokes
Agriculture
Type B
Seaborne pollution – small amount of insoluble matter
Saline pollution other than coastal – small amount of insoluble matter
Chemical or industrial pollution, gas, acid rain
Combination of Type A and Type B
Indicate the main components and their relative frequency
Pollution levels (SPS)
SPS Class according to IEC 60815-1
Method used to evaluate SPS
Type of reference insulators, other insulators
Measuring frequency
Duration of study
Yearly maxima of ESDD, NSDD, SES or DDDG measurements (monthly data if available)
Other constraints
Lightning
Seismic activity
Vandalism
3 – Insulator parameters
Approach used to define the insulation
IEC 60815-1 Approach A
IEC 60815-1 Approach B
o With site measurement ?
o Confirming test method/results
IEC 60815-1 Approach C
o With site measurement ?
Overhead lines Substations
Position of string
Type of insulator
Insulator material
Length of string, diameter(s)
Profile
Unitary/total creepage distance
Arcing distance
Position of the insulator
Type of insulator (post, bushing etc.)
Length, diameter(s)
Profile
Total creepage distance
Arcing distance

36/187/CD39
4 – Details of incidents
General information
Date and time
Situation of the tower, apparatus, substation
Meteorological conditions before/during the incident(s):
o Relative humidity
o Rain
o Drizzle
o Fog/sea mist
o Temperature
o Storms
o Wind (direction, average and peak speed)
o Time since last rainfall and incident
o Other
Type of incident and observations
Flashover
Heavy corrosion of metal parts
Puncture, tracking or erosion of the dielectric
Other visible damage
Localisation of damage on the insulator
Any other observations or comments

36/187/CD40
Annex G Bibliographic References
1 CIGRE Taskforce 33.04.01 – “Polluted insulators: A review of current knowledge”, CIGREbrochure N° 158-2000
2 CIGRE Taskforce 33.13.01 – Guidelines for the selection and dimensioning of insulators foroutdoor applications, CIGRE brochure N° ???-2003
3 CIGRE Taskforce 33.13.07 – "Influence of Ice and snow on the flashover performance ofoutdoor insulators Part 1 Effects of Ice", ELECTRA No. 187 December 1999, and Part 2"Effects of Snow", ELECTRA No. 188 February 2000.
4 CIGRE Taskforce 33.04.03 – “Insulator pollution monitoring”, Electra 152, February 1994