iea medium-term market reportseneken.ieej.or.jp/data/4569.pdfchina, brazil, india lead; others grow...
TRANSCRIPT

© OECD/IEA 2011
IEA Medium-Term Market Reports
IEEJ Seminar Tokyo, 20 September 2012
Didier Houssin Director, Energy Markets and Security International Energy Agency
IEEJ:October 2012 All Right Reserved
© OECD/IEA 2012
Introduction to medium term reports
Based on the most recent data available
5 years outlook is important for policy making
Natural gas and renewables are growing fastest
IEEJ:October 2012 All Right Reserved

© OECD/IEA 2012
Gas: global developments
IEEJ:October 2012 All Right Reserved
© OECD/IEA 2012
Key messages – natural gas
Natural gas demand is expected to increase by 576 bcm to reach 3937 bcm by 2017 (2.7%/y) 69% of demand will come from non-OECD countries
With 37% originating from Asian countries
No Golden Age of Gas in Europe
FSU and North America are the largest contributors to global supply
Global gas trade expands by one-third over 2011-17 Trade is shifting to Asia
LNG markets will be tightening over 2012-14
The next wave of LNG exports starts only at end 2014
China becomes the third largest importer after Europe and Asia Oceania
IEEJ:October 2012 All Right Reserved

© OECD/IEA 2012
Gas demand is projected to grow by 2.7%/y over 2011-17
Gas demand is projected to reach around 3940 bcm from 3361 bcm in 2011 (+576 bcm)
69% of the growth will come from non-OECD regions (+400 bcm)
OECD demand only increases by 180 bcm
IEEJ:October 2012 All Right Reserved

© OECD/IEA 2012
FSU and North America are set to be the largest contributors to additional supply
FSU is growing fast driven by incremental exports, notably to China
North America’s gas production meets booming demand and some LNG exports
China and Australia become significant gas producers
European domestic production continues to decline
Incremental gas production, 2011-17
IEEJ:October 2012 All Right Reserved

© OECD/IEA 2012
Unconventional gas Already 16% of global gas supply
Half of the world’s unconventional gas production comes from tight gas; shale gas is a North American story
Environmental aspects as well as infrastructure, pricing, policy issues need to be tackled
North America Tight ~ 221 bcm Shale ~ 197 bcm CBM ~ 59 bcm
Latin America Tight ~ 2 bcm
Europe CBM < 1 bcm
FSU Tight ~ 20 bcm CBM < 1 bcm
Middle East & Africa Tight gas > 3 bcm
Asia Tight ~ 35 bcm CBM ~ 2 bcm
Australia CBM ~ 6 bcm
IEEJ:October 2012 All Right Reserved

© OECD/IEA 2012
Russia and the Caspian The interest is shifting to Asia
Yamal expected to start producing in 2012 with a potential to produce 115bcm/y by 2017
Far East/East Siberian projects for China/Korea/LNG export await FID
Turkmenistan is increasing exports to China (possibly to 65 bcm by 2020)
FEED on Shah Deniz-II started in 2012, production might begin 2018
2017+ 2017+
2017+
IEEJ:October 2012 All Right Reserved

© OECD/IEA 2012
Asia’s gas production growth supported by China
China production rises strongly but is insufficient to meet demand
India’s gas production struggles to grow
New gas production in Papua New Guinea to support LNG exports
Relatively flat production in Malaysia
IEEJ:October 2012 All Right Reserved

© OECD/IEA 2012
Regional gas prices are drifting further apart
Source: ICE, EIA, IEA, German Customs, Japanese Customs, McCloskey
Avg. gap in 2011:
USD 5.8/MBtu
Avg. gap in 2011
USD 5.0 /MBtu
There are widening disparities between regional gas prices, which are increasingly determined by their respective regional dynamics Asian price development closely connected to oil price
North America is totally disconnected from other regions
IEEJ:October 2012 All Right Reserved
© OECD/IEA 2012
LNG markets: a healthy growth
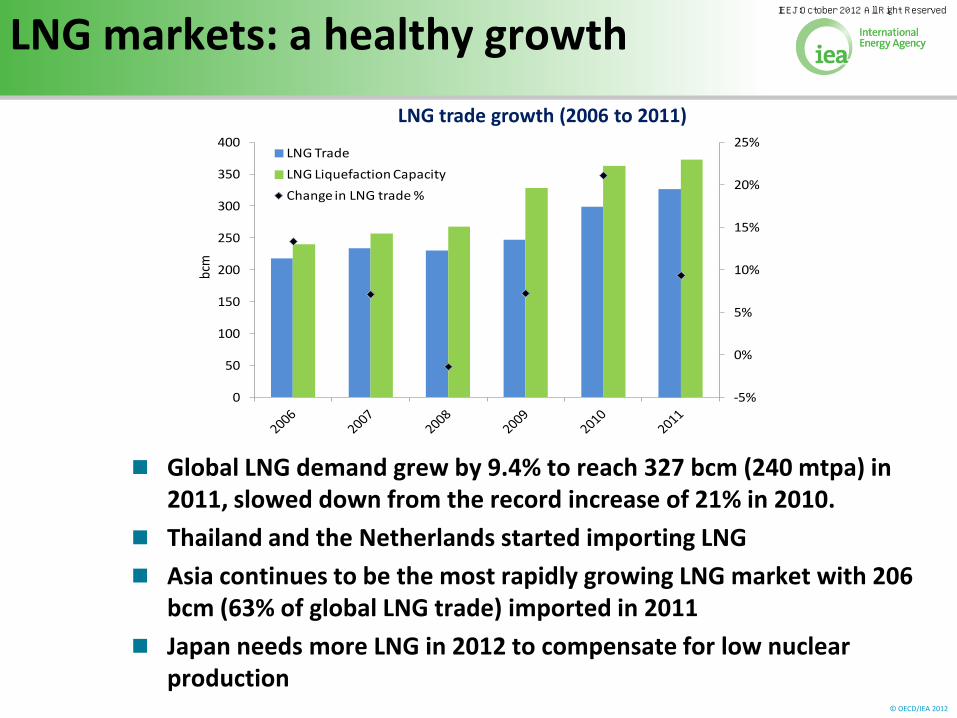
Global LNG demand grew by 9.4% to reach 327 bcm (240 mtpa) in 2011, slowed down from the record increase of 21% in 2010.
Thailand and the Netherlands started importing LNG
Asia continues to be the most rapidly growing LNG market with 206 bcm (63% of global LNG trade) imported in 2011
Japan needs more LNG in 2012 to compensate for low nuclear production
LNG trade growth (2006 to 2011)
-5%
0%
5%
10%
15%
20%
25%
0
50
100
150
200
250
300
350
400
bcm
LNG Trade
LNG Liquefaction Capacity
Change in LNG trade %
IEEJ:October 2012 All Right Reserved

© OECD/IEA 2012
Global gas trade in 2017
OECD Europe, OECD Asia Oceania and China are all net importers, both OECD regions also export LNG
The trade balance is shifting to Asia, notably China, OECD Asia Oceania and other Asian countries
North America is a net exporter
IEEJ:October 2012 All Right Reserved

© OECD/IEA 2012
Renewables
IEEJ:October 2012 All Right Reserved

© OECD/IEA 2012
Key messages – renewable energy
As a portfolio of renewable technologies matures, global renewable power generation is forecast to rise 40% Supported by policy/market frameworks and economic
attractiveness in increasing range of countries and circumstances
Technology cost developments, grid/system integration, cost/availability of financing also weigh as key variables
High level of economic/policy uncertainty in some countries
This projected growth is an acceleration vs previous period Growth is 60% higher over 2011-17 versus 2005-11
Renewable deployment is projected to spread out geographically, with increased activity in emerging markets Deployment spurring economies of scale in some technologies -
virtuous cycle of improved competition and cost reductions
IEEJ:October 2012 All Right Reserved

© OECD/IEA 2012
Growth in renewable power is forecast to accelerate
Hydropower remains the main renewable power source (+3.1% p.a.)
Non-hydro renewable sources grow at double-digit annual percentage rates (+14.3% p.a.)
0
1 000
2 000
3 000
4 000
5 000
6 000
7 000
2005 2006 2007 2008 2009 2010 2011 2012 2013 2014 2015 2016 2017
Global renewable electricity production and forecast
Hydropower Wind onshore Bioenergy Solar PV
Geothermal Wind offshore CSP Ocean
TWh
IEEJ:October 2012 All Right Reserved
© OECD/IEA 2012
Growth is led by non-OECD countries
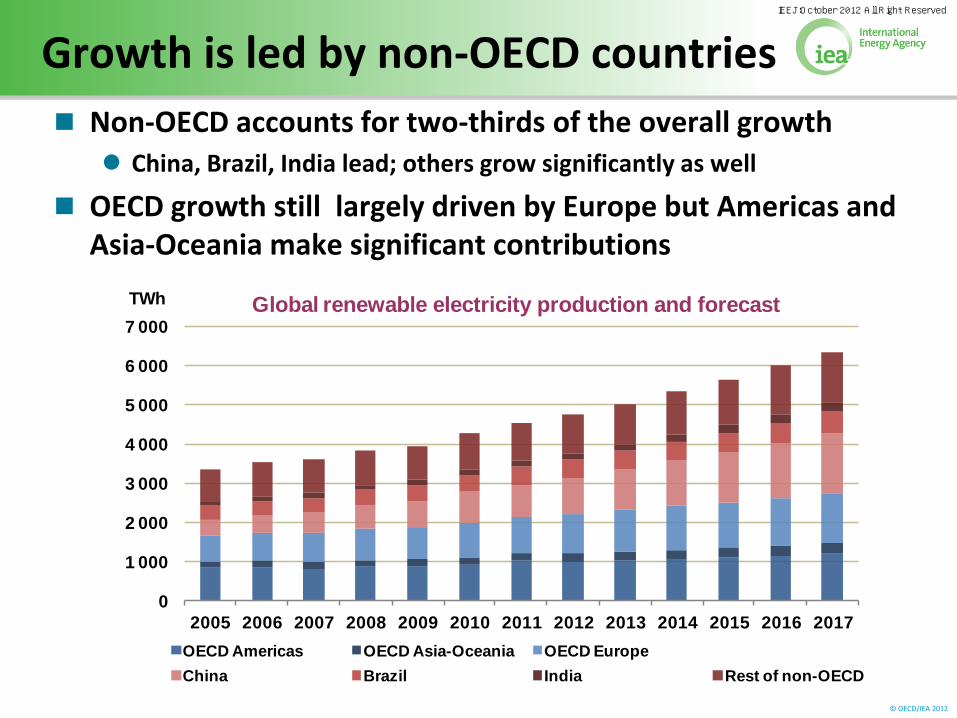
Non-OECD accounts for two-thirds of the overall growth China, Brazil, India lead; others grow significantly as well
OECD growth still largely driven by Europe but Americas and Asia-Oceania make significant contributions
0
1 000
2 000
3 000
4 000
5 000
6 000
7 000
2005 2006 2007 2008 2009 2010 2011 2012 2013 2014 2015 2016 2017
TWh Global renewable electricity production and forecast
OECD Americas OECD Asia-Oceania OECD Europe
China Brazil India Rest of non-OECD
IEEJ:October 2012 All Right Reserved

© OECD/IEA 2012
Regional analysis
IEEJ:October 2012 All Right Reserved

© OECD/IEA 2012
Gas drives coal down in Americas
Very low gas prices enable gas-fired plants to win market shares at the expense of coal
Renewables generation (excl. hydro) increases strongly but still represents a small share of total generation (8%)
IEEJ:October 2012 All Right Reserved
© OECD/IEA 2012
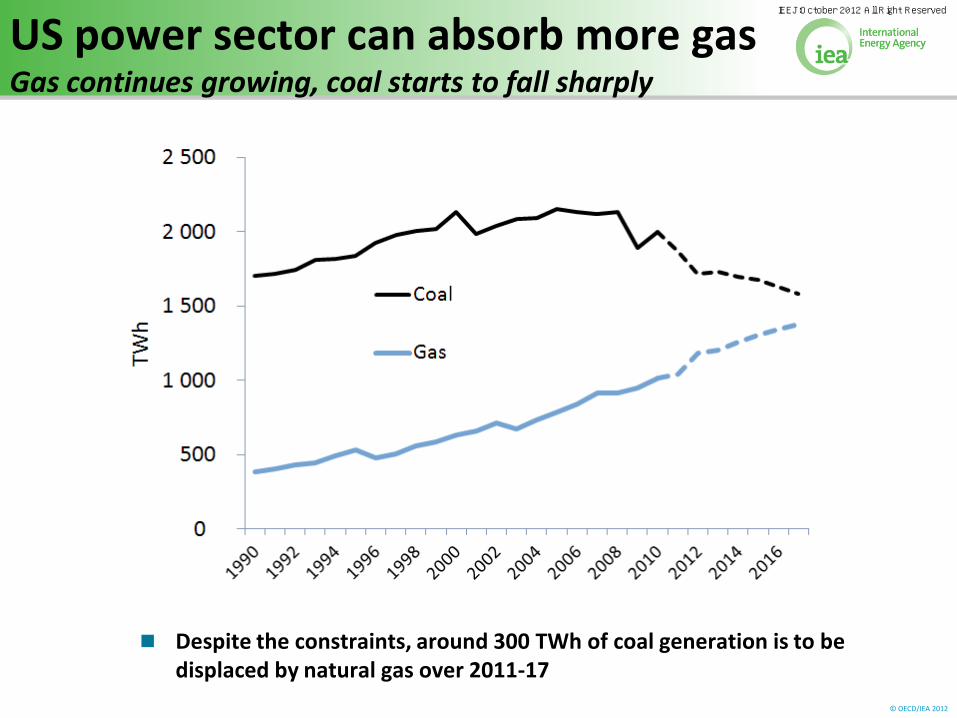
US power sector can absorb more gas Gas continues growing, coal starts to fall sharply
Despite the constraints, around 300 TWh of coal generation is to be displaced by natural gas over 2011-17
IEEJ:October 2012 All Right Reserved

© OECD/IEA 2012
US renewable generation expected to continue to grow steadily
Average renewable growth of 2.4% annually over 2011-17
Non-hydropower growth at stronger rate, + 8.4% annually Onshore wind, solar PV and bioenergy grow strongest
CSP and geothermal growth are large in global terms
% of total power gen: 9% (2005), 13% (2011), 14-15% (2017)
0
100
200
300
400
500
600
700
2005 2006 2007 2008 2009 2010 2011 2012 2013 2014 2015 2016 2017
United States renewable generation and forecast
Hydropower Wind onshore Bioenergy Solar PV Geothermal CSP Wind offshore
TWh
IEEJ:October 2012 All Right Reserved

© OECD/IEA 2012
Europe: power demand increases slower due to low GDP growth
There is less room for fossil fuels Gas has to compete against coal-fired plants
Gas is disadvantaged in the early period due to high gas prices
IEEJ:October 2012 All Right Reserved

© OECD/IEA 2012
Golden age of coal in Europe?
In 2011, demand in the power generation sector dropped by 3 bcm
Low (or negative) power demand growth
Strong growth of renewables
High gas prices with low CO2 prices make gas-fired plants uncompetitive
Gas loses competitiveness in the short term, but will recover (at lower levels than 2011)
0
200
400
600
800
1 000
1 200
TWh
Coal
Gas
IEEJ:October 2012 All Right Reserved

© OECD/IEA 2012
Natural gas prices in Europe
European spot market prices continued to dwell below oil indexed import prices in 2011
Spot market prices stayed low due to overall sluggish demand for natural gas in Europe
0
5
10
15
20
25U
SD/M
Btu
NBP GBP Brent NW European coal marker UK LNG
NBP Avg. -15% of
GBP in 2011
Source: EIA, IEA, German Customs, UK Customs, McCloskey
IEEJ:October 2012 All Right Reserved

© OECD/IEA 2012
European hubs: strong growth in trade
Physical and traded volume in Europe has continued to increase throughout 2006 -11
Increase shows a decreasing trend in continental Europe
+27% Traded volume versus 2010
+8% Physical volume versus 2010
Continental hubs have overtaken NBP in physically delivered volumes since 2008
NBP continues to dominate trade with 68% of total traded volume in Europe
0
100
200
300
400
500
600
2006 2007 2008 2009 2010 2011 2006 2007 2008 2009 2010 2011
Traded Volume Physical volume
Bcm
TTF NCG GASPOOL Zeebrugge PSV CEGH PEG's
+55%
+46%
+56%
+46%
+27%
+8%
0
200
400
600
800
1000
1200
1400
1600
1800
2006 2007 2008 2009 2010 2011 2006 2007 2008 2009 2010 2011
Traded Volume Physical volume
Bcm
NBP Continental
58%61%
22%
28%
32%
67%
16%
13%
12%
32% 38% 50%
Source: TSO’s and regulators
IEEJ:October 2012 All Right Reserved

© OECD/IEA 2012
Europe continues strong renewable growth, but economic/policy uncertainties weigh
Germany, UK and Turkey are largest growers
Nordic countries grow steadily
Economic conditions and overcapacity challenge Italy, Spain
Eastern Europe growing despite crisis and has a long way to go to fulfill EU 2020 goals
0
200
400
600
800
1 000
1 200
1 400
2011 2012 2013 2014 2015 2016 2017
OECD Europe forecast renewable generation
Hydropower Wind onshore Bioenergy Solar PV
Geothermal Wind offshore CSP Ocean
TWh
0
20
40
60
80
100
120
140
160
180
200
2011 2012 2013 2014 2015 2016 2017
Germany forecast renewable generation
Hydropower Solar PV Wind onshore Bioenergy
Geothermal CSP Wind offshore
TWh
IEEJ:October 2012 All Right Reserved

© OECD/IEA 2012
In Asia Oceania, the key question mark is Japan’s future energy policy
Assumes some nuclear comes back in Japan (less than half 2010)
Gas-fired generation set to grow, notable to replace missing nuclear
But coal increases as well (Australia, Japan, Korea)
Renewables generation doubles but represents only 6% of total generation
IEEJ:October 2012 All Right Reserved

© OECD/IEA 2012
Japan renewable energy grows strongly with uncertain nuclear and new feed-in tariffs
0
20
40
60
80
100
120
140
160
180
2011 2012 2013 2014 2015 2016 2017
Japan forecast renewable generation
Hydropower Bioenergy Solar PV
Wind onshore Geothermal Wind offshore
TWh
Drivers: Uncertain nuclear restart
New feed-in tariffs
Good match of solar PV for shaving peak load
Challenges: Power system fragmentation
Relatively high capital costs of renewable energy
Location of wind and geothermal resources far from demand centres
IEEJ:October 2012 All Right Reserved

© OECD/IEA 2012
But replacing nuclear is almost guaranteed to boost LNG demand
0
50
100
150
200
250
300
Nuclear pre Fukushima
Global geothermal
EU solar
German wind
TWh
IEEJ:October 2012 All Right Reserved

© OECD/IEA 2012
China power demand can accommodate both fast REN and gas growth
0%
2%
4%
6%
8%
10%
12%
14%
16%
18%
0
2 000
4 000
6 000
8 000
2005 2008 2011 2014 2017
Y-o-YChg
TWh China power demand vs GDP growth
Demand Demand, Y-o-Y (RHS) GDP, Y-o-Y (RHS)
Source:
IEEJ:October 2012 All Right Reserved

© OECD/IEA 2012
China is the fastest growing region of gas demand
Gas demand grows in all sectors, except fertiliser producers
New sectors emerge such as transport
But there remains supply constraints limiting demand
China needs to solve issues such as pricing and regulation
IEEJ:October 2012 All Right Reserved

© OECD/IEA 2012
China accounts for 40% of global growth in renewable generation
0
300
600
900
1 200
1 500
1 800
2011 2012 2013 2014 2015 2016 2017
China forecast renewable generation
Hydropower Wind onshore Bioenergy Solar PV Wind offshore CSP
TWh
Drivers: Growing energy needs
Diversification
Government targets
Ample low-cost finance
Robust manufacturing
Challenges: Pricing framework
Priority dispatch
Grid upgrades
Prohibitive licensing for small-scale systems
IEEJ:October 2012 All Right Reserved

© OECD/IEA 2012
Want to know more?
The Medium-Term Gas Market Report and Medium-Term Renewable Energy Market Report 2012 can be purchased online at:
www.iea.org
IEEJ:October 2012 All Right Reserved

© OECD/IEA 2012
Thank you!
IEEJ:October 2012 All Right Reserved
Contact: [email protected] The back issues are available at the following URL http://eneken.ieej.or.jp/en/whatsnew/JPOIEL.html