idr : vol o anuary-june -...
TRANSCRIPT
ON IDENTIFICATION OF BACKWARD BLOCKS
Joydeep Baruah*
ABSTRACT
Consequent on the recommendations of the second Administrative ReformsCommission, the Backward Region Grant Fund (BRGF) programme awaits somemajor restructuring in the 12th plan. Blocks are expected to replace the districtsas primary units for redressing regional backwardness. This necessarily warrantsobjective identification of backward blocks based on composite criteria fortargeted subvention. Relying on the joint distribution of a set of backwardnessindicators, this paper offers an identification scheme that fulfils a few desirablewelfare properties. The proposed scheme yields efficient and equitable results,also insightful policy implications.
The second Administrative Reforms Commission (ARC) in its seventh reportrecognises that inter-state disparities in development is merely one aspect ofbalanced regional development, equally important is the intra-state disparities;and, hence, recommends that blocks should be the units of identification ofbackward areas as “districts encompass fairly large areas and populations withdiverse characteristics and varying stages of development” (GoI 2008, p. 139).It, therefore, mandates the planning commission to develop a “compositecriterion” for identifying “backward blocks” based on “indicators of humandevelopment” along with “indices of social and economic infrastructure” in the12th plan. The ARC, inter alia, also recommends that union and stategovernments should adopt “a formula for block-wise devolution of funds targetedat more backward areas” (ibid, p. 141). The Commission, in fact, is of the opinionthat state specific block-level indices need to be applied not for a given set ofschemes but as “general guidelines” for allocation of all resources and planfunds. It, however, observes that the strategy of reducing and minimisingregional imbalances by targeting backward blocks within the context of eachstate needs a formal nod from the planning commission (ibid, p. 139).
Various attempts, both national as well as state level, at identifyingbackward areas, and consequently, introduction of myriad area specific(subvention) programmes in the country from time to time are, perchance, widelydiscussed and presumably well-known. The Backward Region Grant Fund
* Assistant Professor, OKD Institute of Social Change and Development, VIP Road, UpperHengrabari, Guwahati (Assam), 781036, (E-mail: [email protected])
IDR : VOL. 10, NO. 1, ( JANUARY-JUNE, 2012) :139-153 |ISSN : 0972-9437|
140 JOYDEEP BARUAH
(BRGF) programme is the latest addition to this league, covering 250 identifiedbackward districts1, subsuming the 147 districts of erstwhile Rastriya SamVikash Yojna (RSVY), amongst which 55 districts, altogether, are labelled as“left wing extremism affected”2.
Understandably, the BRGF intends to “redress the regional imbalances” inthe country by aiming at first, “bridging critical gaps in local infrastructureand other development requirements” that are not adequately met through the“existing inflows of fund under the various Centrally Sponsored Schemes” (CSS);second, “strengthening the grassroots level institutions” to facilitate theparticipatory planning, decision making, implementation and monitoring toreflect local felt needs; and third, providing the professional support to localbodies for planning, implementation and monitoring of their plans at differentstages and times (GoI, 2007). The programme covers the period of 11th FiveYear Plan i.e. 2007-2012 and it appears, in all probability, that the programmewill continue even in the 12th plan given the approach favoured by the ARC(GoI 2008, p. 136)3.
Evidently, therefore, in the light of recommendations of the ARC, somefundamental restructuring of the BRGF is anticipated in the 12th plan. A fewsuch attempts could already be noticed at the level of ministry of panchayatiraj (MoPR), government of India, which is the nodal ministry for the programme.It is found that the programmable index of backwardness (PIB) proposed earlierby this author (Baruah 2010)4 has been used to guide the process till “analternative model is adopted”. It may, however, be mentioned that the notion ofPIB was proposed in altogether a different context and conceptual framework.Adoption of the same as an instrument to realise the recommendations of theARC, therefore, invites some thorough revisions. This paper makes an attemptat this and tries to present an alternative framework for identifying backwardblocks, which is consistent with the ARC’s recommendations. The alternativesuggested enjoys some major advantages over the earlier approach and yieldsefficient and equitable outcomes. Discussion that follows highlights severalinteresting policy implications.
THE CONTEXT
The fact that the BRGF programme awaits some fundamental restructuring inits approach could be sensed when honourable President addressed the jointsession of Parliament on 4 June, 20095. Subsequently, the World Bank’sindependent review of the BRGF observed that not only present allocation ofBRGF is inadequate but also alleged that inter-se allocation criteria used tendto ignore indicators of backwardness (World Bank 2010). As such, the reporturged on “increasing the volume of fund under the programme” and “improvingthe targeting of flow of fund to backward areas” (ibid p. 67). The mid termappraisal of the eleventh plan, placed before the National Development Councilon 24 July 2010, further looked into the programme and approved of theobservations of the World Bank. It agreed that “the volume of funds providedunder BRGF is insufficient to bridge development gaps and address
ON IDENTIFICATION OF BACKWARD BLOCKS 141
backwardness” and that “the best way to improve targeting of BRGF is to movethe focus of intervention downwards towards the block” (GoI 2010, p. 291).It also observed that there are many instances in India of relatively advanceddistricts with pockets of backwardness within. It, therefore, underlined the needfor restructuring of the programme (ibid, p. 293).
Against this backdrop, on 13 January 2010, the MoPR, government of Indiaconvened a national consultation on development of an index of backwardnessbased on block as a unit wherein “imperative to identify backward areas withblocks as units based on a composite criterion” was deliberated upon. Themeeting, well attended by government officials and people from academia,concluded, inter alia, (1) for all practical purposes “blocks” are required to beconsidered as the unit for addressing backwardness; (2) the composite indexshould be limited to 6 to 10 indicators based on sources like census, which areavailable uniformly in country; (3) till an alternative model is adopted, PIBapproach may be pursued for further refinement; and (4) the selected sectoralindicators may be used for planning and implementation of various sectoralschemes and programmes, whereas the composite index may be used for BRGF,13th Finance Commission’s award and other policies addressing backwardness6.
It may also be mentioned that even before the consultation was held,adopting the PIB approach, the MoPR, with the assistance of the NationalInformatics Centre (NIC), had already started a web portal where all the blockswere ranked as per PIB method based on census 2001 data. The stategovernments were also requested to upload the latest data regarding block levelindicators used in the PIB framework. Presently, altogether 9 states have beenfound to have uploaded the data for all blocks to the portal7.
The then minister of panchayati raj, during the consultation, remarkedthat the PIB as the composite index of backwardness could be used fordetermination of inter-se distribution of BRGF funds in the identified districtsand also could be used for preparing a proposal seeking additional grants forother blocks outside the 250 districts, which are found to be backward as perthe analysis. The MoPR indeed moved a proposal for enhancement of grantunder the programme in May 2010 and while looking at it, the ExpenditureFinance Committee had recommended to set up an inter-ministerial group (IMG)headed by the secretary, MoPR for “identifying the criteria and geographicalunit for determination of the levels of development/backwardness and allocationof funds”. Accordingly, around June-July, 2010 the IMG was constituted.8
The First meeting of the IMG was held on 30 July, 2010. The IMG meetingdiscussed the PIB approach and members’ opinion on the framework rangedfrom “optimally useful” to “rather simplistic”.9 The meeting observed that“recommendations of the IMG would be critical for taking a view on the regionalbackwardness and the role and scope of the BRGF in the 12th Plan period”.10
With the starting of the process of preparation of the approach paper for the12th plan, which is expected to be ready by early part of 2012, given the context,it is, therefore, time that issues of identification of backward blocks based onobjective criteria receives adequate attention.
142 JOYDEEP BARUAH
LIMITS TO PIB
Before delving into the limits, it may be helpful to briefly underline the specificcontext and rationale of the PIB framework for putting the issues in properperspective. The BRGF guideline states that each identified district wouldreceive an annual share of Rs. 10 crore and the remaining (i.e. amount in excessof Rs 2500 crore) would be shared according to population and area of the districtwith 50% weights each (GoI 2007, p. 5-6). The World Bank report points outthat the formula does not reflect any backwardness criteria, contrary to thestated objectives of the programme (World Bank 2010, p. 9). In fact, reportshows that there is no correlation between population and per capita allocationin the districts, neither there is any positive correlation between the per capitaallocation to districts and their backwardness rankings determined by theplanning commission while identifying them. The report, conversely, finds“a significant number of the relatively well-off districts receive BRGF funding,sometimes at a very high per capita allocation level” (ibid, p. 9).
The guideline further mandates that once the amount is received by thedistrict, it is to be allocated first between panchayats (rural share) andmunicipalities (urban share) and then inter-se share of each panchayat andurban local body is to be determined. To do so the guideline proposes that eachstate should design an “index that is prepared and accepted within the state,which reflect backwardness or level of development”. The World Bank reporthas found that none of the states have actually adopted any indicators ofbackwardness in allocating rural and urban shares of the BRGF fund (WorldBank 2010, p10). The report has also revealed that while deciding the verticalshares i.e. shares of different tiers of local bodies, mostly lower tier is given thehighest weights. However, in so far as the horizontal allocations across thelocal bodies are concerned, simple array of indicators like proportion of SC/STpopulation, BPL population, proportion of illiterate population were used, whichreflects some backwardness elements. The PIB framework was, in fact, developedto fill this critical void by supplying some backwardness criteria for directingresources under BRGF in the state.
It is, therefore, evident that there are four levels of allocation involved inthe process viz. allocation to the identified backward districts, allocation of ruraland urban shares within the district, vertical allocations within the varioustiers of local bodies for both the rural and urban components, and horizontalallocations across the local bodies. The PIB framework was specifically proposedas an operational instrument towards the last one, that too only for the rurallocal bodies at the intermediate level.11 The construct of PIB, thus, naturallysuffers from structural limitations with regard to its scope as well as theoreticalunderpinnings. It may, however, be shown that the framework is extendable ingeneral for directing the other three allocation principles provided data on theselected indicators are suitably reorganised.
A careful look at the PIB construct would show that formula used to measurethe relative level of achievement takes a “changing origin” since the seriesminimum has been considered. This, indeed, allowed relative rankings of blocks
ON IDENTIFICATION OF BACKWARD BLOCKS 143
in terms of the worst performing block with respect to a particular indicator.Given the series of all block level values with respect to all selected indicators,the PIB approach is, thus, easily extendable for relative rankings of the blocksin the state as a whole. Notwithstanding, two problems are pointed out in directlyadopting it to identify the backward blocks in a state. First, if dispersion ofvalues related to an indicator happens to be low, or in other words, if the seriesis found to be more or less homogeneous i.e. all individual values are near toseries minimum (this may happen in case the blocks are equally backward ordeveloped), the level of achievement approaches to zero. Second, since the ARCrecommends state specific index, the idea of changing origin might generate theproblem of non-comparability across the states. Both of these can, nonetheless,be overcome by replacing the series minimum with some benchmark values likeof the national average or state average. Even then, a caveat will still remain inusing any of these averages should the data are non-normal and/or containsome outliers.
The other major concern raised over the PIB has been the equal weightsassigned to the chosen indicators. The equal weight scheme was proposed,fundamentally, because the PIB favoured a “programmable approach”. It wasargued that given the programme specific strategy towards development, anyindicator, i.e. any dimensional index to that effect, needs to guide investmentsand allocation of resources under the programme concerned without referringto similar other programmes12. It is, however, possible that outcomes of two ormore programmes may be related in some way, which the equal weight schemeclearly fails to recognise. There have been suggestions to adopt some “endogenousweight schemes” to factor in such correlations amongst the indicators, and fordoing so, techniques of factor analyses were recommended as solutions.
Further, the PIB construct is flawed on ground of aggregate welfareprinciples. Dutta, Pattanaik & Xu (2003) have demonstrated the problem ofmeasuring multi-dimensional deprivation on the basis of aggregate data.A typical welfare framework proceeds first, by measuring overall deprivation ofeach individual unit on the basis of the individual’s deprivation per attributefollowed by the aggregation of the individuals’ overall deprivations to arrive atthe overall social deprivation. This framework, however, is feasible only inpresence of “joint distributions” of attributes for all cases. Any measurementlike that of PIB which seeks to measure multidimensional deprivation on thebasis of aggregate rather than joint distribution would tend to understate thedeprivation and the two should yield identical results only under very “stringentconditions” (ibid 2003). This can be exemplified by a simple 2x2 situation:assume two blocks with two villages in each and with two attributes underconsideration. Let us also assume that in the first block the village 1 has attribute1 and village 2 has attribute 2. In the second block, say, village 1 has boththe attributes while the village 2 possesses none of the attributes. Giventhe joint distributions, the village 2 of the second block is surely the mostbackward. However, the aggregate data of both the blocks taken together wouldyield the same level of deprivation (or achievement) i.e. 50% in case of each of

144 JOYDEEP BARUAH
the attributes and thus, clear case of the “most backward village” would gounsighted and unattended.
AN ALTERNATIVE APPROACH
The proposed alternative to PIB emerges naturally when above limitations aresystematically treated and remedied. Let us begin with the choice of indicators.Evidently, the choice is constrained by the requirement of the “joint distribution”if one wishes to follow an improved welfare criterion as stated previously. Thechoice would be limited to only those indicators (a) which reflect dimensions ofbackwardness or development preferably with respect to a sector; and (b) forwhich data are available jointly for all constituent units preferably from samesource and with same reference point in time. Although demanding, note thatboth these requirements are, indeed, fulfilled by the set of indicators used earlierin PIB framework, with the exception that all aggregate measures now need todropped. The Table 1 provides the reframed set of indicators wherein the lasttwo indicators i.e. I9 and I10 are newly incorporated.
Table 1Selected Indicators Along with Sectors and their Sources
Sector/Dimension Indicators (notation) Data Source Observation
Road Villages having paved Village Directory, Data type nominalapproach road (I1) Census 2001 (Yes/No)
Agriculture Area of land irrigated (I2) Village Directory, Data type intervalCensus 2001
Drinking Water Villages with safe source Village Directory, Data type nominalof drinking water (I3) Census 2001 (Yes/No)
Power Villages with electricity (I4) Village Directory, Data type nominalCensus 2001 (Yes/No)
Education Proportion of literate Primary Census Data type intervalpeople (I5) Abstract, 2001Villages with education Village Directory, Data type nominalfacility (I6) Census 2001 (Yes/No)
Health Villages with healthcare Village Directory, Data type nominalfacility (I7) Census 2001 (Yes/No)
Employment Proportion of main workers Primary Census Data type intervalto total workers (I8) Abstract, 2001Proportion of marginal Primary Census Data type intervalworkers to main workers (I9) Abstract, 2001
Gender Gender gap in literacy (I10) Primary Census Data type intervalAbstract, 2001 scale
The fact that indicators chosen reflect some elements of development is,perhaps, self evident and needs no elaboration. These are, in fact, most commonlyused set of indicators for measuring the level of backwardness or development.Besides, the indicators preserve the notion of “programmability” put forth incase of PIB. Also note that the data relating to them are available jointly at thevillage level “constituting” the blocks. The number of indicators chosen is alsowell within the “manageable limit” and data pertaining to them is available

ON IDENTIFICATION OF BACKWARD BLOCKS 145
from the same source i.e. census, which is generally acceptable, and for thesame reference point of time i.e. 2001. It may be mentioned that using theunique village codes both the census sources viz. primary census abstract andvillage directory can be merged into a single database containing data on allten indicators. Clearly, therefore, the indicators chosen appear to be “optimallyuseful”.
Notwithstanding the so-called “optimality”, data related to the selectedindicators are found to be of two types: dichotomous i.e. “yes” and “no”, andinterval type. The data in the village directory are presented by 0 and 1 where0 indicates “absence” and 1 indicates “presence” of an indicator. Whereas, datain the primary census abstract are presented in interval scale with actual values.Interpretation of the first set of data is a bit problematic as 1 i.e. presence of aphenomenon is rather vague. For instance, if a village is having 20 households,the value of an indicator say “villages with electricity” will be 1 irrespective ofthe actual number of households with electricity. Therefore, value of 1 as “levelof achievement” is very much elusive. However, interpretation of 0 is relativelyobvious: “not a single household possess the characteristic”. This may safely beconsidered as a sign of “non-achievement”, and hence, backwardness.
The second issue herein relates to data measured in the interval scale.While the nominal data cannot be translated into interval or ratio scales, it ispossible to convert the interval data into dichotomous values with respect to athreshold or cut-off by considering it as the “shifted origin”. For instance, ifxi; i = 1,2,3…n is any value measured in either interval or ratio scale; thenshifting the origin to the threshold say z*, we may express the values in theform of xi-z* such that all negative xi-z* are indicative of “failure to achievethe desired threshold level”. The positive xi-z*, conversely, denote the desired“success”. In our case, using the national averages as the “thresholds” forindicators measured in interval scale (i.e. I5, I8, I9, I10) the values areconverted to 0 and 1 denoting “failure” and “success” respectively as explainedabove. The rationale of choosing the national averages as the threshold lies inthe common expectations in most of the government programmes to “bringthe values of indicators at least to the level of national averages”. Also notethat, the value of national average is a function of individual values at somelevels so that any upward movement in one or more individual value(s) wouldexert an upward push towards the national average itself. This allows constantrevision of expectation and thus, regular adjustments to the idea of the failureand success defined earlier. After this conversion we have a fully consistentdatabase with jointly distributed values of ten selected indicators all measuredin nominal scales with values of 0 and 1 denoting failure (backwardness) andsuccess (development) respectively.
Next, one needs to arrive at some measure of individuals’ aggregate level offailure (or backwardness). Simplest way, perhaps, though sounds crude, is tocount total number of 0s across the distribution of ten indicators. The valueideally should reflect the extent of backwardness in aggregate sense. For examplethe value 5 i.e. total 5 number of 0s reveals that the village concern is lagging
146 JOYDEEP BARUAH
behind with respect to five indicators, which allows some sorts joint comparisonacross villages. There are, however, two serious problems involved in this scheme.
Backwardness, or for that matter, development is best treated multi-dimensionally. Although it is possible to regard the selected indicators asdimensions of the “construct” backwardness, no correlation amongst them isallowed, which in all probability may exist in reality. It is, therefore, quitepossible to objectively reduce the number of dimensions to improve the constructof backwardness by “endogenising” the possible correlations amongst the selectedindicators. Second, counting would produce only a discrete scale, ranging valuesfrom 0 to 10, against a phenomenon, which is clearly continuous. Both the issuesrequire some treatment.
Simplest way, perhaps, of treating “dimensions” of a “construct” is to thinkthem in terms of “optimal number of number lines” defining a space with thatdimension. Obviously, the selected indicators need to be in the space so definedeach corresponding to each one of the dimensions. The key issue is, thus,obtaining the optimal number of dimensions objectively i.e. based on data onthe selected indicators. Well known method of accomplishing this is principalcomponent analysis (PCA) which, speaking simply, seeks to express individualdimensions as weighted sum of indicators used. Weights associated with theindividual indicator signify the relative importance or “factor load” on to thedimensions commonly called as “factors”. Assuming k number of dimensions
(d) with n number of indicators (I), PCA allows obtaining1�
� �n
j i ii
d w I such thatj = 1,2,3…k; where wi is the objectively (or endogenously) estimated weightsthat maximises the squared correlations (r2) between d and I (Kim & Mueller1978). Note that when w is taken as 1, d is simply the total score of the valuesof I. The method of PCA has it wide applicability among the social scientists forits diverse merits (Rao 1964).
Although PCA seems to provide an answer to the issue of dimensionality,application of the same to our case remains to be problematic. It may benoted that the basic input of the PCA is the Pearsonian correlation matrix(or co-variance matrix) which is gettable only for variables measured in intervalor ratio scale. In the present case since all indicators are measureddichotomously, Pearsonian correlation matrix, practically, cannot be obtained.One, therefore, needs to resort to approximation of the tetrachoric correlationsamongst the selected indicators. One common approximations of tetrachoriccorrelation for dichotomous variables have been suggested by Edward andEdward (1984). They suggested that for a 2 by 2 contingency tables, thetetrachoric correlation can be approximated as
(��/4 - 1)(��/4 + 1),where � is the cross-product ratio (i.e. ad/bc) of the contingency table. Thereare other approximations as well, for instance Brown (1977) and Digby (1983),which in some sense are “proximates” to the one suggested by Edward andEdward (ibid). Once the tetrachoric correlation matrix is obtained, this may besupplied as input to the standard PCA method, which then follows the usual
ON IDENTIFICATION OF BACKWARD BLOCKS 147
proceedings. An attempt has been made towards this end and following sectionbriefly describes the results and their policy implications.
RESULTS AND IMPLICATIONS
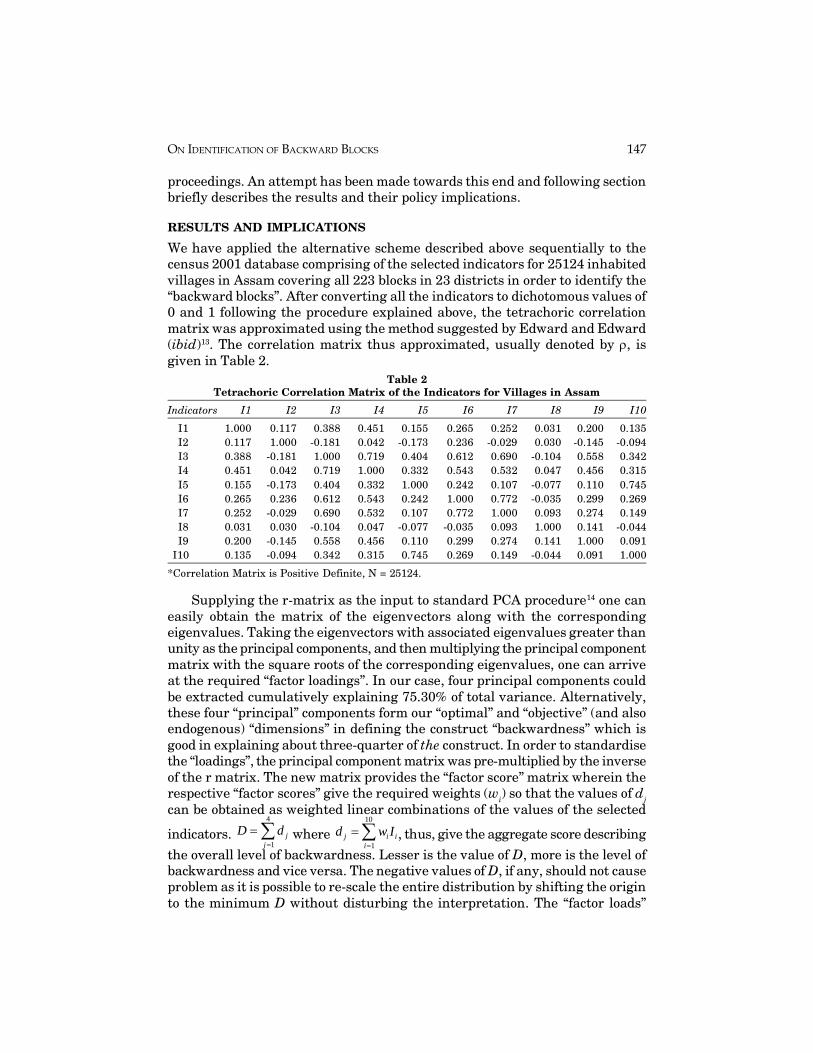
We have applied the alternative scheme described above sequentially to thecensus 2001 database comprising of the selected indicators for 25124 inhabitedvillages in Assam covering all 223 blocks in 23 districts in order to identify the“backward blocks”. After converting all the indicators to dichotomous values of0 and 1 following the procedure explained above, the tetrachoric correlationmatrix was approximated using the method suggested by Edward and Edward(ibid)13. The correlation matrix thus approximated, usually denoted by �, isgiven in Table 2.
Table 2Tetrachoric Correlation Matrix of the Indicators for Villages in Assam
Indicators I1 I2 I3 I4 I5 I6 I7 I8 I9 I10
I1 1.000 0.117 0.388 0.451 0.155 0.265 0.252 0.031 0.200 0.135I2 0.117 1.000 -0.181 0.042 -0.173 0.236 -0.029 0.030 -0.145 -0.094I3 0.388 -0.181 1.000 0.719 0.404 0.612 0.690 -0.104 0.558 0.342I4 0.451 0.042 0.719 1.000 0.332 0.543 0.532 0.047 0.456 0.315I5 0.155 -0.173 0.404 0.332 1.000 0.242 0.107 -0.077 0.110 0.745I6 0.265 0.236 0.612 0.543 0.242 1.000 0.772 -0.035 0.299 0.269I7 0.252 -0.029 0.690 0.532 0.107 0.772 1.000 0.093 0.274 0.149I8 0.031 0.030 -0.104 0.047 -0.077 -0.035 0.093 1.000 0.141 -0.044I9 0.200 -0.145 0.558 0.456 0.110 0.299 0.274 0.141 1.000 0.091
I10 0.135 -0.094 0.342 0.315 0.745 0.269 0.149 -0.044 0.091 1.000
*Correlation Matrix is Positive Definite, N = 25124.
Supplying the r-matrix as the input to standard PCA procedure14 one caneasily obtain the matrix of the eigenvectors along with the correspondingeigenvalues. Taking the eigenvectors with associated eigenvalues greater thanunity as the principal components, and then multiplying the principal componentmatrix with the square roots of the corresponding eigenvalues, one can arriveat the required “factor loadings”. In our case, four principal components couldbe extracted cumulatively explaining 75.30% of total variance. Alternatively,these four “principal” components form our “optimal” and “objective” (and alsoendogenous) “dimensions” in defining the construct “backwardness” which isgood in explaining about three-quarter of the construct. In order to standardisethe “loadings”, the principal component matrix was pre-multiplied by the inverseof the r matrix. The new matrix provides the “factor score” matrix wherein therespective “factor scores” give the required weights (wi) so that the values of dj
can be obtained as weighted linear combinations of the values of the selected
indicators. 4
1�
� � jj
D d where 10
1�
� �j i ii
d w I , thus, give the aggregate score describing
the overall level of backwardness. Lesser is the value of D, more is the level ofbackwardness and vice versa. The negative values of D, if any, should not causeproblem as it is possible to re-scale the entire distribution by shifting the originto the minimum D without disturbing the interpretation. The “factor loads”
148 JOYDEEP BARUAH
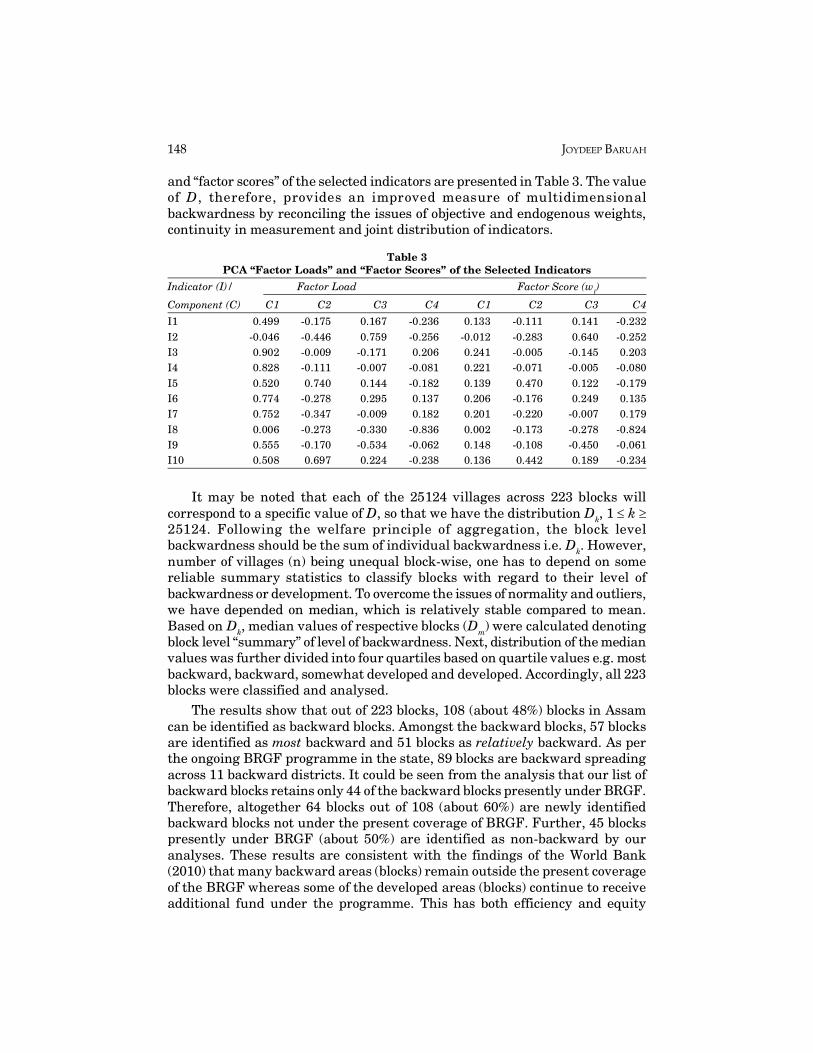
and “factor scores” of the selected indicators are presented in Table 3. The valueof D, therefore, provides an improved measure of multidimensionalbackwardness by reconciling the issues of objective and endogenous weights,continuity in measurement and joint distribution of indicators.
Table 3PCA “Factor Loads” and “Factor Scores” of the Selected Indicators
Indicator (I)/ Factor Load Factor Score (wi)
Component (C) C1 C2 C3 C4 C1 C2 C3 C4
I1 0.499 -0.175 0.167 -0.236 0.133 -0.111 0.141 -0.232I2 -0.046 -0.446 0.759 -0.256 -0.012 -0.283 0.640 -0.252I3 0.902 -0.009 -0.171 0.206 0.241 -0.005 -0.145 0.203I4 0.828 -0.111 -0.007 -0.081 0.221 -0.071 -0.005 -0.080I5 0.520 0.740 0.144 -0.182 0.139 0.470 0.122 -0.179I6 0.774 -0.278 0.295 0.137 0.206 -0.176 0.249 0.135I7 0.752 -0.347 -0.009 0.182 0.201 -0.220 -0.007 0.179I8 0.006 -0.273 -0.330 -0.836 0.002 -0.173 -0.278 -0.824I9 0.555 -0.170 -0.534 -0.062 0.148 -0.108 -0.450 -0.061I10 0.508 0.697 0.224 -0.238 0.136 0.442 0.189 -0.234
It may be noted that each of the 25124 villages across 223 blocks willcorrespond to a specific value of D, so that we have the distribution Dk, 1 � k �25124. Following the welfare principle of aggregation, the block levelbackwardness should be the sum of individual backwardness i.e. Dk. However,number of villages (n) being unequal block-wise, one has to depend on somereliable summary statistics to classify blocks with regard to their level ofbackwardness or development. To overcome the issues of normality and outliers,we have depended on median, which is relatively stable compared to mean.Based on Dk, median values of respective blocks (Dm) were calculated denotingblock level “summary” of level of backwardness. Next, distribution of the medianvalues was further divided into four quartiles based on quartile values e.g. mostbackward, backward, somewhat developed and developed. Accordingly, all 223blocks were classified and analysed.
The results show that out of 223 blocks, 108 (about 48%) blocks in Assamcan be identified as backward blocks. Amongst the backward blocks, 57 blocksare identified as most backward and 51 blocks as relatively backward. As perthe ongoing BRGF programme in the state, 89 blocks are backward spreadingacross 11 backward districts. It could be seen from the analysis that our list ofbackward blocks retains only 44 of the backward blocks presently under BRGF.Therefore, altogether 64 blocks out of 108 (about 60%) are newly identifiedbackward blocks not under the present coverage of BRGF. Further, 45 blockspresently under BRGF (about 50%) are identified as non-backward by ouranalyses. These results are consistent with the findings of the World Bank(2010) that many backward areas (blocks) remain outside the present coverageof the BRGF whereas some of the developed areas (blocks) continue to receiveadditional fund under the programme. This has both efficiency and equity
ON IDENTIFICATION OF BACKWARD BLOCKS 149
implications. Providing additional fund in the name of backward areaprogramme to the areas which are non-backward not only indicates resourcewastage but also increases the aggravates the regional disparity by wideningthe development gaps over the space and time. The proposed restructuring ofthe programme with blocks as units of backwardness, therefore, carries somedefinite merits on account of both equity and efficiency.
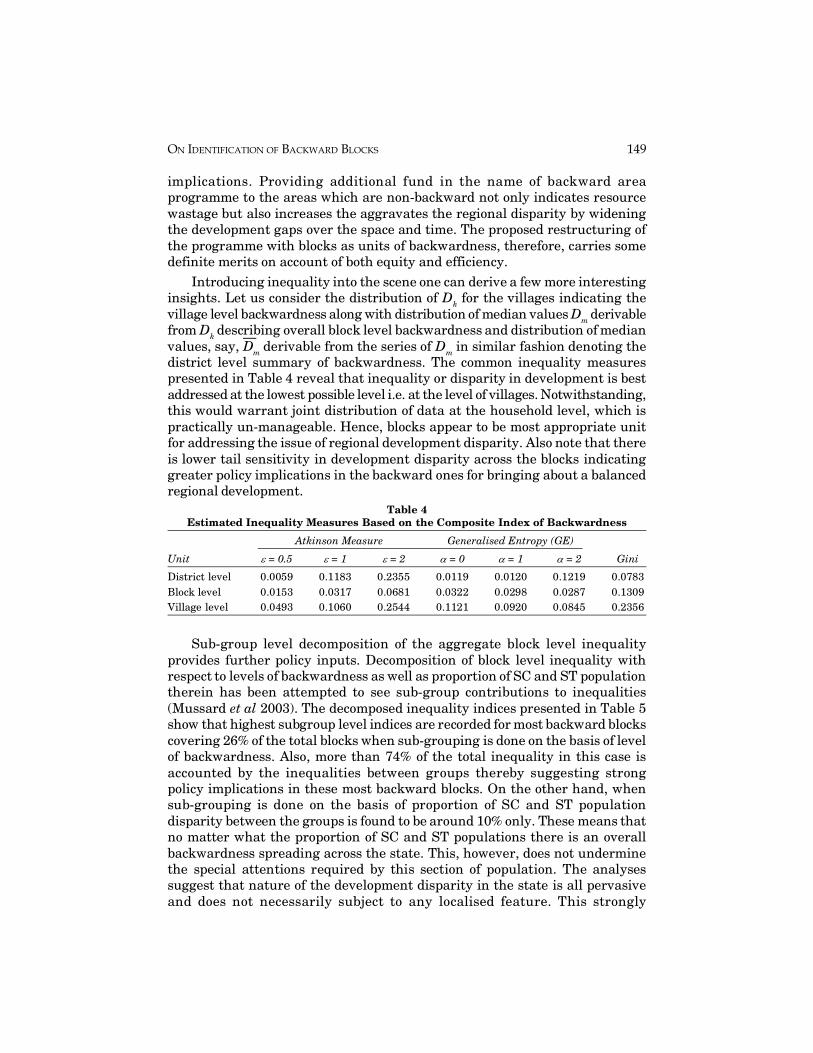
Introducing inequality into the scene one can derive a few more interestinginsights. Let us consider the distribution of Dk for the villages indicating thevillage level backwardness along with distribution of median values Dm derivablefrom Dk describing overall block level backwardness and distribution of medianvalues, say, D
—m derivable from the series of Dm in similar fashion denoting the
district level summary of backwardness. The common inequality measurespresented in Table 4 reveal that inequality or disparity in development is bestaddressed at the lowest possible level i.e. at the level of villages. Notwithstanding,this would warrant joint distribution of data at the household level, which ispractically un-manageable. Hence, blocks appear to be most appropriate unitfor addressing the issue of regional development disparity. Also note that thereis lower tail sensitivity in development disparity across the blocks indicatinggreater policy implications in the backward ones for bringing about a balancedregional development.
Table 4Estimated Inequality Measures Based on the Composite Index of Backwardness
Atkinson Measure Generalised Entropy (GE)
Unit � = 0.5 � = 1 � = 2 � = 0 � = 1 � = 2 Gini
District level 0.0059 0.1183 0.2355 0.0119 0.0120 0.1219 0.0783Block level 0.0153 0.0317 0.0681 0.0322 0.0298 0.0287 0.1309Village level 0.0493 0.1060 0.2544 0.1121 0.0920 0.0845 0.2356
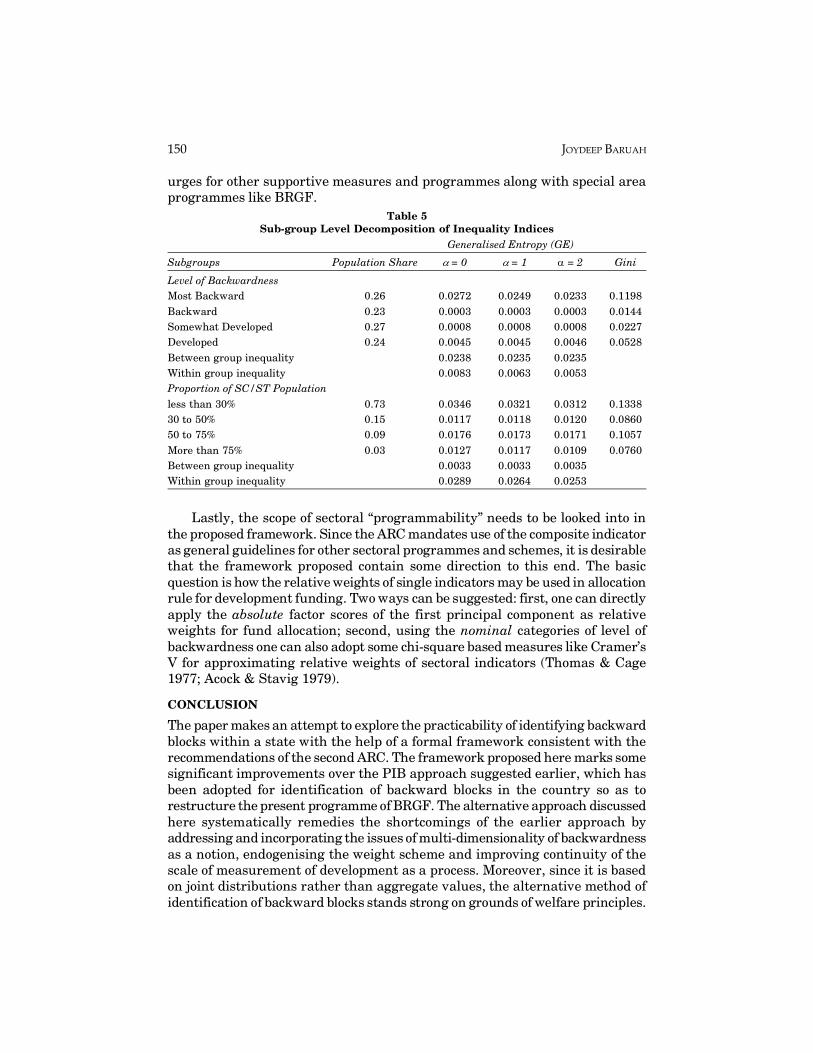
Sub-group level decomposition of the aggregate block level inequalityprovides further policy inputs. Decomposition of block level inequality withrespect to levels of backwardness as well as proportion of SC and ST populationtherein has been attempted to see sub-group contributions to inequalities(Mussard et al 2003). The decomposed inequality indices presented in Table 5show that highest subgroup level indices are recorded for most backward blockscovering 26% of the total blocks when sub-grouping is done on the basis of levelof backwardness. Also, more than 74% of the total inequality in this case isaccounted by the inequalities between groups thereby suggesting strongpolicy implications in these most backward blocks. On the other hand, whensub-grouping is done on the basis of proportion of SC and ST populationdisparity between the groups is found to be around 10% only. These means thatno matter what the proportion of SC and ST populations there is an overallbackwardness spreading across the state. This, however, does not underminethe special attentions required by this section of population. The analysessuggest that nature of the development disparity in the state is all pervasiveand does not necessarily subject to any localised feature. This strongly
150 JOYDEEP BARUAH
urges for other supportive measures and programmes along with special areaprogrammes like BRGF.
Table 5Sub-group Level Decomposition of Inequality Indices
Generalised Entropy (GE)
Subgroups Population Share ��= 0 ��= 1 � = 2 Gini
Level of BackwardnessMost Backward 0.26 0.0272 0.0249 0.0233 0.1198Backward 0.23 0.0003 0.0003 0.0003 0.0144Somewhat Developed 0.27 0.0008 0.0008 0.0008 0.0227Developed 0.24 0.0045 0.0045 0.0046 0.0528Between group inequality 0.0238 0.0235 0.0235Within group inequality 0.0083 0.0063 0.0053Proportion of SC/ST Populationless than 30% 0.73 0.0346 0.0321 0.0312 0.133830 to 50% 0.15 0.0117 0.0118 0.0120 0.086050 to 75% 0.09 0.0176 0.0173 0.0171 0.1057More than 75% 0.03 0.0127 0.0117 0.0109 0.0760Between group inequality 0.0033 0.0033 0.0035Within group inequality 0.0289 0.0264 0.0253
Lastly, the scope of sectoral “programmability” needs to be looked into inthe proposed framework. Since the ARC mandates use of the composite indicatoras general guidelines for other sectoral programmes and schemes, it is desirablethat the framework proposed contain some direction to this end. The basicquestion is how the relative weights of single indicators may be used in allocationrule for development funding. Two ways can be suggested: first, one can directlyapply the absolute factor scores of the first principal component as relativeweights for fund allocation; second, using the nominal categories of level ofbackwardness one can also adopt some chi-square based measures like Cramer’sV for approximating relative weights of sectoral indicators (Thomas & Cage1977; Acock & Stavig 1979).
CONCLUSION
The paper makes an attempt to explore the practicability of identifying backwardblocks within a state with the help of a formal framework consistent with therecommendations of the second ARC. The framework proposed here marks somesignificant improvements over the PIB approach suggested earlier, which hasbeen adopted for identification of backward blocks in the country so as torestructure the present programme of BRGF. The alternative approach discussedhere systematically remedies the shortcomings of the earlier approach byaddressing and incorporating the issues of multi-dimensionality of backwardnessas a notion, endogenising the weight scheme and improving continuity of thescale of measurement of development as a process. Moreover, since it is basedon joint distributions rather than aggregate values, the alternative method ofidentification of backward blocks stands strong on grounds of welfare principles.
ON IDENTIFICATION OF BACKWARD BLOCKS 151
It has, therefore, been shown that objective and optimal identification ofbackward blocks following the ARC recommendations is gettable. It also carriesa clue for designing an objective allocation principle to serve as generalguidelines.
Results of the analyses further demonstrate that blocks as primary units ofbackward region are optimal both in terms of efficiency and equity. Disparityin development increases hierarchically from state to district and from districtto block levels, and disparity displays a greater sensitivity towards the negativetails. Besides, larger part of the aggregate disparity has been found to becontingent upon the lower echelons of development. All these favour a strongarea development programme to address the issue of balanced regionaldevelopment. Notwithstanding, it has also been shown that phenomenon ofregional backwardness, as in the case of Assam, may be all pervasive warrantinga set of comprehensive policies rather than a single area developmentprogramme.
The suggested method, though seems attractive, is limited by selection ofindicators and quality of data used. Indicators used for this type of formulationsoften reflect “outcomes” rather than “causes”. Need for timely and reliable andcomprehensive set of data and capacitating the national agencies towardsmeeting this end can, therefore, may be reiterated. The major problem with theblock level approach, in any case, as envisaged by the ARC, lies in the fact thatit completely ignores the urban areas. The present district approach of BRGFcontains the urban share. Blocks particularly falling within rural administration,one needs to look for a space to accommodate urban. Key question, however,remains: can subvention per se really beget development?
Notes1. 30 new districts were curved out later on out of the 14 original BRGF districts. The
updated list of newly curved out district is available at http://panchayat.nic.in/data/1292484971678~Lr%20to%20TSI%20applicants%20re%20newly%20carved%20BRGF %20dists%5B1%5D.pdf, accessed on February 23, 2011. The number ofBRGF districts, thus, has increased by 16.
2. State intervention through subvention on grounds of balanced regional growth haswitnessed a remarkable change in perspective in recent times. Notably, the ARCreport posits a direct and positive correlation between growing regional disparityand regional conflicts. In fact, the report is titled on that premise i.e. CapacityBuilding for Conflict Resolution. Some important recent documents, for instance,Development Challenges in Extremist Affected Areas - report of an Expert Groupconstituted by the planning commission (April, 2008) also bear similar overtone.The report of the High Level Commission to the prime minister on Transformingthe Northeast (March, 1997) also called for “considerable increase in outlay andcapacity-building” for tackling backlogs in basic minimum services andinfrastructural needs (p. 5). This change in perception itself merits some criticaldiscussion.
3. The ARC in its report (2008) identifies two broad approaches to balanced regionaldevelopment, i.e. “to fortify the backward areas adequately and target them withadditional resources and investments to help them overcome structural deficiencies”

152 JOYDEEP BARUAH
contributing to their backwardness (p. 136). This, precisely, is the approach of theBRGF.
4. The study, although, appeared in EPW on 6 February, 2010, was completed andsent to all stakeholders much earlier.
5. See section 32 of the Address available at the URL http://presidentofindia.nic.in/sp040609.html, accessed on February 11, 2011.
6. All these are as per the circulated minutes of the meeting. The author received acopy of it on 3 February 2010 as a participant.
7. The URL is http://panchayat.gov.in/priprofiler. The stated status was when theportal last accessed on 11 February, 2011. The data reference period and source,however, varies from state to state as well as indicator to indicator. In many casessimply census data are repeated. The sources of uploaded data are also not indicatedfor several cases e.g. Assam. This precisely indicates the practical problems andissues in relying on different sources for supply of data. Uniform sources like thatof census are, therefore, preferred even though data are being criticised as “dated”.
8. The author received a mail from the MoPR on 7 July 2010 stating that the IMG hasbeen constituted, although, the date of constitution is not stated.
9. The minutes of the meeting are available at the URL http://panchayat.nic.in/data/1283277868404~MOM%20of%20Inter%20Ministry%20Group%2030Aug2010.pdf, accessed on 11 February, 2011
10. The MoPR has continued personal discussion with the author even after the IMGmeeting. Very recently, the planning commission too has shown interest in thestudy.
11. It may be pointed out that block boundaries, in general, are co-terminus with theintermediate panchayat boundaries i.e. the boundaries of Anchalik Panchayats.Ranking of the blocks with respect to their relative backwardness, therefore, amountsto relative rankings of Anchalik Panchayats.
12. The meeting on 13 January 2010, in fact, resolved that selected sectoral indicatorsof PIB may be used for planning and implementation of various sectoral schemesand programmes since “ongoing sectoral schemes have not addressed this aspect”.See minutes available at http://panchayat.nic.in/data/1283277868404~MOM%20of%20Inter%20Ministry%20Group%2030Aug2010.pdf, accessed on 11 February,2011.
13. It may be mentioned that the tetrachoric routine in STATA is based on algorithmproposed by Edwards and Edwards (1984). One can also approximate tetrachoriccorrelation following Brown (1977) by using the programme “tetmat” designed anddistributed by John Uebersax (2007). The programme can be obtained freely athttp://ourworld.compuserve.com/homepages/jsuebersax. Both the approximates,however, differ marginally.
14. For instance one can supply the � matrix in STATA with “pcamat” command to getthe eigenvalues and eigenvectors (principal components) of it.
ReferencesAcock, A C and Stavig, G R (1979), “A Measure of Association for Nonparametric
Statistics”; Social Forces; Vol. 57, No. 4, pp. 1381-1386.
Baruah, J (2010), “Towards a Programmable Index of Backwardness”, Economic andPolitical Weekly, Vol. XLV, No. 6, pp. 27-31.
ON IDENTIFICATION OF BACKWARD BLOCKS 153
Brown, M B (1977), “Algorithm AS 116: The Tetrachoric Correlation and its AsymptoticStandard Error, Journal of the Royal Statistical Society, Vol. 26, No. 3, pp. 343-351.
Digby, P G N (1983), “Approximating the Tetrachoric Correlation Coefficient”, Biometrics,Vol. 39, No. 3, pp. 753-757
Dutta, I., Pattanaik, P K and Xu, Y. (2003), “On Measuring Deprivation and the Standardof Living in a Multidimensional Framework on the Basis of Aggregate Data”,Economica, Vol. 70, No. 278, pp. 197-221.
Edward, J H and Edward, A W F (1984), “Approximating the Tetrachoric CorrelationCoefficient”; Biometrics, Vol. 40, No. 2, p. 563.
GoI (2010), Mid Term Appraisal for Eleventh Five Year Plan 2007-2012; PlanningCommission; available at the URL http://www.planningcommission.gov.in/plans/mta/11th_mta/MTA.html; accessed on 11 February, 2011.
GoI (2008), Capacity Building for Conflict Resolution; Seventh Report; SecondAdministrative Reforms Commission
GoI (2007), Backward Region Grant Fund: Programme Guidelines; Ministry of PanchayatiRaj; Government of India.
Kim, J. and Mueller, C W (1978), Factor Analysis: Statistical Methods and PracticalIssues; Sage Publications; Newbury Park.
Mussard, S., Seyte, F and Terazza, M. (2003), “Decomposition of Gini and the GeneralisedEntropy Inequality Measures”; Economics Bulletin, Vol. 4, No. 7, pp. 1-6.
Rao, C R (1964), “The Use and Interpretation of Principal Component Analysis in AppliedResearch”, Sankhya–: The Indian Journal of Statistics, Vol. 26, No. 4, pp. 329-358.
Thomas, C W and Cage, R. J. (1977), “The Effect of Social Characteristics on JuvenileCourt Dispositions”, The Sociological Quarterly, Vol. 18, No. 2, pp. 237-252.
World Bank (2010), First Independent Review of the Backward Region Grant Fund(BRGF), Synthesis Report; January 7.