identifying the sources of escherichia coli contamination
TRANSCRIPT

Identifying the Sources of Escherichia coli Contamination to the Shellfish Growing Areas of the Morro Bay Estuary
Dr. Christopher Kitts and Dr. Mark A. Moline Biological Sciences Department
California Polytechnic State University San Luis Obispo, CA 93407
Dr. Andrew Schaffner Statistics Department
California Polytechnic State University San Luis Obispo, CA 93407
Dr. Mansour Samadpour Department of Environmental Health
University of Washington Health Sciences Building, Box 357234
Seattle, WA 98195-7234
Katie McNeill and Shanta Duffield Central Coast Regional Water Quality Control Board
81 South Higuera St. Suite #200 San Luis Obispo, CA 93401

Identifying the Sources of Escherichia coli Contamination to the Shellfish Growing Areas of the Morro Bay Estuary Final Report 3/29/2002
TABLE OF CONTENTS ACKNOWLEDGMENTS ...........................................................................................................3 LIST OF ACRONYMS AND ABBREVIATIONS ...................................................................3 INTRODUCTION........................................................................................................................4 PAST WORK ...............................................................................................................................6 NEED FOR THE STUDY AND USE OF RESULTS...............................................................7 STUDY OBJECTIVES AND ASSUMPTIONS ........................................................................8
PRIMARY OBJECTIVES:................................................................................................................8 SECONDARY OBJECTIVES:...........................................................................................................8
STUDY DESIGN..........................................................................................................................9 INTRODUCTION ...........................................................................................................................9 TRACKING THE SOURCES OF E. COLI USING RIBOTYPING .............................................................9
Library source sampling........................................................................................................9 Sampling, Isolation and Enumeration of E. coli..................................................................11 Ribotyping Methodology......................................................................................................12
MPN COUNTS OF TOTAL AND FECAL COLIFORMS ....................................................................14 Bay sampling........................................................................................................................14 Watershed sampling.............................................................................................................15 Lease area 13 grid sampling ...............................................................................................16
QUALITY ASSURANCE AND QUALITY CONTROL (QA/QC) MEASURES.....................................17 Water Quality (Total and Fecal Coliform) QA/QC .............................................................17 Comparison of Membrane Filtration and MPN ..................................................................18 Genetic Fingerprinting QA/QC - Ribotyping Reproducibility ............................................18 Genetic Fingerprinting QA/QC - Strain Isolation Frequency.............................................19
STATISTICAL COMPARISONS OF RIBOTYPE DISTRIBUTIONS........................................................21 RESULTS & DISCUSSION......................................................................................................22
FECAL COLIFORM COUNTS (MPN)............................................................................................22 Loading estimates ................................................................................................................23
LIBRARY SOURCE SAMPLES.......................................................................................................24 SOURCE AND STRAIN TRACKING................................................................................................25
Strains from unknown sources .............................................................................................27 Tracking the distribution of specific ribotypes ....................................................................28 Statistical analysis of the distribution of E. coli sources in the Morro Bay watershed.......31
GRID AT 13 SAMPLING..............................................................................................................33 CONCLUSIONS ........................................................................................................................35
PRIMARY OBJECTIVES:..............................................................................................................35 SECONDARY OBJECTIVES:.........................................................................................................35 OVERALL CONCLUSION: ...........................................................................................................35
LIST OF APPENDICES ...........................................................................................................36
2

Identifying the Sources of Escherichia coli Contamination to the Shellfish Growing Areas of the Morro Bay Estuary Final Report 3/29/2002
ACKNOWLEDGMENTS The authors would like to thank all the many people who made this study possible. The following is a brief list of contributors. This study was funded by the California State Water Resources Control Board through money set aside for shellfish related research. Linda O'Connell at the SWRCB was instrumental in obtaining these funds and coordinating the study. Gregg Langlois and A. Marc Commandatore of the California Department of Health Services helped immensely with their knowledge of the regulations and the shellfish growing leases in Morro Bay. Bill Schwebel and Cal Poly students Matt Oliver and Noah Doughty collected samples and other data. The members of the Morro Bay Shellfish Technical Advisory Committee helped prepare and evaluate the Working Plan for the study. We would also like to thank the people at Williams Shellfish for their support, Denise and Echo Resco and Dianne and Chuck Ramos and especially the late Bill Williams. The National Estuary Program for Morro Bay volunteered meeting space and time for the study. Gratitude is due to staff and directors of the San Luis Obispo County Health Lab, Creek Environmental Labs, BC Labs and BioVir Laboratories for processing the endless stream of samples. Thanks also to the Marine Mammal Center of Marin for providing sea lion fecal samples.
LIST OF ACRONYMS AND ABBREVIATIONS Cal Poly California Polytechnic State University, San Luis Obispo CCRWQCB Central Coast Regional Water Quality Control Board DHS California Department of Health Services E. coli Escherichia coli bacteria MBNEP Morro Bay National Estuary Program MBSTAC Morro Bay Shellfish Technical Advisory Committee MF Membrane Filter Morro Bay This will mean the actual bay and not the city of Morro Bay unless specified. MPN Most Probable Number NPDES National Pollutant Discharge Elimination System NPS Non Point Source NSSP National Shellfish Sanitation Program SLOCH San Luis Obispo, County Health SWRCB State Water Resources Control Board TMDL Total Maximum Daily Load UW University of Washington WSF William Shellfish Farms
3

Identifying the Sources of Escherichia coli Contamination to the Shellfish Growing Areas of the Morro Bay Estuary Final Report 3/29/2002
INTRODUCTION Fecal coliform bacteria, common in the intestines of warm-blooded animals, are used as an indicator of fecal contamination in the environment that might include disease causing bacteria and viruses. The California Department of Health Services (DHS) has been monitoring fecal coliform levels in Morro Bay for the protection of shellfish since 1953. Unmanageable levels of fecal coliforms above the legal allowable limit in recent years have resulted in a reclassification of portions of the shellfish lease area from “Conditionally Approved” to “Prohibited” for shellfish harvesting (Figures 1 and 2). The Morro Bay certified shellfish grower is required to stop harvesting and is closed when a 24-hour rainfall exceeds 0.40 inches of rain. Depending on the harvest location closure may last from five to twelve days. If bacterial levels continue to rise, additional harvest restrictions may be placed on the shellfish grower. The National Shellfish Sanitation Program (NSSP) standard for a “Conditionally Approved” shellfish growing area is a fecal coliform sample below a geometric mean of 14 MPN/100 mL and below a 90th percentile of 43 MPN/100 mL. Samples for fecal coliform are taken during open harvest conditions. Rising levels of bacteria may also adversely impact recreational activities in the bay. The Regional Water Quality Control Board’s (RWQCB) Water Quality Control Plan (Basin Plan 1994) standards for Water Contact Recreation for fecal coliform are 200 MPN/100 ml (log mean of a minimum of five samples). Elevated levels of fecal coliforms are an indication that the bay may be unsafe for swimming and other forms of water contact activities.
Figure 1. Map of Morro Bay (DHS). The polygons represent potential growing area leases. The small dots show where the DNA sites are: Chorro Creek, Los Osos Creek, 13, 12, 11B, Third Street Dock Seep and Pismo Seep.
4

Identifying the Sources of Escherichia coli Contamination to the Shellfish Growing Areas of the Morro Bay Estuary Final Report 3/29/2002
Potential sources of bacteria include agricultural runoff, domestic animal waste, leaking/failing septic systems, terrestrial and marine wildlife, discharge from recreational and commercial boats and boating facilities, urban runoff, leaking lift stations and faulty wastewater treatment plant operations. Some of these sources may discharge only during storms, while others are discharged to the bay year-round. Other sources may discharge bacteria to the bay continuously through the creeks and groundwater sources (seeps) that feed the bay. Historically, fecal coliform levels have been high in Chorro and Los Osos Creeks directly above the confluence with the estuary, in Cuesta and Baywood Park inlets and the northern region of the oyster harvesting area (across the bay from the state park marina) within the estuary.
0
100
200
300
400
500
600
2/1/
89
8/1/
89
1/29
/90
7/29
/90
1/26
/91
7/26
/91
1/23
/92
7/22
/92
1/19
/93
7/19
/93
1/16
/94
7/16
/94
1/13
/95
7/13
/95
1/10
/96
7/9/
96
1/6/
97
7/6/
97
1/3/
98
7/3/
98
12/3
1/98
6/30
/99
12/2
8/99
Date
MPN
/100
mL
Figure 2. Historical fecal coliform counts (MPN/100 mL) at Bay Site 13 (DHS). The red
line indicates the NSSP limit of 43 MPN/100 mL. The Shellfish Protection Act of 1993 (California Water Code Sections 14950-58) requires Regional Water Quality Control Boards to assemble a Technical Advisory Committee when a body of water is “threatened” on the basis of a downgrade in classification. In 1996 DHS reclassified a portion of lease M-614-01, Parcel 1 to “Prohibited” (Figures 1 and 2), and notified the Central Coast Regional Water Quality Control Board (CCRWQCB). In response, the CCRWQCB established the Morro Bay Shellfish Technical Advisory Committee (MBSTAC) in 1997 to conduct water quality investigations and develop remediation strategies for the shellfish growing area.
5

Identifying the Sources of Escherichia coli Contamination to the Shellfish Growing Areas of the Morro Bay Estuary Final Report 3/29/2002
This project involved microbial source tracking to identify the origins of bacterial contamination to the estuary. The project was developed and directed by the MBSTAC and carried out as a cooperative effort between the University of Washington (UW), California Polytechnic State University (Cal Poly) and the CCRWQCB and funded by the California State Water Quality Control Board. The study consisted of three sampling efforts that lasted over a two-year period. In one portion of the study more than 1600 E. coli strains (a typical fecal coliform bacterium) were isolated from the samples. Genetic fingerprints known as ribotypes were used to compare the isolated bacteria to a library of bacteria isolated from the feces of different animals. Matches between isolated E. coli from Morro Bay and bacteria in the UW library were used to create a breakdown of the possible fecal sources of E. coli in Morro Bay. This sampling effort included three bay sites, both creek mouths and two seeps as well as bay sediment and oysters. The second sampling effort covered a wide area in the Morro Bay watershed and only total and fecal coliform counts were taken. A third sampling effort covered a grid area around the “Prohibited” portion of lease M-614-01, Parcel 1, and only included total and fecal coliform counts. The results of this study will be used by the MBSTAC to consider further recommendations to the CCRWQCB concerning the threatened status of the shellfish growing area and will help to guide policy decisions designed to control fecal contamination in Morro Bay.
PAST WORK A Clean-up and Abatement Study funded by the State Water Resources Control Board (SWRCB) was conducted to characterize all the potential sources of bacterial contamination of Morro Bay during wet and dry weather conditions (Jagger et al., 1987). This study characterized bacterial levels throughout the bay and potential sources of contamination. Results indicated that certain regions of the bay had elevated fecal coliform counts, particularly the southern end. A detailed study of the possible fecal inputs to Morro Bay was recommended as a result of these findings. As part of the CCRWQCB’s National Monitoring Program, water quality data, such as fecal coliform, has been collected from several locations at regular intervals throughout the Morro Bay watershed under a sampling scheme in place since 1993. Biweekly sampling occurs year-round with weekly sampling occurring during a twenty-week period every winter. Sampling has been effective at detecting elevated fecal coliform levels at various sites throughout Chorro Creek and Los Osos Creek watersheds. The Morro Bay National Estuary Program (MBNEP) and the CCRWQCB collected bacterial samples during the “first flush” winter rains of 1995-96 and 1996-97. Extremely elevated levels of fecal coliform (> 900,000 MPN/100ml) were found in samples taken from gutters, culverts and storm drains throughout Morro Bay and Los Osos. The DHS has been monitoring fecal coliform levels in Morro Bay for the protection of shellfish since the 1980’s. Due to the unpredictable nature of the bacterial levels found in the bay in recent years, portions of the lease area have been reclassified from “Conditionally Approved” to “Prohibited” for oyster harvesting. Sporadic spikes in bacterial levels greater than the National Shellfish Sanitation Program (NSSP) limit of 43 MPN/100 mL have occurred during times of no rainfall and cannot be attributed to run-off from the surrounding area.
6

Identifying the Sources of Escherichia coli Contamination to the Shellfish Growing Areas of the Morro Bay Estuary Final Report 3/29/2002
In response to elevated levels found by the DHS, the MBNEP and CCRWQCB began conducting reconnaissance sampling in the bay in 1996. This pilot sampling effort was geared towards assessing trends in the bay’s water quality and further identifying possible sources of contamination. Data from these sample sites show that bacterial levels have been continually high at sample sites in Cuesta Inlet and Baywood Park Inlet near Los Osos, particularly during the wet season. Elevated fecal coliform levels have been continuously found in four freshwater seep sample sites, reaching 28,000 MPN/100ml at one location. The Morro Bay National Estuary Program funded a Bacterial Loading Study to quantify loadings and impacts through the development of a numeric model (Tetra Tech, 1999). The results of the model simulations indicated that nearly half of the loading to the estuary comes from Chorro Creek, and during the wet weather, flow from Chorro Creek impacts the shellfish growing areas. According to Tetra Tech, groundwater sources have limited impacts on shellfish growing waters during the wet season, but were found to have impacts on shoreline areas in the south bay during dry weather. During wet weather periods, runoff from Los Osos had impacts to the southern most shellfish growing area.
NEED FOR THE STUDY AND USE OF RESULTS Williams Shellfish Farms (WSF), which is comprised of two Department of Fish and Game water bottom leases in Morro Bay, totals 288 acres. About 156 acres, or 54% of the total are classified as “Prohibited”. These acres also represent the best growing area in the bay. Fecal coliforms are an indicator that disease causing bacteria and viruses may be present in the environment. Increasing levels of fecal coliforms are adversely impacting commercial uses of Morro Bay. The certified shellfish growers, have had to adapt their operation on the bay to ensure their shellfish meet water quality standards. They shut down for many days after rainfall and cannot harvest on portions of their lease area that have been closed, causing severe economic hardship for WSF. Some 46% of the lease area is classified as “Conditionally Approved” with a 0.4” rainfall closure for 5-12 days. This condition almost insures constant closure through a typical winter. This has caused WSF to reduce its operation and lose money. WSF is not buying a quantity of seed oysters it could utilize to grow out on all of its leasehold. Additionally, WSF has lost sales locally where many people are aware of the pollution problem. Since water quality appears to be declining, further restrictions to the shellfish growing area classifications are possible. Any additional restrictions may be cost prohibitive for the local grower. Increasing levels of bacteria could also have a negative impact on many recreational activities in the bay. Due to elevated levels found in the bay in recent years, sampling has been conducted by the County Health Department and the CCRWQCB. Fecal coliform samples have been taken to ensure popular recreational areas meet the water contact standards for activities such as swimming, wading and kayaking. In the past, some samples have exceeded CCRWQCB Basin Plan standards for recreational contact. As stated earlier, sampling parameters such as fecal coliforms, including E. coli, are indicators that disease-causing bacteria may be present. These parameters are used by state and federal agencies to set both shellfish and recreational standards for water quality. Sampling to date has relied upon these indicators to assess the existence of harmful bacterial contamination. However, many of these parameters are not only present in human waste, but in waste from other
7

Identifying the Sources of Escherichia coli Contamination to the Shellfish Growing Areas of the Morro Bay Estuary Final Report 3/29/2002
warm blooded animals. Given the existence of many different animals in the watershed and estuary that harbor E. coli, it is impossible to define the sources of contamination by simply counting fecal coliforms. Because the sources of fecal coliform bacteria in Morro Bay are numerous, management of land use and activities in the watershed and estuary is extremely difficult. The results of this study will aid in determining the sources of fecal coliform contamination (e.g. cattle or human) and thus help to prioritize water quality improvement actions (e.g. intensive grazing management or improved wastewater treatment) in the Morro Bay watershed. This study will provide local agencies with information to protect numerous beneficial uses, such as contact and non-contact recreation and shellfish harvesting. Managers will have scientific information to direct limited and valuable resources towards actions that most effectively reduce bacterial levels in the bay. The CCRWQCB’s Shellfish Technical Advisory Committee will use results of this study to make recommendations and prioritize areas for implementing management measures. The results of this study will also be incorporated into a Total Maximum Daily Load (TMDL) for pathogens in Morro Bay.
STUDY OBJECTIVES AND ASSUMPTIONS
Primary Objectives: • To identify the sources of bacterial contamination which threaten the shellfish harvesting
waters of the Morro Bay estuary. • To ascertain these contributions separately for both wet and dry seasons. • To ascertain differences in these source contributions for individual sites around the bay.
Secondary Objectives: • To identify the sources of bacterial contamination which threaten water-contact
recreation in the Morro Bay estuary. • To expand the database of fecal coliform strains and their fingerprints that can be used in
this and later studies to identify the sources (i.e. human, cow, bird) of bacterial contamination in other regions.
The assumptions that may be a part of this study include, but are not limited to the following:
• The results of the study are only as accurate as the library. That is, the origin of an E. coli strain can only be determined if a corresponding strain exists in the library.
• The chance that all unidentified strains of E. coli are from the same source is very small. • The study does not account for the geographical location of the E. coli source, only the
species of animal that the E. coli came from. • E. coli concentrations and/or sources do not necessarily represent fecal concentration,
pathogen concentration or pathogen type and so interpretation of this study is limited to analysis of the distribution of viable E. coli.
8
Identifying the Sources of Escherichia coli Contamination to the Shellfish Growing Areas of the Morro Bay Estuary Final Report 3/29/2002
STUDY DESIGN
Introduction The work done in this study was separated into three sampling efforts. The first sampling effort was focused on the major thrust of the study; tracking sources of E. coli around the bay. The other two sampling efforts consisted of MPN analyses of total and fecal coliforms. The second sampling effort involved collecting water samples around the Morro Bay watershed and sampling times were coordinated with the collection of samples for E. coli source tracking. The watershed sampling was designed to compliment the study of source tracking and to provide data for the CCRWQCB’s TMDL for Morro Bay. The third sampling effort consisted of a grid of sampling sites surrounding the “Prohibited” section of lease M-614-01, Parcel 1. This last effort was directed at understanding the distribution of fecal coliform in the bay during dry weather for DHS management of the shellfish lease areas.
Tracking the sources of E. coli using ribotyping Within the species of bacteria known as Escherichia coli there are many different strains, each of which has their own specific characteristics. For example, some strains can cause disease, and others are considered harmless. There are several methods in the literature for identifying different strains of E. coli and tracking sources in the environment1. The one chosen for use in this study is termed ribotyping because it uses the position of the ribosomal RNA genes (called rDNA) in the E. coli genome to create a strain specific pattern. This pattern looks rather like a supermarket bar code and can be used to compare to two cultures of E. coli to see if they derive from the same original strain. As methods for differentiating strains of bacteria have emerged it has become possible to determine whether E. coli strains have a preference for the intestines of specific host animals. Several recent studies shown a clear correlation between E. coli strains found in feces and the host animal source of those feces1. Thus, a new method for understanding fecal contamination in the environment has been applied. It is now possible to collect E. coli from the environment, make strain patterns, ribotypes for example, and compare them to patterns from a library of E. coli strains that were collected from animal feces. In this way, depending on the size of the library, the source of the E. coli in the environment can be determined in terms of what animal left feces that leaked bacteria into a given sample. Clearly the key issue in this kind of study is the size and composition of the E. coli library. The University of Washington’s School of Public Health has an extensive library of E. coli ribotypes (>75,000) from strains that were isolated from the feces of scores of different animals. This made UW an obvious choice for collaborating in this study of the sources of fecal contamination in Morro Bay.
Library source sampling Cal Poly was tasked to collect between 220 and 500 fecal samples (or 1000 strains) from all potential sources of contamination to the Morro Bay estuary. The existing library at UW 1 Kaspar, C.W., Burgess, J.L., Knight, I.T., and Colwell, R.R. (1990) Antibiotic resistance indexing of Escherichia coli to identify sources of fecal contamination in water. Can. J. Microbiol. 36: 891-894. Carson, C.A.; Shear, B.L., Ellersieck, M.R., and Asfaw, A.. (2001) Identification of Fecal Escherichia coli from Humans and Animals by Ribotyping. Appl. Environ. Microbiol. 67(4): 1503-1507. Dombek, P.E., Johnson, L.K., Zimmerley, S.T., and Sadowsky, M.J. (2000) Use of Repetitive DNA Sequences and the PCR to Differentiate Escherichia coli Isolates from Human and Animal Sources. Appl. Environ. Microbiol. 66(6): 2572-2577.
9

Identifying the Sources of Escherichia coli Contamination to the Shellfish Growing Areas of the Morro Bay Estuary Final Report 3/29/2002
contained strains from California, however, the library had no local source samples from the study site. As particular strains of E. coli can be localized, the intent of the local source sampling in the Morro Bay estuary watershed was to increase the percent of the total identified strains attributed to any particular source. Samples collected for increasing the library of sources were to include representative samples from four main categories of organisms; humans, birds, domestic mammals, and wild mammals (Table 1). These categories include dogs, cats, cattle, sheep, birds, raccoons, horses, deer, marine mammals, and humans. Additionally, samples were to be collected from the California Men’s Colony wastewater treatment plant in the Chorro Creek watershed. The target distributions of source samples approved by the MBSTAC are shown in Table 1. For all non-human sources samples taken, the genus name and often the species epithet were documented (time and location) and verified visually. Human sources were collected voluntarily or from wastewater treatment plants in the watershed, whereas domestic mammal sources were collected courtesy of local animal owners. Birds and wild mammal sources were collected in extensive field outings in which an animal was tracked visually and fecal matter collected individually so visual identification could be made for each source sample. No more than three samples were collected from the members of the same animal species from a given location. Only a single sample was collected from an individual animal. All samples were collected using Culturette EZ collection and transport systems (Becton and Dickson Microbiology Systems, Sparks, MD USA). All samples collected and returned to Cal Poly State University were immediately placed on ice and chilled to 4°C until shipped to UW (within 48 hours after collection) for ribotyping and addition to the E. coli strain genetic library. All sample containers were labeled with the following information: Sample type, host species, sample date and time, sample location, and sampler’s initials. All sample information was logged into a field log.
Table 1. Target distribution of library source samples used for ribotyping in this study.
Total Wild Mammals
62 Total Humans 125 Total Domestic Mammal
178 Total Birds 135
Deer 13 Los Osos 25 Cow 93 Gulls 35 Raccoon 5 Morro Bay 25 Horse 25 Egret 5 Ground squirrels
5 Waste Water Treatment
25 Sheep 10 Pelican 10
Sea Lions 6 Other 25 Dogs 40 Ducks 15 Harbor seals 10 Cats 10 Coots 25 Otters 3 Cormorants 10 Mice 5 Herons 5 Red Fox 5 Sand Pipers 15 Rabbits 5 Brandts 15 Opossum 5 Total Samples = 500
10

Identifying the Sources of Escherichia coli Contamination to the Shellfish Growing Areas of the Morro Bay Estuary Final Report 3/29/2002
Sampling, Isolation and Enumeration of E. coli Cal Poly collected samples for ribotyping with assistance from members of the MBSTAC and the San Luis Obispo Regional Water Quality Control Board. Samples were collected during five separate events [two (2) dry season weather events and three (3) rainfall events]. The MBSTAC selected sampling sites for ribotyping within the study region (Table 2). Dry weather sampling was conducted during periods when all “Conditionally Approved” growing areas were open for harvest. Dry sampling events were defined as either before the beginning of the rainy season (summer–early winter) or after the effects of the rainy season had
Table 2. List of sites where samples were
taken for ribotyping (see Figure 1.) Ribotype sites
Chorro Creek (@TWB)
Los Osos Creek (@SYB) Bay Site 11B Bay Site 12 Bay Site 13
3rd Street Dock Seep Pismo Seep
subsided (late spring–early summer). The dry season sampling periods were chosen according to historic periods of high coliform counts, rather than by calendar events (e.g. holidays). Water samples for ribotyping were collected during three wet season events occurring in winter-spring 1999-2001. For this study, a rainfall event was defined as a storm with precipitation greater than 0.4 inches of rain within a 24-hour period. Each wet sampling event consisted of two sampling days: the first and third day of the shellfish harvesting area closure. The first wet sampling event also included the first day the shellfish harvesting areas are re-opened but this practice was discontinued due to low coliform counts. Fecal coliform bacteria were isolated and enumerated using membrane filtration. Ten (10) water samples (100ml for the wet sampling and 1 liter for dry sampling events) were collected and sent to a California Department of Health Services certified laboratory, BIOVIR Laboratories, for filtration and incubation of filters for growing the fecal colonies2. The entire set of MF counts is presented in Appendix A. The CCRWQCB provided shipping of the samples to BIOVIR. Membrane filters with between 1 and 16 isolated colonies were sent to UW for isolation and identification of E. coli strains before ribotyping. In addition to water samples, Cal Poly collected a total of 10 oysters (increased from 5 after the first dry/wet events) and 10 sediment samples from the three bay sites (sites 11B, 12, 13) for the dry and wet weather events listed above. Oysters were “planted” at 6-12 inches depth by WSF at the site location prior to the initiation of the study to provide the oysters time to absorb bacteria representative of the locale. These samples (live oysters and 100ml samples of sediment) were sent directly from Cal Poly to UW for plating and isolation of E. coli strains. On February 27th, 2001, the MBSTAC also committed to sampling the fresh water seeps on the Los Osos side of Morro Bay for E. coli ribotyping in an attempt to characterize the impact of the seep sources of E. coli to the bay. Two freshwater seeps (Pismo Seep and 3rd Street Dock Seep) were sampled 20 times by Cal Poly over random days between June 1 and August 30, 2001 for a 2 American Public Health, “Recommended Procedures for Examination of Seawater and Shellfish” Edition IV, 1970.
11

Identifying the Sources of Escherichia coli Contamination to the Shellfish Growing Areas of the Morro Bay Estuary Final Report 3/29/2002
total of 40 samples. Water was sampled, filtered and colonies were grown and isolated for ribotyping according to the methods described above for the bay sites. Seep samples with more than five (5) colonies per filter were sent to UW for ribotyping.
Ribotyping Methodology
Sample arrival and logging Upon arrival, all samples were inspected for damage to sample containers or microbiological plates, and signs of contamination. Sample identifiers were also checked against the chain of custody papers. The provider’s sample identification number, provider ID, sample type, study ID, sample site, sample collection date, and sample arrival date were logged.
Isolation, identification and purification of E. coli strains samples Water samples were received in the form of membrane filter coliform (MF) plates, fecal and sediment samples arrived in specimen containers and oyster samples arrived either in their shells or as a mixed puree in a sample container. Fecal, sediment and oyster samples were plated on MacConkey agar and incubated at 35°C, overnight. The next day 3-5 lactose fermenting, non-mucoid colonies are picked and replated on MacConkey agar for purification. Water samples, had been previously plated on mFC plates. From each sample’s MF plate, 3-5 non-mucoid blue colonies were picked and plated on MacConkey agar for purification. At this stage each of the colonies picked from a given sample bore the provider Sample ID number and an accession letter. A single, well isolated, non-mucoid colony was picked from each MacConkey plate and plated on Tripticase Soy Agar. After overnight incubation at 35°C, each culture is tested by the spot indole test using appropriate positive and negative controls. Indole positive cultures are further tested for the ability to utilize citrate using the Simons Citrate media. E. coli colonies were identified as indole positive and citrate negative and were given isolate numbers. A portion of each E. coli strain isolated from the samples was stored at -80° C , in nutrient broth plus 15% glycerol.
Genomic DNA isolation and restriction endonuclease digestion Confluent growth was scraped with a sterile flat-headed toothpick and suspended in 200 µl of 50 mM Tris, 50 mM EDTA (pH 8.0). 600 µl more of 50mM Tris, 50 mM EDTA were then added and the suspension was thoroughly mixed by pipetting up and down. 45 µl 20% sodium dodecyl sulfate (SDS) and then 10 µl proteinase K (20 µg ml-1; Pharmacia, Piscataway, N.J.) were added. The solution was then incubated for 1 hour at 40° C. After an equal volume of phenol was added to each tube the samples were vortexed and centrifuged for 5 minutes. The top layer was extracted and an equal volume of chloroform was added. After vortexing again, the preparation was then centrifuged and extracted. Two and one-half volumes of absolute ethanol were added and the DNA was precipitated out and spooled onto a glass capillary pipette. The DNA was washed with a few drops of absolute ethanol, dried, and re-suspended in 50 µl dH2O. Restriction endonuclease digestion reactions were set up using EcoR1 and PvuII, 10 units (Boehringer Mannheim GmbH, Germany) using 2 µl DNA as instructed by the manufacturer. They were incubated overnight at 37°C. The samples were centrifuged and 0.5 µl of enzyme was added. The samples were re-incubated at 37° C for a minimum of three hours. They were centrifuged again and 3 µl of stop dye was added.
12
Identifying the Sources of Escherichia coli Contamination to the Shellfish Growing Areas of the Morro Bay Estuary Final Report 3/29/2002
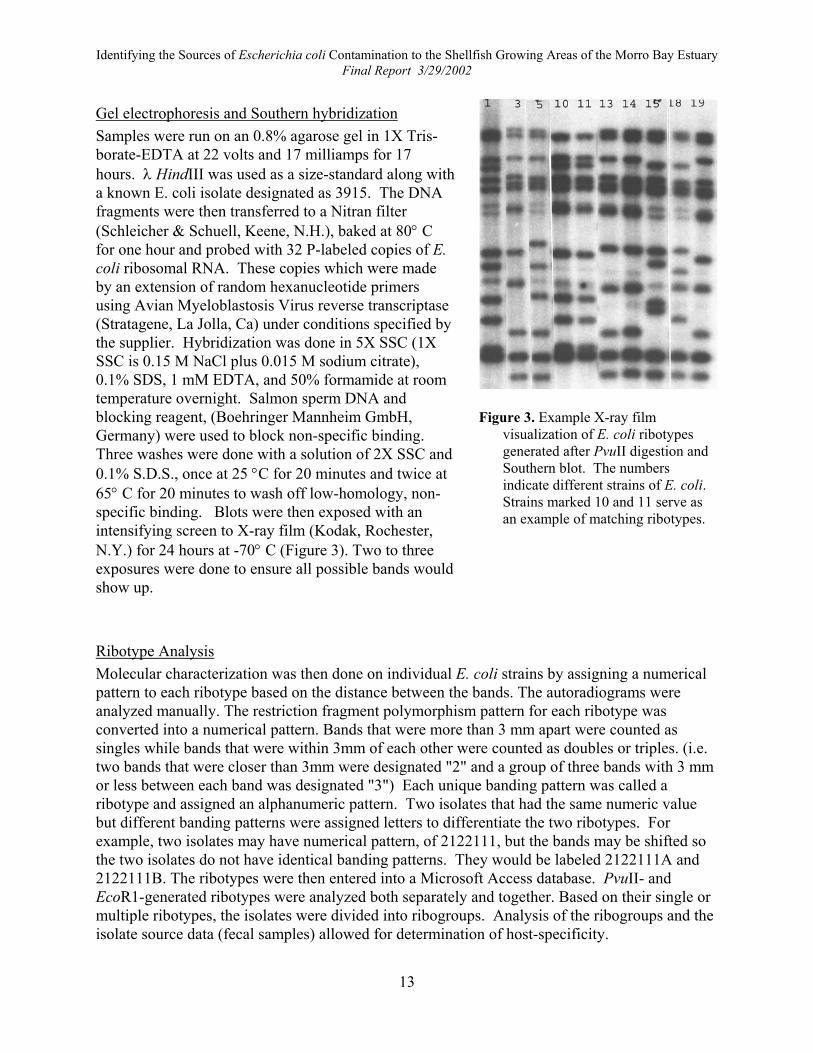
Gel electrophoresis and Southern hybridization Samples were run on an 0.8% agarose gel in 1X Tris-borate-EDTA at 22 volts and 17 milliamps for 17 hours. λ HindIII was used as a size-standard along with a known E. coli isolate designated as 3915. The DNA fragments were then transferred to a Nitran filter (Schleicher & Schuell, Keene, N.H.), baked at 80° C for one hour and probed with 32 P-labeled copies of E. coli ribosomal RNA. These copies which were made by an extension of random hexanucleotide primers using Avian Myeloblastosis Virus reverse transcriptase (Stratagene, La Jolla, Ca) under conditions specified by the supplier. Hybridization was done in 5X SSC (1X SSC is 0.15 M NaCl plus 0.015 M sodium citrate), 0.1% SDS, 1 mM EDTA, and 50% formamide at room temperature overnight. Salmon sperm DNA and blocking reagent, (Boehringer Mannheim GmbH, Germany) were used to block non-specific binding. Three washes were done with a solution of 2X SSC and 0.1% S.D.S., once at 25 °C for 20 minutes and twice at 65° C for 20 minutes to wash off low-homology, non-specific binding. Blots were then exposed with an intensifying screen to X-ray film (Kodak, Rochester, N.Y.) for 24 hours at -70° C (Figure 3). Two to three exposures were done to ensure all possible bands would show up.
Figure 3. Example X-ray film
visualization of E. coli ribotypes generated after PvuII digestion and Southern blot. The numbers indicate different strains of E. coli. Strains marked 10 and 11 serve as an example of matching ribotypes.
Ribotype Analysis Molecular characterization was then done on individual E. coli strains by assigning a numerical pattern to each ribotype based on the distance between the bands. The autoradiograms were analyzed manually. The restriction fragment polymorphism pattern for each ribotype was converted into a numerical pattern. Bands that were more than 3 mm apart were counted as singles while bands that were within 3mm of each other were counted as doubles or triples. (i.e. two bands that were closer than 3mm were designated "2" and a group of three bands with 3 mm or less between each band was designated "3") Each unique banding pattern was called a ribotype and assigned an alphanumeric pattern. Two isolates that had the same numeric value but different banding patterns were assigned letters to differentiate the two ribotypes. For example, two isolates may have numerical pattern, of 2122111, but the bands may be shifted so the two isolates do not have identical banding patterns. They would be labeled 2122111A and 2122111B. The ribotypes were then entered into a Microsoft Access database. PvuII- and EcoR1-generated ribotypes were analyzed both separately and together. Based on their single or multiple ribotypes, the isolates were divided into ribogroups. Analysis of the ribogroups and the isolate source data (fecal samples) allowed for determination of host-specificity.
13

Identifying the Sources of Escherichia coli Contamination to the Shellfish Growing Areas of the Morro Bay Estuary Final Report 3/29/2002
14
MPN counts of Total and Fecal Coliforms
Bay sampling In conjunction with sampling for genetic fingerprinting, water, oyster and sediment samples were collected by Cal Poly for total and fecal coliform counts [multiple tube fermentation method to obtain the most probable number (MPN)3]. Bay sampling sites are provided in Table 3. Dry season sampling events consisted of two days sampled 48 hours apart (e.g. Monday and Wednesday). Wet sampling events for MPN consisted of four sampling days: the first, second, and third day of the shellfish harvesting area closure, and on the first day the shellfish harvesting areas were re-opened. Oysters and sediment samples (numbers of samples identical to the ribotyping effort) were collected only on the same days that samples were collected for ribotyping. The oyster and sediment samples were homogenized prior to inoculating the fermentation tubes. The MPN sampling protocol was approved by the MBSTAC with analyses funded by the SWRCB. Cal Poly coordinated the sample collection efforts, collected samples, put them on ice and delivered them to the CCRWQCB, which provided shipping of the samples to one of the following California Department of Health Services certified laboratories: BioVir, Benicia; Creek Environmental, San Luis Obispo; San Luis Obispo County Health, San Luis Obispo; BC labs, Bakersfield. Bay samples were sent to shellfish certified labs only (BioVir and San Luis Obispo County Health). The collection effort for MPN samples was coupled with sampling for ribotyping for the five DNA sampling sites (Table 3). The complete set of MPN counts from the bay sampling sites are presented in Appendix B.
3 Standard Methods, 18th Edition, 9221b,e
Table 3. List of sites where samples were taken for MPN analysis of total and fecal coliform in Morro Bay.
Bay Sampling Sites
3rd Street Dock Seep Pismo Seep Bay Site 7
Bay Site 13 Bay Site 11 Bay Site 11a Bay Site 11b Bay Site 12 Bay Site 13a Bay Site 13b Bay Site 13c Bay Site 13d
Baywood Park Inlet Channel Marker 4
Channel Marker 12 Creek Mouth
Cuesta Channel Marker Cuesta Inlet
Grassy Island Channel Bay Mouth
Sand Spit Channel Shark Inlet

Identifying the Sources of Escherichia coli Contamination to the Shellfish Growing Areas of the Morro Bay Estuary Final Report 3/29/2002
Watershed sampling In addition to the MPN samples collected in the bay during dry and wet events, there was a coordinated effort with the CCRWQCB to collect water samples for MPN analysis throughout the Morro Bay watershed. Sample locations are given in Table 4 and Figure 4. Water samples (100ml) were collected, put on ice and transferred to the CCRWQCB as described above. The complete set of MPN counts from the watershed sampling sites are presented in Appendix C. These data were collected as part of a larger effort to provide the CCRWQCB with addition data for their upcoming Total Maximum Daily Load (TMDL) report for pathogens in Morro Bay.
Figure 4. Map of Morro Bay watershed with the approximate
positions of the sampling sites marked as per Table 4.
Table 4. List of sites where samples were taken for MPN analysis of total and fecal coliform in the Morro Bay watershed (Figure 4).
Watershed Sampling Sites
T-pier H Shasta A
State Park D Chorro Creek (TWB)
Los Osos Creek (SYB) Chorro at Canet Road (CAN)
San Luisito Creek (SLU) San Bernardo Creek (SBE)
Warden Creek (WAR) Clark Canyon Creek (LVR)
Los Osos Creek (SYB) 3rd Street Dock Seep
Pismo Seep Sweet Springs
Pasadena U Baywood Pier S
Cuesta Inlet Doris and Binscarth Upper Groundwater Well 3rd StreetLower Groundwater Well 8th Street
Standpipe at 2nd and El Moro T-pier H Shasta A
15

Identifying the Sources of Escherichia coli Contamination to the Shellfish Growing Areas of the Morro Bay Estuary Final Report 3/29/2002
Lease area 13 grid sampling On February 27, 2001, the MBSTAC decided to conduct a third “dry season sampling” referred to here as the “grid at 13” sampling. The focus of this study was to characterize the “Prohibited” portion of lease M-614-01, Parcel 1, which has been closed year-round. DHS established fifteen sampling stations around Parcel 1 in a “grid” format. Unlike the other sampling stations in this study that had physical markers for location, these stations were identified using a GPS and the coordinates listed in Table 5. Locations included the eelgrass-covered areas as well as both the channel and mud flats (Figure 5). Water was collected (100ml) at each of these sampling stations for twenty-five (25) days randomly selected between June 1 and October 1, 2001. Twenty of these sampling days coincided with the seep sampling events (see above). Samples were tested for fecal coliform by the MPN method. This grid sampling was designed to help DHS better characterize the growing area and possibly allow a portion of the lease area to reopen if the data was supportive. The susceptibility of the mudflats and/or the channel to higher levels of fecal coliform counts was evaluated as part of this effort. Table 5. List of sites where samples were
taken for MPN analysis of total and fecal coliform in the grid at Parcel 1 (Figure 5).
Sampling Sites Lon. (N) Lat (W)
Bay Site 12 35.20.33 120.50.90 Bay Site 13 35.20.74 120.50.99
Bay Site 13A 35.20.86 120.51.03 Bay Site 50 35.20.53 120.51.47 Bay Site 51 35.20.48 120.51.31 Bay Site 52 35.20.46 120.51.14 Bay Site 53 35.20.49 120.50.99 Bay Site 54 35.20.64 120.51.31 Bay Site 55 35.20.64 120.51.20 Bay Site 56 35.20.64 120.51.09 Bay Site 57 35.20.81 120.51.28 Bay Site 58 35.20.76 120.51.19 Bay Site 59 35.20.70 120.51.10 Bay Site 60 35.20.90 120.51.26 Bay Site 61 35.20.90 120.51.17
Figure 5. Map of Morro Bay with oyster lease M-614-
01, Parcel 1. The approximate position of the “grid at 13” sampling sites are marked as per Table 5.
16

Identifying the Sources of Escherichia coli Contamination to the Shellfish Growing Areas of the Morro Bay Estuary Final Report 3/29/2002
Quality Assurance and Quality Control (QA/QC) Measures To address QA/QC issues that were brought up during the design phase of the study, a set of four experiments were initiated.
Water Quality (Total and Fecal Coliform) QA/QC Because the total and fecal coliform counts were performed at four different certified laboratories, an inter-lab calibration study was conducted to ensure that all four labs were returning comparable data. BioVir Laboratories prepared four 1 liter bay water samples that had been spiked with differing amounts of sewage sludge. The samples were aliquoted into 100 ml jars and sent to each of the four California Department of Health Services certified laboratories involved in the study (although only BioVir and SLOCH labs were certified for shellfish). The MPN total and fecal coliform counts that were returned are summarized in Figure 6. All four labs returned results that were statistically indistinguishable. Differences between the lab results were within the 95% confidence limit for any one measurement.
10
100
1000
10000
100000
Total Fecal Total Fecal Total Fecal
Samples
Tot
al o
r Fe
cal C
olifo
rm C
ount
(MPN
/100
ml)
BC Labs
Sample #1 Sample #3Sample #2
BioVir Labs
SLO County Health
Creek Environmental Labs
Figure 6. Comparison of Total and Fecal Coliform counts from the four certified laboratories using the MPN method on the same three samples.
17

Identifying the Sources of Escherichia coli Contamination to the Shellfish Growing Areas of the Morro Bay Estuary Final Report 3/29/2002
Comparison of Membrane Filtration and MPN Another QA/QC issue was brought out by the necessity of using the membrane filtration (MF) method for isolating fecal coliforms for ribotyping. The California Department of Health Services (overseeing the oyster harvesting operation) is limited to using fecal coliform numbers gathered using the MPN method. This sub-study was undertaken to determine the relationship between counts collected using the MPN method and counts obtained with the MF method. Since the sites chosen for study in the bay had samples collected using both methods we were able to compare the results (Figure 7). Regression analysis showed a statistically significant relationship between the two methods.
-1
0
1
2
3
4
5
-1 0 1 2 3
Log Membrane Filtration [log(CFU/100ml)]
Log
Mos
t Pro
babl
e N
umbe
r [lo
g(M
PN/1
00m
l)]
MPN = 3.63 x MF0.89
R2 = 0.87 (p < 0.01)
4
Figure 7. Comparison of Membrane Filtration and MPN methods for estimating fecal
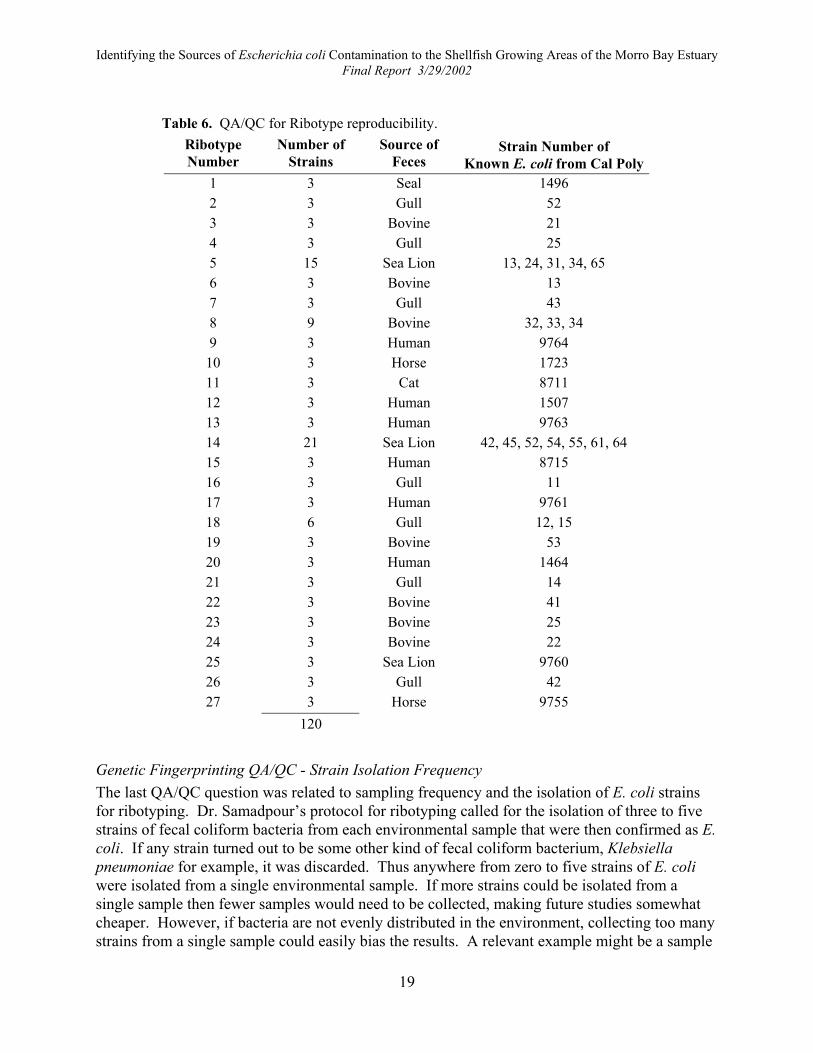
coliform counts. Genetic Fingerprinting QA/QC - Ribotyping Reproducibility The question of reproducibility for the ribotyping method had not been addressed in the scientific literature at the time this study was initiated. Therefore, a double-blind sub-study was performed to address reproducibility for the ribotyping method. This sub-study examined how often the same strain of E. coli would produce the same exact ribotype pattern. Cal Poly isolated and confirmed as E. coli (using API20E strips) forty strains from known fecal sources. Triplicate cultures of each strain were collected and then labeled with random numbers before they were sent to UW for ribotyping. These were added to the source sample library after completion of the double-blind study and were in addition to Cal Poly’s initial library source sampling effort. At UW the ribotypes of all 120 strains were compared and placed into exact match groups. Cal Poly was sent this information to compare to the original strain designations. As Table 6 shows, all triplicate ribotypes matched without exception. Some of the strains from the same source gave the same ribotypes. This implies that the same strain of E. coli was present in both fecal samples which is expected for animals in the same species.
18
Identifying the Sources of Escherichia coli Contamination to the Shellfish Growing Areas of the Morro Bay Estuary Final Report 3/29/2002
Table 6. QA/QC for Ribotype reproducibility.
Ribotype Number
Number of Strains
Source of Feces
Strain Number of Known E. coli from Cal Poly
1 3 Seal 1496 2 3 Gull 52 3 3 Bovine 21 4 3 Gull 25 5 15 Sea Lion 13, 24, 31, 34, 65 6 3 Bovine 13 7 3 Gull 43 8 9 Bovine 32, 33, 34 9 3 Human 9764
10 3 Horse 1723 11 3 Cat 8711 12 3 Human 1507 13 3 Human 9763 14 21 Sea Lion 42, 45, 52, 54, 55, 61, 64 15 3 Human 8715 16 3 Gull 11 17 3 Human 9761 18 6 Gull 12, 15 19 3 Bovine 53 20 3 Human 1464 21 3 Gull 14 22 3 Bovine 41 23 3 Bovine 25 24 3 Bovine 22 25 3 Sea Lion 9760 26 3 Gull 42 27 3 Horse 9755
120
Genetic Fingerprinting QA/QC - Strain Isolation Frequency The last QA/QC question was related to sampling frequency and the isolation of E. coli strains for ribotyping. Dr. Samadpour’s protocol for ribotyping called for the isolation of three to five strains of fecal coliform bacteria from each environmental sample that were then confirmed as E. coli. If any strain turned out to be some other kind of fecal coliform bacterium, Klebsiella pneumoniae for example, it was discarded. Thus anywhere from zero to five strains of E. coli were isolated from a single environmental sample. If more strains could be isolated from a single sample then fewer samples would need to be collected, making future studies somewhat cheaper. However, if bacteria are not evenly distributed in the environment, collecting too many strains from a single sample could easily bias the results. A relevant example might be a sample
19

Identifying the Sources of Escherichia coli Contamination to the Shellfish Growing Areas of the Morro Bay Estuary Final Report 3/29/2002
of bay water that included a chunk of feces. During transit to the laboratory the chunk could break apart and that sample would have a much higher number of E. coli with same ribotype than was present in the rest of the bay. The original sub-study design was to collect ten strains from single samples and compare the distribution of ribotypes to when only 1 strain per sample was isolated from the same environment. This was to be done with bay water, sediment and oyster samples. Unfortunately, it was not possible to consistently collect 10 strains from a single sample and attempts resulted in at most 5 to 6 E. coli strains being isolated from the designated samples. Four samples with 16 strains each were collected in a final attempt to isolate larger numbers of strains from a single sample. The correct method for validating the assumption that multiple strains from a single sample are independent and would not bias results requires the comparison of a single sample with multiple strains against the same number of strains gathered as one strain per sample. The ribotype distributions under these strategies should then be compared using a simple Chi-squared Test of Independence or Fisher’s Exact Test. If a significant difference between these two strategies is found, then one must rely solely on the single strain per sample data set. If no difference is found, however, there is evidence that the multiple strains per sample data set would be acceptable. Unfortunately, because only a small number of strains (16) were ever isolated from a single filter, both the Chi-squared and Fisher tests would possess very low power. In fact, because the number of ribotypes seen in the study was quite large (674) it is now clear that even 16 strains per sample would not address this question. More than 100 strains must be isolated from a single sample before the method has sufficient power for the results to be convincing. This approach would be prohibitively expensive so another method was sought to address this problem. In the interests of presenting a statistically conservative analysis, a new data set was constructed such that in cases where multiple strains were collected from a single sample, only the first strain from that sample was used (singleton data set). In some cases there was only one strain isolated from a sample and so this resulted in no loss of data. In the worst case 16 strains were isolated from a single sample, resulting in the loss of 15 strains from the data set. The singleton data set thus contained 579 strains instead of the original 1659. To assess the impact of using the complete data to represent the ribotype distributions rather than the singleton data, each ribotype’s relative frequency was computed with both data sets. For each ribotype that was represented in both samples, the difference in relative frequency was computed. Ribotypes that only appeared in the complete data set but not in the singleton data were conservatively discarded, as their appearance may be an artifact of increased sampling effort and thus may indicate that the two distributions differ when in fact they do not. Because the data is highly non-normal, a sign test was used to analyze the differences. A significant difference in ribotype representation was found between the two strategies (p < 0.0001). Thus the complete data set probably has dependent (or otherwise non-representative) data. The above analysis was repeated for a different set of singletons: the last strain from each sample as opposed to the first. A significant difference was again found between the methods (p < 0.001). To verify that this method of comparing the distributions is unbiased and does not tend to yield false positive results, the first and last singleton data were compared with each other.
20

Identifying the Sources of Escherichia coli Contamination to the Shellfish Growing Areas of the Morro Bay Estuary Final Report 3/29/2002
This test did not find a significant difference between these two distributions (p = 0.3059). Thus, it appears that this method is both robust at detecting differences in the distributions, and that our choice to use the first strain from the samples introduced no bias in the results. From this analysis it appears that future studies should only collect the ribotype of a single E. coli from each sample taken.
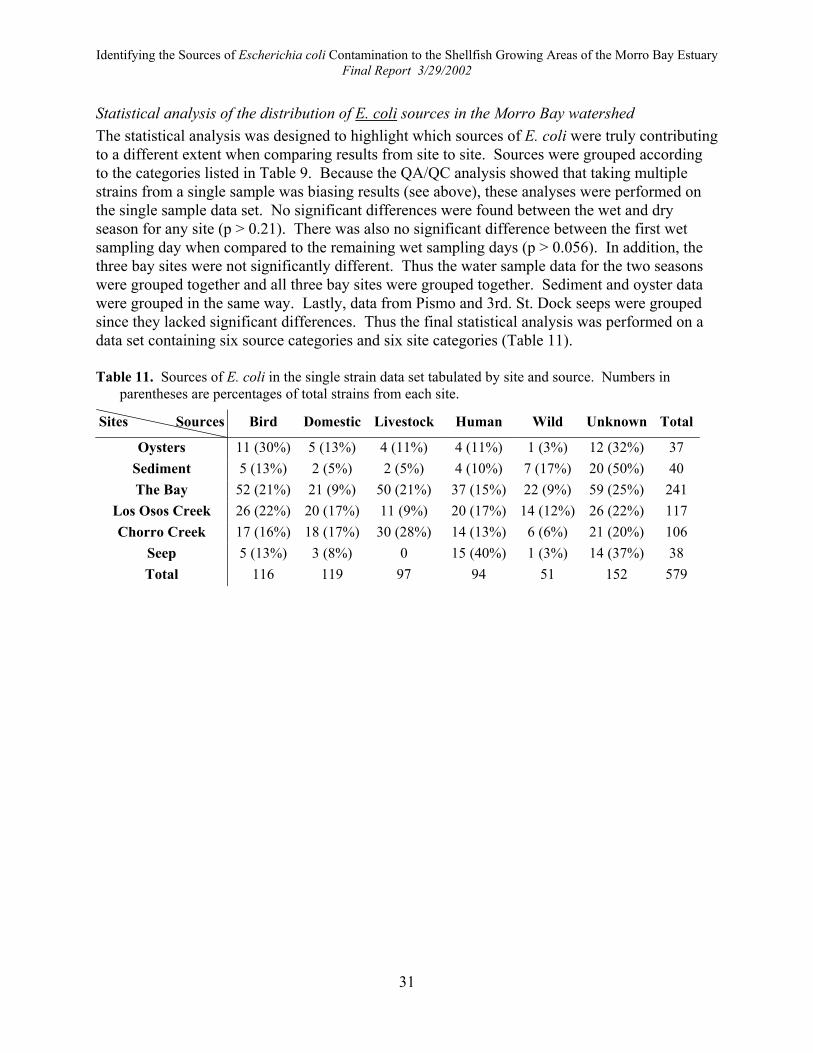
Statistical comparisons of ribotype distributions The ribotype distributions at each site and time were compared using loglinear models (Agresti, 1990). All modeling began with a saturated model to express the multiway table representing the distribution of samples across ribotype groups (e.g., bird, livestock, domestic, human, wild, unknown, etc), sampling locations (e.g., Bay 11B, Bay 12, Bay 13, Chorro Creek, etc.), and sampling season (e.g., wet or dry). When necessary, in cases where there was no significant evidence that the data differed across ribotype groups, sampling locations, or seasons, data was pooled to provide numerical stability of the estimates and/or as an aid to model interpretation. In cases where the cells of the multiway table were empty and groups (or locations or seasons) could not be meaningfully combined, the data was analyzed by first adding 0.5 to all tabled values to ensure numerical stability (i.e., to avoid computing the logarithm of zero) (Agresti, 1990). Chi-square tests were used to assess whether or not differences existed in the ribotype distributions across season and site. Sites were compared among each other by examining the model coefficients and statistical significance was assessed using Wald tests. The loglinear model requires that the observations are a random sample from a multinomial distribution and therefore are independent. In this context, it is required for a given site and time, that the strains analyzed are independent so that conditions do not exist where the presence of a certain ribotype in the sample alters the probability of observing another ribotype from the underlying distribution. In other words, if you take more than one strain per sample there is a clear chance that you will bias results. Thus the results presented in the report are based on the singleton data that included only one strain per sample. The results of statistical analysis with the complete data set are presented in Appendix F.
21

Identifying the Sources of Escherichia coli Contamination to the Shellfish Growing Areas of the Morro Bay Estuary Final Report 3/29/2002
RESULTS & DISCUSSION
Fecal Coliform counts (MPN) Fecal coliform counts in the bay sampling sites were consistently less than counts in Los Osos and Chorro Creeks (Figure 8). During the wet sampling, the fecal coliform counts were about two orders of magnitude higher on average than the samples take during the dry season (Figure 8). During the wet sampling, there was a large increase in the fecal coliform MPN the day of the event, however the high levels decreased one day after a rain event. There were no significant differences between the samples taken on the reopening day for the oyster growing areas and those taken during the dry sampling events (ANOVA, p > 0.3). Fecal coliform counts from Pismo and 3rd St. Dock seeps were consistently above the recreational contact standard, independent of season (Figure 9). Fecal Coliform counts in the oysters and sediment varied inconsistently during rain events although counts were consistently higher for wet compared to dry sampling times. The complete set of MPN fecal coliform counts are provided in Appendix B.
374
104
11
5
3.0
313
193
10
5
1.8
175
27
7
3 2.5
3265
484348
106130
280189
291
9764
1913
1
10
100
1000
10000
Day 1 Wet Day 2 Wet Day 3 Wet Reopen Dry
Feca
l Col
iform
(MPN
/100
ml)
Bay Site 13
Bay Site 11B
Bay Site 12
Los Osos Creek
Chorro Creek
Figure 8. Geometric mean of MPN counts of fecal coliforms at the DNA sites in Morro Bay, Los Osos and Chorro creeks during the course of the study.
22

Identifying the Sources of Escherichia coli Contamination to the Shellfish Growing Areas of the Morro Bay Estuary Final Report 3/29/2002
100
10000
4/17
/00
4/18
/00
4/19
/00
4/22
/00
6/19
/00
6/21
/00
8/29
/00
8/31
/00
10/2
9/00
10/3
0/00
10/3
1/00
11/3
/00
3/5/
01
3/6/
01
3/7/
01
3/12
/01
Sample Dates
Feca
l Col
iform
(MPN
/100
mL)
Pismo Seep3rd St. Dock seep
Figure 9. MPN counts of fecal coliforms at the seeps during the course of the study. Dark bars were from samples taken during wet events and light bars from dry events. The line indicates the recreational contact limit of 200 MPN/100 mL.
Loading estimates The MPN fecal coliform counts taken from Los Osos and Chorro creeks over the course of this study combined with the flow rates from the creeks provide an estimate of the total fecal coliform load to the bay from the creeks. Flow rates in daily average cubic feet per second were obtained from John Wadell of San Luis Obispo County. Flow rates were available for the years 1993-2000 for Los Osos Creek and years 1987-2000 for Chorro Creeks. In order to remove the annual variation in rainfall and runoff between years, the flow rates used in this study for loading calculations were those taken from both creeks from 1993-2000. Flow data from these creeks were adjusted based on the location of the gauging station and the proportion of the watershed that was represented. For example, flow totals from Los Osos Creek gauging station (placed where Los Osos Valley Road crosses the creek) did not include the flows from Warden Creek and minor tributaries, which represents ~ 70% of the watershed. Therefore, measured flow totals from Los Osos Creek were increased by a factor of 3.3. A similar approach was taken for flow estimates from Chorro Creek gauging station (placed at Canet Road), although proportionally more of the watershed had available measurements (54%). Both creek’s flows were estimated for the point at which samples were taken for fecal coliform counts (SYB and TWB). Watershed areas were delineated from the Tetra Tech Sediment Loading Study (1998). Daily average cubic feet per second measurements for a given month over the 1993-2000 period were converted to liters per month and the months from October to September summed to give yearly rates (Table 7). Maximum (10/97 to 9/98) and minimum (10/93 to 9/94) yearly flows were included to show interannual variation. Seep flows, estimated from a previous Tetra Tech study (1998) were presented as an average yearly flow (Table 7). For each month sampled during this study, a geomean was used to estimate fecal coliform concentrations in the creeks and groundwater. For
23

Identifying the Sources of Escherichia coli Contamination to the Shellfish Growing Areas of the Morro Bay Estuary Final Report 3/29/2002
months where no MPN samples were taken, a linear interpolation was used to estimate the monthly concentration for each flow. The flow data was then combined with the fecal coliform concentrations to produce yearly bacterial loadings (Table 7). While Chorro Creek had consistently higher flows, the larger coliform counts in Los Osos Creek resulted in higher loading on average for Los Osos Creek. However, during the high flow year the coliform loading was greatest from Chorro Creek. Ground water coliform loading contributions were two orders of magnitude less than the creeks.
Table 7. Yearly Loading of fecal coliforms (MPN/yr) for Los Osos Creek, Chorro Creeks and groundwater (the seeps).
Minimum Mean Maximum Flow (L/yr) (1993-1994) (1993-2000) (1997-1998)
Los Osos Creek 1.19E+09 1.57E+10 1.94E+10 Chorro Creek 2.66E+10 3.06E+10 6.19E+10 Groundwater 8.93E+08
Load (MPN/yr) Los Osos Creek 1.46E+13 2.29E+14 2.45E+14 Chorro Creek 1.10E+14 1.31E+14 2.63E+14 Groundwater 2.42E+12
Library source samples Library source samples collected during this study are summarized in Table 8. Due to difficulties with obtaining permits for mammal tracking and trapping, there were no wild mammal sources collected from the Morro Bay watershed. The sample size for humans and domesticated dogs and cats were low due to poor community response to our voluntary mailing system. The number of domestic mammals and local bird samples were near expectations and the species of the area were well represented in the bird populations. Table 8. Distribution of library source samples provided for ribotyping in this study.
Total Wild Mammals
73
Total Humans
34
Total Domestic Mammal
130
Total Birds
121
Deer 0 Los Osos or Morro Bay 32 Cow 97 Gulls 35Raccoon 0 Waste Water Treatment Plant 2 Horse 25 Egret 4
Ground squirrels 0 Sheep 8 Pelican 0 Sea Lions 70 Dogs 6 Ducks 6
Harbor seals 3 Cats 5 Coots 25Otters 0 Cormorants 17Mice 0 Herons 6
Red Fox 0 Sand Pipers 4 Rabbits 0 Brandts 15
Opossum 0 Godwit 11Total Samples = 358
24

Identifying the Sources of Escherichia coli Contamination to the Shellfish Growing Areas of the Morro Bay Estuary Final Report 3/29/2002
Source and strain tracking A grand total of 1659 strains of E. coli were isolated from the samples collected around Morro Bay (full data set in Appendix D). A total of 29 different sources were identified as contributing E. coli to the sampling sites (Tables 9 and 10). To facilitate source characterization, ribotype sources were placed into six groups that each described a general category (Table 9). Fecal sources were determined for 1235 strains (74.4%), while 424 strains (25.6%) could not be matched to any strain in the UW library. The percentage of strains from unknown sources ranged from 16% (in Chorro Creek and Pismo Seep) to 54% (in sediment) at different sampling sites. When results were summed over the entire study the largest fractions of E. coli came from four sources: bird (22%), human (17%), bovine (14%) or dog (9%). Expressed as a percent of E. coli strains with known sources: bird (30%), human (23%), bovine (19%) or dog (11%). Birds were the largest source of E. coli in the bay waters, Los Osos Creek, 3rd St. Dock seep, sediment and oysters. Bovine sources contributed the majority of E. coli in Chorro Creek and humans contributed most at Pismo Seep.
Table 9. Grouping of sources of E. coli found in this study. Column headers (bold) are the groupings used for later analyses.
Bird Livestock Domestic Human Wild
Avian Bovine Canine Human Marine Mammal Pigeon Horse Dog WWTP Sludge Sea Lion Crow Sheep Cat-Dog Seal Gull Porcine Cat Deer Duck Feline Deer-Elk
Duck-Goose Fox Goose Rabbit
Opossum Raccoon Rat Rodent
25

26
Table 10. Sources of E. coli found at each site where samples were taken.
SITE
Tota
l E. c
oli
Avi
an
Pige
on
Cro
w
Gul
l
Duc
k D
uck/
Goo
se
Goo
se
Bov
ine
Hor
se
Shee
p Po
rcin
e C
anin
e
Dog
Cat
/Dog
C
at
Felin
e
Hum
an
WW
TP S
ludg
e M
arin
e M
amm
al
Sea
Lion
Seal
D
eer
Dee
r/Elk
Fo
x R
abbi
t O
poss
um
Rac
coon
R
at
Rod
ent
Unk
now
n
Bay 11b 233 40 0 1 12 2 0 2 32 8 0 0 3 13 0 0 1 51 2 3 4 2 3 0 0 0 0 2 2 3 47%(Total at site) 17 0 <1 5 1 0 1 14 3 0 0 1 6 0 0 <1 22 1 1 2 1 1 0 0 0 0 1 1 1 20
%(Known) 22 0 1 6 1 0 1 17 4 0 0 2 7 0 0 1 27 1 2 2 1 2 0 0 0 0 1 1 2 n/aBay 12 203 23 0 0 13 0 1 2 30 3 0 0 6 17 0 0 3 33 0 2 4 3 2 0 1 0 2 0 0 3 55
%(Total at site) 11 0 0 6 0 <1 1 15 1 0 0 3 8 0 0 1 16 0 1 2 1 1 0 <1 0 1 0 0 1 27%(Known) 16 0 0 9 0 1 1 20 2 0 0 4 11 0 0 2 22 0 1 3 2 1 0 1 0 1 0 0 2 n/a
Bay 13 169 31 0 0 13 0 1 2 31 6 0 0 0 14 0 4 0 19 0 2 1 2 1 1 0 1 0 1 0 3 36%(Total at site) 18 0 0 8 0 1 1 18 4 0 0 0 8 0 2 0 11 0 1 1 1 1 1 0 1 0 1 0 2 21
%(Known) 23 0 0 10 0 1 2 23 5 0 0 0 11 0 3 0 14 0 2 1 2 1 1 0 1 0 1 0 2 n/aChorro Creek 301 34 0 1 8 0 0 3 93 11 2 0 10 18 5 0 6 38 0 0 0 0 8 0 0 0 5 2 0 7 50
%(Total at site) 11 0 <1 3 0 0 1 31 4 1 0 3 6 2 0 2 13 0 0 0 0 3 0 0 0 2 1 0 2 16%(Known) 14 0 <1 3 0 0 1 37 4 1 0 4 7 2 0 2 15 0 0 0 0 3 0 0 0 2 1 0 3 n/a
Los Osos Creek 333 65 3 2 5 1 0 5 26 5 0 1 6 39 0 2 9 63 0 0 0 0 8 2 0 5 1 3 1 6 75%(Total at site) 20 1 1 2 <1 0 2 8 2 0 <1 2 12 0 1 3 19 0 0 0 0 2 1 0 2 <1 1 <1 2 23
%(Known) 25 1 1 2 <1 0 2 10 2 0 <1 2 15 0 1 3 24 0 0 0 0 3 1 0 2 <1 1 <1 2 n/aOysters 91 31 0 0 3 0 0 0 11 0 0 0 1 3 0 0 1 5 0 2 0 1 0 0 0 0 0 2 0 0 31
%(Total at site) 34 0 0 3 0 0 0 12 0 0 0 1 3 0 0 1 5 0 2 0 1 0 0 0 0 0 2 0 0 34%(Known) 52 0 0 5 0 0 0 18 0 0 0 2 5 0 0 2 8 0 3 0 2 0 0 0 0 0 3 0 0 n/a
Sediment 158 22 0 0 2 0 0 0 8 2 0 0 6 3 0 0 0 13 0 3 9 0 1 0 0 1 0 0 0 3 85%(Total at site) 14 0 0 1 0 0 0 5 1 0 0 4 2 0 0 0 8 0 2 6 0 1 0 0 1 0 0 0 2 54
%(Known) 30 0 0 3 0 0 0 11 3 0 0 8 4 0 0 0 18 0 4 12 0 1 0 0 1 0 0 0 4 n/a3rd St. Dock Seep 76 20 0 0 1 0 0 0 0 0 0 0 3 3 0 3 0 14 0 0 0 0 0 0 0 0 0 0 0 2 30
%(Total at site) 27 0 0 1 0 0 0 0 0 0 0 4 4 0 4 0 19 0 0 0 0 0 0 0 0 0 0 0 3 39%(Known) 43 0 0 2 0 0 0 0 0 0 0 7 7 0 7 0 30 0 0 0 0 0 0 0 0 0 0 0 4 n/a
Pismo Seep 95 13 0 0 1 0 0 0 0 0 0 0 1 6 0 1 6 46 0 0 0 0 0 0 0 0 2 0 0 4 15%(Total at site) 14 0 0 1 0 0 0 0 0 0 0 1 6 0 1 6 48 0 0 0 0 0 0 0 0 2 0 0 4 16
%(Known) 16 0 0 1 0 0 0 0 0 0 0 1 8 0 1 8 58 0 0 0 0 0 0 0 0 3 0 0 5 n/aALL SITES 1659 279 3 4 58 3 2 14 231 35 2 1 36 116 5 10 26 282 2 12 18 8 23 3 1 7 10 10 3 31 424
%(Total) 17 <1 <1 3 <1 <1 1 14 2 <1 <1 2 7 <1 1 2 17 <1 1 1 <1 1 <1 <1 <1 1 1 <1 2 26%(Known) 23 <1 <1 5 <1 <1 1 19 3 <1 <1 3 9 <1 1 2 23 <1 1 1 1 2 <1 <1 1 1 1 <1 3 n/a

Identifying the Sources of Escherichia coli Contamination to the Shellfish Growing Areas of the Morro Bay Estuary Final Report 3/29/2002
Strains from unknown sources When conducting a source tracking study there will always be some environmental strains that do not match library strains and so no animal source can be identified for them. If these unknown origin strains are from preferentially one type of source then estimates of source contribution could be severely underestimated. An analysis of the frequency of occurrence for the E. coli ribotypes found in this study was conducted to address this question. To facilitate source characterization, ribotype sources were placed into six groups that each described a general category (Table 9). Domestic, agricultural and wild animal sources, as well as human sources, all gave approximately the same distribution of observed frequency with about 30 to 40 “uniques”; that is, ribotypes that were observed only once in the study (Figure 10). Nearly 70 unique ribotypes were in the bird category; double what was seen for the other categories. This implies that there are more rare ribotypes in the bird category than in the other categories. This is not surprising since there are many species of birds that move through the Morro Bay watershed during the course of a year. Moreover, 187 unique ribotypes were in the unknown category. This implies that the unknown category covers a very broad range of host species and is not likely to skew the results of this study.
0
20
40
60
80
100
120
140
160
180
200
Uniques Doubles Triples Quadruples Quintuples MoreObservations per Ribotype
Rib
otyp
e C
ount
BirdsLivestockDomesticHumanWildUnknown
Figure 10. Line graph of the frequency of observation for ribotypes seen in the study. Ribotypes that were observed more than five times (sextuples or higher) were lumped into the “More” category. The most common ribotype was observed 33 separate times.
27

Identifying the Sources of Escherichia coli Contamination to the Shellfish Growing Areas of the Morro Bay Estuary Final Report 3/29/2002
Tracking the distribution of specific ribotypes Another way to look at the results of strain fingerprinting is to follow common environmental strains, as indicated by E. coli with the same ribotype but isolated from different sites. This type of analysis may provide insight into the pathway by which fecal contamination gets into the bay. First we analyzed the ribotypes of strains isolated from oysters (Figure 11). Any of the other sites could have been a place where E. coli could come from before entering the oysters so all the other sites were included in the analysis. At one extreme, ribotypes from unknown sources were 90% unique to the oysters. However, this is not surprising since Figure 11 showed that most unknown ribotypes were seen only once anyway. In addition, over 70% of the ribotypes attributed to bird sources were unique to the oysters, only five ribotypes were seen at other sites and four out of these five were seen in the bay. By contrast, all of the ribotypes from livestock sources were seen elsewhere in the study, most notably the creeks and the bay. This data is consistent with a model where birds were provided a direct pathway to oysters while livestock sources were provided a less direct route through other collection sites. A portion of the data is somewhat misleading in that no ribotypes from the seeps were found in the oysters. This does not indicate that oysters didn’t pick up bacteria from the seeps. First, there was a three-month gap from the last time oysters were sampled to the first time seeps were sampled for ribotyping. In addition, the small number of E. coli isolated from oysters may give a false impression since ribotypes from the seeps were seen at other sites.
18
4 4 4
24
4
0
5
10
15
20
25
Bird Domestic Livestock Human Unknown Wild
E. coli Source
E. c
oli t
ypes
from
Oys
ters
als
o fo
und
at e
ach
Site
Sediment Seeps Oysters
13 unique 2 unique 0 unique 2 unique 22 unique 2 unique
Bay LosOsosCreek ChorroCreek
Figure 11. Tracking of ribotypes found in oysters as separated by source group. The
number of ribotypes unique to oysters is listed under each source grouping.
28

Identifying the Sources of Escherichia coli Contamination to the Shellfish Growing Areas of the Morro Bay Estuary Final Report 3/29/2002
The sediment was then analyzed in the same fashion. Since oysters cannot contribute E. coli ribotypes to the sediment, oysters were not included in the analysis. Unusual amounts of ribotypes from unknown sources were seen in the sediment, perhaps because of the proximity of birds and marine animals whose feces were not sampled for inclusion into the library. All but one of the ribotypes of unknown source were unique to the sediment. Six of the nine human ribotypes in the sediment were seen at other sites, including the seeps (Figure 12). Similarly, four of eight ribotypes from livestock and two of three ribotypes from domestic animals (67%) were seen in the bay and creeks. In contrast, ribotypes attributed to wild animal sources were 70% unique to the sediment; this may be due to the fact that the sediment had a high proportion of E. coli from marine mammal sources (Table 10). Over 60% of the ribotypes from bird sources were unique to the sediment. These data are consistent with a model where both birds and wild animals were provided with a more direct pathway for input of E. coli to the sediment while other sources, those with fewer ribotypes unique to the sediment, had less direct access to the sediment.
14
3
89
10
69
0
2
4
6
8
10
12
14
16
18
20
Bird Domestic Livestock Human Unknown Wild
E. coli Source
E. c
oli t
ypes
from
Sed
imen
t als
o fo
und
at e
ach
Site
Sediment
9 unique 1 unique 4 unique 3 unique 68 unique 7 unique
Bay LosOsosCreek ChorroCreek Seeps
Figure 12. Tracking of ribotypes found in sediment as separated by source group. The
number of ribotypes unique to sediment is listed under each source grouping.
29

Identifying the Sources of Escherichia coli Contamination to the Shellfish Growing Areas of the Morro Bay Estuary Final Report 3/29/2002
Lastly, the bay waters were treated as a single site and ribotypes from the bay were tracked. Once again, oysters were removed from the analysis. Every site shared some ribotypes from each source of E. coli with the waters of the bay (Figure 13). The only exception was a lack of E. coli from livestock out of the seeps. This was expected because no E. coli from livestock were isolated at the seeps (Table 10). As with the sediment analysis, ribotypes from birds (60%) and wild animals (65%) were most often unique to the bay. Half of the ribotypes from domestic animals and more than half of the human ribotypes in the bay were not found elsewhere. In contrast, only 40% of the ribotypes from livestock sources were unique to the bay. In fact, over half of the ribotypes from livestock sources were also seen in Chorro Creek. These data are consistent with a model similar to the one described for sediment and oysters where birds and wild animals have direct access to the bay while livestock have pathways that include other sites. Human and domestic animal sources appear to have a mixture of direct and indirect pathways into the bay.
34
45 46
31
7871
0
5
10
15
20
25
30
35
40
45
50
Bird Domestic Livestock Human Unknown Wild
E. coli Source
E. c
oli t
ypes
from
Bay
Wat
er a
lso
foun
d at
eac
h Si
te
Bay
42 unique 17 unique 18 unique 26 unique 70 unique 20 unique
Sediment LosOsosCreek ChorroCreek Seeps
Figure 13. Tracking of ribotypes found in the Bay as separated by source group. The
number of ribotypes unique to the Bay is listed under each source grouping. It would be interesting to investigate this model by using the yearly fecal coliform loading values calculated for the creeks in the previous section of this report. Multiplying the percent source contribution from each creek by the loading of fecal coliforms would provide a model of the bay if the creeks were the only input of E. coli. However, the flow estimates for the creeks were not accurate enough to make such an analysis meaningful.
30
Identifying the Sources of Escherichia coli Contamination to the Shellfish Growing Areas of the Morro Bay Estuary Final Report 3/29/2002
Statistical analysis of the distribution of E. coli sources in the Morro Bay watershed The statistical analysis was designed to highlight which sources of E. coli were truly contributing to a different extent when comparing results from site to site. Sources were grouped according to the categories listed in Table 9. Because the QA/QC analysis showed that taking multiple strains from a single sample was biasing results (see above), these analyses were performed on the single sample data set. No significant differences were found between the wet and dry season for any site (p > 0.21). There was also no significant difference between the first wet sampling day when compared to the remaining wet sampling days (p > 0.056). In addition, the three bay sites were not significantly different. Thus the water sample data for the two seasons were grouped together and all three bay sites were grouped together. Sediment and oyster data were grouped in the same way. Lastly, data from Pismo and 3rd. St. Dock seeps were grouped since they lacked significant differences. Thus the final statistical analysis was performed on a data set containing six source categories and six site categories (Table 11). Table 11. Sources of E. coli in the single strain data set tabulated by site and source. Numbers in
parentheses are percentages of total strains from each site.
Sites Sources Bird Domestic Livestock Human Wild Unknown Total
Oysters 11 (30%) 5 (13%) 4 (11%) 4 (11%) 1 (3%) 12 (32%) 37 Sediment 5 (13%) 2 (5%) 2 (5%) 4 (10%) 7 (17%) 20 (50%) 40 The Bay 52 (21%) 21 (9%) 50 (21%) 37 (15%) 22 (9%) 59 (25%) 241
Los Osos Creek 26 (22%) 20 (17%) 11 (9%) 20 (17%) 14 (12%) 26 (22%) 117 Chorro Creek 17 (16%) 18 (17%) 30 (28%) 14 (13%) 6 (6%) 21 (20%) 106
Seep 5 (13%) 3 (8%) 0 15 (40%) 1 (3%) 14 (37%) 38 Total 116 119 97 94 51 152 579
31
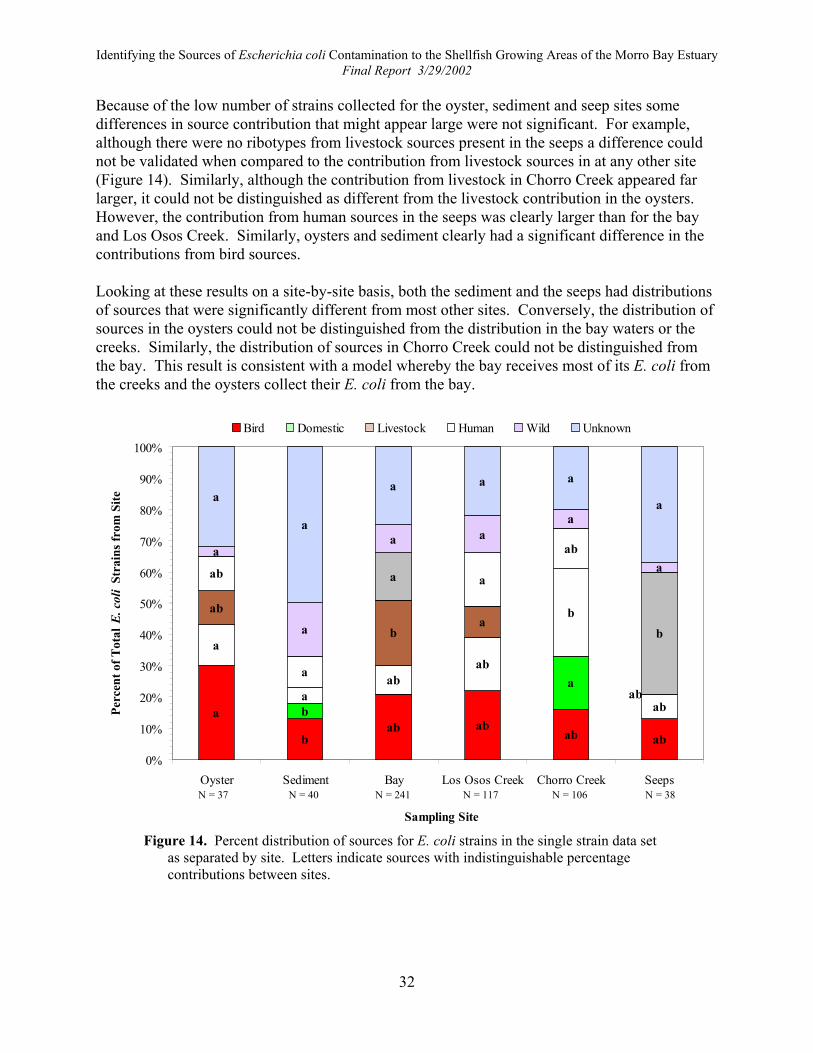
Identifying the Sources of Escherichia coli Contamination to the Shellfish Growing Areas of the Morro Bay Estuary Final Report 3/29/2002
Because of the low number of strains collected for the oyster, sediment and seep sites some differences in source contribution that might appear large were not significant. For example, although there were no ribotypes from livestock sources present in the seeps a difference could not be validated when compared to the contribution from livestock sources in at any other site (Figure 14). Similarly, although the contribution from livestock in Chorro Creek appeared far larger, it could not be distinguished as different from the livestock contribution in the oysters. However, the contribution from human sources in the seeps was clearly larger than for the bay and Los Osos Creek. Similarly, oysters and sediment clearly had a significant difference in the contributions from bird sources. Looking at these results on a site-by-site basis, both the sediment and the seeps had distributions of sources that were significantly different from most other sites. Conversely, the distribution of sources in the oysters could not be distinguished from the distribution in the bay waters or the creeks. Similarly, the distribution of sources in Chorro Creek could not be distinguished from the bay. This result is consistent with a model whereby the bay receives most of its E. coli from the creeks and the oysters collect their E. coli from the bay.
abababab
b
a ab
aab
ab
b
a
ab
ba
b
a
ab
ab
aa
a
ab
b
a
aaa
a
a
a
aaa
a
a
0%
10%
20%
30%
40%
50%
60%
70%
80%
90%
100%
Oyster Sediment Bay Los Osos Creek Chorro Creek Seeps
Sampling Site
Perc
ent o
f Tot
al E
. col
i St
rain
s fro
m S
ite
Bird
N = 37 N = 40 N = 241 N = 117 N = 106 N = 38
Domestic Livestock Human Wild Unknown
Figure 14. Percent distribution of sources for E. coli strains in the single strain data set as separated by site. Letters indicate sources with indistinguishable percentage contributions between sites.
32

Identifying the Sources of Escherichia coli Contamination to the Shellfish Growing Areas of the Morro Bay Estuary Final Report 3/29/2002
Grid at 13 Sampling The “grid at 13” sampling conducted for 25 days from June 1 through October 15, 2001 illustrated the phenomena of high counts that initiated this part of the study. When the individual stations are averaged over the sampling period, two locations of high fecal coliform are evident; one to the north of the grid and another to the south (Figure 15). Although these areas were not unique with regards to bottom type/depth, there were large clusters of floats nearby and these high counts might result from the birds roosting on these float clusters. Fecal coliform counts greater than the NSSP maximum of 43 MPN/100 mL were also observed at sites 13A, 56, 57 and 60. In particular, fecal coliform counts at site 57 exceeded regulatory levels twice (the same at site 51) although the counts were lower. When the 15 “grid” stations were averaged over each sampling day and examined as a function of time, high fecal coliform counts are centered on the month of July (Figure 16). What caused this sustained increase during this time is not known. The complete fecal coliform MPN dataset for the “grid” sampling is given the Appendix F.
Figure 15. Contours of the average fecal coliform counts (MPN/100mL) at Lease Site
13 over the duration of the grid study.
33

Identifying the Sources of Escherichia coli Contamination to the Shellfish Growing Areas of the Morro Bay Estuary Final Report 3/29/2002
0
50
100
150
200
250
May-01 Jun-01 Jul-01 Aug-01 Sep-01 Oct-01 Nov-01
Date
Ave
rage
MPN
(100
ml)
Figure 16. Average fecal coliform counts (MPN/100mL) over the entire Lease Site 13
graphed over the time of the grid study. Error bars show standard deviations.
34

Identifying the Sources of Escherichia coli Contamination to the Shellfish Growing Areas of the Morro Bay Estuary Final Report 3/29/2002
CONCLUSIONS
Primary Objectives: • To identify the sources of bacterial contamination which threaten the shellfish harvesting
waters of the Morro Bay estuary. o See Table 10 and Appendices D and E.
• To ascertain differences in these contributions for individual sites around the bay. o See Table 10 and Appendices D and E.
• To ascertain these source contributions separately for both wet and dry seasons. o No significant differences were found.
Secondary Objectives: • To identify the sources of bacterial contamination which threaten water-contact
recreation in the Morro Bay estuary. o See Table 10 and Appendices D and E.
• To expand the database of fecal coliform strains and their fingerprints that can be used in this and later studies to identify the sources (i.e. human, cow, bird) of bacterial contamination in other regions.
o See Table 8.
Overall Conclusion: When results were summed over the entire study the largest fractions of E. coli came from four sources: bird (22%), human (17%), bovine (14%) or dog (9%). The four most important sources of E. coli in waters of Morro Bay were, bird (24%), human (17%), bovine (15%) and dog (9%). In addition, analyses presented in Figures 10 through 13 and Tables 10 and 11 provide a useful model for the flow of contaminants into the bay. Pathways for E. coli entering the bay are through the creeks and seeps or by more direct means, rain water run-off or direct entry for example. The model separates input into the bay by sources. A large fraction of E. coli from birds enters the bay through direct pathways. Conversely, most E. coli from livestock enters the bay through the creeks. E. coli from the other sources, human, and wild and domestic animals, enters the bay through all pathways somewhat equally.
35
Identifying the Sources of Escherichia coli Contamination to the Shellfish Growing Areas of the Morro Bay Estuary Final Report 3/29/2002
36
LIST OF APPENDICES Appendix A The MF counts from samples taken for E. coli source tracking analysis Appendix B The MPN counts of fecal and total coliforms from Morro Bay sampling sites. Appendix C The MPN counts of fecal and total coliforms from Morro Bay watershed sampling sites. Appendix D The full source-matching data set of E. coli strains isolated from the Morro Bay samples. Appendix E A statistical analysis of the full source-matching data set. Appendix F The MPN counts of fecal and total coliforms for the “Grid at 13”.