identifying success factors for developing web applications
TRANSCRIPT

Identifying Success Factors for Developing Web Applications
~~ A Survey Report ~~
Monica Lam
Management Information System Professor College of Business Administration
California State University, Sacramento 6000 J Street, Sacramento, CA 95819-6088, USA
Voice: 916-278-7038, FAX: 916-278-6489 [email protected]
August, 2008

A Survey Report for Web Application Success Factors 2
Table of Contents Abstract 1. Introduction: Research Questions and Significance 2. Research Methodology 3. Descriptive Statistics of Variables 4. Factor Analysis 5. Interpretation of Research Results 6. Conclusion References

A Survey Report for Web Application Success Factors 3
Abstract
A survey for success factors of Web application development reveals that development
methodologies, tools, and techniques are not considered as important by developers for the
success of Web application development. Rapid application prototyping, ERD (entity
relationship diagram), program flowchart, and application framework are more highly regarded
than the object-oriented tools such as use case diagram, class diagram, object diagram, and
sequence diagram. Developers focus more on maintainability and scalability than end users and
management for evaluating the success of Web application development. Ambiguous user
requirements, scope creeping, and lack of success metrics are evaluated as the most important
issues for the failure of Web application development. Research results also indicate that
developers need more help in communication, management, and control than the technology
aspects of the development process. The overall findings point to flexible, simple, proven,
participative, and management-oriented methodologies, tools, and techniques to address
ambiguous and changing user requirements in the next generation development approaches for
Web applications.

A Survey Report for Web Application Success Factors 4
1. INTRODUCTION: RESEARCH QUESTIONS AND SIGNIFICANCE
This research project defines a Web application as a software system that relies on the Web
as its interaction medium with the end users to create, exchange, and modify data for transaction
requirements. The survey was designed to identify the methodologies, techniques, and tools
which are frequently used by practitioners to develop Web applications. The goal is to
determine whether methodologies, techniques, and tools affect the success of Web application
development. Given practitioners’ feedback and comments, the investigator will attempt to
modify existing methodologies, techniques, and tools or develop new ones that can overcome
existing development problems, in order to facilitate Web application success.
Methodologies for application development are defined as the step-by-step procedures to
carry out development activities consisting of different phases in a system development life cycle.
A methodology has its own assumptions about the reality that affect how it divides a
development cycle into different tasks, has its own techniques to support working principles and
enforce discipline, and has its own tools to generate the deliverables for activities. In other
words, there are a collection of corresponding techniques and tools for a certain development
methodology.
As Web application development is different from traditional information system
development in terms of user participation, user environment, communication control, testing
requirements, and functionality design, existing methodologies for information system
development may not well suit Web applications. Web application development has well
passed its introduction phase in a technology adoption life cycle. A survey of the literature
reveals that many methodologies for Web application development have been suggested.
However, most of them are still unproven and only a few are known to practitioners. Web

A Survey Report for Web Application Success Factors 5
developers still more or less rely on their own experience and preferences to select the methods
and tools to accomplish their missions. It is in this proliferation phase of the Web technology
adoption cycle that we need to determine what works, what does not, and why.
2. RESEARCH METHODOLOGY
The preliminary questionnaire was submitted to ten Web developers for pretest. Feedback
from pretest was used to revise the questionnaire in terms of meaning clarification, format,
ordering of questions, and addition of questions. The questionnaire was administered by an
Internet survey company in a period of 4 weeks. There were one initial invitation email and
one follow-up reminder email to potential participants. The survey sample of potential
participants include Chief Computing Architect, CIO, VP for eBiz/Internet, VP for IT, VP for
Network, VP for Quality Assurance, VP for Software Development, Director for eBiz/Internet,
Director for IT, Director for Network, Director for Software Development, Manager for Quality
Assurance, and Chief Technology Officer. The initial collection of responses was filtered using
a reliability test based on multiple pairs of variables in the survey. The reliability test generated
a total of 254 valid responses for the analysis phase. The remaining of this research report
consists of descriptive statistics of variables, factor analysis results, interpretation of research
results, and conclusion.

A Survey Report for Web Application Success Factors 6
3. DESCRIPTIVE STATISTICS OF VARIABLES
This section reports the descriptive statistics of some significant variables in the survey.
Table 1. What is your company type? Company Type % Multi-national company 25 Public limited company 7 Small/medium enterprise 53 Federal or state government type 3 Others 12 Table 2. How important are the following end users’ feedback for evaluating the success of Web application development in your organization? Code Evaluation Factor Very
Important % EU1 End users’ feedback about functionality 64.9 EU2 End users’ feedback about navigation 44.9 EU3 End users’ feedback about usability/user friendliness 57.1 EU4 End users’ feedback about security 24.9 EU5 End users’ feedback about visual/audio/aesthetic characteristics 26.1 Table 3. How important are the following development team members' feedback for evaluating the success of Web application development in your organization? Code Evaluation Factor Very
Important % TM1 development team members' feedback about functionality 26.9 TM2 development team members' feedback about navigation 17.1 TM3 development team members' feedback about easiness to interact with 16.7 TM4 development team members' feedback about security features 55.1 TM5 development team members' feedback about visual/audio/aesthetic
characteristics 12.2
TM6 development team members' feedback about suitability of development methodology
31.8
TM7 development team members' feedback about suitability of development tools and techniques
37.6
TM8 development team members' feedback about how well the system performs required tasks
35.9
TM9 development team members' feedback about system maintainability 44.1 TM10 development team members' feedback about system scalability 41.2

A Survey Report for Web Application Success Factors 7
Table 4. How important are the following overall criteria for evaluating the success of Web application development in your organization? Code Evaluation Factor Very
Important %CC1 Whether the application passes the cost/benefit threshold? 28.6 CC2 Whether the application is within the approved budget? 21.6 CC3 Whether the application can be delivered within the approved timeline? 26.1 CC4 Whether the application satisfies the business needs as expected? 66.9 CC5 Whether the application delivers the overall quality as expected? 41.2 CC6 Whether the application is maintainable? 28.6 CC7 Whether the application is scalable? 28.2 CC8 Whether different deliverables are on time? 17.1
Table 5. How do you attribute the following methodologies to the success of Web application development if they are used in your organization? Code Methodology Very Important %SM1 Rational Unified Process 3 SM2 Extreme Programming 7 SM3 Rapid Application Prototyping 14 SM4 WebML (Web Modeling Language) 2 SM5 Waterfall System Development Life Cycle 4 SM6 Compuware's UNIFACE 0
Table 6. How do you attribute the following development phases to the success of Web application development if they are used in your organization? Code Development Phase Very Important % SP1 Creative Brief/Concept Creation 27.3 SP2 Functional/Technical/Operational Feasibility Studies 15.5 SP3 Cost/Benefit Analysis 9.4 SP4 Generation of Project Plan: Mission, Objectives, Targeted Users,
Scope, Budget, Web Teams 24.9
SP5 Functionality Requirements 40 SP6 Data Storage and Access Design 17.1 SP7 Operations and Business Process Design 26.1 SP8 Navigation Design 18 SP9 Presentation/Page Layout Design 19.2 SP10 Page communication/relationship 11.4 SP11 Web service design 14.3 SP12 Component design 13.9 SP13 Infrastructure configuration 16.3 SP14 Technical specifications 29 SP15 Kickoff meeting to review functional and technical specifications 27.8 SP16 Application coding 29.4 SP17 Code review 18.4 SP18 Testing 47.3 SP19 Launch 31

A Survey Report for Web Application Success Factors 8
Table 7. How do you attribute the following tools/techniques to the success of Web application development if they are used in your organization? Code Development Tools/Techniques Very Important % ST1 Entity Relationship Diagrams (ERD) 13.5 ST2 Story Boarding 13.1 ST3 Use Case Diagrams 9.4 ST4 Class Diagrams 6.1 ST5 Object Diagrams 5.7 ST6 Sequence Diagrams 4.9 ST7 Collaboration Diagrams 2.9 ST8 Statechart Diagrams 2.4 ST9 Activity Diagrams 5.3 ST10 Component Diagrams 5.3 ST11 Deployment Diagrams 5.3 ST12 Web Application Extension to Unified Modeling Language 3.7 ST13 Program Flowcharts 9.8 ST14 Decision Tables 5.3 ST15 Hierarchy-Input-Process-Output Charts (HIPO) 4.1 ST16 Pseudocode 5.3 ST17 Workflow Analysis 17.6 ST18 Review/Staging Web Site for Communication Purposes 20 ST19 Periodic and standardized Progress Reports 12.7 ST20 Project Management Software 12.2 ST21 Diagram Generation Software 5.3 ST22 Code Generation/Review/Testing Software 12.2 ST23 Application Framework 22.4
Table 8. How do you rate the importance of the following factors that drive the choices of methodologies, tools, and techniques for Web application development in your organization? Code Adoption Factor Very Important % AF1 Improve overall quality of applications 37.1 AF2 Improve maintenance 29.4 AF3 Improve management of development process 17.1 AF4 Improve team member communication 20.8 AF5 Improve communication with end users 23.7 AF6 Reduce cost 22 AF7 Reduce development time 32.2

A Survey Report for Web Application Success Factors 9
Table 9. How do you rate the importance of the following reasons for failure of Web application development in your organization? Code Failure Factor Very Important % FF1 Ambiguous user requirements from beginning 58 FF2 Ambiguous or lack of metrics for success 21.2 FF3 Scope creeping 42 FF4 Unacceptable/unsatisfactory quality 17.6 FF5 Lack of clear communication among team members 20.4 FF6 Lack of clear communication with end users 32.2 FF7 Lack of proper management control 22.4 FF8 Lack of clear roles and responsibilities 17.6 FF9 Lack of top management support 21.2 FF10 Inappropriate/incorrect methodologies 8.6 FF11 Inappropriate/incorrect tools/techniques 9.4 FF12 Political reasons 14.7 FF13 Insufficient manpower 27.8 FF14 Insufficient expertise 22.4 FF15 Insufficient time 30.2 FF16 Poor planning 21.6 FF17 Unresolved conflicts among team members 4.9 FF18 Unresolved conflicts with end users 8.2

A Survey Report for Web Application Success Factors 10
4. FACTOR ANALYSIS
Factor analysis is a statistics technique to reduce the number of variables for a concept by
grouping them into different factors based on their distribution, variance, and contribution to the
concept. This section shows explained variance for factors, factor matrix, and factor description from
factor analysis for selected variables in the study. We adopted the factor analysis results from the
extraction method of Maximum Likelihood and the factor rotation method of Varimax with Kaiser
Normalization in SPSS. The rotation factor loadings generated more descriptive factors than the
pre-rotation solutions. The cutoff threshold for selecting variables into a factor is a loading of not less
than 0.5 in this study.
4.1 End Users' Feedback for Success Evaluation (EU1-EU5) Table 10.1 Explained Variance for End Users' Feedback
Factor Initial Eigenvalues Rotation Sums of Squared Loadings
Total % of
Variance Cumulative % Total % of
Variance Cumulative % 1 3.034 60.687 60.687 1.976 39.511 39.511 2 .800 16.004 76.691 1.266 25.322 64.833
Table 10.2 Factor Matrix for End Users' Feedback
Factor 1 2 EU3 .860 .248 EU2 .781 .345 EU1 .653 .313 EU4 .319 .294 EU5 .314 .949
Table 10.3 Factor Descriptions for End Users' Feedback Factor Variables Description euF1 EU1, EU2, EU3 The what and how of Web applications as evaluated by end users

A Survey Report for Web Application Success Factors 11
4.2 Development Team Members' Feedback for Success Evaluation (TM1-TM10) Table 11.1 Explained Variance for Team Members' Feedback
Factor Initial Eigenvalues Rotation Sums of Squared Loadings
Total % of
Variance Cumulative % Total % of
Variance Cumulative % 1 4.522 45.224 45.224 2.655 26.555 26.555 2 1.881 18.807 64.031 2.032 20.317 46.872 3 .896 8.961 72.992 1.643 16.429 63.301 4 .687 6.870 79.861 .395 3.945 67.246 5 .608 6.079 85.940 .278 2.781 70.026
Table 11.2 Factor Matrix for Team Members' Feedback
Factor 1 2 3 4 5 TM3 .917 .176 .078 .065 -.035TM2 .849 .154 .099 .055 .156TM5 .714 .118 .137 .174 -.091TM1 .620 .069 .157 .098 .405TM9 .138 .873 .189 .070 .063TM10 .075 .733 .260 .251 -.172TM8 .247 .575 .274 .079 .180TM6 .157 .250 .954 .042 -.015TM7 .145 .381 .688 .169 .109TM4 .260 .346 .149 .493 .045
Table 11.3 Factor Descriptions for Team Members' Feedback Factor Variables Description tmF1 TM1, TM2, TM3,
TM5 The what and how of Web applications as evaluated by team members
tmF2 TM8, TM9, TM10 The future of Web applications as evaluated by team members tmF3 TM6, TM7 The development methodology, tools, and techniques as evaluated by
team members

A Survey Report for Web Application Success Factors 12
4.3 Organization's Overall Criteria for Success Evaluation (CC1-CC8) Table 12.1 Explained Variance for Overall Criteria
Factor Initial Eigenvalues Rotation Sums of Squared Loadings
Total % of
Variance Cumulative % Total % of
Variance Cumulative % 1 3.684 46.044 46.044 1.732 21.652 21.652 2 1.488 18.596 64.641 1.341 16.766 38.419 3 .902 11.273 75.913 1.335 16.690 55.109 4 .640 8.006 83.920 1.126 14.072 69.181
Table 12.2 Factor Matrix for Overall Criteria
Factor 1 2 3 4 CC6 .943 .060 .189 .246CC7 .676 .127 .100 .303CC8 .168 .856 .166 .057CC3 .008 .652 .265 .190CC2 .150 .303 .838 .075CC1 .127 .150 .637 .228CC5 .467 .110 .145 .683CC4 .317 .193 .251 .640
Table 12.3 Factor Descriptions for Overall Criteria Factor Variables Description ccF1 CC6, CC7 The future of Web applications ccF2 CC3, CC8 Development time of Web applications ccF3 CC1, CC2 Cost/benefit analysis of web applications ccF4 CC4, CC5 The what and how of Web applications
A Survey Report for Web Application Success Factors 13
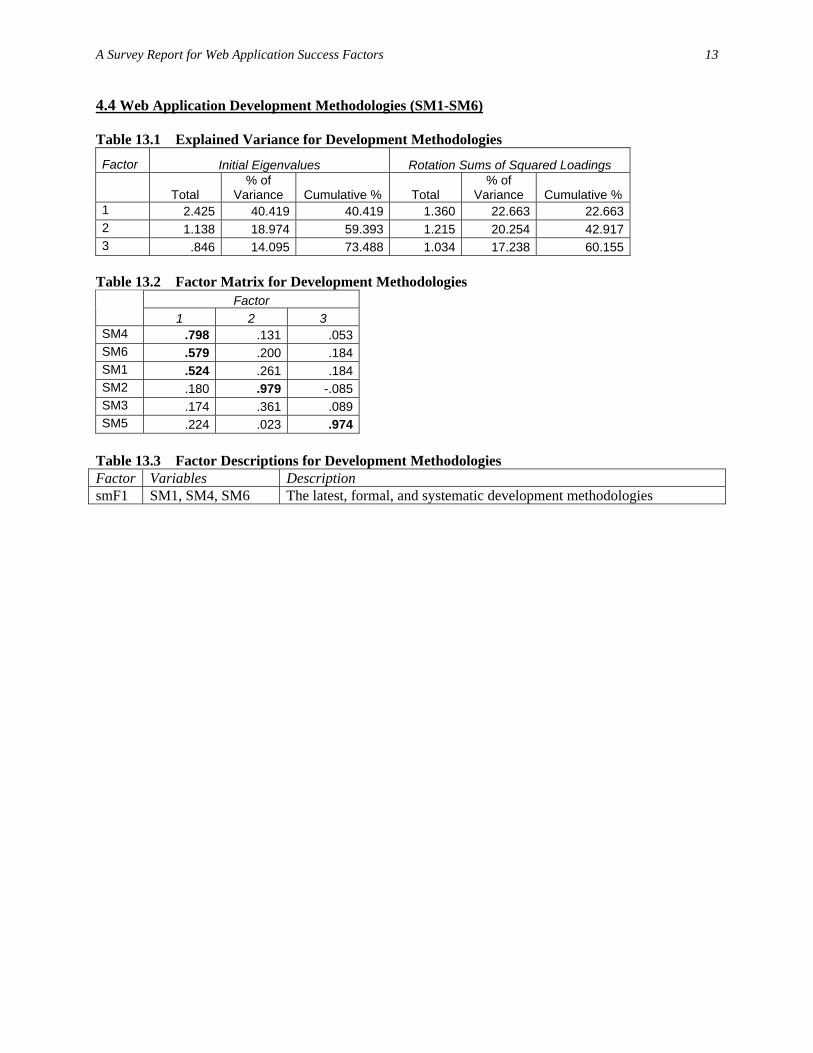
4.4 Web Application Development Methodologies (SM1-SM6) Table 13.1 Explained Variance for Development Methodologies
Factor Initial Eigenvalues Rotation Sums of Squared Loadings
Total % of
Variance Cumulative % Total % of
Variance Cumulative % 1 2.425 40.419 40.419 1.360 22.663 22.663 2 1.138 18.974 59.393 1.215 20.254 42.917 3 .846 14.095 73.488 1.034 17.238 60.155
Table 13.2 Factor Matrix for Development Methodologies
Factor 1 2 3 SM4 .798 .131 .053SM6 .579 .200 .184SM1 .524 .261 .184SM2 .180 .979 -.085SM3 .174 .361 .089SM5 .224 .023 .974
Table 13.3 Factor Descriptions for Development Methodologies Factor Variables Description smF1 SM1, SM4, SM6 The latest, formal, and systematic development methodologies

A Survey Report for Web Application Success Factors 14
4.5 Web Application Development Process (SP1-SP19) Table 14.1 Explained Variance for Development Process
Factor Initial Eigenvalues Rotation Sums of Squared Loadings
Total % of
Variance Cumulative % Total % of
Variance Cumulative % 1 6.232 32.802 32.802 2.088 10.988 10.988 2 1.621 8.531 41.333 1.954 10.283 21.272 3 1.527 8.036 49.370 1.600 8.419 29.691 4 1.197 6.300 55.670 1.340 7.052 36.742 5 1.118 5.885 61.555 1.295 6.817 43.560 6 .910 4.789 66.343 1.098 5.780 49.340 7 .771 4.058 70.401 1.082 5.694 55.034 8 .749 3.944 74.345 1.034 5.441 60.475
Table 14.2 Factor Matrix for Development Process
Factor 1 2 3 4 5 6 7 8 SP9 .836 .207 .015 .172 .057 .128 .054 -.005SP8 .726 .168 .134 .050 .093 .069 .059 .191SP10 .689 .087 .147 .079 .442 .026 .017 .065SP18 .143 .632 .137 .129 .058 .099 .033 .058SP16 .058 .600 -.134 .179 .135 .062 .110 -.003SP17 .111 .471 .104 .246 .313 .089 .223 .126SP19 .140 .438 .384 -.067 .090 .091 .196 .088SP1 .193 .415 .381 .038 -.053 -.041 .143 .089SP6 .164 .397 .144 .236 .028 .242 -.001 .066SP2 .016 .057 .712 .268 .088 .059 .049 .054SP3 .075 .054 .567 .025 .189 .056 -.005 .119SP4 .174 .043 .364 .348 .015 .097 .248 .063SP14 .041 .207 .143 .726 .184 .082 .081 .074SP5 .233 .330 .125 .537 .013 .079 .140 .075SP11 .283 .158 .202 .127 .712 .221 .104 .064SP12 .176 .189 .288 .145 .500 .331 .052 .265SP13 .155 .235 .102 .147 .295 .886 .081 .095SP15 .066 .279 .122 .210 .114 .061 .915 .065SP7 .186 .138 .232 .138 .148 .103 .076 .913
Table 14.3 Factor Descriptions for Development Process Factor Variables Description spF1 SP8, SP9,
SP10 Navigation design, presentation and page layout design, page communication/relationship
spF2 SP16, SP18 Application coding and testing spF3 SP2, SP3 All sorts of feasibility analyses spF4 SP5, SP14 Functionality requirements and technical specifications spF5 SP11, SP12 Web service design and component design

A Survey Report for Web Application Success Factors 15
4.6 Web Application Development Tools and Techniques (ST1-ST23) Table 15.1 Explained Variance for Development Tools and Techniques
Factor Initial Eigenvalues Rotation Sums of Squared Loadings
Total % of
Variance Cumulative % Total % of
Variance Cumulative % 1 9.867 42.900 42.900 3.709 16.126 16.126 2 1.725 7.498 50.399 2.953 12.839 28.965 3 1.422 6.182 56.581 2.818 12.252 41.218 4 .944 4.106 60.687 1.536 6.677 47.894 5 .903 3.928 64.615 1.300 5.652 53.546 6 .819 3.559 68.174 1.252 5.444 58.991
Table 15.2 Factor Matrix for Development Tools and Techniques
Factor 1 2 3 4 5 6 ST4 .845 .212 .131 .126 .100 .124ST5 .716 .214 .253 .252 .112 .150ST6 .611 .201 .185 .167 .394 .150ST3 .543 .189 .294 .098 .126 -.006ST1 .493 .163 .198 .155 .068 .094ST8 .477 .343 .213 .222 .401 .034ST9 .461 .245 .108 .454 .231 .139ST15 .170 .830 .189 .153 .176 .137ST12 .247 .671 .145 .142 .182 .089ST14 .252 .588 .195 .193 .143 .323ST16 .242 .476 .217 .140 .006 .084ST19 .083 .165 .726 .111 .060 .033ST18 .106 -.026 .645 .033 .011 .043ST21 .380 .309 .529 .132 .141 .139ST17 .207 .237 .492 .108 .111 .270ST23 .344 .112 .489 .066 .109 -.024ST20 .108 .260 .478 .088 .189 .106ST22 .299 .303 .429 .069 .087 .075ST2 .296 .210 .301 .079 .026 .158ST10 .363 .312 .206 .841 .121 .077ST11 .325 .434 .184 .461 .208 .212ST7 .367 .320 .253 .197 .804 .118ST13 .187 .297 .177 .119 .090 .907
Table 15.3 Factor Descriptions for Development Tools and Techniques Factor Variables Description stF1 ST3, ST4,
ST5, ST6 Use case diagram, class diagrams, object diagrams, sequence diagrams
stF2 ST12, ST14, ST15
Web application extension to Unified Modeling Language, decision tables, hierarchy-input-process-output charts
stF3 ST18, ST19, ST21
Review/staging Web site, periodic and standardized progress, diagram generation software

A Survey Report for Web Application Success Factors 16
4.7 Adoption Factors for Development Methodologies, Tools, and Techniques (AF1-AF7) Table 16.1 Explained Variance for Adoption Factors
Factor Initial Eigenvalues Rotation Sums of Squared Loadings
Total % of
Variance Cumulative % Total % of
Variance Cumulative % 1 3.245 46.359 46.359 1.703 24.323 24.323 2 1.194 17.062 63.421 1.476 21.087 45.410 3 .906 12.939 76.359 1.392 19.892 65.302
Table 16.2 Factor Matrix for Adoption Factors
Factor 1 2 3 AF4 .969 .223 .098AF3 .533 .349 .184AF5 .506 .204 .192AF2 .266 .888 .154AF1 .297 .634 .121AF6 .231 .005 .972AF7 .102 .270 .573
Table 16.3 Factor Descriptions for Adoption Factors Factor Variables Description afF1 AF3, AF4,
AF5 Communication and management of development process
afF2 AF1, AF2 Quality and maintenance of Web application afF3 AF6, AF7 Cost and development time

A Survey Report for Web Application Success Factors 17
4.8 Failure Factors for Web Application Development (FF1-FF18) Table 17.1 Explained Variance for Failure Factors
Factor Initial Eigenvalues Rotation Sums of Squared Loadings
Total % of
Variance Cumulative % Total % of
Variance Cumulative % 1 7.413 41.182 41.182 2.285 12.696 12.696 2 1.695 9.417 50.598 2.233 12.408 25.103 3 1.407 7.816 58.415 1.888 10.486 35.590 4 1.055 5.859 64.273 1.772 9.842 45.432 5 1.000 5.555 69.828 1.610 8.946 54.378 6 .803 4.461 74.289 1.565 8.694 63.072
Table 17.2 Factor Matrix for Failure Factors
Factor 1 2 3 4 5 6 FF8 .695 .269 .251 .041 .241 .171FF7 .665 .113 .163 .154 .118 .203FF9 .565 .311 .207 .158 .176 .175FF4 .444 .224 .248 .217 .160 .384FF16 .434 .283 .224 .396 .265 .193FF18 .186 .859 .171 .055 .127 .135FF17 .243 .749 .178 .117 .064 .288FF12 .284 .400 .241 .154 .177 .077FF11 .281 .208 .912 .186 .032 .101FF10 .350 .340 .706 .191 .014 .153FF15 .173 .036 .125 .775 .178 .062FF13 .047 .072 .072 .703 .125 .111FF14 .214 .368 .311 .468 .213 .078FF1 .092 .090 .002 .116 .668 .034FF3 .109 .069 -.059 .120 .601 .068FF2 .171 .079 .229 .154 .592 .149FF5 .296 .202 .118 .200 .081 .900FF6 .253 .319 .086 .041 .318 .528
Table 17.3 Factor Descriptions for Failure Factors Factor Variables Description ffF1 FF7, FF8,
FF9 Lack of project management control, lack of role and responsibility, top management support
ffF2 FF17, FF18 Unresolved conflicts with end users and team members ffF3 FF10, FF11 Inappropriate/incorrect methodologies, development tools, and techniques ffF4 FF13, FF15 Not enough time and manpower ffF5 FF1, FF2,
FF3 Ambiguous initial user requirements, ambiguous or lack of metrics for success, scope creeping
ffF6 FF5, FF6 Lack of clear communication with team members and end users

A Survey Report for Web Application Success Factors 18
5. Interpretation of Research Results
5.1 Important Factors for Evaluating Web Applications
The results of the very important variables in Section 3 and the factor analysis in Section 4
show that the factor of “what and how of Web application” is very significant for end users to
evaluate the success of Web applications. The factor of “what and how of Web application” is
mainly represented by the variables of functionality, navigation, and usability/user friendliness.
On the other hand, from the developers’ viewpoint, the most significant factor for success
evaluation includes the maintainability and scalability of Web applications. The importance of
the factor “methodologies/tools/techniques” is considered as secondary by developers. From
the company’s overall perspective, the most important factor is represented by Web applications’
satisfying business needs and their overall quality. The emphasis differences among different
stakeholders are logical and understandable. While end users focus on the functionality and
navigation of Web applications, the management perspective is more on business needs and
application quality. While satisfying current business needs are important, developers know it
better than anyone else that the users will demand upgrades and changes soon enough for them to
focus more on the maintainability and scalability of Web applications. Web applications have
the characteristic of being constantly in their beta mode. How to wisely and effectively capture
the participation and input from users to enhance Web applications will be a great challenge to
developers. Methodologies/tools/techniques have to be modified to address different
stakeholders’ concerns and the changing requirements in the future.

A Survey Report for Web Application Success Factors 19
5.2 The Importance of Development Methodologies
None of the development methodologies receives high marks from survey respondents.
Rapid Application Prototyping is by far the most popular among respondents. Factor analysis
shows that Rational Unified Process, WebML, and Compuware’s UNIFACE are in the same
factor in terms of how important they are for Web application development. The results in
Section 3 indicate that they are not important. It seems that development methodologies which
are too new, too complicated, too formal, or too specific are not considered as important. Many
comments from respondents mention about using hybrid approaches concocting from different
methodologies, tools, and techniques.
5.3 The Importance of Development Phases
The factors of “application coding and testing” and “functionality requirements and
technical specifications” as development phases are considered as very important, followed by
the factors of “operations and business process design” and “kickoff meeting to review
functional and technical specifications”. While the phase of “launch” cannot be grouped into
any factor, about one-third of respondents rank it as very important.
5.4 The Importance of Development Tools and Techniques
For development tools and techniques, the factor of “review/staging Web site, periodic and
standardized progress, and diagram generation software” and the factor of “application
framework” are very important, followed by “program flowchart”, “ERD and story boarding”,
and “work flow analysis”. The use case diagram, class diagram, object diagram, and sequence
diagram in UML are loaded into one factor, which is considered as not important by survey

A Survey Report for Web Application Success Factors 20
respondents. Most respondents favor management tools and well-established modeling tools
over those relatively new diagrammatic tools. Tools that can reduce development time such as
diagram generation software and application frameworks are also ranked as important.
5.5 Important Adoption Factors for Methodologies/Tools/Techniques
The adoption factor of “improving quality and maintenance” is very important, followed by
the factor of “improving communication and management”, and the factor of “reducing cost and
development time”. The important adoption factor of “improving quality and maintenance”
echoes developers’ emphasis on maintainability and scalability as an important evaluation factor
for Web applications, as discussed in Section 6.1.
5.6 Important Failure Factors for Web Application Development
The survey results for failure factors clearly fall into three categories in terms of importance.
The most important failure factor is represented by the variables of ambiguous initial user
requirements, scope creeping, and lack of metrics for success. Factors of secondary importance
include the factor of “lack of role and responsibility, top management support, and lack of
project management control”, the factor of “not enough time and manpower”, and the factor of
“lack of clear communication with end users and team members”. The least important category
has the factor of “unresolved conflicts with end users and team members” and the factor of
“inappropriate/incorrect methodologies/tools/techniques”.

A Survey Report for Web Application Success Factors 21
6. Conclusion
There are several key findings for the research question in this project based on the variable
ranking and factor analysis results from the data set. First, development methodologies, tools,
and techniques are not considered as important for the success of Web application development
by practitioners. Among the methodologies of Rational Unified Process, Extreme
Programming, Rapid Application Prototyping, WebML, Waterfall System Development Life
Cycle, and Compuware’s UNIFACE, Rapid Application Prototyping is considered as the most
important for Web application success. Regarding tools and techniques, the relatively new
diagrammatic tools such as use case diagram, class diagram, object diagram, and sequence
diagram, which are being taught as standard diagrams for object-oriented system development in
classrooms, are not considered as important by practitioners. Instead, well-established and
well-understood tools such as ERD and program flowchart are considered as more important.
The result also suggests that the management, communication, and control aspects of Web
application development need more help than its technology aspects.
Second, end users, developers, and management have different focuses for evaluating Web
application development. The focuses are functionality and navigation, maintainability and
scalability, business needs and application quality respectively for end users, developers, and
management. The different focuses bring our attention to the importance of developing flexible
methodologies, tools, and techniques that can address different stakeholders’ needs and concerns.
Third, for failure factors of Web applications, the most important factor is lack of clear user
requirements, scope creeping, and lack of metrics for success. Feedback and comments show
strong frustration towards ambiguous and constantly changing user requirements. The next
generation of system development aids need to seriously address that issue.

A Survey Report for Web Application Success Factors 22
References
Anderson, D., Howell-Barber, H., Hill, J., Javed, N., Lawler, J., & Li, Z. (2005). A study of Web services projects in the financial services industry. Information Systems Management, 22(1), 66-76
Artz, J. M. (1996). A top-down methodology for building corporate Web applications. Internet Research, 6(2/3), 64-74.
Chan, M. T., & Kwok, L. F. (2001). Integrating security design into the software development process for e-commerce systems. Information Management & Computer Security, 9(2/3), 112-122.
Conallen, J. (1999). Modeling Web application architectures with UML. Communications of the ACM, 42(10), 63-70.
Conallen, J. (2003). Building Web Applications with UML. Addison-Wesley. Currie, W. L., Wang, C., & Weerakkody, V. (2004). Developing Web services using the
Microsoft.Net platform: technical and business challenges. Journal of Enterprise Information Management, 17(5), 335-350.
Foo, S., Leong, P. C., Hui, S. C., Liu, S. (1999). Security considerations in the delivery of Web-based applications: a case study. Information Management & Computer Security, 7(1), 40-50.
Greene, S. L., Jones, L., Matchen, P., & Thomas, J. C. (2003). Iterative development in the field. IBM Systems Journal, 42(2), 594-612.
Hof, R. D. (2005). Mix, match, and mutate. BusinessWeek, 7/25/2005, 72-75. Hoffman, D., Grivel, E., Battle, L. (2005). Designing software architectures to facilitate
accessible Web applications. IBM Systems Journal, 44(3), 467-483. Isakowitz, T., Stohr, E. A., & Balasubramanian, P. (1995). RMM: a methodology for structured
hypermedia design. Communications of the ACM, 38(8), 34-56. Johnson, R. D., & Reimer, D. (2004). Issues in the development of transactional Web
applications. IBM Systems Journal, 43(2), 430-440. Larsen, G. (1999). Designing component-based frameworks using patterns in UML.
Communications of the ACM, 42(10), 38-45. Katerattanakul, P. (2002). Framework of effective Web site design for business-to-consumer
Internet commerce. INFOR, 40(1), 57-70. Losavio, F., Chirinos, L., Matteo, A., Levy, N., & Ramdane-Cherif, A. (2004). Designing quality
architecture: incorporating ISO standards into the unified process. Information Systems Management, 21(1), 27-44.
Pant, S., Sim, H. T., & Hsu, C. (2001). A framework for developing Web information systems plans: illustration with Samsung Heavy Industries Co., Ltd. Information & Management, 38, 385-408.
Peng, Q. (2002). A survey and implementation framework for industrial-oriented Web-based applications. Integrated Manufacturing Systems, 13(5), 319-327.
Seng, J. L., & Wang, I. P. (2002). A database-centric and Web-automatic hypertext application design method. Journal of Computer Information Systems, 43(1), 91-109.
Standing, C. (2002). Methodologies for developing Web applications. Information and Software Technology, 44, 151-159.
Stein, L. D. (1998). Web Security: A Step-by-Step Reference Guide. Addison Wesley. Tai, H., Mitsui, K., Nerome, T., Abe, M., Ono, K., & Hori, M. (2004). Model-driven

A Survey Report for Web Application Success Factors 23
development of large-scale Web applications. IBM Journal of Research and Development, 48(5/6), 797-809.
Taylor, M. F., England, D., & Gresty, D. (2001). Knowledge for Web site development. Internet Research, 11(5), 451-461.
Wang, S. (2001). Designing information systems for electronic commerce. Industrial Management + Data Systems, 101(5/6), 304-314.
Yang, H. L., & Tang, J. H. (2003). A three-stage model of requirements elicitation for Web-based information systems. Industrial Management + Data Systems, 103(5/6), 398-409.