identifying resource efficiency improvement potential to
TRANSCRIPT
Identifying Resource Efficiency Improvement Potential to Enhance Competitiveness of Sri Lanka's Hotel Industry
2013

IFC Disclaimer
“This publication may contain advice,
opinions, and statements of various informa-
tion providers and content providers. IFC does
not represent or endorse the accuracy or
reliability of any advice, opinion, statement or
other information provided by any information
provider or content provider, or any user of this
publication or other person or entity.”
Prepared on behalf of
IFC - World Bank Group
by PricewaterhouseCoopers (Private) Limited, Sri Lanka and PricewaterhouseCoopers (Private) Limited, India

SummarySri Lanka's hotel industry has grown rapidly, since the end of
the conflict. The government’s Tourism Master Plan is now
encouraging the industry’s growth to meet a potential 2.5
million tourist arrivals by 2016. Tourism is expected to attract
foreign direct investment of $3 billion over the next five years
and provide employment to half a million Sri Lankans. At the
same time, the country hopes to earn half a billion dollars in
foreign exchange by 2016.
All this is good news for the economy, but this growth should
be offset with responsible and efficient resource management.
The hotel industry is a huge consumer of water and energy and
discharges different kinds of wet and dry waste and wastewater
into the environment. This survey was undertaken to evaluate
how efficiently hotels handle their resources and what needs to
be done to ensure efficient use in the future.
This survey covered three, four and five star hotels located
across the island. It found that while the awareness of the need
to conserve resources is high among management, there is a
reluctance to implement energy efficient measures for several
reasons, the high capital costs involved not being the least. One
step that will help is to make available subsidized financing to
encourage the hotel industry to embrace and adopt energy
saving technologies, especially in air conditioning, water use,
and wastewater treatment.
Attention should also be focused on the 4000 plus rooms
recently sanctioned by Sri Lanka’s tourism development
authority and currently under construction. Here, it has been
found that an incremental expenditure of $4.21 million will
ensure that energy efficient technologies are implemented right
at the beginning. With the industry poised on a springboard
ready to take off, the time to act is now. With this growth, it
becomes important that Sri Lanka's pristine environment, so
highly valued by tourists, does not suffer.

Industry Outlook04
04
05
05
06
04011.1. Introduction
1.2. Recent Growth in Hotel Industry
1.3. Types of Tourist Accommodation
1.4. Tourist Arrivals by Region
1.5. Future Outlook of Tourism Sector
Survey Findings08
09
10
11
11
15
16
17
18
18
20
08033.1. Layout of the Surveyed Hotels
3.2. Resource Consumption in the Surveyed Hotels
3.3. Specific Resource Use and Waste Generation Levels
3.4. Energy Consumption
3.4.1. Energy Conservation
3.5. Water Consumption
3.5.1. Water Conservation
3.6. Waste Generation
3.6.1. Waste Minimization Initiatives
3.7. Operational Practices of Surveyed Hotels
3.8. Level of Awareness of Resource Efficient Technologies
Resource Efficiency Improvement Potential and Required Investments
23
25
27
29
2305
5.1. Resource Efficiency Improvement Potential in the Surveyed Hotels
5.2. Resource Efficiency Improvement Potential for all Three, Four, and Five Star
Category Hotels
5.3. Incremental Investment Required to Implement Resource Efficient Technologies
in Hotels Under Construction
5.4. Impact on Greenhouse Gas Emission Levels
Survey Methodology 0702
Concerns and Barriers 2104
Conclusion 3106
Table of Contents
1.1. Introduction
Sri Lanka enjoyed a vibrant and growing tourism industry until 1980. It then
declined drastically in the mid-1980s due to ethnic unrest and conflict. In the 1990s,
the Government of Sri Lanka tried to revive the tourism sector with the Tourism
Master Plan. Attractive incentives were offered to foreign investors to develop the
tourism sector but there was little development till the civil conflict ended in 2009.
Since then, the tourism sector has experienced a period of exceptional growth with
tourist arrivals growing rapidly every year.
Tourism is an important source of foreign exchange earnings for Sri Lanka. It
accounted for 2.6 percent of foreign exchange receipts in 2009. Foreign exchange
earnings from tourism increased by 41.4 percent from $575 million in 2010 to $830
million in 20111. According to the Sri Lanka Tourism Development Authority
(SLTDA), the number of persons employed directly in the tourism sector was 51,306
in 2008, which increased by 1.5 percent in 2009 to 52,071 persons, compared with a
decline of 15.2 percent in 2008 from 60,516 in 2007.
1.2. Recent Growth in Hotel Industry
According to SLTDA Statistical Report 2011, tourist arrivals in Sri Lanka surpassed all
previous records and reached a new milestone of 1,005,606 in 2012, a 17.5 percent
increase over 2011.
The growth of the tourism sector is also reflected by the increase in tourist
accommodation infrastructure or number of rooms in the country from 455 in 2002
to 906 in 2011. There was also a substantial increase in average occupancy of hotels
from 43 to 77 percent during this period.
01 Industry Outlook
1 Sri Lanka Tourism Development Authority- Annual Statistical Report, 2011
Page 04
Industry Outlook01
Page 05
1.3. Types of Tourist Accommodation
Sri Lanka Tourism Development Authority (SLTDA), the government body set up to develop tourism in the country, has classified
tourist accommodation into four types:
Lodging establishments registered with SLTDA in 2011 numbered 906, with a total capacity of 20,794 rooms. This was dominated by
tourist hotels, which accounted for 70.5 percent (14,653 rooms) of the industry’s total room capacity in 2012. SLTDA defines tourist
hotels as establishments that maintain international standards of operations.
Boutique Villas and Hotels
GuesthousesHome Stay
Units Tourist Hotels
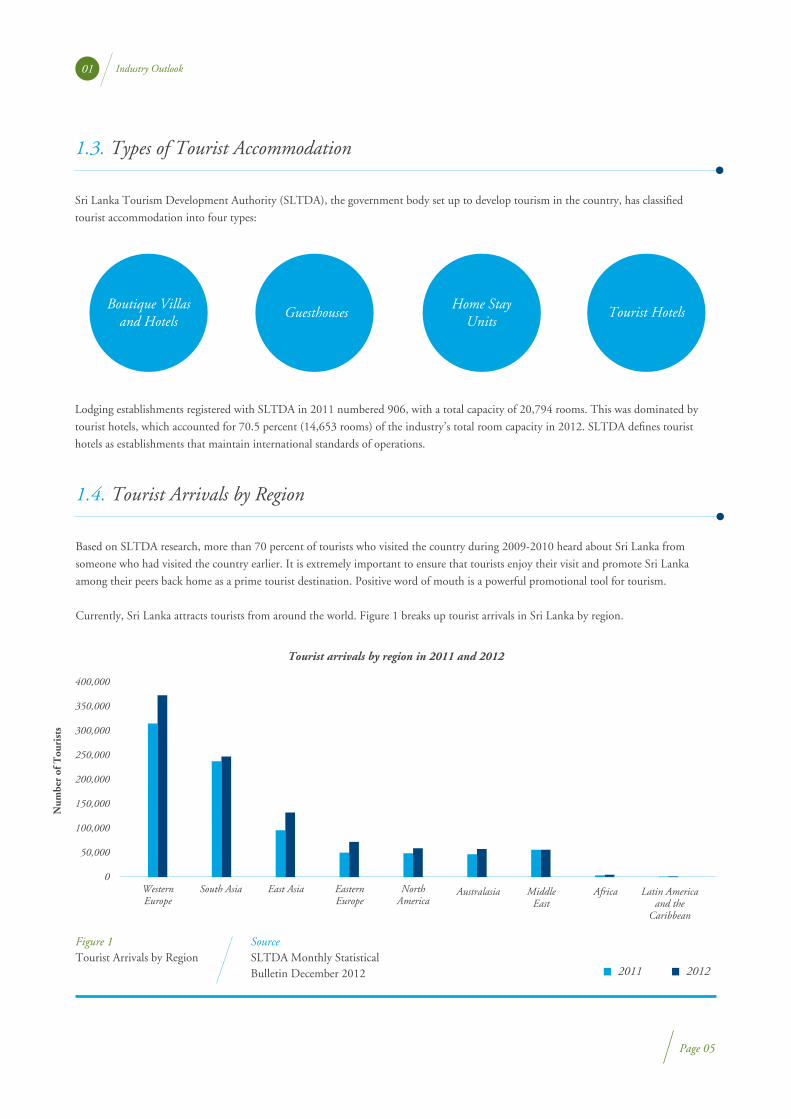
1.4. Tourist Arrivals by Region
Based on SLTDA research, more than 70 percent of tourists who visited the country during 2009-2010 heard about Sri Lanka from
someone who had visited the country earlier. It is extremely important to ensure that tourists enjoy their visit and promote Sri Lanka
among their peers back home as a prime tourist destination. Positive word of mouth is a powerful promotional tool for tourism.
Currently, Sri Lanka attracts tourists from around the world. Figure 1 breaks up tourist arrivals in Sri Lanka by region.
Figure 1Tourist Arrivals by Region
SourceSLTDA Monthly Statistical Bulletin December 2012
Tourist arrivals by region in 2011 and 2012
Western Europe
South Asia East Asia Eastern Europe
North America
Australasia Middle East
Africa Latin America and the
Caribbean
2011 2012
0
50,000
100,000
150,000
200,000
250,000
300,000
350,000
400,000
Num
ber
of T
ouri
sts
Industry Outlook01
Page 06
In terms of resource consumption, in 2011, the Sri Lankan hotel industry accounted for 196 Gigawatt hours or two percent of the
country’s total electricity sales, a growth of 3.5 percent compared to 20102. Apart from electricity, the hotel industry also uses a significant
amount of primary energy and water. In 2010, tourist hotels accounted for around one percent of water supplied by government agencies
in the country, equivalent to 2,197,0003 cubic meters. This is an increase of around 15 percent over 2009. If the targeted growth is
achieved, energy consumption in the hotel industry will double or triple in comparison to 2011. Apart from higher operating costs, this
will also lead to severe environmental impacts due to higher carbon emissions and waste generation.
Since the hotel industry is a major consumer of energy and natural resources, the growth of the sector could be a cause for environmental
and social concern if it is not combined with resource efficiency improvements.
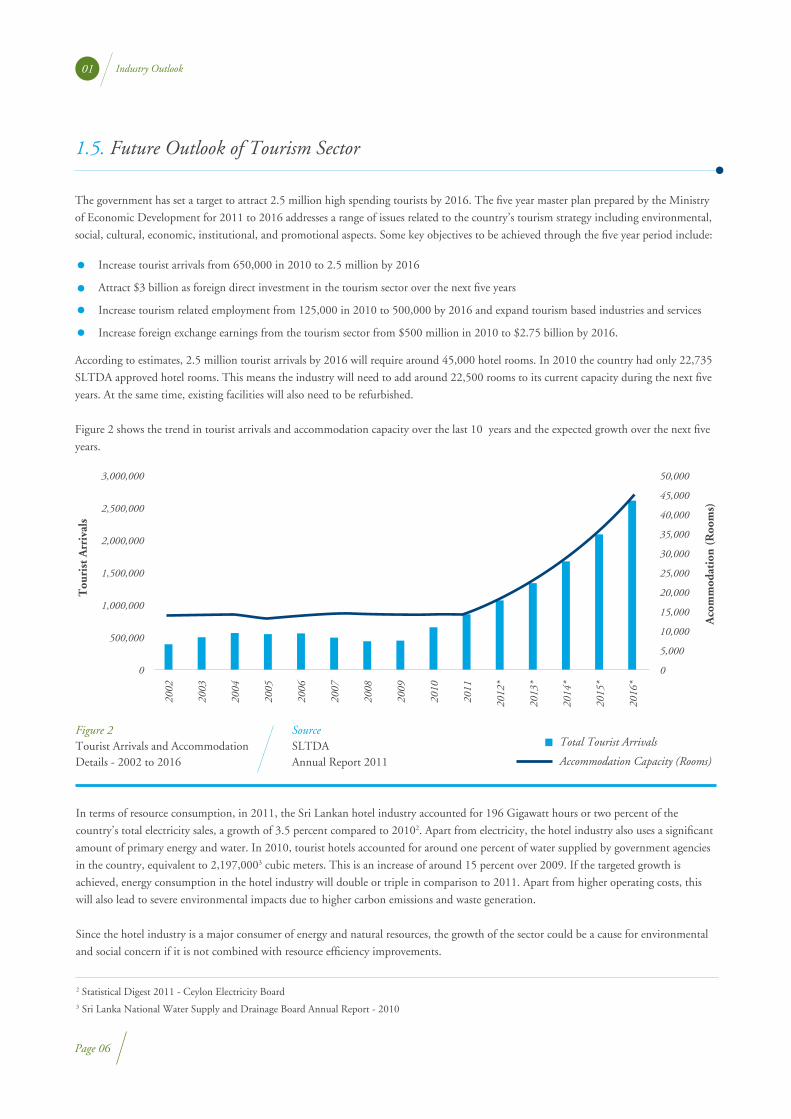
1.5. Future Outlook of Tourism Sector
The government has set a target to attract 2.5 million high spending tourists by 2016. The five year master plan prepared by the Ministry
of Economic Development for 2011 to 2016 addresses a range of issues related to the country’s tourism strategy including environmental,
social, cultural, economic, institutional, and promotional aspects. Some key objectives to be achieved through the five year period include:
Increase tourist arrivals from 650,000 in 2010 to 2.5 million by 2016
Attract $3 billion as foreign direct investment in the tourism sector over the next five years
Increase tourism related employment from 125,000 in 2010 to 500,000 by 2016 and expand tourism based industries and services
Increase foreign exchange earnings from the tourism sector from $500 million in 2010 to $2.75 billion by 2016.
According to estimates, 2.5 million tourist arrivals by 2016 will require around 45,000 hotel rooms. In 2010 the country had only 22,735
SLTDA approved hotel rooms. This means the industry will need to add around 22,500 rooms to its current capacity during the next five
years. At the same time, existing facilities will also need to be refurbished.
Figure 2 shows the trend in tourist arrivals and accommodation capacity over the last 10 years and the expected growth over the next five
years.
Figure 2Tourist Arrivals and Accommodation Details - 2002 to 2016
SourceSLTDA Annual Report 2011
Total Tourist Arrivals
Accommodation Capacity (Rooms)
Tou
rist
Arr
ival
s
Aco
mm
odat
ion
(Roo
ms)
0
500,000
1,000,000
1,500,000
2,000,000
2,500,000
3,000,000 50,000
45,000
40,000
35,000
30,000
25,000
20,000
15,000
10,000
5,000
0
2002
2003
2004
2005
2006
2007
2008
2009
2010
2011
2012
*
2013
*
2014
*
2015
*
2016
*
2 Statistical Digest 2011 - Ceylon Electricity Board 3 Sri Lanka National Water Supply and Drainage Board Annual Report - 2010
This survey aimed to evaluate the resource efficiency improvement potential of Sri
Lanka's hotel industry in the context of high levels of resource consumption both
now and in the future, given the high projected growth of tourism.
This survey collected data on current resource utilization status, the equipment
being used, awareness among hotel staff and management about resource efficient
technologies, potential for resource efficiency, investments required, and the
potential to reduce emission of greenhouse gases.
A detailed questionnaire was developed; a field survey was then conducted to
identify different resources used by hotels and the potential to improve efficiency.
The study was limited to three, four and five star tourist hotels. The mapping
carried out during the first part of the study showed that Sri Lanka has a total of
44 hotels in the three, four and five star category. To determine the sample size
and to select hotels for the survey, the project team relied on data collected during
the mapping stage. The sample size was decided based on valid statistical criteria,
and 23 hotels were selected.
The following parameters were considered in selecting these 23 hotels:
02 Survey Methodology
Page 07
District representation
Hotels where resource efficiency initiatives were already reported (based on Sri Lanka National Energy Efficiency Award winners list)
Proportionate representation of all star categories (three, four and five star)

3.1. Layout of the Surveyed Hotels
The survey found that hotels did not have similar layouts. In cities such as
Colombo, hotels are multi-storied with small open and green areas. Hotels closer
to beaches or in small cities and towns were generally low-rise and had cottage
type guest rooms.
In addition to guest rooms, almost all hotels had facilities such as multiple
restaurants, bars, conference halls, banquet halls, swimming pools, spas, tennis
courts, recreation areas including gyms, laundries, and shopping arcades.
03 Survey Findings
Page 08
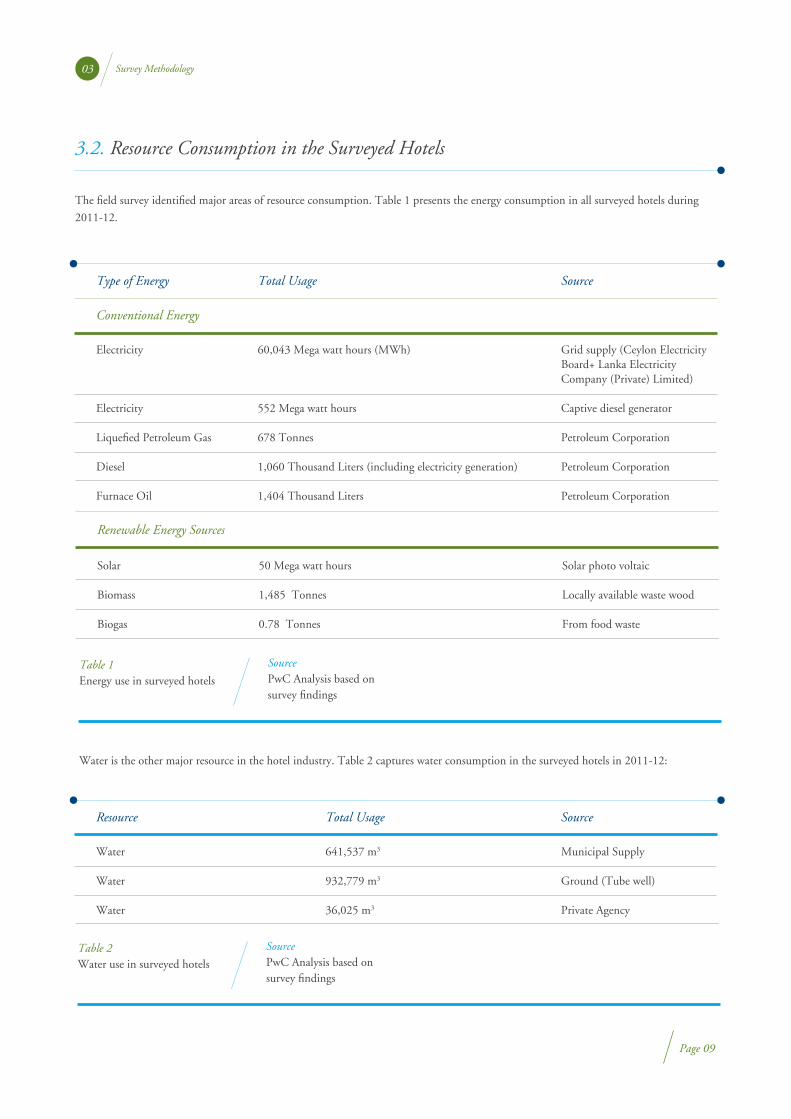
Water is the other major resource in the hotel industry. Table 2 captures water consumption in the surveyed hotels in 2011-12:
Survey Methodology03
3.2. Resource Consumption in the Surveyed Hotels
The field survey identified major areas of resource consumption. Table 1 presents the energy consumption in all surveyed hotels during
2011-12.
Type of Energy
Conventional Energy
Grid supply (Ceylon Electricity Board+ Lanka Electricity Company (Private) Limited)
Captive diesel generator
Petroleum Corporation
Petroleum Corporation
Petroleum Corporation
Total Usage Source
60,043 Mega watt hours (MWh)
552 Mega watt hours
678 Tonnes
1,060 Thousand Liters (including electricity generation)
1,404 Thousand Liters
Table 1Energy use in surveyed hotels
SourcePwC Analysis based on survey findings
Electricity
Electricity
Liquefied Petroleum Gas
Diesel
Furnace Oil
Renewable Energy Sources
Solar photo voltaic
Locally available waste wood
From food waste
50 Mega watt hours
1,485 Tonnes
0.78 Tonnes
Solar
Biomass
Biogas
Resource
Municipal Supply
Ground (Tube well)
Private Agency
Total Usage Source
641,537 m3
932,779 m3
36,025 m3
Table 2Water use in surveyed hotels
SourcePwC Analysis based on survey findings
Water
Water
Water
Page 09
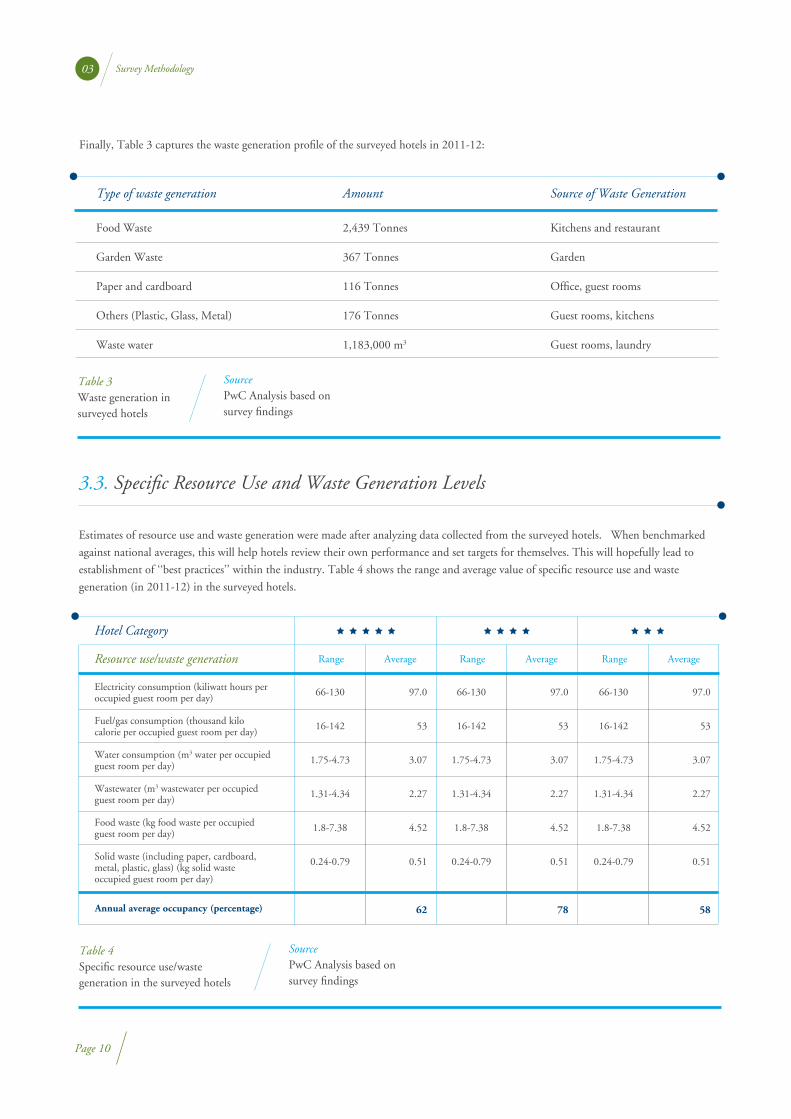
Finally, Table 3 captures the waste generation profile of the surveyed hotels in 2011-12:
Type of waste generation
Kitchens and restaurant
Garden
Office, guest rooms
Guest rooms, kitchens
Guest rooms, laundry
Amount Source of Waste Generation
2,439 Tonnes
367 Tonnes
116 Tonnes
176 Tonnes
1,183,000 m3
Table 3Waste generation in surveyed hotels
SourcePwC Analysis based on survey findings
Table 4Specific resource use/waste generation in the surveyed hotels
SourcePwC Analysis based on survey findings
Food Waste
Garden Waste
Paper and cardboard
Others (Plastic, Glass, Metal)
Waste water
Page 10
Survey Methodology03
3.3. Specific Resource Use and Waste Generation Levels
Estimates of resource use and waste generation were made after analyzing data collected from the surveyed hotels. When benchmarked
against national averages, this will help hotels review their own performance and set targets for themselves. This will hopefully lead to
establishment of ‘‘best practices’’ within the industry. Table 4 shows the range and average value of specific resource use and waste
generation (in 2011-12) in the surveyed hotels.
Electricity consumption (kiliwatt hours per occupied guest room per day)
Fuel/gas consumption (thousand kilo calorie per occupied guest room per day)
Water consumption (m3 water per occupied guest room per day)
Wastewater (m3 wastewater per occupied guest room per day)
Food waste (kg food waste per occupied guest room per day)
Solid waste (including paper, cardboard, metal, plastic, glass) (kg solid waste occupied guest room per day)
97.0
53
3.07
2.27
4.52
0.51
66-130
16-142
1.75-4.73
1.31-4.34
1.8-7.38
0.24-0.79
AverageRange
97.0
53
3.07
2.27
4.52
0.51
66-130
16-142
1.75-4.73
1.31-4.34
1.8-7.38
0.24-0.79
AverageRange
97.0
53
3.07
2.27
4.52
0.51
62 78 58
66-130
16-142
1.75-4.73
1.31-4.34
1.8-7.38
0.24-0.79
AverageRange
Hotel Category
Resource use/waste generation
Annual average occupancy (percentage)

3.4. Energy Consumption
Major energy consuming areas in hotels are air-conditioning, lighting, laundry, kitchens, and hot water generation.
Table 5 summarizes energy use in the surveyed hotels:
Survey Methodology03
Page 11
3.4.1. Energy Conservation
Air conditioning consumes the most electricity in hotels. Cooling solutions include standalone air conditioners (split and packaged) and
centralized chiller plants. Cottage type hotels have installed standalone air conditioners whilst multi-story hotels use centralized chiller
plants. Conference and banquet halls of cottage type hotels use packaged air conditioners.
The survey found existing split air conditioners had Energy Efficiency Ratios (EER)4 Cooling Capacity (W)/ Input Power (W) in the
range of 2.25 to 2.80, while new energy efficient (with or without inverter technology) air conditioners had a rating of 3.50 to four.
With central air-conditioning, the efficiency of some chiller plants was in the range of one - 2.5 (kilowatt/ton5). This is very low efficiency
when compared to chillers with screw type and multi compressors that consume only 0.5 to 0.6 kilowatt/ton. Around 50 percent of the
surveyed hotels had centralized chiller plants. Of these, 70 percent had efficient chillers.
Air Conditioning
Energy Consuming Area
N.A.
N.A.
72
22
N.A.
6
Percentage of share of total electricity consumption
Percentage of share of total thermal consumption
48
13
6
4
18
11
--
Table 5Major energy usage areas - All surveyed hotels
SourcePwC Analysis based on survey findings
Air - conditioning
Lighting
Laundry
Hot water generation
Kitchen
Water pumping and treatment, pool, Sewage Treatment Plant, lifts, etc.
Diesel generator
4 EER - Cooling capacity (W) /Input Power (W) 5 In the case of air conditioning, TR is ton of refrigeration where one ton is a short ton equivalent to 2000 pounds or 907.18 kg.
Only one of 23 surveyed hotels had installed energy efficient split air conditioners, while eight had installed energy efficient chillers. The
remaining hotels still operated either low efficiency standalone air conditioners or low efficiency chillers. None of the surveyed hotels had
installed energy efficient air conditioning systems such as vapor absorption machines based on waste heat or biomass fired boilers and
hybrid split air conditioners.
Standalone Air Conditioners: A few hotels had replaced normal split air conditioners (EER 2.38 Cooling Capacity (W)/ Input Power
(W) ) of 1.5 Tons of Refrigeration (TR) capacity with inverter air conditioners (EER 3.8 Cooling Capacity (W)/ Input Power (W))
during refurbishment activities. This had reduced electricity consumption from 1.48 kW per TR to 0.92 kilowatts per TR. The price of
an inverter air conditioner is around $1181 and estimated payback period is about five to six years allowing for 12 hours operation per
day.
Central Air Conditioners: Some hotels had replaced existing chiller plants with Coefficient of Performance of less than three, with energy
efficient chiller plants with Coefficient of Performance of more than seven. One hotel replaced a 185 TR chiller with an energy efficient
chiller and reduced electricity consumption from 1.2 kilowatts per TR to 0.60 kilowatts per TR. The investment was around $80,000
with an estimated payback period of 1.5 years with 18 operating hours per day. Several hotels have implemented similar measures with
chillers of different capacities.
Installation of Energy Efficient Air-Conditioning Systems:
The survey found 30 percent of hotels used fossil fuel based boilers and electric heaters to heat water. Solar water heaters are a viable and
cost effective alternative to conventional water heating methods such as electric geysers and conventional fuel fired boilers. Biomass
(Gliricidia, firewood, cinnamon sticks), biomass boilers and gasifiers can be used to reduce fossil fuel and/or electricity consumption to
heat water. Using heat from air conditioner outdoor units (for example, with Eco-Generator6) is an option to partly meet hot water needs.
This system can supply water at a temperature of around 70˚C.
Twelve hotels surveyed met their hot water requirements from solar heaters either partly or completely. Five of the remaining 11 hotels
met their requirements from biomass-based boilers or gasifiers. One hotel had implemented an innovative measure to recover heat from
the outer body of its biomass gasifier. A unique finding during the survey was the use of Eco-Generators to heat water.
Water Heating
Installation of Solar Water Heaters: Fifty-two percent of surveyed hotels had installed solar water heaters to heat water. The hotels
replaced electric heaters or reduced fuel consumption of steam boilers. Most hotels had installed solar water heaters with a capacity of 300
liters per day, which in turn can serve multiple rooms. The cost of a solar heater of 300 liters per day is around $2,362 with an estimated
payback period of five to six years.
Installation of Biomass Gasifier/Biomass Boiler: Six of the surveyed hotels (26 percent) had installed biomass boilers or biomass
gasifiers to reduce diesel and furnace oil consumption. Steam generated from these systems heated water for guest rooms, laundry, and
kitchens. The size of biomass gasifiers was in the range of 180 to 900 kilowatt thermal. In some hotels, the capacities of the biomass
boilers were in the 1 to 1.5 tonnes/hr range. The cost of a biomass gasifier of 300 kilowatt thermal is around $30,000 with an estimated
payback period of one to two years.
Installation of Eco-Generators to Heat Water: The Eco-Generator uses heat from air conditioner outdoor units to heat water for guest
rooms. The cost of an Eco-Generator is around $630 with an estimated payback period of three to four years.
Installation of Energy Efficient Water Heating Systems
Survey Methodology03
Page 12
6 The Eco-Generator Water Heater extracts heat from the compressor of an air conditioner unit, before it is vented outside, to heat water.
Most hotels have made efforts to use natural daylight as far as possible to reduce energy consumption for lighting. Many hotels have
partially or completely installed energy efficient lamps such as compact fluorescent lamps (CFLs) in place of incandescent lamps. However,
some hotels still use incandescent lamps which are not energy efficient. Currently, light emitting diode (LED) lamps available in the
market consume even less power when compared to CFLs. Although 78 percent of hotels had adopted LED lamps, installation was low
due to the high capital cost and unreliable quality and supply. Also, most hotels did not use LED lamps in restaurants and bars because
dimming is not possible.
Over 60 percent of hotels used normal fluorescent tube lights with magnetic ballast for kitchen and corridor lighting. These consume
around 52W while energy efficient fluorescent tube lights (T5 and T8)7 fixtures with electronic ballast consume only 28W.
High pressure sodium vapor (HPSV) lamps are the most widely used option for outdoor lighting. These are rated to be the most efficient
on a lumen/watt scale. New technology LED lamps are even more energy efficient and have a longer life when compared to high pressure
sodium vapor lamps. Replacing high pressure sodium vapor lamps with LED lamps will give substantial energy savings and provide white
light with a good color rendering index. Moreover, the life of LED lamps is high, around 50,000 hours, which will result in more savings.
The use of solar lighting and induction lamps among surveyed hotels was nonexistent while around nine percent used occupancy sensors
and dimmers.
Lighting Systems
Survey Methodology03
Page 13
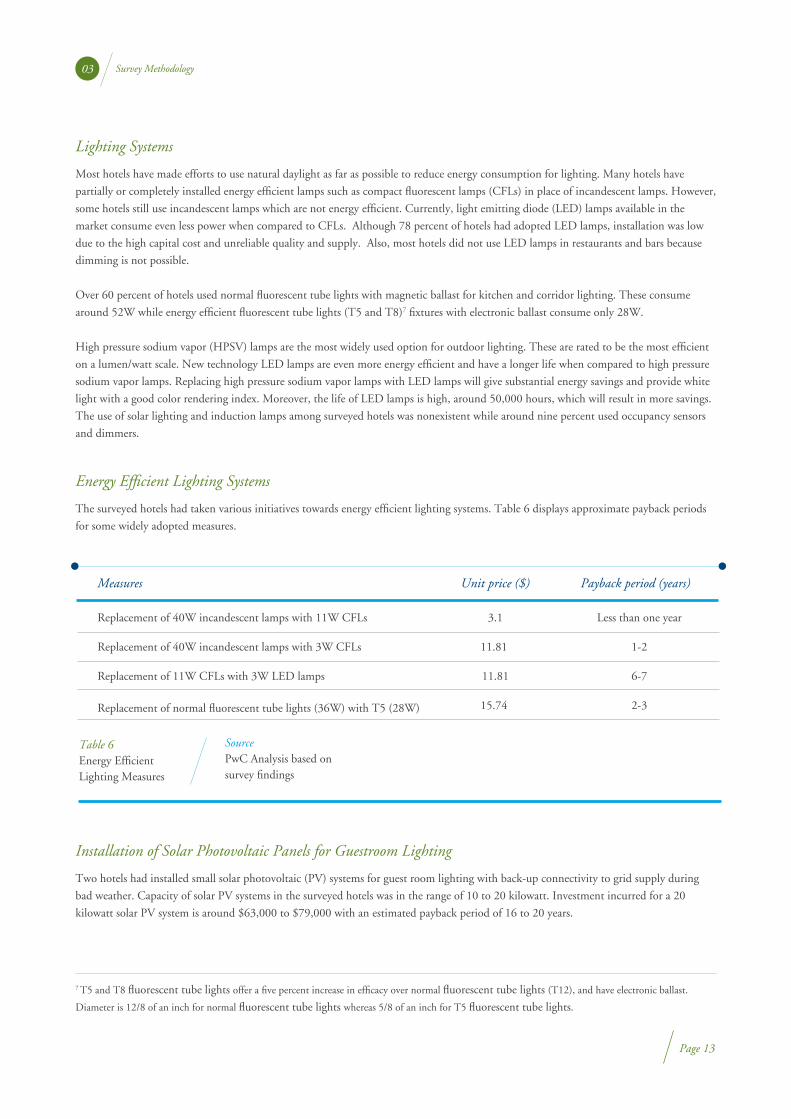
The surveyed hotels had taken various initiatives towards energy efficient lighting systems. Table 6 displays approximate payback periods
for some widely adopted measures.
Energy Efficient Lighting Systems
Two hotels had installed small solar photovoltaic (PV) systems for guest room lighting with back-up connectivity to grid supply during
bad weather. Capacity of solar PV systems in the surveyed hotels was in the range of 10 to 20 kilowatt. Investment incurred for a 20
kilowatt solar PV system is around $63,000 to $79,000 with an estimated payback period of 16 to 20 years.
Installation of Solar Photovoltaic Panels for Guestroom Lighting
7 T5 and T8 fluorescent tube lights offer a five percent increase in efficacy over normal fluorescent tube lights (T12), and have electronic ballast.
Diameter is 12/8 of an inch for normal fluorescent tube lights whereas 5/8 of an inch for T5 fluorescent tube lights.
Measures
Less than one year
1-2
6-7
2-3
Unit price ($) Payback period (years)
3.1
11.81
11.81
15.74
Table 6Energy Efficient Lighting Measures
SourcePwC Analysis based on survey findings
Replacement of 40W incandescent lamps with 11W CFLs
Replacement of 40W incandescent lamps with 3W CFLs
Replacement of 11W CFLs with 3W LED lamps
Replacement of normal fluorescent tube lights (36W) with T5 (28W)
The surveyed hotels used capacitor banks, variable frequency drives and key-card systems as power management measures. All surveyed
hotels had adopted key-card systems in guest rooms to switch off electricity when guest rooms were not occupied.
Power Management Measures
Thirteen of 23 hotels (56 percent) had installed capacitor banks to improve power factor. After installation of capacitor banks, hotels
recorded an improvement in power factor from 0.80 to 0.98. This had resulted in reduction of electricity bills. While costs vary according
to size, typically, installation cost of one kilo volt ampere reactive capacitor bank is around $28 with an estimated payback period of one to
two years.
Installation of Capacitor Banks
Variable frequency drives (VFDs) reduce electricity consumption in pumps/fans that have a variable load. Fifty-six percent of surveyed
hotels had installed variable frequency drives for water pumps, chilled water pumps, and blowers to reduce power consumption when
operating at reduced loads. Variable frequency drives vary from four kilowatt to 20 kilowatt depending on the rating of the pump/fan
motor. Energy savings from variable frequency drives range from 20 to 30 percent, with a tentative payback period of around two years.
Installation of Variable Frequency Drives
The laundry utilizes energy and water in large quantities. It also produces large quantities of wastewater. The survey found that the
laundries in some hotels used both electricity and steam, while others used only electricity. Equipment used in the laundry inclue washer
extractors (with or without soft starting), dryers and iron rollers (steam or electricity based). With efficient use of washing machines and
dryers, water and energy consumption can be reduced by around 10 to 20 percent.
Use of Efficient Laundry Equipment: Fifty-two percent of surveyed hotels used washing machines with soft starters which are energy
efficient. One hotel had recently installed energy efficient washing machines and saved energy by 10 percent. None of the hotels had
installed dryers with waste heat recovery, which are available in the market.
Laundry Operations
The kitchen is another major resource consuming area in hotels. Here, energy consuming equipment include liquefied petroleum gas
(LPG) stoves, electric ovens, cold and freezer rooms, mixers and grinders, coffee and tea making machines, induction plates, and dishwash-
ers. Energy conservation can be achieved through proper maintenance of equipment.
Maintenance of LPG stoves is essential to achieve maximum efficiency. Kitchen equipment that runs on both electricity and LPG can
reduce electricity consumption by switching to gas during peak hours when electricity tariffs are higher. Installation of counters to
estimate losses due to the frequent opening of the cool room door will help reduce energy consumption of cool rooms. Maintaining a
proper distance of refrigerators and freezers from high temperature cooking areas and running dishwashers at full loads are a few other
energy savings measures in the kitchen.
Kitchen Operations
Survey Methodology03
Page 14
Survey Methodology03
Renewable energy technologies had not been adopted widely. Only six hotels had installed biomass gasifiers or biomass boilers, and only
three used biogas for cooking. Other renewable energy technologies like solar PV were installed in two hotels and there was negligible use
of wind power for energy generation.
Since installation of renewable energy applications in hotels is low, there is a lot of potential here that should be explored and utilized in
the future. Solar water heaters and solar PVs can be employed in most hotels except in Colombo city hotels because of a shortage of space
and shadow free area available here. Only one hotel had wind power machines installed which was not in operation due to noise and
aesthetic issues.
Adoption of Renewable Energy Applications
3.5. Water Consumption
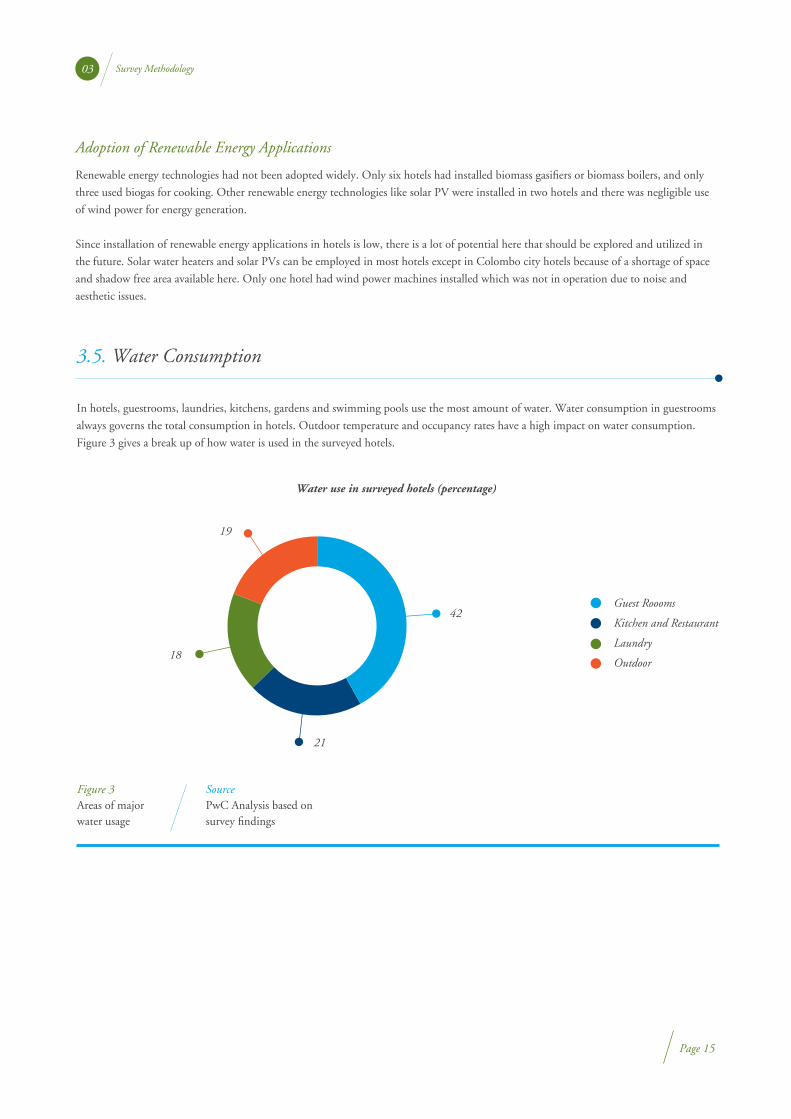
In hotels, guestrooms, laundries, kitchens, gardens and swimming pools use the most amount of water. Water consumption in guestrooms
always governs the total consumption in hotels. Outdoor temperature and occupancy rates have a high impact on water consumption.
Figure 3 gives a break up of how water is used in the surveyed hotels.
Water use in surveyed hotels (percentage)
Figure 3Areas of major water usage
SourcePwC Analysis based on survey findings
Guest Roooms
Kitchen and Restaurant
Laundry
Outdoor
42
21
18
19
Page 15
3.5.1. Water Conservation
The survey found that the adoption level of low flow taps and showers was around 52 percent. Low flow taps and showers mix air with
water flow so that the user is provided with the same experience as from high flow taps and showers. While the initial cost of low flow
systems is higher, water savings will justify the extra cost, which can be recovered within two years.
Low Flow Taps and Showers
Ninety-five percent of surveyed hotels had installed low capacity dual flush cisterns. Dual flush cisterns use as little as three liters of water
for a short flush and six liters for a long flush, compared to regular cisterns that use nine to 13.5 liters per flush.
The current prices of dual flush cisterns and a set of low flow taps and shower are around $315 and $551 respectively.
Low Capacity Dual Flush Cisterns
Only a few hotels (around 20 percent) had rainwater harvesting systems. Water collected through rain water harvesting can be used for
gardening as well as in the toilets.
Rainwater Harvesting
Over 50 percent of the hotels surveyed had not installed sub-water meters to monitor water consumption across different areas in the
hotel. By installing sub-water meters and continuously monitoring water consumption patterns, hotels can identify areas where it is
possible to reduce consumption of water.
Sub Water Metering
One hotel had installed an effective filtration system in the front porch water fountain. The filtering system led to water saving of 6,480
m3 per annum. The initiative involved an investment of around $3,937, with an estimated payback period of around one year. The same
hotel implemented a system by which air conditioner condensate water collected into the tank of a fish pond. This saved 10,000 liters of
water per annum.
Efficient Porch Water Fountain and Reuse of Air Conditioner Condensate Water
Survey Methodology03
Page 16
3.6. Waste Generation
Waste generation is another area where there is an urgent need for proper management and optimal use. Hotels produce different kinds of
waste. Food waste, for instance, is largely generated from the kitchen and restaurants. Paper and cardboard waste is generated by office and
guest rooms. Other wastes like plastic, glass, and metal are generated from guest rooms, kitchens, and bars.
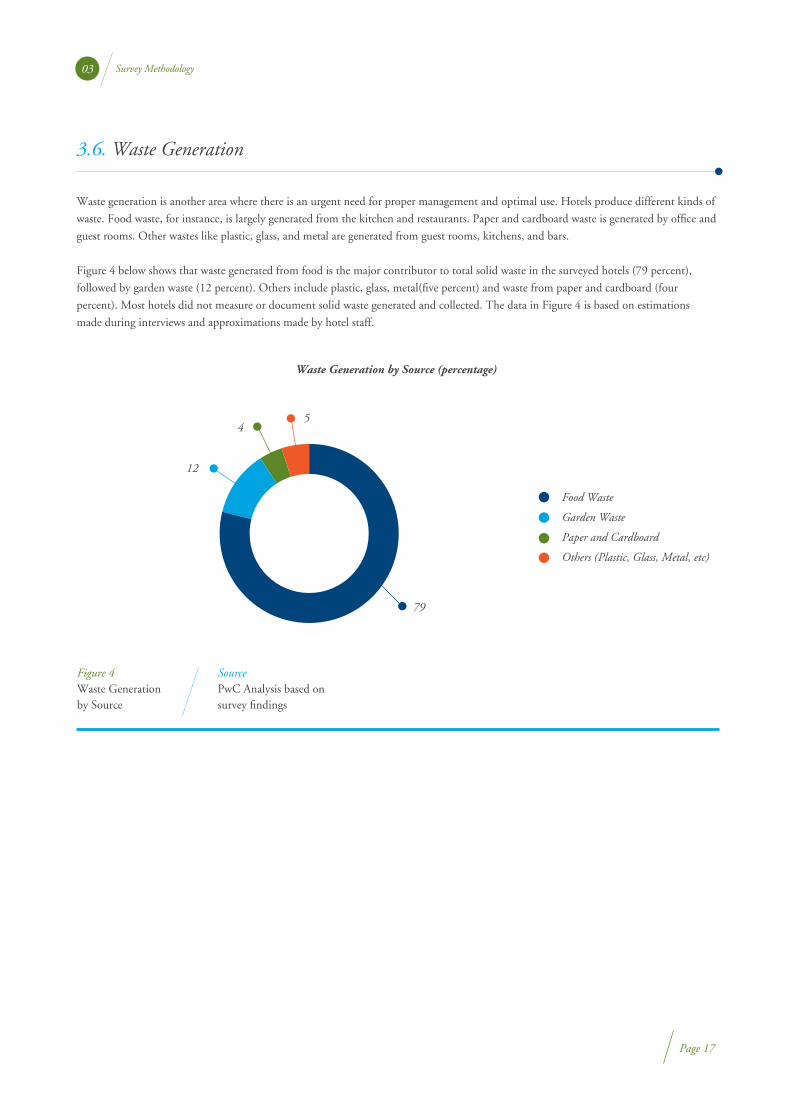
Figure 4 below shows that waste generated from food is the major contributor to total solid waste in the surveyed hotels (79 percent),
followed by garden waste (12 percent). Others include plastic, glass, metal(five percent) and waste from paper and cardboard (four
percent). Most hotels did not measure or document solid waste generated and collected. The data in Figure 4 is based on estimations
made during interviews and approximations made by hotel staff.
Waste Generation by Source (percentage)
Figure 4Waste Generationby Source
SourcePwC Analysis based on survey findings
Food Waste
Garden Waste
Paper and Cardboard
Others (Plastic, Glass, Metal, etc)
79
12
45
Survey Methodology03
Page 17
3.6.1. Waste Minimization Initiatives
Twenty of the 23 hotels had sewage treatment plants on the premises. All wastewater generated in these hotels was treated and used for
gardening.
Sewage Treatment Plant
The survey revealed that only 13 percent of the hotels used kitchen waste for biogas generation while the remaining disposed it to
piggeries. According to the management of hotels with biogas plants, they recovered the investment made on these plants in just one to
two years.
Biogas Generation
Almost all hotels (90 percent) segregated their waste through various means before disposing. Waste such as paper, plastic, metal, and glass
were separated and sold to a third party for recycling.
Solid Waste Segregation and Recycling
Twenty-two of the surveyed hotels composted garden waste on the premises.
Composting of Garden Waste
Survey Methodology03
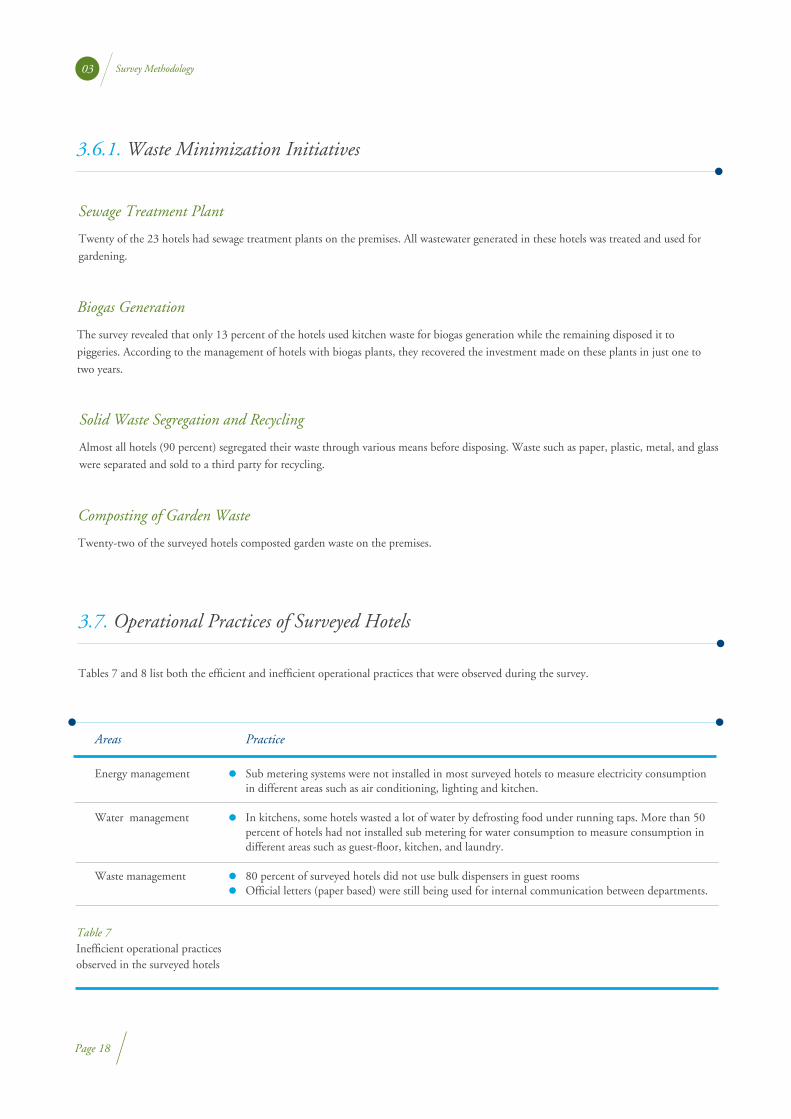
3.7. Operational Practices of Surveyed Hotels
Tables 7 and 8 list both the efficient and inefficient operational practices that were observed during the survey.
Areas Practice
Sub metering systems were not installed in most surveyed hotels to measure electricity consumption in different areas such as air conditioning, lighting and kitchen.
In kitchens, some hotels wasted a lot of water by defrosting food under running taps. More than 50 percent of hotels had not installed sub metering for water consumption to measure consumption in different areas such as guest-floor, kitchen, and laundry.
80 percent of surveyed hotels did not use bulk dispensers in guest roomsOfficial letters (paper based) were still being used for internal communication between departments.
Table 7Inefficient operational practices observed in the surveyed hotels
Energy management
Water management
Waste management
Page 18
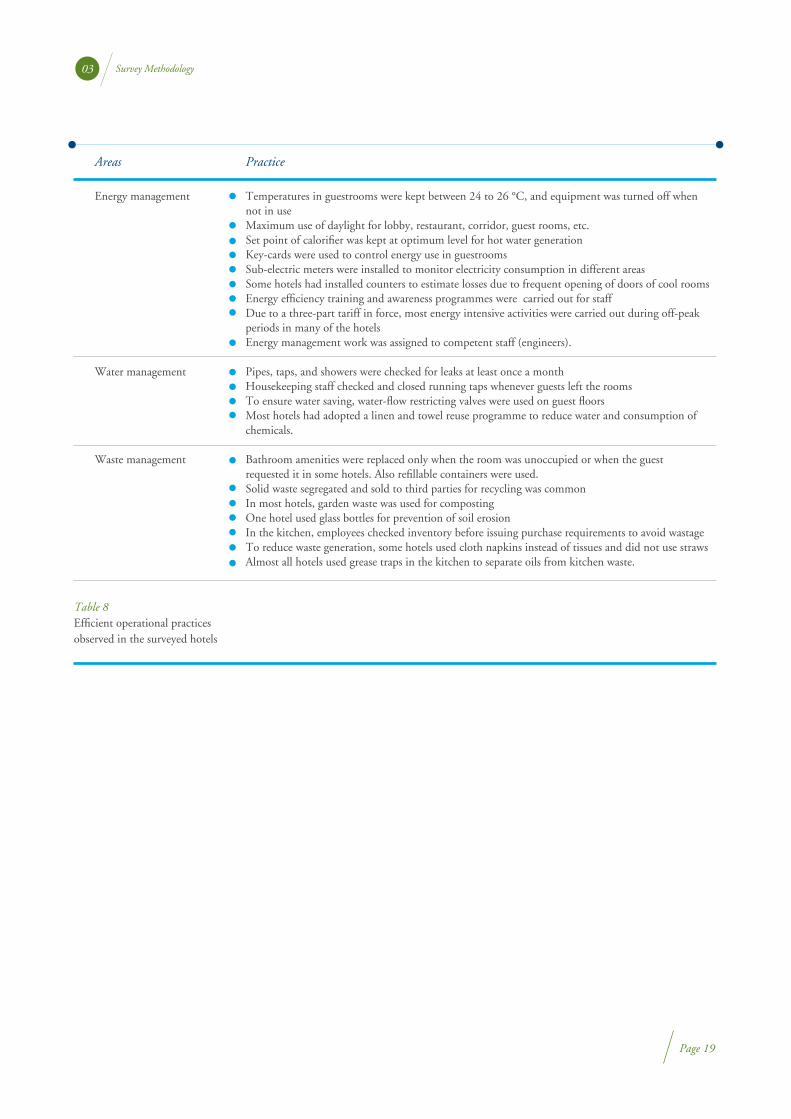
Areas Practice
Temperatures in guestrooms were kept between 24 to 26 °C, and equipment was turned off when not in useMaximum use of daylight for lobby, restaurant, corridor, guest rooms, etc.Set point of calorifier was kept at optimum level for hot water generationKey-cards were used to control energy use in guestroomsSub-electric meters were installed to monitor electricity consumption in different areasSome hotels had installed counters to estimate losses due to frequent opening of doors of cool rooms Energy efficiency training and awareness programmes were carried out for staff Due to a three-part tariff in force, most energy intensive activities were carried out during off-peak periods in many of the hotels Energy management work was assigned to competent staff (engineers).
Pipes, taps, and showers were checked for leaks at least once a monthHousekeeping staff checked and closed running taps whenever guests left the roomsTo ensure water saving, water-flow restricting valves were used on guest floorsMost hotels had adopted a linen and towel reuse programme to reduce water and consumption of chemicals.
Bathroom amenities were replaced only when the room was unoccupied or when the guest requested it in some hotels. Also refillable containers were used. Solid waste segregated and sold to third parties for recycling was commonIn most hotels, garden waste was used for compostingOne hotel used glass bottles for prevention of soil erosion In the kitchen, employees checked inventory before issuing purchase requirements to avoid wastageTo reduce waste generation, some hotels used cloth napkins instead of tissues and did not use straws Almost all hotels used grease traps in the kitchen to separate oils from kitchen waste.
Table 8Efficient operational practices observed in the surveyed hotels
Energy management
Water management
Waste management
Survey Methodology03
Page 19

3.8. Level of Awareness of Resource Efficient Technologies
The survey discovered that 50 percent of hotels had conducted energy audits in the recent past. Most participate regularly in the Sri Lanka
National Energy Efficiency Awards (SLNEEA). Around 35 percent of hotels have won awards at SLNEEA over the last three years.
Additionally, most surveyed hotels were registered with Greening Sri Lanka Hotels, an initiative funded by European Union under the
Switch Asia program. Around 15 percent of surveyed hotels were also registered with Earth Check and Green Globe programs.
Around 44 percent of hotels regularly conducted capacity building and awareness generation programs for staff on resource efficiency and
sustainability. Some hotels also set targets to reduce resource consumption and gave incentives to staff that helped achieve this.
An assessment on knowledge of resource efficiency technologies was also undertaken to evaluate awareness on resource efficient
technologies among top management (including owners/chief engineers/general managers). Around 90 percent of surveyed hotels were
aware, particularly about solar water heaters, biomass boilers, CFLs, LED lamps, solar street lighting, occupancy sensors, card key
switches, variable frequency drives, capacitor banks, and efficient washing machines. Almost all surveyed hotels were aware of various
water conservation, waste minimization, and renewable energy measures.
Around 60 percent of hotels were aware of energy efficient technologies, particularly inverter air conditioners, solar air conditioners, vapor
absorption machines, T5 fluorescent tube lights and dryers with waste heat recovery. Around 40 percent were aware of latest technologies
such as hybrid air conditioners, heat pumps, and induction lamps.
Survey Methodology03
Page 20
Consequently, it is widely acknowledged that accelerated deployment of resource efficient technologies is required to sustain growth.
However, there are many barriers to large-scale adoption of these technologies. This survey has identified these barriers, based on response
from the hotels:
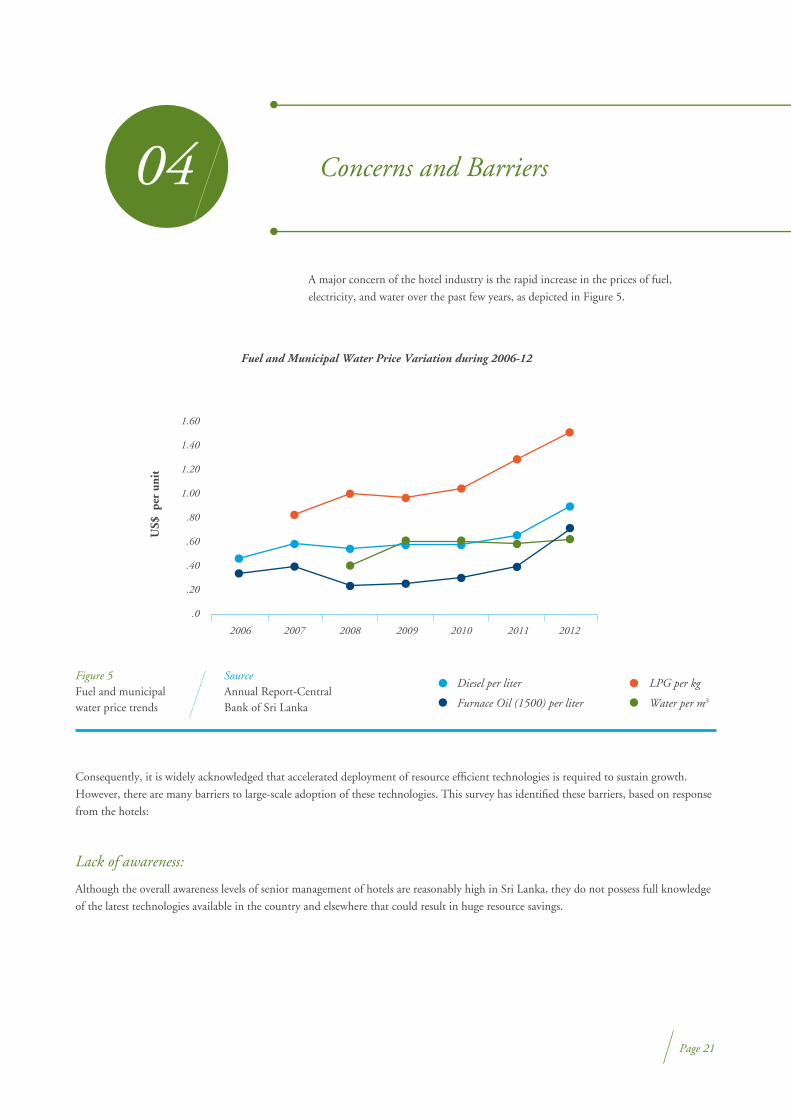
A major concern of the hotel industry is the rapid increase in the prices of fuel,
electricity, and water over the past few years, as depicted in Figure 5.
04 Concerns and Barriers
Figure 5Fuel and municipal water price trends
SourceAnnual Report-Central Bank of Sri Lanka
Fuel and Municipal Water Price Variation during 2006-12
US$
per
uni
t
2006 2007 2008 2009 2010 2011 2012
Diesel per liter
Furnace Oil (1500) per liter
LPG per kg
Water per m3
1.60
1.40
1.20
1.00
.80
.60
.40
.20
.0
Page 21
Although the overall awareness levels of senior management of hotels are reasonably high in Sri Lanka, they do not possess full knowledge
of the latest technologies available in the country and elsewhere that could result in huge resource savings.
Lack of awareness:
Concerns and Barriers04
Page 22
Some hotels, except those which are part of large national hotel chains, do not have dedicated manpower to undertake resource efficiency
initiatives.
Dedicated manpower:
Hotel managements are willing to adopt low cost resource efficient technologies, but are reluctant to adopt initiatives with relatively longer
payback periods. Generally, those with payback periods of more than five years are treated with caution. However some exceptions were
observed where some hotels had implemented energy efficiency initiatives with 10 to 20 year payback periods. The unavailability of
specific subsidized sustainability-focused funding schemes is another constraint, which prevents quicker and more widespread adoption of
resource efficient technologies.
Financing of capital-intensive measures:
Equipment suppliers are not many at present and only a limited number of reliable and quality suppliers operate in the country.
Availability of suppliers and vendors:
After sales service and maintenance networks are not developed in the country; especially for new technologies such as renewable energy.
Sometimes, availability of spare parts is also an issue.
Availability of reliable after sales service and maintenance:
Installation of renewable energy equipment such as solar panels require a significant amount of free space. With the rapid increase in the
number of high rise commercial buildings, especially in cities like Colombo, most areas are covered by shadow and not much free space is
available for installation of solar panels.
Shortage of free space in city hotels:
Lack of prioritization, with many businesses viewing resource efficiency as a ‘non-core’ business activity, is a behavioral barrier that was
noticed during the survey. Successful implementation of resource efficiency initiatives depends on staff cooperation. This can involve
changing long established work patterns. Managements need to invest time and resources to create attitudinal and behavioral changes in
their staff.
Behavior and motivation:
Another barrier to adoption of resource efficient measures is the perception of hidden costs. These are items such as management time
involved in gathering information, analysis, negotiation, and procurement of technologies. Other hidden costs listed included
documentation, auditing and regulatory compliance costs. Some managers also cited disruption of business and inconvenience while
implementing resource efficient measures.
Hidden Cost:
5.1. Resource Efficiency Improvement Potential in Surveyed Hotels
Parameters such as operating hours, fuel and electricity prices, occupancy rates,
and present resource consumption levels were used to estimate annual savings
potential of resource efficiency measures proposed for each hotel. Estimates of
tentative investments, cost of proposed resource efficient equipment and
technologies were obtained from reliable suppliers in Sri Lanka.
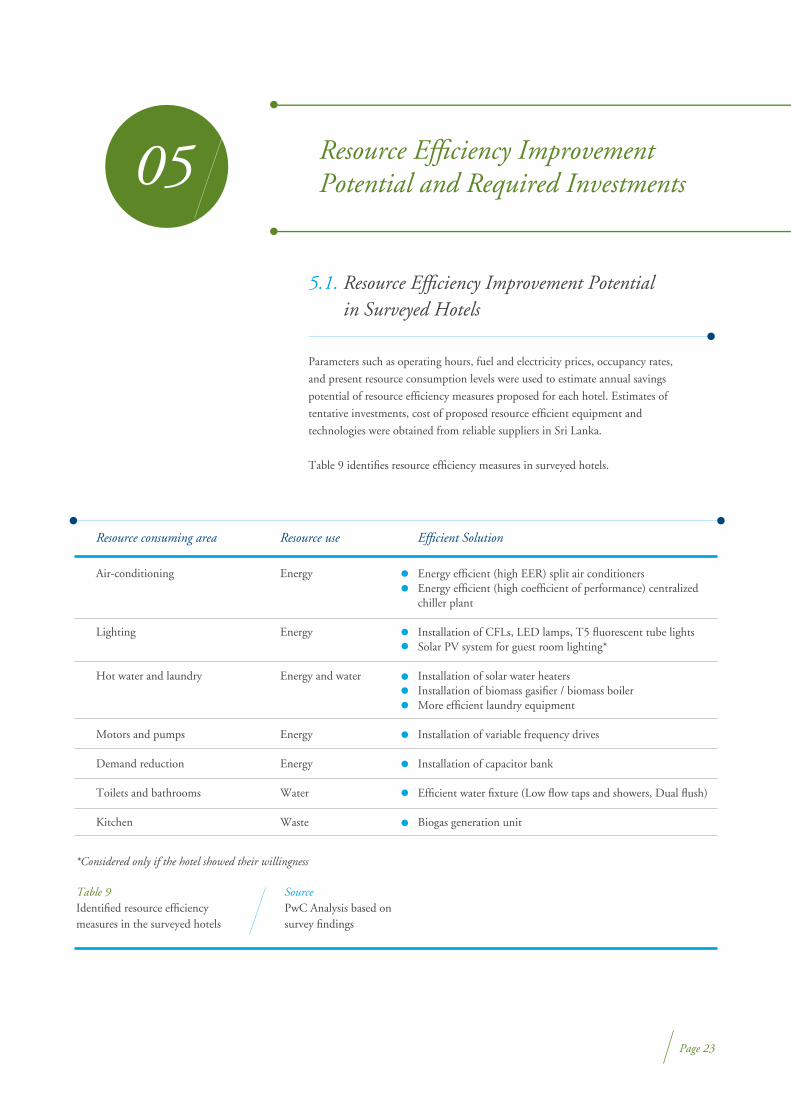
Table 9 identifies resource efficiency measures in surveyed hotels.
05 Resource Efficiency Improvement Potential and Required Investments
Resource consuming area Resource use Efficient Solution
Energy
Energy
Energy and water
Energy
Energy
Water
Waste
Table 9Identified resource efficiency measures in the surveyed hotels
*Considered only if the hotel showed their willingness
Air-conditioning
Lighting
Hot water and laundry
Motors and pumps
Demand reduction
Toilets and bathrooms
Kitchen
Energy efficient (high EER) split air conditionersEnergy efficient (high coefficient of performance) centralized chiller plant
Installation of CFLs, LED lamps, T5 fluorescent tube lights Solar PV system for guest room lighting*
Installation of solar water heatersInstallation of biomass gasifier / biomass boilerMore efficient laundry equipment
Installation of variable frequency drives
Installation of capacitor bank
Efficient water fixture (Low flow taps and showers, Dual flush)
Biogas generation unit
SourcePwC Analysis based on survey findings
Page 23
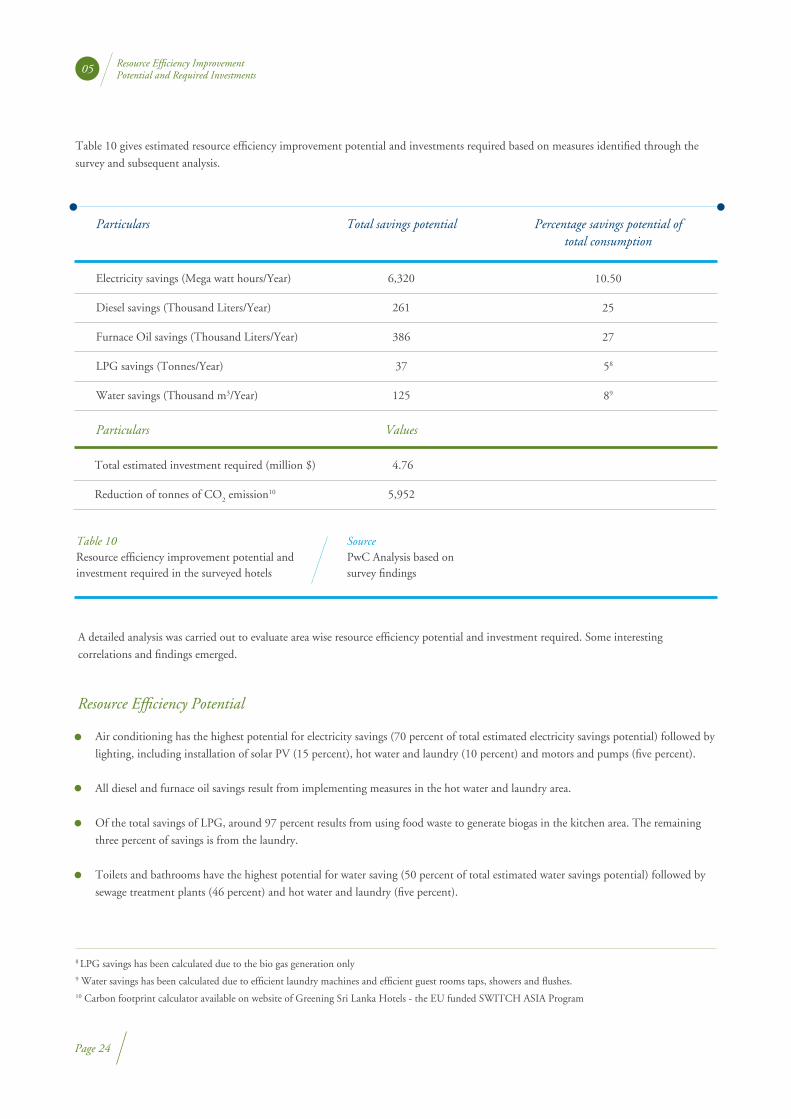
Particulars Total savings potential Percentage savings potential of total consumption
6,320
261
386
37
125
4.76
5,952
Table 10Resource efficiency improvement potential and investment required in the surveyed hotels
Electricity savings (Mega watt hours/Year)
Diesel savings (Thousand Liters/Year)
Furnace Oil savings (Thousand Liters/Year)
LPG savings (Tonnes/Year)
Water savings (Thousand m3/Year)
10.50
25
27
58
89
Total estimated investment required (million $)
Reduction of tonnes of CO2 emission10
SourcePwC Analysis based on survey findings
Table 10 gives estimated resource efficiency improvement potential and investments required based on measures identified through the
survey and subsequent analysis.
A detailed analysis was carried out to evaluate area wise resource efficiency potential and investment required. Some interesting
correlations and findings emerged.
Particulars Values
8 LPG savings has been calculated due to the bio gas generation only 9 Water savings has been calculated due to efficient laundry machines and efficient guest rooms taps, showers and flushes.10 Carbon footprint calculator available on website of Greening Sri Lanka Hotels - the EU funded SWITCH ASIA Program
05 Resource Efficiency Improvement Potential and Required Investments
Resource Efficiency Potential
Air conditioning has the highest potential for electricity savings (70 percent of total estimated electricity savings potential) followed by
lighting, including installation of solar PV (15 percent), hot water and laundry (10 percent) and motors and pumps (five percent).
All diesel and furnace oil savings result from implementing measures in the hot water and laundry area.
Of the total savings of LPG, around 97 percent results from using food waste to generate biogas in the kitchen area. The remaining
three percent of savings is from the laundry.
Toilets and bathrooms have the highest potential for water saving (50 percent of total estimated water savings potential) followed by
sewage treatment plants (46 percent) and hot water and laundry (five percent).
Page 24
Investment Required
Implementation of energy efficiency measures in air conditioning requires $1.62 million, which is the major part of the total estimated
investment followed by hot water and laundry ($1.11 million), and lighting, including solar PV ($440,000).
Installation of water efficient fixtures in toilets and bathrooms requires $660,000 which will account for 14 percent of the total
investment required.
Around $80,000 million is required for biogas units using kitchen waste.
05 Resource Efficiency Improvement Potential and Required Investments
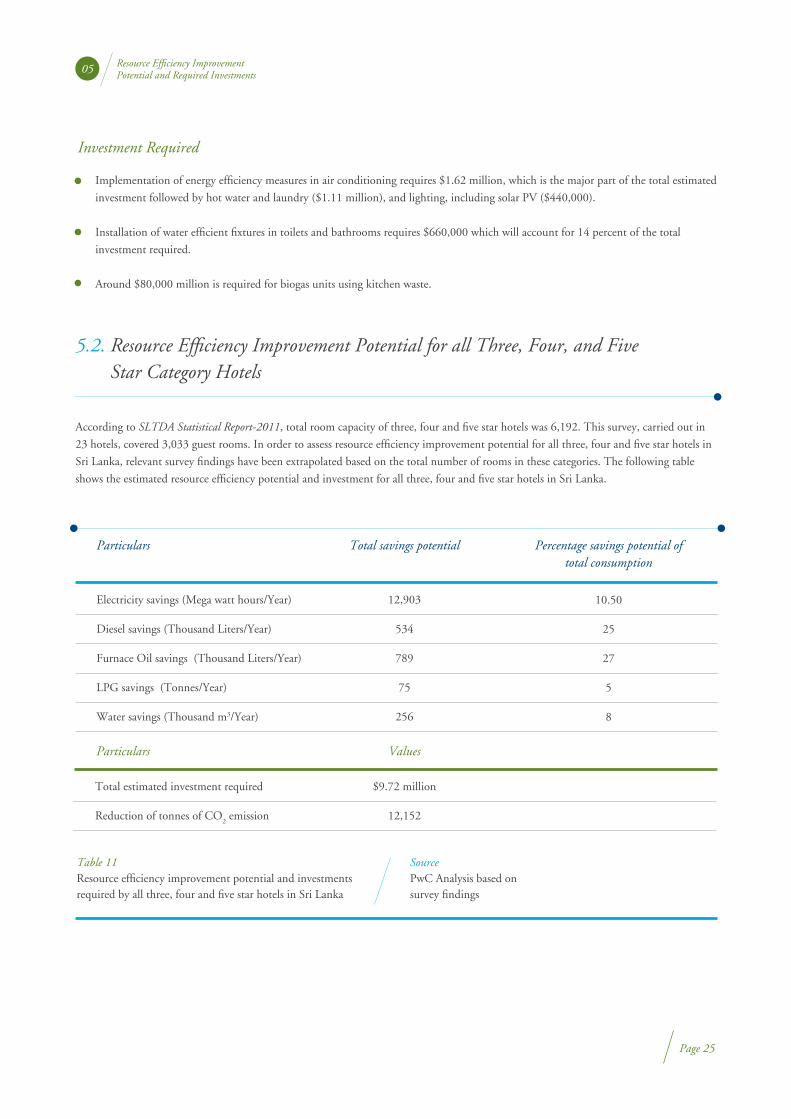
5.2. Resource Efficiency Improvement Potential for all Three, Four, and Five Star Category Hotels
According to SLTDA Statistical Report-2011, total room capacity of three, four and five star hotels was 6,192. This survey, carried out in
23 hotels, covered 3,033 guest rooms. In order to assess resource efficiency improvement potential for all three, four and five star hotels in
Sri Lanka, relevant survey findings have been extrapolated based on the total number of rooms in these categories. The following table
shows the estimated resource efficiency potential and investment for all three, four and five star hotels in Sri Lanka.
Particulars Total savings potential Percentage savings potential of total consumption
12,903
534
789
75
256
$9.72 million
12,152
Table 11Resource efficiency improvement potential and investments required by all three, four and five star hotels in Sri Lanka
Electricity savings (Mega watt hours/Year)
Diesel savings (Thousand Liters/Year)
Furnace Oil savings (Thousand Liters/Year)
LPG savings (Tonnes/Year)
Water savings (Thousand m3/Year)
10.50
25
27
5
8
Total estimated investment required
Reduction of tonnes of CO2 emission
SourcePwC Analysis based on survey findings
Particulars Values
Page 25

Resource consuming area Savings potential Percentage savings potential of total estimated potential
9,034
1,907
1,315
647
Table 12Area wise resource improvement potential in all three, four and five star hotels in Sri Lanka
70
15
10
5
Air-conditioning
Lighting
Hot water and laundry
Motors and pumps
SourcePwC Analysis based on survey findings
Table 12 breaks down total resource efficiency improvement potential in all three, four and five star hotels in Sri Lanka.
Electricity savings (Mega watt hours/Year)
534 100Hot water and laundry
Diesel savings (Thousand Liters/Year)
789 100Hot water and laundry
Furnace oil savings (Thousand Liters/Year)
73
2
97
3
Kitchen
Hot water and laundry
LPG savings (Tonnes/Year)
127
119
10
50
46
4
Toilets and bathrooms
Sewage treatment plant
Hot water and laundry
Water savings (Thousand m3/Year)
05 Resource Efficiency Improvement Potential and Required Investments
Page 26
5.3. Incremental Investment Required to Implement Resource Efficient Technologies in Hotels Under Construction
SLTDA has approved construction of 68 new tourist hotels in the last three years (2010 to 2012), of which 57 are in three to five star
categories. Over 4000 new rooms will be added with the construction of these hotels. These hotels can be more resource efficient with
additional/incremental investment during construction. Two sets of calculations have been done to quantify this additional investment:
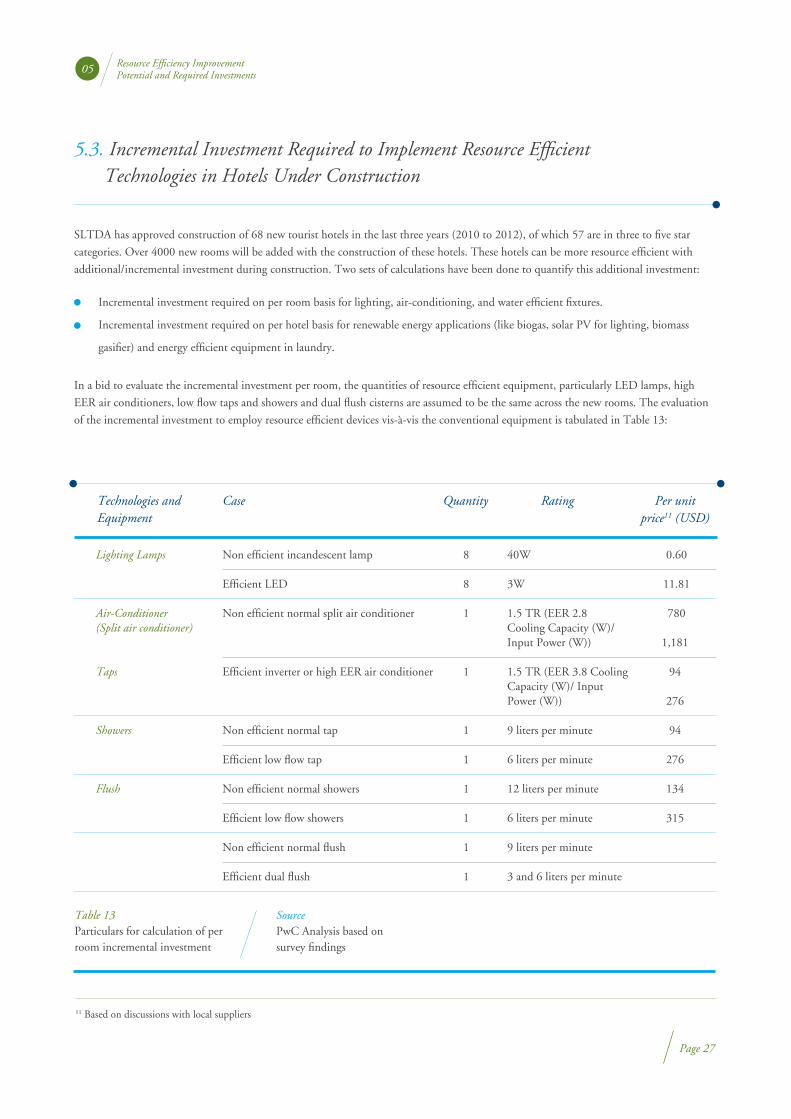
In a bid to evaluate the incremental investment per room, the quantities of resource efficient equipment, particularly LED lamps, high
EER air conditioners, low flow taps and showers and dual flush cisterns are assumed to be the same across the new rooms. The evaluation
of the incremental investment to employ resource efficient devices vis-à-vis the conventional equipment is tabulated in Table 13:
05 Resource Efficiency Improvement Potential and Required Investments
Incremental investment required on per room basis for lighting, air-conditioning, and water efficient fixtures.
Incremental investment required on per hotel basis for renewable energy applications (like biogas, solar PV for lighting, biomass
gasifier) and energy efficient equipment in laundry.
Technologies and Equipment
Case
Non efficient incandescent lamp
Efficient LED
Non efficient normal split air conditioner
Efficient inverter or high EER air conditioner
Non efficient normal tap
Efficient low flow tap
Non efficient normal showers
Efficient low flow showers
Non efficient normal flush
Efficient dual flush
Quantity
8
8
1
1
1
1
1
1
1
1
Rating
40W
3W
1.5 TR (EER 2.8 Cooling Capacity (W)/ Input Power (W))
1.5 TR (EER 3.8 Cooling Capacity (W)/ Input Power (W))
9 liters per minute
6 liters per minute
12 liters per minute
6 liters per minute
9 liters per minute
3 and 6 liters per minute
Per unit price11 (USD)
0.60
11.81
780
1,181
94
276
94
276
134
315
Table 13Particulars for calculation of per room incremental investment
Lighting Lamps
Air-Conditioner (Split air conditioner)
Taps
Showers
Flush
SourcePwC Analysis based on survey findings
11 Based on discussions with local suppliers
Page 27
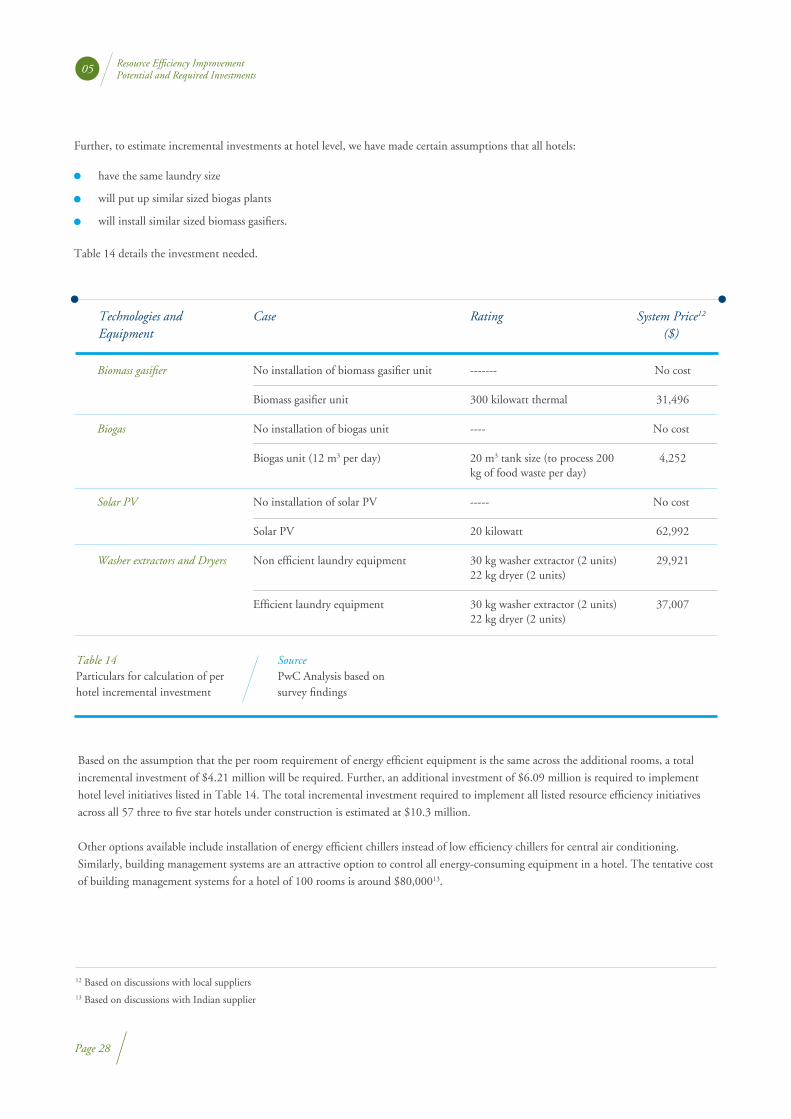
Further, to estimate incremental investments at hotel level, we have made certain assumptions that all hotels:
Table 14 details the investment needed.
Based on the assumption that the per room requirement of energy efficient equipment is the same across the additional rooms, a total
incremental investment of $4.21 million will be required. Further, an additional investment of $6.09 million is required to implement
hotel level initiatives listed in Table 14. The total incremental investment required to implement all listed resource efficiency initiatives
across all 57 three to five star hotels under construction is estimated at $10.3 million.
Other options available include installation of energy efficient chillers instead of low efficiency chillers for central air conditioning.
Similarly, building management systems are an attractive option to control all energy-consuming equipment in a hotel. The tentative cost
of building management systems for a hotel of 100 rooms is around $80,00013.
05 Resource Efficiency Improvement Potential and Required Investments
Technologies and Equipment
Case
No installation of biomass gasifier unit
Biomass gasifier unit
No installation of biogas unit
Biogas unit (12 m3 per day)
No installation of solar PV
Solar PV
Non efficient laundry equipment
Efficient laundry equipment
Rating
-------
300 kilowatt thermal
----
20 m3 tank size (to process 200 kg of food waste per day)
-----
20 kilowatt
30 kg washer extractor (2 units)22 kg dryer (2 units)
30 kg washer extractor (2 units)22 kg dryer (2 units)
System Price12
($)
No cost
31,496
No cost
4,252
No cost
62,992
29,921
37,007
Table 14Particulars for calculation of per hotel incremental investment
Biomass gasifier
Biogas
Solar PV
Washer extractors and Dryers
SourcePwC Analysis based on survey findings
12 Based on discussions with local suppliers13 Based on discussions with Indian supplier
Page 28
have the same laundry size
will put up similar sized biogas plants
will install similar sized biomass gasifiers.
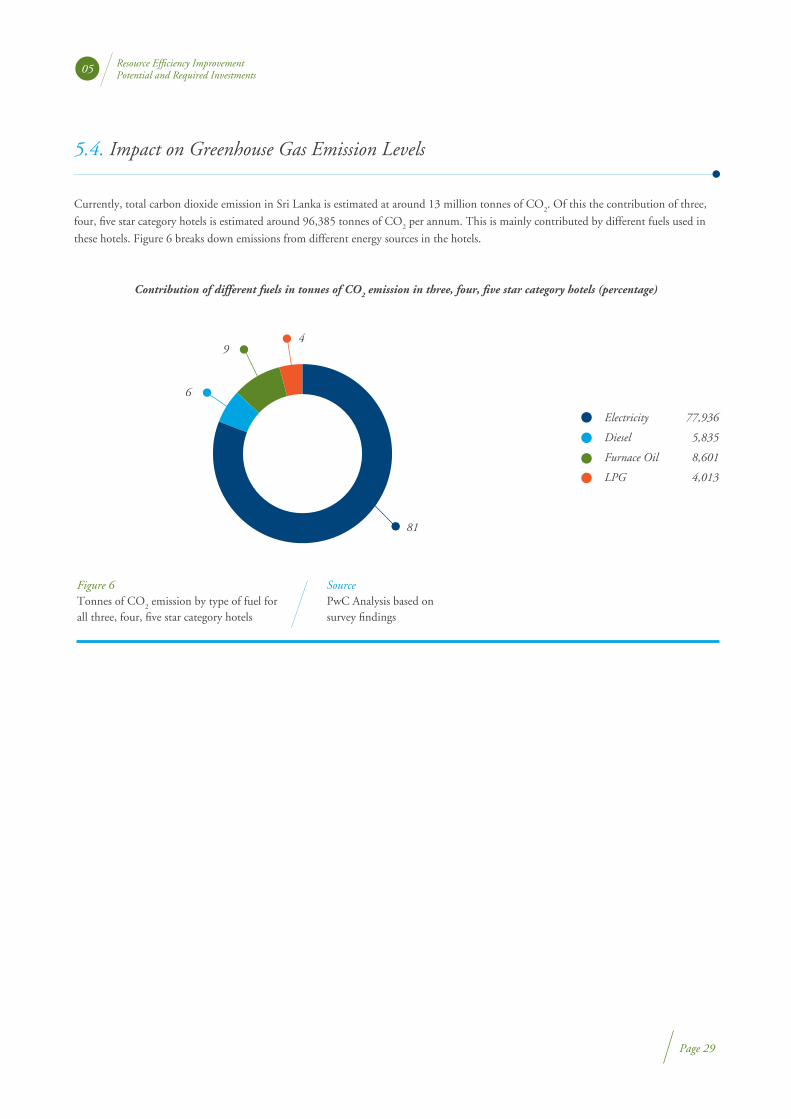
5.4. Impact on Greenhouse Gas Emission Levels
Currently, total carbon dioxide emission in Sri Lanka is estimated at around 13 million tonnes of CO2. Of this the contribution of three,
four, five star category hotels is estimated around 96,385 tonnes of CO2 per annum. This is mainly contributed by different fuels used in
these hotels. Figure 6 breaks down emissions from different energy sources in the hotels.
05 Resource Efficiency Improvement Potential and Required Investments
Contribution of different fuels in tonnes of CO2 emission in three, four, five star category hotels (percentage)
77,936
5,835
8,601
4,013
Figure 6Tonnes of CO
2 emission by type of fuel for
all three, four, five star category hotels
SourcePwC Analysis based on survey findings
Electricity
Diesel
Furnace Oil
LPG
81
6
94
Page 29
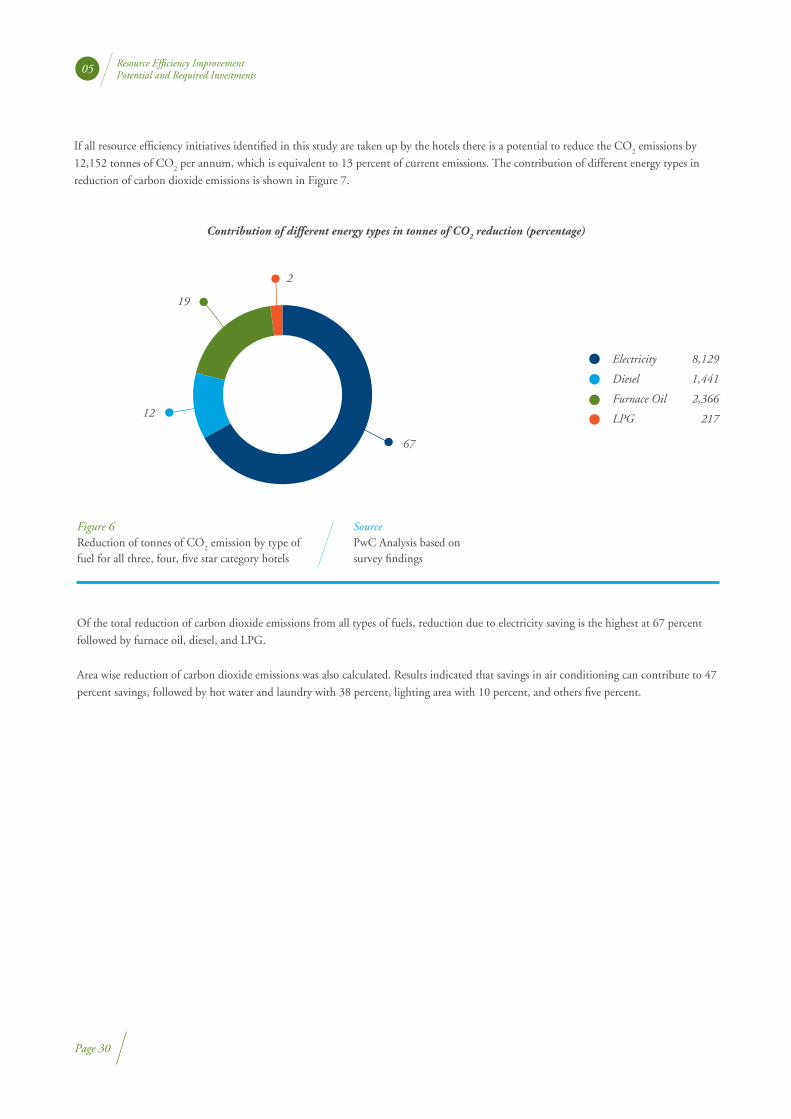
If all resource efficiency initiatives identified in this study are taken up by the hotels there is a potential to reduce the CO2 emissions by
12,152 tonnes of CO2 per annum, which is equivalent to 13 percent of current emissions. The contribution of different energy types in
reduction of carbon dioxide emissions is shown in Figure 7.
Of the total reduction of carbon dioxide emissions from all types of fuels, reduction due to electricity saving is the highest at 67 percent
followed by furnace oil, diesel, and LPG.
Area wise reduction of carbon dioxide emissions was also calculated. Results indicated that savings in air conditioning can contribute to 47
percent savings, followed by hot water and laundry with 38 percent, lighting area with 10 percent, and others five percent.
05 Resource Efficiency Improvement Potential and Required Investments
Contribution of different energy types in tonnes of CO2 reduction (percentage)
8,129
1,441
2,366
217
Figure 6Reduction of tonnes of CO
2 emission by type of
fuel for all three, four, five star category hotels
SourcePwC Analysis based on survey findings
Electricity
Diesel
Furnace Oil
LPG
67
12
19
2
Page 30

06 Conclusion
Page 31
The key findings of this survey in relation to patterns of energy and water
consumption, waste generation, and impact of resource consumption on
operating costs of hotels are summarized below:
Of the total electricity consumption, air conditioning consumes the highest (around 48 percent) followed by kitchen equipment with
18 percent, and lighting with 13 percent. On the thermal energy side, the major energy (diesel, furnace oil, LPG) consumers are
laundry and water heating with a combined share of 72 percent. The survey showed that the kitchen consumes around 22 percent.
The analysis of water consumption across the surveyed hotels indicates that total water consumption across 23 hotels was 1,610,000
m3. Of this, ground water meets 58 percent of requirement, 40 percent through municipal supply and the remaining two percent
through other third parties. Major water usage in hotels occurs in guestrooms (42 percent), laundry (18 percent), kitchen (21 percent)
and outdoor activities (19 percent) like gardens and swimming pools.
The surveyed hotels generated around 3,097 tonnes of solid waste per annum. Solid waste generation in hotels is primarily from the
kitchen, guest rooms and gardens. Waste generated from food is the major contributor to total solid waste followed by garden waste
(12 percent). Others include plastic, glass, and metal (five percent) and paper and cardboard with four percent. Wastewater
generation in the surveyed 23 hotels was around 1,183,000 m3 per annum.
Resources such as energy, water, and waste management together are a significant portion of the total operating costs of hotels. On an
average, these constitute 20 to 30 percent of the total operating costs of a hotel.
The primary objective of the study was to assess resource efficiency improvement potential in three to five star hotels. The analysis of the
data collected indicated that significant resource efficiency potential is available. About 10.5 percent of the electricity, 25 percent of diesel,
27 percent of furnace oil, five percent of LPG, and eight percent of water can be saved. The major energy saving potential areas are air
conditioning, hot water, laundry, and lighting. Major water saving potential also exists in fixtures like cisterns, taps and showers of toilets
and bathrooms. Further, wet waste from kitchens can be used to generate biogas and other waste can be recycled after proper segregation.
The estimated investment required to implement all identified resource efficiency measures in the 23 surveyed hotels is $4.76 million.
Extrapolating this for all 44 hotels in the country projects a cost of $9.72 million. Implementation of all identified resource efficiency
measures can also reduce carbon dioxide emissions by around 13 percent or 12,152 tonnes of CO2 for all 44 three to five star hotels in Sri
Lanka.
An incremental investment of $4.21 million is needed to make all three to five star rooms currently under construction resource efficient.
An additional investment of $6.09 million is required to implement hotel level initiatives in the 57 three to five star hotels under
construction. The total incremental investment required to implement all listed resource efficiency initiatives across all 57 three to five star
hotels under construction is estimated at $10.3 million.
International Finance Corporation Sri Lanka 15th Floor, DHPL Building 42 Nawam Mawatha Colombo 02 Sri Lanka
Tel: +94 11 5400 100 Fax: +94 11 4795 017
www.ifc.org