identifying new migrant populations in uk cities david owen and audrey lenoël
Post on 20-Dec-2015
218 views
TRANSCRIPT

Identifying new migrant populations in UK cities
David Owen and Audrey Lenoël

Background and aims of paper
• International migration is now a major influence on population change in the UK. The population composition of particular localities is changing substantially due to rapid economic or asylum migration.
• Local authorities and economic development agencies (amongst others) need up-to-date information on the ‘new incomer’ populations in order to plan the provision of services and ensure their delivery reflects the composition of the population.
• However, existing official statistics are poor at identifying short-term population change and change in the composition of the population: an “information vacuum”.
• This paper presents some findings from local case studies in:
(1)Birmingham, West Midlands - estimating emerging refugee populations; and
(2) Lincolnshire - estimating the new migrant workforce
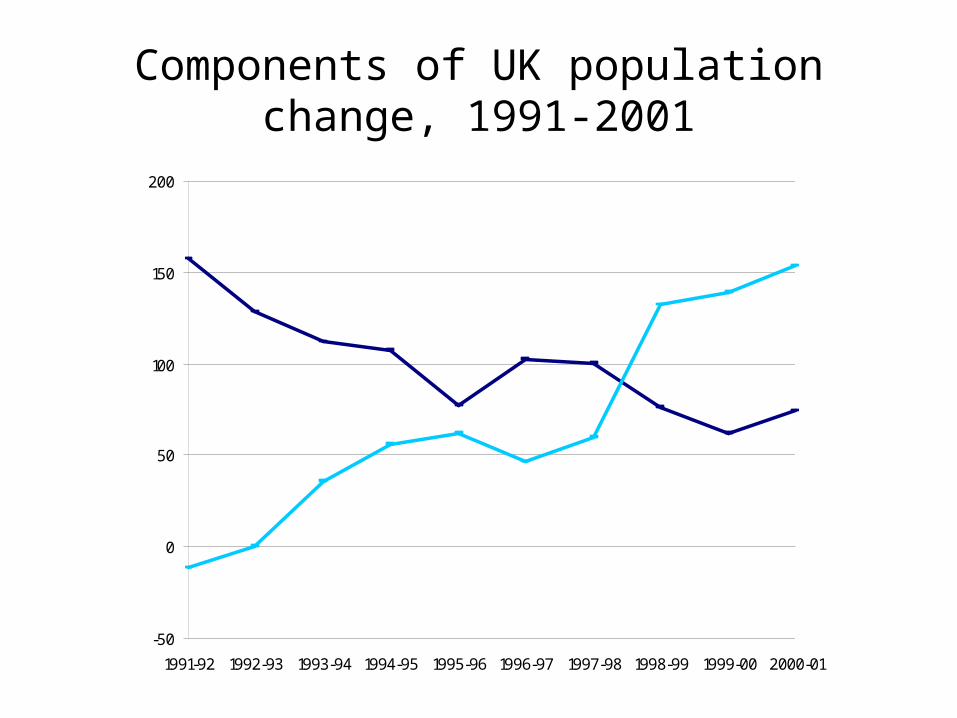
Components of UK population change, 1991-2001
-50
0
50
100
150
200
1991-92 1992-93 1993-94 1994-95 1995-96 1996-97 1997-98 1998-99 1999-00 2000-01
Natural Increase
Net migration & other changes

Net immigration to the UK by world region, 1995-2004
- 50.0
+ 0.0
+ 50.0
+ 100.0
+ 150.0
+ 200.0
+ 250.0
1995 1996 1997 1998 1999 2000 2001 2002 2003 2004
Other
New Commonwealth
Old Commonwealth
EU

Existing data base
• Census - migrants, ethnic group, country of birth; BUT pre 2004 expansion of EU
• LFS and APS - demographic characteristics and socio-economic variables
• These sources do NOT record information on immigration status
• Statistics produced by Home Office National Asylum Support Service (NASS)
• Mid Year Estimates of population
• ONS Vital Statistics

CASE STUDY 1:Asylum seekers in the West Midlands
by nationality (from WMCARS)
Iraqi14%
Other African12%
Iranian11%
Afghani9%
Somali8%
Congo DRC7%
Pakistani7%
Kosovan4%
Zimbabwean4%
Sudanese3%
Eritrean2%
European2%
Other Middle East3%
Romanian3%
Turkish3%
Other Asian3%
Former USSR2%
Former Yugoslavian3% S. American
1%

NASS placements of asylum seekersin Birmingham
Concentrated in areas of:• relative deprivation• high percentages of
population from ethnic minorities

Potential data sources on asylum seekers and ethnic minorities from service providers
• Housing providers - social housing providers collect information on their tenancies; limited local authority information
• Applications for Housing Benefit and Council Tax benefit• Local Education Authorities - Pupil Level Annual
Schools’ Census (PLASC)• Jobcentre Plus and the Department for Work and
Pensions• National Health Service - Hospital Episode Statistics;
introduction of ethnic monitoring to GP registrations

Estimates of refugees in the West Midlands(from WMCARS)
• NASS clients dispersed to the region and granted leave to remain = 18,780
• Home Office estimates that 25% of all refugees from other regions enter the West Midlands, and a tiny percentage leave = 39,073
• Adjustment to include dependants in the above at 15% of total = 8,678
• Estimates of refugees in the UK before the dispersal policy began who are in the West Midlands = 10,000 to 15,000
• Accuracy of estimates depends on validity of assumptions - the smaller the geographical area, the less valid assumptions are likely to be

CASE STUDY 2:Economic migrants in Lincolnshire
• Rural area - substantial number of low skill jobs in agriculture and food processing, unattractive to local residents
• Key data sources:
(1) National Insurance numbers (NINOs) - but confidentiality constraints mean limited disaggregation available at local level
(2) Worker Registration Scheme (WRS) for A8 nationals - disaggregated by country of origin, industry, occupation, postcode district

National Insurance registrationsby country of origin
0.0
5.0
10.0
15.0
20.0
25.0
30.0
35.0
40.0
45.0
Irelan
d
othe
r EU15
Acces
sion
10
New C
omm
onwea
lth
Old
Comm
onwea
lth
W E
urop
e
E Eur
ope/
Balka
ns/T
urke
y
Midd
le Eas
t
Oth
er
UK
Lincolnshire & Rutland
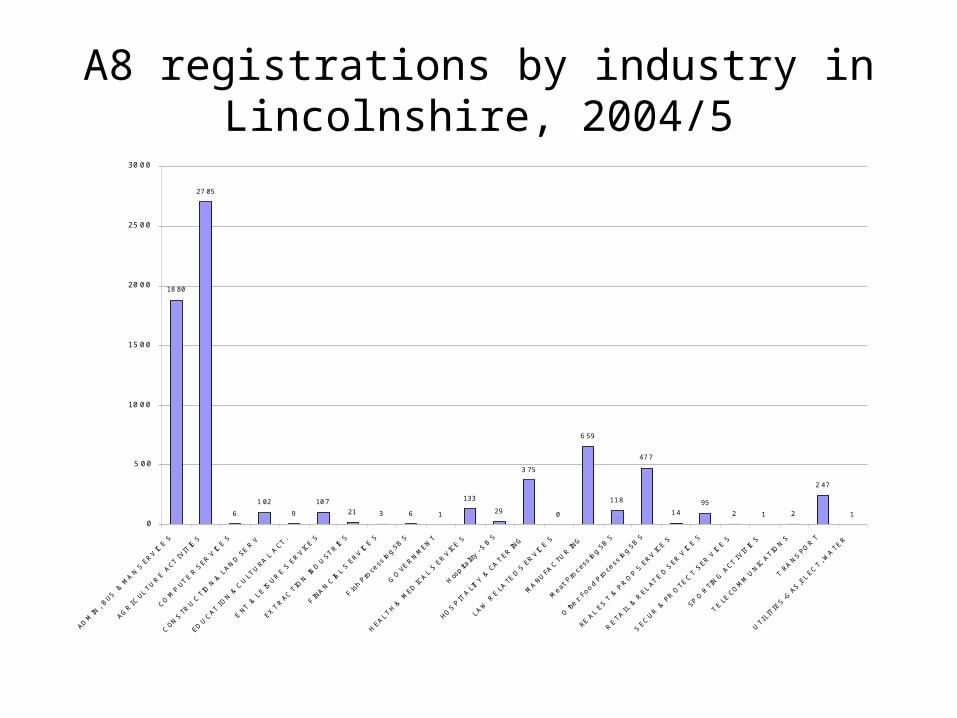
A8 registrations by industry in Lincolnshire, 2004/5
18 80
27 05
6
1 02
9
10721 3 6 1
133
29
3 75
0
6 59
118
477
1495
2 1 2
2 47
10
5 00
10 00
15 00
20 00
25 00
30 00
ADM
IN, B
US &
MA
N SERV
ICE
S
AGR
ICULTU
RE A
CTIV
ITIE
S
COM
PUTE
R SER
VIC
ES
CON
STR
UC
TION
& L
AND
SE
RV
EDU
CATIO
N & C
ULT
URA
L A
CT.
ENT
& L
EIS
URE S
ERVIC
ES
EXTR
ACTIO
N IN
DU
STRIE
S
FINA
NC
IAL
SERV
ICE
S
Fish
Proce
ssin
g SB
S
GO
VERN
MEN
T
HEALTH &
MED
ICA
L S
ERVIC
ES
Hos
p italit
y - S
BS
HOS
PITA
LITY &
CA
TERIN
G
LAW R
ELA
TED S
ERVIC
ES
MA
NUFA
CTU
RIN
G
Meat
Pro
cess in
g SB
S
Othe
r Fo
od Pro
cess
ing
SBS
REAL
EST &
PR
OP S
ERVIC
ES
RETA
IL &
RELATE
D SER
VIC
ES
SEC
UR &
PR
OTEC
T SER
VIC
ES
SPO
RTI
NG
ACT
IVIT
IES
TELE
COM
MU
NICATIO
NS
TRA
NSPO
RT
UTIL
ITIE
S-G
AS,ELEC
T, WA
TER

Conclusions
• Main sources of statistical data are not keeping pace with the changing nature of international migration streams to the UK and their impacts on local areas
• Administrative data can provide some useful insights
• Available data provide only a partial picture of the new migrant population - especially at local level
• There is a need for more detailed, timely and flexible information