identifying medical cost drivers in workers’ compensation: tools available for public officials
TRANSCRIPT

Identifying Medical Cost Drivers in Workers’
Compensation:
Tools Available for Public Officials
Identifying Medical Cost Drivers in Workers’
Compensation:
Tools Available for Public Officials

Medical Cost per Claim AcceleratesMedical Cost per Claim Accelerates
0%
5%
10%
15%
CT PA MA NC FL IN WI TN LA CA TX IL
Average Medical Payments per Claim at 12 Months' Experience, Unadjusted
Ann
ual a
vera
ge
perc
enta
ge c
hang
e
1996-1999 1999-2001

Today’s PresentationToday’s Presentation
New tools have been developed to New tools have been developed to identify cost drivers in workers’ identify cost drivers in workers’ compensationcompensation
Cost drivers vary from state to stateCost drivers vary from state to stateIllustrative findings from soon-to-be-Illustrative findings from soon-to-be-
published worker outcomes studypublished worker outcomes studyWhat is the Workers Compensation What is the Workers Compensation
Research Institute (WCRI)?Research Institute (WCRI)?

New Tools for PolicymakersNew Tools for Policymakers
Benchmarks with meaningful Benchmarks with meaningful interstate comparisons of …interstate comparisons of …Medical costsMedical costsMedical utilizationMedical utilizationKey worker outcomesKey worker outcomesOther aspects of the Other aspects of the
performance of workers’ performance of workers’ compensation systemscompensation systems

WCRI Benchmarking MeasuresWCRI Benchmarking MeasuresBenefit amountsBenefit amountsTimelinessTimelinessMedical costsMedical costsDisability durationDisability durationDefense attorney Defense attorney
involvementinvolvementVocational rehab Vocational rehab
useuseBenefit delivery Benefit delivery
expensesexpenses
Medical costs by Medical costs by service/provider service/provider typetype
Medical pricesMedical pricesUtilization of Utilization of
servicesservicesUtilization by Utilization by
providerprovider

Core Outcomes MeasuresCore Outcomes Measures
Recovery of health and Recovery of health and functioningfunctioning
Return-to-workReturn-to-workReturn to work or not?Return to work or not?Speed of initial return to workSpeed of initial return to workSustainability of return to workSustainability of return to work
Satisfaction with health careSatisfaction with health careAccess to health careAccess to health care

Medical Cost Drivers:Examples From Three StatesMedical Cost Drivers:Examples From Three States
Florida – hospital pricesFlorida – hospital pricesTexas – chiropractic price and Texas – chiropractic price and
utilizationutilizationIllinois – hospital and non-Illinois – hospital and non-
hospital priceshospital prices

Why Such Variation Exists?Why Such Variation Exists?
Medical training and practice Medical training and practice patterns differ geographically patterns differ geographically (Dartmouth Atlas)(Dartmouth Atlas)
Reimbursement levels create Reimbursement levels create incentives to deliver certain incentives to deliver certain servicesservices
Utilization requirements also differUtilization requirements also differNetworks also help manage costs Networks also help manage costs
– both price and utilization – both price and utilization

Medical Cost Findings – FloridaMedical Cost Findings – Florida
Florida’s medical costs and utilization Florida’s medical costs and utilization are typical of 8 large statesare typical of 8 large states
Lowest fee schedule levels among 40 Lowest fee schedule levels among 40 statesstates
Lowest average prices for many non-Lowest average prices for many non-hospital services hospital services
But, highest average prices for But, highest average prices for hospitalshospitals

Typical Average Medical Payment per ClaimTypical Average Medical Payment per Claim
$0
$2,000
$4,000
$6,000
$8,000
MA CT PA WI CA NC FL GA IN IL TN TX
1999/ 2000 Claims with > 7 Days Lost TimeInjury/ Industry Mix Adjusted
Paym
ent
per
Clai
m

Florida’s WC Fee Schedule Below FL Medicare (-17%) Florida’s WC Fee Schedule Below FL Medicare (-17%)
-25%
0%
25%
50%
75%
100%
125%
% D
iffer
ent
from
Med
icar
e
151%202%
FLMA
CAMI
PA MN
CTNY
2001 Fee Schedule
2001 Fee Schedule

FL Fee Schedule Lower than FL Medicare for all but Surgery
FL Fee Schedule Lower than FL Medicare for all but Surgery
-40%
-30%
-20%
-10%
0%
10%
20%
30%
E&M Phys Med Gen Med Radiology Surgery% H
ighe
r/Lo
wer
tha
n M
edic
are
2001 Fee Schedules

Average Prices are Lower for Many Non-Hospital Services
Average Prices are Lower for Many Non-Hospital Services
Average Price/ServiceAverage Price/Service
FLFL 12-state12-state DifferenceDifference
MedianMedian
Office Visits Office Visits $30 $30 $48 $48 38%38%
Major SurgeryMajor Surgery $971$971 $1,044$1,044 7% 7%
Physical Medicine $20Physical Medicine $20 $30 $30 33%33%
Minor Radiology $29 Minor Radiology $29 $58 $58 50%50%
Major RadiologyMajor Radiology $378$378 $467 $467 19 %19 %
1999/2000 Claims with > 7 Days Lost Time 1999/2000 Claims with > 7 Days Lost Time

FL’s Average Price for Hospital Facility Services Among Higher States
FL’s Average Price for Hospital Facility Services Among Higher States
$0
$200
$400
$600
$800
$1,000
$1,200
PA IL WI IN TN CA TX NC MA FL CT GA
1999/ 2000 Claims with > 7 Days Lost Time (Injury/ Industry Mix Adjusted)
Pri
ce p
er S
ervi
ce

FL’s Average Prices for Hospital Physical Med Among Higher States
FL’s Average Prices for Hospital Physical Med Among Higher States
$0$20$40$60$80
$100
CA MA CT PA GA TN FL IN WI TX IL
1999/ 2000 Claims with > 7 Days Lost Time (Injury/ Industry Mix Adjusted)
Pric
e pe
r Se
rvic
e

FL’s Average Price for Hospital Lab Tests Highest of 12 States
FL’s Average Price for Hospital Lab Tests Highest of 12 States
$0
$20
$40
$60
$80
PA CA MA IN IL GA TN CT NC TX WI FL
1999/ 2000 Claims with > 7 Days Lost Time (Injury/ Industry Mix Adjusted)
Pri
ce p
er S
ervi
ce

Average Prices for Hospital Major Radiology Among Higher States
Average Prices for Hospital Major Radiology Among Higher States
$0
$200
$400
$600
$800
$1,000
MA CA PA TX GA CT NC TN FL IL WI IN
1999/ 2000 Claims with > 7 Days Lost Time (Injury/ Industry Mix Adjusted)
Pri
ce p
er S
ervi
ce

FL’s Average Prices for Hospital Minor Radiology Highest of 12 States
FL’s Average Prices for Hospital Minor Radiology Highest of 12 States
$0
$50
$100
$150
$200
CA MA PA GA IN TX NC TN WI IL CT FL
1999/ 2000 Claims with > 7 Days Lost Time (Injury/ Industry Mix Adjusted)
Pric
e pe
r Ser
vice

Major Findings - TexasMajor Findings - Texas TX’s medical costs increased 14% TX’s medical costs increased 14%
over 2 year periodover 2 year period Chiropractic care Chiropractic care drives cost drives cost
increasesincreasesMore claims with chiropractic careMore claims with chiropractic careMore visits when seeing a More visits when seeing a
chiropractorchiropractorHigher prices received for servicesHigher prices received for servicesHigher revenues/claim for Higher revenues/claim for
chiropractorschiropractors

Average Medical Cost per ClaimAverage Medical Cost per Claim
0
2,000
4,000
6,000
8,000M
A CT PA WI
CA NC FL GA IN IL TN TX
1999/ 2000 Claims with > 7 Days Lost TimeInjury/ Industry Mix Adjusted
$/C
laim
$/C
laim

Why Are Medical Costs Higher in Texas Than Most States
Why Are Medical Costs Higher in Texas Than Most States
TexasTexas Median DifferenceMedian Difference
StateState
Payment/claim $8,048Payment/claim $8,048 $5,786$5,786 + 39% + 39%
Visits/claim Visits/claim 30 30 17 17 + 71% + 71%
Services/visitServices/visit 3.7 3.7 3.2 3.2 + 15% + 15%
Price/service Price/service $78 $78 $101 $101 - 23% - 23%
1999/2000 Claims with > 7 Days Lost Time1999/2000 Claims with > 7 Days Lost Time

Higher Utilization and Prices By Chiropractors
Higher Utilization and Prices By Chiropractors
ChiropractorChiropractor
TexasTexas MedianMedian DifferenceDifference
Payment/claim $4,995Payment/claim $4,995 $1079$1079 + 363% + 363%
Visits/claim Visits/claim 33.4 33.4 16.6 16.6 + 101% + 101%
Services/visitServices/visit 3.7 3.7 2.8 2.8 + 33% + 33%
Price/service Price/service $41 $41 $28 $28 + 46%+ 46%
1999/2000 Claims with > 7 Days Lost Time1999/2000 Claims with > 7 Days Lost Time1999/2000 Claims with > 7 Days Lost Time1999/2000 Claims with > 7 Days Lost Time

Texas Chiropractors Involved in More CasesTexas Chiropractors Involved in More Cases
0%
5%
10%
15%
1999/ 2000 Claims with > 7 Days Lost Time
% o
f C
ases
% o
f C
ases

Texas Chiropractors Receive A Higher Share of Total Medical Payments
Texas Chiropractors Receive A Higher Share of Total Medical Payments
0%
5%
10%
15%
20%
25%
1999/ 2000 Claims with > 7 Days Lost TimeInjury/ Industry Mix Adjusted
% o
f M
ed
ical P
aym
en
ts%
of
Med
ical P
aym
en
ts
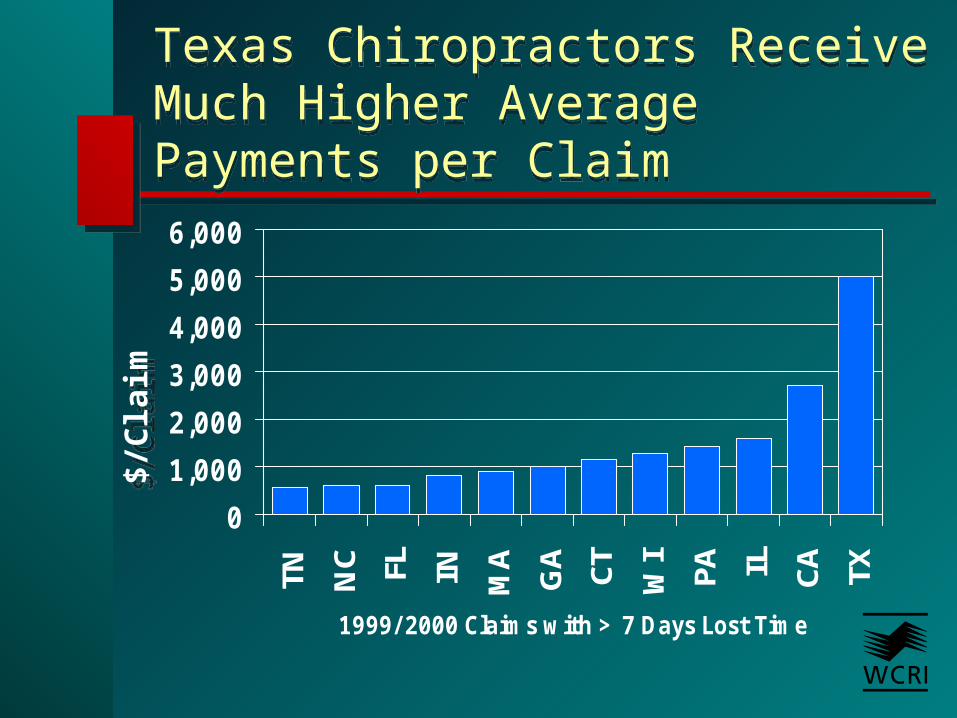
Texas Chiropractors Receive Much Higher Average Payments per Claim
Texas Chiropractors Receive Much Higher Average Payments per Claim
0
1,000
2,000
3,000
4,000
5,000
6,000
TN NC FL IN MA
GA CT WI
PA IL CA TX
1999/ 2000 Claims with > 7 Days Lost Time
$/C
laim
$/C
laim

Texas Chiropractors Treat With More Visits per ClaimTexas Chiropractors Treat With More Visits per Claim
0
10
20
30
40
1999/ 2000 Claims with > 7 Days Lost Time
Vis
its/C
laim
Vis
its/C
laim

Average Price per Service by Chiropractors is Highest in TX
Average Price per Service by Chiropractors is Highest in TX
$0
$10
$20
$30
$40FL MA
NC CT
PA
CA IN GA IL TN WI
TX
1999/ 2000 Claims with > 7 Days Lost Time
Pri
ce p
er S
ervi
ce

IL: Average Medical Payment per Claim is 3rd HighestIL: Average Medical Payment per Claim is 3rd Highest
$0
$2,000
$4,000
$6,000
$8,000
MA CT PA WI CA NC FL GA IN IL* TN TX
1999/ 2000 Claims with > 7 Days Lost TimeInjury/ Industry Mix Adjusted
Pay
men
t pe
r Cla
im

Findings for IllinoisFindings for IllinoisHigher prices for many non-hospital and Higher prices for many non-hospital and
hospital outpatient services hospital outpatient services Average medical payments per claim Average medical payments per claim
increased 11% from 1998/99 to 1999/2000increased 11% from 1998/99 to 1999/2000Increases for all providers–but greatest for Increases for all providers–but greatest for
hospitals due to outpatient prices and hospitals due to outpatient prices and utilizationutilization

Average Prices Higher for Non-Hospital ServicesAverage Prices Higher for Non-Hospital Services
ILIL 12-State 12-State % Diff % Diff MedianMedian
Office visitsOffice visits $58$58 $48 $48 +21%+21%
Physical medicinePhysical medicine $37$37 $30 $30 +23%+23%
Major surgeryMajor surgery $1,302 $1,044$1,302 $1,044+25%+25%
Minor radiologyMinor radiology $79$79 $58 $58 +36%+36%
Major radiologyMajor radiology $467$467 $467 $467 samesame
1999/2000 Claims with > 7 Days Lost Time1999/2000 Claims with > 7 Days Lost Time(Injury/Industry Mix Adjusted)(Injury/Industry Mix Adjusted)

Average Prices Higher for Hospital “Ancillary Services”
Average Prices Higher for Hospital “Ancillary Services”
ILIL 12-State 12-State % Diff % Diff MedianMedian
Hospital facilityHospital facility $617$617 $878 $878 -30%-30%
Physical medicine $93Physical medicine $93 $76$76+22%+22%
Minor radiologyMinor radiology $144$144 $124$124 +16%+16%
Major radiologyMajor radiology $874$874 $765$765 +14%+14%
1999/2000 Claims with > 7 Days Lost Time1999/2000 Claims with > 7 Days Lost Time(Injury/Industry Mix Adjusted)(Injury/Industry Mix Adjusted)
Preliminary Results

Largest Cost Increases for HospitalsLargest Cost Increases for Hospitals
0
5
10
15
20
MD/ DO Chiropractor PT/ OT Hospital
Avg
Med
ical
Pay
men
t %
Cha
nge
1998
/199
9-19
99/2
000

IL’s Average Medical Payment Per Claim to Hospitals Highest of 12 States
IL’s Average Medical Payment Per Claim to Hospitals Highest of 12 States
$0$500
$1,000$1,500$2,000$2,500$3,000$3,500$4,000$4,500$5,000
MA CT PA CA NC IN WI GA TX FL TN IL*
Paym
ents
per
Cla
im
1999/2000 Claims with > 7 Days Lost Time
(Injury/Industry Mix Adjusted)* Balance billing

Today’s PresentationToday’s Presentation
New tools have been developed to New tools have been developed to identify cost drivers in workers’ identify cost drivers in workers’ compensationcompensation
Cost drivers vary from state to stateCost drivers vary from state to stateIllustrative findings from soon-to-be-Illustrative findings from soon-to-be-
published worker outcomes studypublished worker outcomes studyWhat is the Workers Compensation What is the Workers Compensation
Research Institute (WCRI)?Research Institute (WCRI)?

Higher Medical Cost per Claim in California and TexasHigher Medical Cost per Claim in California and Texas
$0
$2,000
$4,000
$6,000
$8,000
$10,000
$12,000
$14,000
Medic
al Paym
ent
per
Cla
im >
7 d
ays
lost
ti
me
MA CT WI PA IN NC IL TN FL CA LA TX
1999 injuries with experience through 6/2002
1999 injuries with experience through 6/2002

About WCRIAbout WCRI
Independent, not-for-profit Independent, not-for-profit research organization, research organization, established 1983established 1983
Has diverse membership Has diverse membership supportsupport
Studies are peer-reviewedStudies are peer-reviewedResource for public officials and Resource for public officials and
stakeholdersstakeholders

More more information and detailed benchmarks …More more information and detailed benchmarks …
wcrinet.orgwcrinet.org