identifying clean, affordable and renewable cooking ...840772/fulltext01.pdf · contact person...
TRANSCRIPT

Bachelor of Science Thesis
KTH School of Industrial Engineering and Management
Energy Technology EGI-2015
SE-100 44 STOCKHOLM
Identifying clean, affordable and renewable
cooking solutions for local people on Inhaca
Island in Mozambique
Erica Dragon
Johanna Taflin

-I-
Keywords: Clean cooking, Mozambique, Inhaca Island, deforestation, renewable energy

-II-
Bachelor of Science Thesis EGI-2015
Identifying the affordable and sustainable
sources of energy for local people on Inhaca
Island in Mozambique
Erica Dragon
Johanna Taflin
Approved
Examiner
Catharina Erlich
Supervisor
Catharina Erlich
Commissioner
Contact person
Gabriel Albano

-III-
This study has been carried out within the framework of the Minor Field Studies Scholarship
Programme, MFS, which is funded by the Swedish International Development Cooperation Agency,
Sida.
The MFS Scholarship Programme offers Swedish university students an opportunity to carry out two
months’ field work, usually the student’s final degree project, in a country in Africa, Asia or Latin
America. The results of the work are presented in an MFS report which is also the student’s Bachelor
or Master of Science Thesis. Minor Field Studies are primarily conducted within subject areas of
importance from a development perspective and in a country where Swedish international
cooperation is ongoing.
The main purpose of the MFS Programme is to enhance Swedish university students’ knowledge and
understanding of these countries and their problems and opportunities. MFS should provide the
student with initial experience of conditions in such a country. The overall goals are to widen the
Swedish human resources cadre for engagement in international development cooperation as well as
to promote scientific exchange between universities, research institutes and similar authorities as well
as NGOs in developing countries and in Sweden.
The International Relations Office at KTH the Royal Institute of Technology, Stockholm, Sweden,
administers the MFS Programme within engineering and applied natural sciences.
Erika Svensson
Programme Officer
MFS Programme, KTH International Relations Office

-IV-
Abstract
Inhaca Island is situated outside Maputo in Mozambique and is one of the globally important
areas for forest conservation. The forest provides a number of societal, environmental and
economic goods. Electricity and LPG are available on the island but is for most people too
expensive to use for the household’s most energy intensive activities, such as cooking. Instead, all
of the 25 interviewed households use firewood for all or some of their cooking activities. The use
of firewood on the island is unsustainable and is causing deforestation. Also, the combustion of
biomass inside houses causes indoor air pollution, which leads to an increased risk of infection to
those who are exposed. To significantly reduce or end the use of firewood for cooking within a
near future three renewable alternative cooking methods have been identified: solar cookers,
biogas digesters and wood stoves. These solutions do not require new logistical solutions or
transport of fuel to or on Inhaca Island, which is important since roads and transport possibilities
are poor on the island.
Households with no fuel cost have little money to spend on a new solution and without help
from outside investors or the government, alternatives are slim. An improved cook stove or a
wood stove in the lower price range might be possible for these families to purchase and the
main argument is a potential time save and improved health.
With a fuel expense for the household of 50 USD per year, panel cookers are the best financial
option. Wood stoves could also be a good alternative in spite of the higher financial risk. A wood
stove would slow down deforestation more than a panel cooker would.
If the household spends 200 USD annually on fuel for cooking, and has enough animals and
organic waste to produce a sufficient amount of biogas, a fixed dome biogas digester is the best
alternative. A fixed dome biogas digesters require a very large initial investment and might
therefor not be possible to implement without part time payments, subsidies or loans. Float drum
digester is also an alternative and is less expensive than the fixed dome digester. Other good
alternatives are parabolic solar cookers or wood stoves and here the choice between comfort and
financial gain will decide which solution is most suitable for the family.
For a household spending 500 USD on fuel for cooking annually, the conclusion is the same as
for the group spending 200 USD per year with the addition of a balloon digester. All digesters are
still expensive options and if the family is already spending 500 USD on fuel it is because they
already use some comfortable fuels such as gas or electricity. It is therefore unlikely that they
would surrender some of this comfort to have a solar cooker, requiring more time, cannot smoke
and is not compatible with all the current equipment. A wood stove would therefore probably be
preferred over a solar cooker.

-V-
Sammanfattning
Inhaca är en ö utanför Mocambiques södra kust och dess unika natur erbjuder socialt,
miljömässigt och ekonomiskt viktiga värden som bör bevaras. Det finns tillgång till elektricitet
och gas på ön men det är för de flesta hushållen för dyrt för att använda till de mest
energikrävande aktiviteterna så som matlagning. Istället använder alla de 25 intervjuade hushållen
i studien ved till all eller delar av sin matlagning. Användning av ved från hushållen leder till att
skogen på ön minskar och eftersom veden eldas i små och dåligt ventilerade hus och maten lagas
över öppen eld, leder den även till ökad risk för infektioner för de som lagar maten. För att
avsevärt minska eller helt stoppa användningen av trä från skogen vid matlagning har tre
alternativa matlagningslösningar identifierats; sol-spisar, biogasenheter och vedspisar. Dessa
lösningar kommer inte att kräva nya logistiska lösningar eller skapa ett ökat transportbehov för
bränsle till eller på ön. Detta är viktigt eftersom öns vägar är dåliga och transportmöjligheter till
och från ön är begränsade.
Hushåll utan ekonomiska möjligheter till utgifter för bränsle idag har inte råd att spendera pengar
på en ny matlagningslösning och utan finansiell hjälp utifrån är alternativen få. En vedspis i en
lägre prisklass kan vara möjlig för familjerna att köpa och det huvudsakliga argumentet är den
potentiella tidsbesparingen och den förbättrade hälsan, givet att spisen har en skorsten.
Med en årlig bränslekostnad på 50 USD kommer en solpanelspis vara det finansiellt bästa
alternativet, men sett till sociala faktorer så framstår vedspisar som ett bra alternativ trots den
högre finansiella risken. Med en vedspis minskar dessutom användningen av ved mer än om en
sol-spis används.
Om hushållen spenderar 200 USD per år på bränsle för matlagning, och dessutom har mängden
djur och annat organiskt avfall för att producera tillräckligt med biogas, så är en fast biogasenhet
ett alternativ tillsammans med en floating biogasenhet. Eftersom dessa enheter kräver en mycket
stor grundinvestering hjälper möjligheter till delbetalningar, bidrag eller lån för att investeringen
ska vara genomförbar. Andra bra alternativ är parabol-formade sol-spisar eller vedspisar. Detta
eftersom vedspisar är mer kompatibla med hushållens nuvarande utrustning och metoder och
dessutom sannolikt kräver kortare tid för tillagning av mat än en sol-spis, kommer valet att stå
mellan den mer finansiellt motiverade paraboliska sol-spisen och en vedspis som är mer socialt
motiverad på grund av att den liknar dagens lösning.
För hushåll som spenderar 500 USD per år på bränsle är slutsatsen densamma som för hushållen
som spenderar 200 USD med tillägget av en ballong biogasenhet. En biogasenhet måste
fortfarande ses som en mycket stor grundinvestering för denna grupp och det krävs även för
dessa hushåll möjlighet till delbetalningar, bidrag eller lån för att investeringen ska vara
genomförbar. Eftersom familjen redan spenderar 500 USD på bränsle för matlagning kan det
antas att detta beror på en högre grad av användning av mer bekväma bränslen så som
elektricitet. Det är därför mer osannolikt att denna grupp är villig att minska sin bekvämlighet
och välja en sol-spis. Vid val av ett billigare alternativ än biogas kommer därför någon av
vedspisarna vara de troligaste alternativen för hushåll i denna grupp, men många alternativ är
möjliga.

-VI-
Acknowledgements
First of all we would like to thank Sida together with KTH for giving us the scholarship and
thereby making the execution of this bachelor’s thesis possible. We would also like to thank Mr.
Gabriel Albano and the Eduardo Mondlane University for receiving us and guiding us in this project
together with our supervisor in Sweden, Catharina Erlich. Illario Timba, our guide and translator,
has been of significant importance providing us with his knowledge of the island and full
dedication. Without him this project would not have been feasible.
Last but not least we would like to thank the staff on Estacão de Biologia Maritima da Inhaca and the
people we interviewed on Inhaca Island for their kindness and understanding and for sharing
information about their lives with us.
Erica Dragon and Johanna Taflin, 2015-05-31

-VII-
Table of Contents
Abstract ....................................................................................................................................................... IV
Sammanfattning ........................................................................................................................................... V
Acknowledgements ................................................................................................................................... VI
Table of Figures ......................................................................................................................................... IX
Table of Tables .......................................................................................................................................... XI
Acronyms................................................................................................................................................... XII
Nomenclature ......................................................................................................................................... XIII
1 Introduction .......................................................................................................................................... 1
1.1 Problem Formulation .................................................................................................................. 4
1.2 Aim ................................................................................................................................................ 4
2 Mozambique ......................................................................................................................................... 5
2.1 Mozambican history .................................................................................................................... 5
2.2 Nature of Inhaca Island .............................................................................................................. 6
2.2.1 Weather and insolation on Inhaca Island....................................................................................... 7
2.3 Society on Inhaca Island ............................................................................................................. 9
2.4 Energy on Inhaca Island ........................................................................................................... 10
2.4.1 Electricity on Inhaca Island ............................................................................................................10
2.4.2 Biomass ..............................................................................................................................................11
3 Cooking methods ............................................................................................................................... 14
3.1 Three stone fire .......................................................................................................................... 14
3.2 Adoption process of a new cooking solution ........................................................................ 14
3.3 Alternative renewable cooking methods ................................................................................ 15
3.3.1 Solar cooking ....................................................................................................................................15
3.3.2 Biogas .................................................................................................................................................19
3.3.3 Wood stoves .....................................................................................................................................22
4 Methodology ....................................................................................................................................... 25
4.1 Minor Field Study ...................................................................................................................... 25
4.2 Methodology of results and discussion .................................................................................. 25
4.3 Boundaries of the study ............................................................................................................ 28
4.3.1 Questionnaire ...................................................................................................................................28
4.4 Equations .................................................................................................................................... 30
5 Results and discussion ....................................................................................................................... 32
5.1 Current energy use, social patterns and attitudes .................................................................. 32
5.2 Social evaluation ......................................................................................................................... 37

-VIII-
5.2.1 Solar Cookers ....................................................................................................................................37
5.2.2 Biogas .................................................................................................................................................38
5.2.3 Wood stoves .....................................................................................................................................39
5.2.4 Social ranking of the cooking solutions .......................................................................................40
5.3 Financial evaluation ................................................................................................................... 41
5.3.1 Households with an annual fuel expense of 50 USD ................................................................43
5.3.2 Households with an annual fuel expense of 200 USD ..............................................................43
5.3.3 Households with an annual fuel expense of 500 USD ..............................................................44
5.4 Sensitivity analysis ...................................................................................................................... 46
5.5 Final discussion .......................................................................................................................... 48
5.5.1 Households with no fuel cost ........................................................................................................49
5.5.2 Households with an annual fuel expense of 50 USD ................................................................49
5.5.3 Households with an annual fuel expense of 200 USD ..............................................................49
5.5.4 Households with an annual fuel expense of 500 USD ..............................................................50
6 Conclusion .......................................................................................................................................... 50
7 Future work......................................................................................................................................... 51
References ................................................................................................................................................... 52
Appendix A: Questionnaire ...................................................................................................................... 61
Appendix B: Animals and agricultural waste in households ................................................................ 64
Appendix C: Exchange rates .................................................................................................................... 65

-IX-
Table of Figures
Figure 1. Electricity use in households in Botswana, Ghana, Senegal and Honduras.
Figure 2. Energy ladder.
Figure 3. Map of Mozambique.
Figure 4. Map of Inhaca Island
Figure 5. Roads on Inhaca Island.
Figure 6. A map which describes the insolation with different colours
Figure 7. Monthly average rainfall at Inhaca Island
Figure 8. Population distribution on Inhaca Island
Figure 9. Composition of a biomass fuel.
Figure 10. Correlation between moisture rate and LHV
Figure 11. Three Stone Fire (TSF)
Figure 12. A Box Cooker with a reflector and a glass cover to keep heat from escaping the pot
Figure 13. A typical panel solar cooker with a plastic bag concealing the pot in order to increase efficiency
Figure 14. Parabolic Cooker
Figure 15. Fixed dome plant
Figure 16. Floating drum digester
Figure 17. Tube or balloon digester
Figure 18. Improved cook stove
Figure 19. A manufactured rocket stove with a tall combustion chamber and a small fuel magazine.
Figure 20. Different stages of the project
Figure 21. Sustainability model
Figure 22. Model regarding social sustainability
Figure 23. How many sources of energy that are used for cooking in the household
Figure 24. Relationship between number of fuels used in the household and the household’s income level.

-X-
Figure 25. Answers to the question “Do you see a problem with the current use of firewood on Inhaca and the
deforestation?”
Figure 26. Sensitivity analysis of the payback time depending on the utilization of the solar cooker for a
household with an annual fuel expense of 50 USD

-XI-
Table of Tables
Table 1. Benefits of Cleaner Cooking
Table 2. Monthly average rainfall at Inhaca Island.
Table 3. Electricity tariffs on Inhaca Island
Table 4. Correlation between moisture rate and LHV.
Table 5. LHV of some types of agricultural waste on Inhaca.
Table 6. Data for different models of solar cookers. These are the prices that are offered in different stores online.
Table 7. Biogas production from selected substrates
Table 8. A summary of the data presented in the text.
Table 9. The results from a field study in rural Uganda and Tanzania.
Table 10. Fuels sold on Inhaca Island that are used for cooking
Table 11. The number of households using different types of fuels
Table 12. Household financials
Table 13. Average cooking times and frequencies for different common dishes on Inhaca Island
Table 14. Social ranking of the cooking solutions
Table 15. Payback time for different cooking solutions
Table 16. Describes the Economic Gains for different scenarios of lifetimes and payback times when investing in
different cooking solutions for the different groups. LLT = Long Lifetime, SLT = Short Lifetime, LPBT=
Long Payback time, SPBT= Short Payback time.
Table 17. A summary of the financial recommendations

-XII-
Acronyms
CIA Central Intelligence Agency
d.b Dry Basis
FUANE Fundo De Energia
GACC Global Alliance for Clean Cook stoves
ICT Information Communication and Technology
IEA International Energy Agency
IRENA International Renewable Energy Agency
LLT Long Lifetime
LPBT Long Payback Time
LPG Liquefied Petroleum Gas
NASA National Aeronautics and Space Administration
OECD Organisation for Economic Co-operation and Development
SIDA The Swedish International Development Cooperation Agency
SLT Short Lifetime
SPBT Short Payback Time
TSF Three Stone Fire
TV Tele Vision
UN United Nations
w.b Wet Basis
WHO World Health Organization

-XIII-
Nomenclature
Symbol Denomination Unit
𝐸𝑛𝑒𝑒𝑑 Energy need in household [MJ]
𝐸𝑢𝑠𝑒 Energy use in household [MJ]
𝑏𝑖𝑜𝑔𝑎𝑠𝑦𝑖𝑒𝑙𝑑 Biogas yield [m3/kg DM]
𝑡𝑐𝑜𝑙𝑙𝑒𝑐𝑡 Time spent on collecting wood [h/month]
𝑡𝑐𝑜𝑜𝑘𝑖𝑛𝑔 𝑚𝑒𝑡ℎ𝑜𝑑 Cooking time of the cooking method [h/month]
𝑡𝑑𝑖𝑓𝑓 Time saved or lost due to changed cooking method [h/month]
𝑡𝑡ℎ𝑟𝑒𝑒 𝑠𝑡𝑜𝑛𝑒 𝑓𝑖𝑟𝑒 Cooking time of the three stone fire [h/month]
𝜂𝑐𝑜𝑜𝑘𝑖𝑛𝑔 𝑚𝑒𝑡ℎ𝑜𝑑 Efficiency of the cooking method [%]
C Electricity cost [USD/month]
DM Dry Matter [%]
f Fuel consumption in household [kg/person/day]
G Initial investment [USD]
j Type of animal or human j=1,2,3,4
LHV Lower Heating Value [MJ/kg]
LHVdry Lower Heating Value for dry wood [MJ/kg]
LHVwet Lower Heating Value for wet wood [MJ/kg]
LT Life time [years]
MCdry Moisture Content on dry basis [%]
MCwet Moisture Content on wet basis [%]
P Economic gain [USD]
PB Payback time [years]
Saving Saving per year from reduced fuel cost [USD/year]
Tariff Electricty tariff [USD/MJ]
Waste Agricultural waste and food waste [kg/year]
𝑠 Standard deviation

-1-
1 Introduction
Inhaca is an island situated in the Maputo bay in southern Mozambique. The island is made of
sand with its highest level situated 104 meters above the sea. There are swamps, mangroves,
cultivated fields, grassy plains and dune forests. The flora and fauna are rich with a large variety
of rare species. (Albano, 2015)
In spite of Inhaca’s connection to the mainland grid, established in 2003 (AllAfrica, 2003), 90 %
of the inhabitants of Inhaca Island were in 2015 estimated to cook over open fire using firewood.
Wood is also used for construction. The high level of wood use leads to deforestation, which has
an adverse effect on the unique nature on the island. (Albano, 2015)
At the moment, the amount of firewood used for cooking on Inhaca Island, and other parts of
Mozambique, is unsustainable and the resources of forest will not be able to meet the growing
demand. With the forest gone on Inhaca Island, there is a risk of planation and loss of a
biodiversity hotspot. Policy makers are aware of the problem with deforestation and initiatives,
such as improved access to gas and kerosene, a fund for rural electrification (FUNAE) and a
syllabus including studies of renewable energy at Eduardo Mondlane University’s Faculty of
Science and Faculty of Engineering, have been initiated to find more sustainable solutions.
(IRENA, 2012)
When poor households first get access to electricity, they primarily use it for lighting, TV, radio
and a few other appliances and not for the most energy intensive activities such as cooking,
heating of water or space heating as illustrated in figure 1. For the very poor, firewood may
remain the primary fuel for cooking simply because it often can be collected for free, with only
the expenditure of time and labour. (Prasad, 2008)
Figure 1. Electricity use in households in Botswana, Ghana, Senegal and Honduras. (Prasad, 2008)
Figure 1 illustrates that the majority of the households who gained access to electricity used it for
lighting whilst only 0-22 % of the households used the electricity for the more energy intensive
activities; cooking and water heating. In Ghana and Senegal; none of the households use
electricity for cooking or water heating. They remain multiple-fuel users because they cannot
afford more electricity although they would prefer to use electricity more extensively. (Prasad,
2008)
A reduced use of wood as cooking fuel also has a positive impact on health. About 600 000
people in Africa, mostly women and children, die prematurely every year due to exposure to

-2-
indoor air pollution from biomass. (IEA, 2014) Roots, fuel wood and agricultural residues emit
high levels of carbon monoxide, hydrocarbons and particulate matter when incinerated.
(OECD/IEA, 2006)
Access to electricity also makes it possible to have a fridge, where food and vaccines can be
stored. The electricity gives increased access to information communication technologies (ICT:s)
and access to good lightning makes it possible to study after dark. (WHO, 2006)
If it would be possible to significantly reduce or end the use of firewood in the households it
would emancipate time and labour, previously used to collect firewood primarily by women, for
education and other income generating activities. (Kanagawa and Nakata, 2007) A change to
cleaner cooking, using better fuels, therefor has several benefits. If half the population in
developing countries were to be provided with LPG from 2006 to 2015, who would otherwise be
using solid fuels for cooking, WHO estimates total benefits to reach 91 million dollars, as shown
in table 1.
Table 1. Benefits of Cleaner Cooking. (OECD/IEA, 2006)
Source of saving Amount saved [Million USD]
Health Care Savings 0.38
Time Savings due to prevented illnesses:
School attendance days gained and productivity gains 1.46
Time savings due to less time spent on fuel collection and cooking 43.98
Value of averted deaths 38.73
Environmental benefits 6.07
Total Benefits 90.62
The largest contribution to this gain is from time savings in cooking and collecting wood and the
second largest is the estimated value of averted deaths. The smallest contributor is from health
care savings. This could be because people who are today using wood as their primary source of
energy for cooking have a low income and therefore cannot afford health care, even when
subsidized. Healthcare might not also be available.
Access to electricity does not automatically lead to development. As studied by Åkesson and
Nhate in 2002 in the Ribáuè electrification project, the development of commercial activity in the
district was hampered by lack of complementary infrastructure such as good roads,
telecommunication, water and irrigation networks, banks and credit facilities.
The choice of energy source for the households most energy intensive activities is much
dependent on the household income, and this correlation can be illustrated by an energy ladder,
see figure 2. The energy ladder illustrates different fuels used for the most energy intensive
activities in a household, such as cooking. The efficiency, cleanness and convenience of the fuels
increase while moving up the ladder. This means that crop waste and dung are the most
inefficient choices of fuel and that electricity is the ideal fuel choice, with superior energy
efficiency during high heat output. (WHO, 2006)

-3-
Figure 2. Energy ladder. (WHO, 2006)
Factors identified by WHO to stimulate movement higher up the ladder are prosperity and
development. (WHO, 2006) Other studies regarding fuel choice have in some cases shown
movements backwards on the energy ladder, motivated by affordability and availability. (Lewis
and Pattanayak, 2012; Hiemstra-van der Horst and Hovorka, 2008) In the longer perspective,
prosperity and development on Inhaca Island would most likely lead to a movement up the
ladder and a transition or partial transition away from wood.
It is urgent to reduce the use of wood on Inhaca and consequently it is pressing to find
alternative cook stoves for the inhabitants in order to significantly reduce the harvesting of the
forest. This will be an advantage for the nature as well as for the people living on the island. The
focus of the study will be to suggest alternative cook stoves and fuels with less strain on the
forest and less health risk for humans. The alternatives will be compared regarding costs and
social sustainability.

-4-
1.1 Problem Formulation
Inhaca Island is one of the globally important areas for forest conservation and the forest
provides a number of societal, environmental and economic goods. In addition, the combustion
of biomass inside houses causes indoor air pollution, which leads to an increased risk of chest
decease to those who are exposed. (WHO, 2006) Inhaca urges for identification and
implementation of improved energy solutions for cooking. These solutions also have to be
possible to implement, use and finance. Unless the inefficient usage of the biomass stops,
Inhaca’s population will experience a decrease in socio-economic development and the world will
experience a degradation of a biologically important area. In addition Inhaca’s population has
already a widespread poverty and the island has limited space and resources. (Albano, 2015)
1.2 Aim
The aim of this report is to identify renewable energy sources for cooking to replace or
significantly decrease the current use of firewood from the forest. These sources should be
evaluated from a financially and socially sustainable perspective in order to enable their
implementation on Inhaca Island.
The goal is to produce the following results:
A description of the current energy use on the island.
A model for adoption process of new cook stoves and a social sustainability assessment
based on the model for the different solutions.
Identify alternative cooking solutions that run on renewable fuel, significantly decrease or
end the use of firewood for cooking and are affordable or profitable for households on
Inhaca Island, possibly with some financial aid from outside investors.

-5-
2 Mozambique
República de Moçambique is located in Sub-Saharan Africa and borders to Tanzania, Malawi,
Zambia, Zimbabwe, South Africa and Swaziland. The climate is tropical to subtropical and
natural resources such as coal, titanium, natural gas, hydropower, tantalum and graphite can be
found.(CIA, 2014) The population of Mozambique is estimated to about 25 million people and
the capital is Maputo, see figure 3. (SIDA, 2014a)
Portuguese is the official language, but over 20 local languages
are spoken. Mozambique is still dependent on foreign
assistance. In 2012 it represented 40% of the annual budget
and over 50% of the population remains below the poverty
line.1 Agriculture employs the majority of the work force (81
%) and productivity growth is weak. Mozambique exports
aluminium, electricity, natural gas, coal, shrimps, tobacco,
sugar, cotton, timber and cashews, but suffers from a
substantial trade imbalance. Mozambique also has a large
potential for hydropower. The ability to attract large
investments to projects regarding natural resources is expected
to fuel continued high financial growth rate in coming years.
(CIA, 2014)
The GDP per capita was in 2013 estimated to 1 200 USD and
is a composition from agriculture (28.7 %), industry (24.9 %)
and services (46.4 %). (CIA, 2014) In 2010 the literacy was
56.1 % (SIDA, 2014a) and only 14-15 % of households have
access to electricity. Several electrification projects, such as
FUNAE, are working to improve the energy access but the
progress is slow. (SIDA, 2014b)
Figure 3. Map of Mozambique. (CIA, 2014)
2.1 Mozambican history
Mozambique was a Portuguese colony during almost five centuries before their independence in
1975. The former guerrilla movement; The ruling Front for the Liberation of Mozambique,
FRELIMO, became the ruling party with Marxism as their ideology. This government was
challenged by a new armed rebel group called rebel Mozambique National Resistance,
RENAMO, which led to the beginning of a civil war in 1977. Economic dependence on South
Africa, severe drought and a prolonged civil war causing large-scale emigration slowed the
country’s development until mid-1990’s. Frelimo abandoned Marxism in 1989 and introduced
multiplinary elections and a free market economy. An UN-negotiated peace agreement ended the
fighting in 1992. Frelimo is still the ruling party in Mozambique but the elections in 2004 and
2009 were flawed by questionable disqualification of candidates, voter fraud and government
resources funding the Frelimo election campaign. The long civil war and recurring severe drought
in the hinterlands have resulted in an increased migration of the population to urban and coastal
1 Poverty line- The average poverty line in developing countries is 2 USD per day. (The World Bank, 2011)

-6-
areas, with adverse environmental consequences. (CIA, 2014) In spite of these circumstances
Mozambique is one of the fastest growing economies in Sub-Saharan Africa (IRENA, 2012) with
an average annual growth rate of over 7 % for the past decade. (The World Bank, 2014)
2.2 Nature of Inhaca Island
Inhaca Island is situated 32 km east of Maputo, se figure 4, in southern Mozambique and has an
area of approximately 42 km2.
Figure 4. Map of Inhaca Island (Photo: Antonio Chabana 2015)
A third of the territory is under conservation and it forms part of the northernmost focal area of
floristic endemism of the Maputaland ecoregion, within the Maputaland-Pondaland-Albany
biodiversity hotspot, one of the globally important areas for conservation. The island lies in a
transition between the tropical and subtropical climate, making it an area of overlapping range of
species from different climate conditions. This makes research results and models from Inhaca
applicable in similar areas elsewhere in the country. Currently, more than 70 % of all marine
biological research in Mozambique has been conducted on Inhaca. These scientific and
biodiversity values are threatened by activities such as slush and burn agriculture, harvesting of
timber for construction, biofuel for housing and an unbalanced tourism development. (Albano,
2015) Forest resources on Inhaca Island have a high level of biodiversity. Several species of sea
grass, seaweeds, mangroves, corals, fish, crustaceans, sea mammals and turtles, birds and other
organisms have been observed (de Boer Bento 1999; Kalk 1995; Mendonça 1954; Moura 1969;
Sousa 1966). The island is made of sand as seen in figure 5 and the forest covering the dune
ridges and woodland protects the island from sheet erosion. The sand makes transports on the
island difficult. The mangrove swamps work as a natural barrier for salt penetration from the sea
into the agricultural soil (Kalk, 1996; Muacanhia Bhat, 2001) and also as a retainer of sediments,
protecting the coral reefs and providing soil and shelter for the island’s flora and fauna. The

-7-
mangroves also play an important role for the locals since they enable crab fishing and the coral
reefs attract tourists. (Muacanhia, 2003) It also provides nesting sites for birds and sea turtles.
Continued inefficient and unregulated use of forest resources endanger the conservation
objectives and limit the local socio-economic development. (Albano, 2015)
Figure 5. Roads on Inhaca Island.
Inhaca has experienced a rapid deterioration of its environment caused by the flow of refugees.
The natural balance of the island was harmed by the migrants who, having lost everything, where
forced to rely on nature for their survival. (UN-HABITAT, 1993)
2.2.1 Weather and insolation on Inhaca Island
Inhaca has the geographical coordinates -26.023 (latitude), 32.955 (longitude). Data about
Inhaca’s weather has been collected from NASA’s web during 22 years, from July 1983 to June
2005.
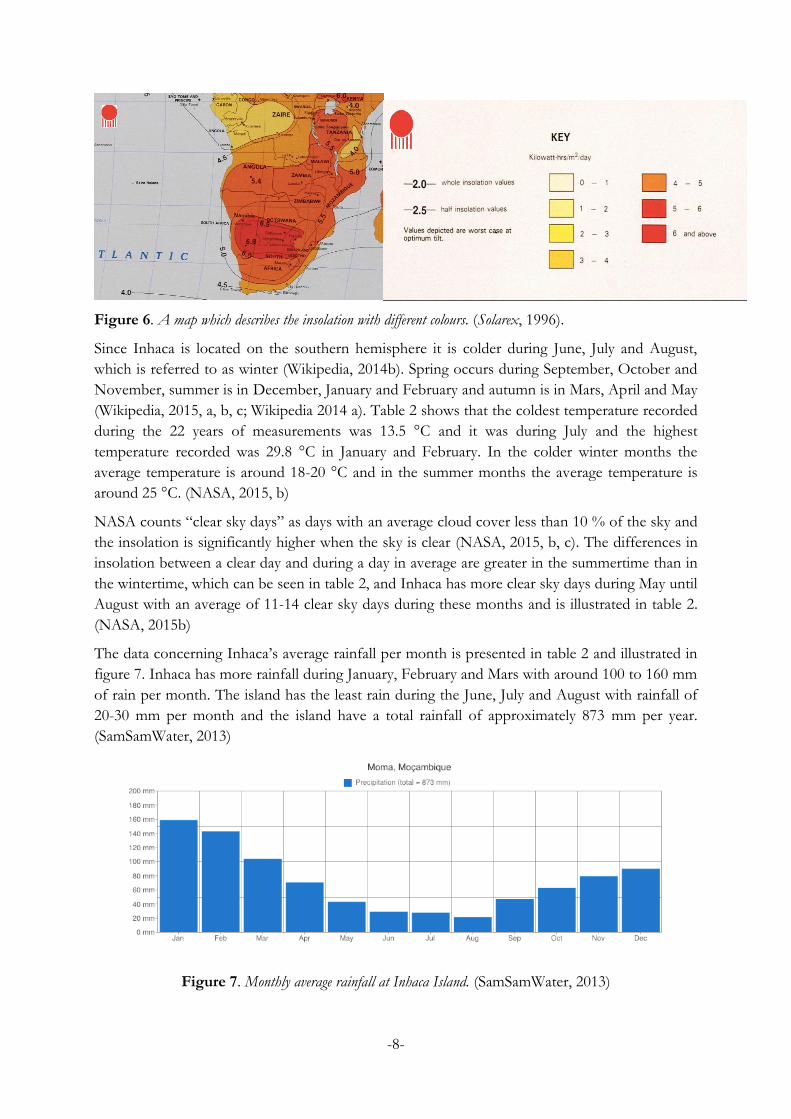
Solar Cookers International presented in 2004 a ranking list of the 25 countries in the world with
the greatest potential benefit from solar cookers. This ranking of countries is based on several
different parameters, such as how many people that have access to sun combined with
experiencing fuel scarcity and also percentages of woodlands and insolation. Mozambique has a
low share of the population with both sun and fuel scarcity compared to the other 25 countries in
the study. Because of this Mozambique is not ranked very high within these countries. Although
since the country’s annual average insolation is considered to be high ( 2.09 TWh/m2 or greater)
Mozambique is ranked as the country with the 16:th best potential for solar cooking in the world.
(Solar Cookers International, 2004) Compared to the map in figure 6 with marked insolation,
Maputo bay has an insolation between 4-6 kWh/m2/day, which corresponds quite accurately to
NASA’s data, which is presented in table 2 (Solarex, 1996).
-8-
Figure 6. A map which describes the insolation with different colours. (Solarex, 1996).
Since Inhaca is located on the southern hemisphere it is colder during June, July and August,
which is referred to as winter (Wikipedia, 2014b). Spring occurs during September, October and
November, summer is in December, January and February and autumn is in Mars, April and May
(Wikipedia, 2015, a, b, c; Wikipedia 2014 a). Table 2 shows that the coldest temperature recorded
during the 22 years of measurements was 13.5 °C and it was during July and the highest
temperature recorded was 29.8 °C in January and February. In the colder winter months the
average temperature is around 18-20 °C and in the summer months the average temperature is
around 25 °C. (NASA, 2015, b)
NASA counts “clear sky days” as days with an average cloud cover less than 10 % of the sky and
the insolation is significantly higher when the sky is clear (NASA, 2015, b, c). The differences in
insolation between a clear day and during a day in average are greater in the summertime than in
the wintertime, which can be seen in table 2, and Inhaca has more clear sky days during May until
August with an average of 11-14 clear sky days during these months and is illustrated in table 2.
(NASA, 2015b)
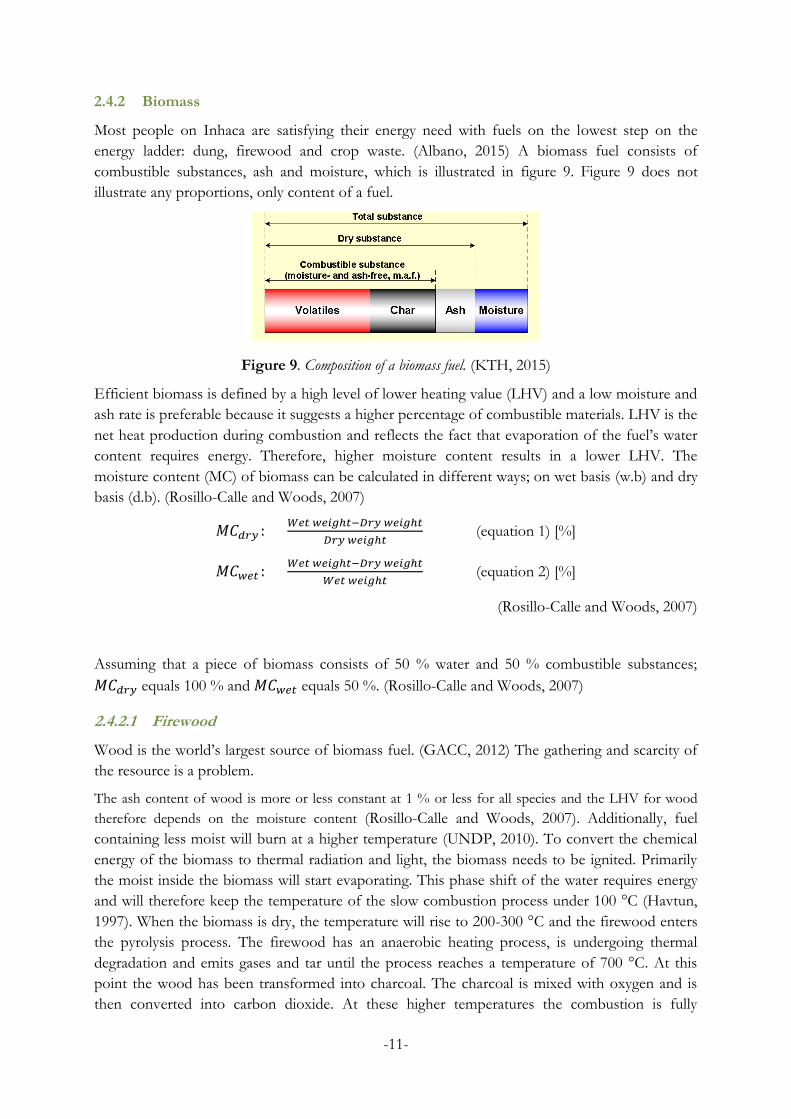
The data concerning Inhaca’s average rainfall per month is presented in table 2 and illustrated in
figure 7. Inhaca has more rainfall during January, February and Mars with around 100 to 160 mm
of rain per month. The island has the least rain during the June, July and August with rainfall of
20-30 mm per month and the island have a total rainfall of approximately 873 mm per year.
(SamSamWater, 2013)
Figure 7. Monthly average rainfall at Inhaca Island. (SamSamWater, 2013)

-9-
Table 2. Monthly average rainfall at Inhaca Island. a. (NASA, 2015, b) b. (SamSamWater, 2013)
Lat: -26.023 Lon: 32.955 Jan Feb Mar Apr May Jun Jul Aug Sep Oct Nov Dec
Monthly average insolation incident on a horizontal surfacea (kWh/m2/day)(a) 6.06 5.69 5.09 4.45 3.96 3.64 3.79 4.21 4.83 4.88 5.33 5.82
Monthly averaged clear skya days (days)(a) 2 2 4 7 12 14 13 11 6 3 2 1
Monthly Averaged Clear Sky Insolation Incident On A Horizontal Surfacea (kWh/m2/day)(a) 8.22 7.57 6.52 5.41 4.47 4.05 4.29 4.91 6.17 7.28 8.11 8.33
Monthly average air temperature at 10 m above the surface of earth (a)
Annual Average
22-year average (C) 25.1 25.0 24.1 22.4 20.5 18.6 18.3 20.2 22.3 23.0 23.8 24.6 22.3
Minimum (C) 20.7 20.7 19.9 18.1 15.9 13.8 13.5 15.1 17.2 18.5 19.5 20.2 17.7
Maximum (C) 29.8 29.8 29.1 27.4 26.1 24.4 23.8 25.8 27.5 27.7 28.3 29.2 27.4
Average rainfall on Inhaca Island (b)
Total
(mm) 159 143 104 70 43 29 27 21 47 63 79 90 873
2.3 Society on Inhaca Island
The island has a population of about 5000 people. Inhaca has its own king and several other leaders
who answer to him. The roads on Inhaca are, like the rest of the island, made of sand which
complicates transportation. Some people have cars or four wheelers and one minivan sometimes
work as a bus in the Nhaquene area. The most common way of transportation is by foot or by boat
and the only way to travel to the island is by boat from Maputo. (Timba, 2015)
The cell phone reception varies, and is often low, around the island. Cell phones are used for making
calls as well as accessing the internet. Inhaca has a local radio station called Radio Comunitaria de
Inhaca and mail can be delivered in the village to be collected by the islands inhabitants. (Timba,
2015)
There is one bank, Barclay’s, on the island but no ATM. Restaurants, the hotel, and the grocery store
accept card payments but the service is often unavailable. If an inhabitant wants to use another bank
than Barclay’s; he or she will have to travel to the mainland to withdraw money. There are several
local small businesses on the island and the majority of the population works within agriculture,
fishing or the tourist sector. Unfortunately the hotel is closed at the moment and it is unknown when
it will open again. Unemployment is high and many people have seasonal employments. (Timba,
2015)
There are police, military and forest rangers on the island. The rangers work to protect the islands
natural reserves but their work is hampered by corruption within the police force. The island has four
primary schools and one secondary school. University can be attended in Maputo but it is considered
expensive, 3000 MZT, equals 85 USD (see appendix C), per semester or more. There are no hospitals
on the island, but four health centres. (Timba, 2015)

-10-
The social security system in Mozambique is underdeveloped and the people who are old or disabled
are forced to depend on their families or the good will of strangers. Inhaca’s only export product is
fish and everything else is imported from Maputo with the exception of some agricultural products
for which the island is self-sufficient. (Timba, 2015)
The island is divided into three parts; Nhakene, Ribjêne and Inguane. (Conselho Municipal de
Maputo, 2007) The distribution of the population between the three parts is illustrated in figure 8.
Most households are situated in groups/villages.
Figure 8. Population distribution on Inhaca Island (Conselho Municipal de Maputo, 2007)
2.4 Energy on Inhaca Island
Inhaca Island is provided with electricity from the mainland via a cable. (AllAfrica, 2003)
However, not all households are connected and most of the households that are connected
continue to use open fire as their primary cooking method, using firewood, because cooking with
electricity, gas or other more efficient fuels is too expensive. (Albano, 2015)
2.4.1 Electricity on Inhaca Island
Table 3. Electricity tariffs on Inhaca Island (EDM, 2015)
Electricity Consumption
(kWh)
Household Tariff
(MZT/kWh) Household Tariff (USD/MJ) (a,b)
From 0 to 300 kWh /
From 0 to 83.3 MJ 2.50 0.020
From 301 to 500 kWh /
From 83.3 to 138.9 MJ 3.53 0.028
Above 500 kWh/
Above 138.9 MJ 3.71 0.029
Pre-Payment 3.18 0.025
(a) 1kWh = 3600 kJ = 3.6 MJ (Havtun, 1997) (b) See appendix C
Electricity tariffs in Mozambique are depending on the household’s electricity consumption, see
table 3. If the household spend more electricity than 300 kWh (83.3 MJ) per month it is less
expensive to pay in advance. The household tariffs have been presented in USD/MJ as well, in
order to make it easy for the reader to compare the tariffs to other costs and lower energy values
further on in the report.
42%
33%
25%Inguane
Ribjêne
Nhakene
-11-
2.4.2 Biomass
Most people on Inhaca are satisfying their energy need with fuels on the lowest step on the
energy ladder: dung, firewood and crop waste. (Albano, 2015) A biomass fuel consists of
combustible substances, ash and moisture, which is illustrated in figure 9. Figure 9 does not
illustrate any proportions, only content of a fuel.
Figure 9. Composition of a biomass fuel. (KTH, 2015)
Efficient biomass is defined by a high level of lower heating value (LHV) and a low moisture and
ash rate is preferable because it suggests a higher percentage of combustible materials. LHV is the
net heat production during combustion and reflects the fact that evaporation of the fuel’s water
content requires energy. Therefore, higher moisture content results in a lower LHV. The
moisture content (MC) of biomass can be calculated in different ways; on wet basis (w.b) and dry
basis (d.b). (Rosillo-Calle and Woods, 2007)
𝑀𝐶𝑑𝑟𝑦 : 𝑊𝑒𝑡 𝑤𝑒𝑖𝑔ℎ𝑡−𝐷𝑟𝑦 𝑤𝑒𝑖𝑔ℎ𝑡
𝐷𝑟𝑦 𝑤𝑒𝑖𝑔ℎ𝑡 (equation 1) [%]
𝑀𝐶𝑤𝑒𝑡 : 𝑊𝑒𝑡 𝑤𝑒𝑖𝑔ℎ𝑡−𝐷𝑟𝑦 𝑤𝑒𝑖𝑔ℎ𝑡
𝑊𝑒𝑡 𝑤𝑒𝑖𝑔ℎ𝑡 (equation 2) [%]
(Rosillo-Calle and Woods, 2007)
Assuming that a piece of biomass consists of 50 % water and 50 % combustible substances;
𝑀𝐶𝑑𝑟𝑦 equals 100 % and 𝑀𝐶𝑤𝑒𝑡 equals 50 %. (Rosillo-Calle and Woods, 2007)
2.4.2.1 Firewood
Wood is the world’s largest source of biomass fuel. (GACC, 2012) The gathering and scarcity of
the resource is a problem.
The ash content of wood is more or less constant at 1 % or less for all species and the LHV for wood
therefore depends on the moisture content (Rosillo-Calle and Woods, 2007). Additionally, fuel
containing less moist will burn at a higher temperature (UNDP, 2010). To convert the chemical
energy of the biomass to thermal radiation and light, the biomass needs to be ignited. Primarily
the moist inside the biomass will start evaporating. This phase shift of the water requires energy
and will therefore keep the temperature of the slow combustion process under 100 °C (Havtun,
1997). When the biomass is dry, the temperature will rise to 200-300 °C and the firewood enters
the pyrolysis process. The firewood has an anaerobic heating process, is undergoing thermal
degradation and emits gases and tar until the process reaches a temperature of 700 °C. At this
point the wood has been transformed into charcoal. The charcoal is mixed with oxygen and is
then converted into carbon dioxide. At these higher temperatures the combustion is fully

-12-
developed. The energy released in the combustion process will radiate in form of light and
thermal radiation making it possible to use for cooking and lightning. (Loo Van Sjaak, 2008)
The density of the wood plays an important role in the developed effect and eminence of
combustion. The level of moisture is also a very important factor. If the wood is too wet it will be
hard to ignite and burn slower and less clean. (SEA, 2011) The moisture rate’s influence on LHV
is illustrated in figure 10, showing estimations of the LHV for the same type of wood with
different moisture rates.
Figure 10. Correlation between moisture rate and LHV. (Francescato et al., 2008)
The most relevant points in figure 10 have been collected in table 4. With a 0 % moisture rate,
the calorific value or LHV is 19 MJ/kg. The LHV declines as the moisture rate rises.
Table 4. Correlation between moisture rate and LHV. (Francescato et al., 2008)
Source of biomass 𝑴𝑪𝒘𝒆𝒕 (%) 𝑳𝑯𝑽 (𝑴𝑱/𝒌𝒈)
Firewood (wet,fresh out) 40 10.4
Firewood (air dried, humid zone) 20 14.6
Firewood (air dried, dry zone) 15 15.6
Firewood (oven dried) 0 19
The correlation between moisture content of a fuel and its LHV that is shown in figure 10 can be
calculated using:
LHVwet = LHVdry(1 − MCwet) − 2.447MCwet (equation 3)[MJ/kg]
(Sokhansanj, 2011)
LHVwet is the Lower Heating Value for wet wood, LHVdry is the Lower Heating Value for dry
wood and 2.447 is the latent heat of vaporization for water in MJ/kg at 25 oC. Thus, the
maximum LHV is obtained when the wood has 0 % moisture content. (Sokhansanj, 2011)

-13-
2.4.2.2 Dung
Dung is a renewable energy source, generated for free by animals and people. The use of dung
instead of wood can ease the local strain on the forest but includes two inconvenient aspects; if it
is too wet during combustion it will generate a great amount of unhealthy smoke (UNDP, 2010)
and the need to handle the dung to form it into “briquettes” and dry it before using it as fuel
(Serio et al. 2002).
The ash-free LHV of dung is higher than the LHV of wood. But as the ash content must be
included, and ranges with an average of 23-27 %, the LHV of dung is estimated to 13.6 MJ/kg.
This value is for dung with a moisture rate of 15 % (Rosillo-Calle and Woods, 2007) but fresh
dung has a much higher moisture rate, up to 78 %, and therefore also a much lower LHV.
(Seboka et al. 2009)
2.4.2.3 Agricultural Waste
Ash content and moisture content varies from one residue to another and therefore so does the
LHV. Agricultural waste has, in general, a higher ash content than wood. (Rosillo-Calle and
Woods, 2007) When agricultural waste is used as a fuel in the developing world, it is often in its
natural state or with some treatment such as cutting or drying. Densifying the residues will
improve their properties. (GACC, 2015c)
The most common crops grown on Inhaca Island are potato, tomato, cassava, corn, sesame,
cabbage, beans, carrots and onions. Corn and beans leave the most waste (Timba, 2015) and their
LHV are presented in table 5.
Table 5. LHV of some types of agricultural waste on Inhaca. (Domalski, 1987)
Agricultural waste 𝑴𝑪𝒅𝒓𝒚 (%) 𝑳𝑯𝑽(𝑴𝑱/𝒌𝒈)
Corn waste 5 17.6
Bean waste 6 16.3
The LHV of the two crops found in table 5 are higher than should be expected for combustion
of the air dried waste in a humid zone because of the higher moisture content. A good
comparison to the agricultural wastes in table 5 would therefore be with wood that has 0 %
moisture content and thereby a LHV of approximately 19 MJ/kg. This concluding that, in
general, firewood is a better fuel than agricultural waste.

-14-
3 Cooking methods
This section will describe the most common cooking method today on Inhaca Island. It will also
cover mechanisms of the adoption process of a new cooking solution and identified alternative
renewable cooking solutions.
3.1 Three stone fire
On Inhaca Island most cooking is done over open fire (Albano, 2015) or as it is called: a “three
stone fire”, TSF, (see figure 11). Women are responsible for cooking in the households, this
including: collecting fuel, building the fire and preparing the meals. The world’s most common
cooking device is the TSF/cooking over open fire. This cooking method wastes a lot of energy
because the heat radiation can escape on the sides instead of being focused on the pot. The
energy from the combustion is therefore not effectively transferred to the food and generally only
15 % of the total released energy from the fire ever reaches the inside of the cooking vessel and
to the food or water therein. The incomplete combustion in a TSF generates a high amount of
particles, harming the people around the fire and the environment in general. (The World Bank,
2011)
Figure 11. Three Stone Fire (TSF)
Figure 11 illustrates that a lot of the thermal energy escapes on the sides causing the low
efficiency of 15 %. The low rate of efficiency results in more fuel, time and pollution than would
be needed with a more efficient stove. The open fire is also hard to control and easily affected by
outside factors such as wind and rain. (UNHCR, 2002). To protect the TSF it is often used in
small closed rooms with poor ventilation. The pollutants from the fire can cause acute respiratory
infections, chronic obstructive pulmonary disease, different forms of cancer, decreased resiliency
against tuberculosis, asthma, eye conditions, low birth weight, scalds, burns or perinatal health
conditions (Ezzati et al. 2002, WHO, 2014). Also children are exposed to large amounts of
emissions and they are put at risk when helping or playing near the fire (Rehfuess et al. 2011).
3.2 Adoption process of a new cooking solution
For the suggested alternative cooking stove to be socially sustainable it is important to analyse
factors contributing to customer satisfaction when implementing and using the cooking solution.
A report from the Differ group in 2012, concluded that the three most important factors
contributing to customer satisfaction, and therefore crucial in order to ensure adoption of the
new cooking stove, are: reduced cooking time, reduced fuel consumption and practical design
features (size, functionality, usability). (Differ group, 2012)

-15-
The cooking time using the new stove needs to be reduced or equal to the cooking time when
using the traditional stove. If the cooking time is not reduced compared to previous practice,
customers have been shown to return to their former cooking stove. Reduced fuel consumption
will lead to lees time spent on collecting wood or a reduced fuel cost. The design must meet
customer demands and studies have shown that users prefer the new cook stove to resemble the
old one. Other important factors are; long lifetime, improved safety, low breakage rate, reduced
air pollution, improved cleanness (Differ group, 2012) and price. (Windroch International, 2009;
Amacher et al., 1992)
People in less developed countries can often have difficulties in understanding the benefits of
new technology (Gine and Yang, 2009; Levine and Cotterman, 2012) and also have difficulties in
seeing the benefits for the household (Miller and Mobarak, 2011). Raising awareness through
education is therefore very important.
Women are more prone to cook stove adoption since they are exclusively responsible for
cooking and fuel collection, but they are also more price sensitive than men. (Miller and
Mobarak, 2011) Further more; liquidity constraints and present bias2 have been identified as
factors when adopting new cook stove technology. The effect from these factors can be reduced
or neutralized by offering a free trial period, time payments and the right to return defective
stoves. In a study of Levine and Cotterman (2012) implementation of these offers increased cook
stove adoption from 5 % to 45 %.
The implementation of improved cook stoves is made easier by a high fuel price or arduous fuel
collection whereas free and easy access to fuel could clog the adoption process (Mobarak et al.
2012). By implementing a new cooking device, new cooking practices are also introduced.
Coexistence of the improved cook stove and the traditional stove is common. (Ruiz-Mercado et
al. 2011) The introduction of the new cooking device and practices is eased if respected
community members have approved the technology and if these members are prepared to assist.
(Miller and Mobarak, 2011)
3.3 Alternative renewable cooking methods
Clean cooking refers to the amount of particles released into the air during the combustion
needed to cook the food. (GACC, 2015c) Inhalation of large amounts of particles has a negative
health effect and alternatives to reduce the amount of particles released into the air from cooking
are to increase efficiency or to switch to a fuel that releases less particles when incinerated.
The cheapest (but not free) available fuels like charcoal and gas are scarcely used on the island.
The solution should also decrease the deforestation on the island and be renewable.
3.3.1 Solar cooking
Solar cooking is an alternative way to cook in areas without electricity and with an exposure to a
generous amount of sun. In the current situation there are a number of different types of solar
cookers, where the most common are box cookers, panel cookers and parabolic cookers. (Solar
Cookers International, 2010) However, the design and the price vary between the different types
(Solar Cooker at Cantinawest, 2008, a).
2 The tendency to over value immediate rewards.

-16-
These three types (box cookers, panel cookers and parabolic cookers) essentially use the same
techniques, even if they have different designs. The main purpose of solar cookers is to convert
radiant energy from the sun into thermal energy. (Wikipedia, 2015, d) Colours and materials are
of great importance. Since black absorbs all wavelengths it will attain a high temperature quicker
than for instance a white surface. Well reflecting surfaces, reflecting the solar rays towards the
pot, will amplify the effect. (Solar Cookers International, 2010)
Box cookers consist of an insulated box having a lid of plastic or glass where the solar rays enter,
which can be seen in figure 12. In addition, there is a surface that reflects sunrays on to the box’s
top cover to enhance performance even further. Box interior colour is black and since it is
insulated the thermal spill will be less. (Wikipedia, 2015, d)
Box cookers cook for a longer time and do not require frequent adjustments. It is appropriate to
adjust the cooker every 30 minutes. (Solar Cookers International Network, 2013) With box
cookers it is impossible to stir the food without opening the lid and letting all the heat escape
(Kjellström Voyce, 2009). This solar cooker enables cooking food in multiple pots at the same
time (Solar Cookers International Network, 2014a).
Figure 12. A Box Cooker with a reflector and a glass cover to keep heat from escaping the pot (How Stuff
Works, 2009).
Panel cookers are a compound of parabolic cookers and box cookers (Solar Cookers
International, 2010). They have a panel, which is shaped as show in figure 13, which reflects the
sunrays. The rays then hit the pot and converts radiation to thermal energy. Panel cookers also
have a transparent plastic bag or a glass bowl to conserve heat and make use of the greenhouse
effect. (Solar Cookers International Network, 2015, a)
Panel Cookers are easy to transport and they can be inexpensive. Disadvantages are that the
cooker does not achieve high temperatures and, same as the box cooker, cannot fry food. (Solar
Cookers International Network, 2015, c)

-17-
Figure 13. A typical panel solar cooker with a plastic bag concealing the pot in order to increase efficiency.
(NASA, 2015, a)
As illustrated in figure 14, parabolic cookers generally consist of a parabolic panel in a material
that reflects the sunrays to a centre point. (One Earth Designs, 2014). In order to heat the food it
should be placed at the centre of the parabolic panel, preferably in a black pot, to achieve the best
efficiency (Wikipedia, 2015, d). Parabolic cookers cook at a high temperatures but they require
frequent adjustments and constant supervision (Solar Cookers International, 2010). For example,
Solar Cookers International are selling, among others, a parabolic cooker named SolSource which
can, on a sunny day, boil one litre of water in 10 minutes or reach grilling and baking
temperatures in 5 minutes (Solar Cookers International, 2015, a).
Figure 14. Parabolic Cooker. (Devang, 2010)
Table 6. Data for different models of solar cookers. These are the prices that are offered in different stores online.
a. (Solar Cookers International, 2015, a) b. (Solar Cookers International, 2015, b) c. (Solar Cooker
at Cantinawest, 2008, b) d. (Solar Cooker at Cantinawest, 2008, c) e. (Solar Cooker at
Cantinawest, 2008, d)
Model Price range (USD) Maximum temperatures (°C)
Box cooker 197-449(a) 175-204(e)
Panel cooker 39-109(b) 116-140.5(d)
Parabolic cooker 170-399(a) 400-440(c)
The prices of the different models vary and the prices presented in table 6 are based on online
prices. Instead of buying a solar cooker it is also possible to build one, which will result in a much

-18-
lower total cost. For instance, Solar Cookers International (2013) presents data of a box solar
cooker that can be built for a total cost of 790 INR, which amounts to approximately 12.6 USD,
and that can attain a temperature of 130° C if the ambient temperature is 28° C. Furthermore the
box cooker was tested to cook 0.5 kg rice (weight after it was cooked) which took two hours and
15 minutes. (Solar Cookers International Network, 2013)
There are important reasons for countries to promote solar cooking: it is an alternative to
firewood and also, solar energy is clean and does not cause pollution. Both reasons have
important implications for the environment.
In addition, solar cooking has number of advantages for the people and their everyday life. To
begin with it saves time. An average wood fuel trip in southern Africa is 6 kilometres and an
average of 2-3 trips per week are done per household. Hence, collecting wood is time consuming.
(Tucker, 1999) Although, according to Wentzel and Pouris (2007), coking with solar cookers is
more time consuming than to cook with other stoves there can still be a potential
timesaving. This is because some solar cookers demand very little attention during cooking and
therefore people can attend to other things while the food is cooking.
Furthermore Wentzel and Pouris (2007) mean that solar cookers also help improving the quality
of life by improved energy availability for households and thus result in increased energy security:
the household has two sources of energy instead of one. Food that requires a long cooking time
uses a lot of fuel. These types of food are ideal for solar cooking since solar cooking is a slow way
of cooking in itself. (Wentzel and Pouris, 2007)
To summarize, savings is the main reason to use solar cookers. In rural areas it saves time, in
urban areas it saves money, since electricity is expensive. (Wentzel and Pouris, 2007)
However, these incentives have not been enough to enable widespread usage of solar cookers
(Tucker, 1999). According to Wentzel and Pouris’ study on the development impact of solar
cookers, they are not yet carried out at its full potential in South Africa. For those who owned a
solar cooker the usage of the solar cooker was in average in 38 % of all the cooking activities. In
another study it was shown that purchased or obtained solar cookers were used for 25 % of all
cooking. (Wentzel and Pouris, 2007)
Although there are clear positive aspects of solar cooking, there are also disadvantages. The price
of a solar cooker is relatively high (40- 500 USD). There are problems with high fabrication costs
and it is hard to find the right materials in non-industrialized countries (Solar Cooker at
Cantinawest, 2008, a; Schwarzer and Eugênia Vieira da Silva, 2003). Promoting the use of the
cooker is no longer the main issue, but promoting purchasing is (Wentzel and Pouris, 2007).
Without financial aid, the large-scale use of solar cookers will not be possible. In addition, it is
not possible to cook breakfast nor to cook during night time. It happens that people prefer
cooking at night because they do not want to show others that they have food. (Tucker, 1999)
One solution to that problem is heat storage, where oil or stones are heated at the same time as
the solar cooker is used to cook food. In that way one can later, for instance at night, use the
heated oil or stones to cook (Schwarzer and Eugênia Vieira da Silva, 2003). Other important
aspects are that solar cookers require security concerning food theft or theft of cookers and an
open yard space, where the sun is not blocked by trees, where one can cook (Wentzel and Pouris,
2007).

-19-
When it is a little cloudy, it is still possible to cook with a solar cooker, however the effect will
decrease and if it is a severe cloud cover, with more than 25%-30% of the sky covered, another
cooking solution must be available (Schwarzer and Eugênia Vieira da Silva, 2003; Solar Cookers
International Network, 2014b). Rain will decrease the usage of solar cookers (Wentzel and
Pouris, 2007).
Solar cookers are not presented as a complete solution to cooking problems, but rather as an
alternative to cooking with firewood. It is a way to secure energy. In order to increase the
attraction to solar cookers the market has understood that adapting the products according to
consumer needs is as important as the technique of the cooker. There is a need for different
kinds of solar cookers in order to attract different market segments. (Wentzel and Pouris, 2007)
3.3.2 Biogas
Natural biodegradation of organic matter releases 590-800 million tons of methane into the
atmosphere annually. (ISAT/GTZ, 1999) Methane is a greenhouse gas and is responsible for
20% of global warming if water vapour is not included. (SMHI, 2014) Biogas is a mixture of 50-
70% methane and 30-50% carbon dioxide, depending on what it is extracted from and has a
LHV of approximately 21-24 MJ/m3 (Bond and Templeton, 2011). It is obtained from anaerobic
digestion of biomass (GACC, 2015a) such as waste form the agricultural sector or faeces from
animals and can therefore also work as a way of waste disposal. Biogas represents one of many
ways to replace fossil fuels and has subsequently attracted an increased interest over the last ten
years. (EON,2014)
Biogas is produced in biogas digesters, which are closed tanks where no air can get in. In this
anaerobe environment the bio mass will first undergo hydrolysis where enzymes decompose
carbohydrate, lipids and proteins into constituent parts. The next step is called acidogenesis or
fermentation where the products from the first step are transformed into carbon dioxide, acetic
acid and hydrogen. Oxygen is produced during the process of fermentation when a bacterium,
which is participating, is performing the reaction. This oxygen creates a good condition for the
final step, the methanogensis, where anaerobic bacteria are controlling the reaction that
transforms the acidogenesis production into methane. The by-product, organic slurry, can be
used as an agricultural fertilizer. (Bond and Templeton, 2011)
In developing countries there are three types of biogas digesters that are the most common; the
fixed dome digester, the float drum digester and the balloon digester. The concepts of these
biogas digesters are very similar. There is an inlet pipe for the bio mass and the gas is collected
above the slurry in the digester. There might be a mixing pit before the inlet pipe. The process of
producing gas takes around 20-100 days when the digester is mesophilic, which means that it is
designed to operate in 20-40° C. Since the digesters most often are producing biogas for
domestic use from human and animal waste, digester volumes are between 2m3-10m3 and they
produce approximately 0.5 m3 biogas per m3 digester volume and day. (Bond and Templeton,
2011) The fixed dome plant is illustrated in figure 15 and has a non-moveable gasholder which is
on top of the digester and is placed underground, protecting it from cold temperatures at night
and from damage (Energypedia, 2015). It is built out of the materials available, often bricks
(Bond, T. and Templeton M., 2011) and no rusting steel is used, hence the fixed dome digester
has a long lifetime of approximately 20 years or more. Since the fixed dome plant is constructed
partly below the surface of the ground, it takes more time to change the temperature of the

-20-
digester, which is positive since night and day temperature fluctuations is bad for the bacterial
process. (Energypedia, 2015)
Figure 15. Fixed dome plant (Bond and Templeton, 2011).
A floating drum plant consists of a cylindrical or dome shaped digester with a gasholder that
floats or moves over the digester. The gas drum has a frame, which prevents it from tilting, and it
moves up as the gas increases and down when gas is collected from the plant. The gas drum can
float directly in the slurry, which can be seen in figure 16, or on a separate water jacket. The
floating drum plant has an expected lifetime of 15 years as a maximum, although the lifetime can
be as low as 5 years in tropical areas by the coast (Energypedia, 2015). The floating drum digester
is normally made of concrete and steel (Bond and Templeton, 2011).
Figure 16. Floating drum digester (Bond and Templeton, 2011)
The balloon plant has a rubber or plastic bag (balloon), which is heat-sealed, as a combination of
gas-container and digester. The inlet and outlet pipe is attached directly to the balloon and gas is
stored in the upper part of the balloon. An illustration of a balloon or tube digester can be seen
in figure 17. A balloon digester has an expected lifetime around 2-5 years (Energypedia, 2015).

-21-
Figure 17. Tube or balloon digester (Bond and Templeton, 2011)
Compared with the efficiency of a three-stone fire, which has an efficiency of approximately
15%, the efficiency of biogas stoves is between 20-56 %, depending on the design of the stove
(Bond and Templeton, 2011). The gas also has a cleaner combustion. (WHO, 2006) The price of
a gas stove can vary between 20-200 USD, and several stoves are available for a price between
20-45 USD. The life expectancy of a gas stove is between 4-8 years, where 7 years is most
represented. The capacity of the stoves varies between 1-40 L. (GACC, 2015b)
It requires 1500–2400 L of biogas per day in order for a family of five members to cook two
meals per day. The lower value corresponds with a minimum of one pig, 130 chicken, 35 people
or five cows (Bond and Templeton, 2011). Biogas production from different organic materials is
listed in table 7.
Table 7. Biogas production from selected substrates (Bond and Templeton, 2011) (b) the amount of
biogas from corn is based on biogas containing 55 % methane.
Pigs have the highest biogas yield per kg dry matter, 3.6-4.8 m3. All other selected substrates have
a biogas yield of 0.2-0.86 m3 per dry matter, which is significantly lower. From a biogas point of
view, owning a pig is superior to other animals. The biogas digester can produce biogas from a
combination of organic material and will also work as a way of waste disposal.
Corn gives 0.25 m3 biogas per kg dry matter or more. This gas has an energy content of a
minimum of 5.25 MJ/m3 (LHV of biogas is 21 MJ/m3 or more). Given a gas stove with
Substrate
Daily
production
(kg/animal) 𝐌𝐂𝐰𝐞𝐭 (%)
Dry
Matter,
DM (%)
Biogas (yield)
(m3/kg DM)
Pig manure 2 0.83 17 3.6–4.8
Cow manure 8 0.84 16 0.2-0.3
Chicken
manure 0.08 0.75 25 0.35-0.8
Human
excrement 0.5 0.8 20 0.35-0.5
Straw, grass
0.2 80 0.4
Corn cobs
52-80 20-48 0.25-0.4 (b)
Barley
62-75 25-38 0.62-0.86
Rye
54-67 33-46 0.67-0.68

-22-
efficiency of 30 % this gives 1.58 MJ (see equation 8) transferred to the actual food that is to be
prepared. By burning corn cobs directly in a TSF with the efficiency of 15 %, 2.64 MJ (see
equation 8) will be transferred to the food, which is more but biogas can convert some of the
energy in animal or human manure to biogas that can be utilized and therefore more energy will
be extracted from the household’s total waste with a biogas digester compared to only using a
TSF.
Biogas plants with sizes between 4 m3 – 15 m3, producing 1000-3500 L of gas per day have
investment costs of approximately 500-1000 EUR, which corresponds to 550-1100 USD. The
investment cost is depending on plant size, construction materials available, local salaries among
other things. A small biogas plant of 4 m3 can produce between 800-1600 L of gas per day and is,
according to Ghimire (2012) sufficient for a family of 4-5 members (Ghimire, 2012).
Biogas can be an alternative to burning wood when cooking in some households. A field study in
Kenya showed that bio gas cannot entirely replace the use of burning wood for the community,
but can, together with other solutions, play an important role in building a sustainable energy
system (Blume, 2010).
In rural areas of Africa it is not possible to produce biogas in the way it is done in industrial
countries, where it is done at a large scale and mainly for producing automotive fuel. But there
are possibilities for individual households to produce biogas at a small scale, using faeces from
animals and humans, waste from plants and food remainders (Blume, 2010).
There is potential for biogas production in Mozambique, though there is not a long tradition to
build on. One biogas project in Bilibiza, Mozambique, where the supply of animal manure was
scarce, residues from seeds and food as well as other organic material was used, aimed at
producing biogas for cooking purposes. The project was successful in that it, among other things,
obtained biogas system that could produce gas for cooking for both smaller and larger
institutions in rural Mozambique (EPP, 2013).
In rural areas, biogas is most commonly used for cooking, although it might also be utilised for
illumination (Ghimire, 2012). It is not obvious how much biogas digesters can reduce
deforestation, but according to (Subedi, 2014) biogas can reduce 9-35% of global deforestation
by 2030.
According to Ghimire, in 2012, fixed dome biogas plants are the most suitable for habitants in
rural areas with no electricity. These biogas plants are considered expensive since they require a
high investment cost and prices vary around 1000 EUR, which is equal to 1100 USD. This is true
for biogas plants in African countries, with a size between 4 m3 to 15 m3 and produces 1000-3500
L of gas per day. Because they have a long lifetime and are reliable they are, despite the high
initial investment, considered to be a good choice for rural areas.
3.3.3 Wood stoves
As mentioned earlier, Three-Stone Fire (TSF) is the most common way of cooking on Inhaca
Island. In order to reduce the usage of firewood when cooking, it is possible to install an
improved biomass cook stove. The stove has an improved efficiency compared to the TSF
(Johnels and Murray, 2013). Energy efficiency is defined as the thermal energy converted to the
pot in relation to the total energy provided by the fuel. Another way of defining efficiency is how

-23-
much fuel is saved with the improved cooking stove compared to the TSF. This is often of
greater interest for the consumer (Energypedia, 2014). Higher efficiency is achieved by
concentrating the heat from the fire directly onto the pot (Johnels and Murray, 2013). Today
there are approximately 50 different types of improved cook stoves, which vary in design and
materials. There are mainly two different types of efficient biomass cook stoves; improved cook
stoves and manufactured rocket stoves (Differ group, 2012).
Improved cook stoves are often produced locally by artisans, which reduces production and retail
costs as well as the need for transportation. Improved cook stoves have a closed combustion
chamber and alternatively a chimney that can lead dangerous particles out of the room, see figure
18. (Johnels and Murray, 2013). The design can vary between small ceramic bowls to larger
installations and the durability is between one to ten years. The price can be 1-100 USD
depending on design and durability. Materials used in different designs are ceramic, clay, bricks,
dung and metal (Differ group, 2012).
Figure 18. Improved cook stove (Ramachandra, 1998)
Manufactured rocket stoves are based on the rocket stove design and are produced in factories.
In table 8 the materials for manufactured rocket stoves are listed. Materials can be plastics and
metal and the price vary between 10-80 USD with an average price of 30 USD. A disadvantage is
that the manufactured rocket stoves can be relatively expensive for financially weak customers
(Differ group, 2012).
The rocket stove has a tall, insulated combustion chamber with a fuel magazine, which only
enables twigs and tall wood with a small diameter and is illustrated in figure 19 (Solar Cookers
International Network, 2015, b). The small opening that the fuel magazine provides creates a
draft of air through the chamber, which supplies the fire with oxygen (Johnels and Murray, 2013).
Some rocket stoves also have a skirt around the pot in order to lead the heat along the sides of
the pot, which increases the efficiency (Solar Cookers International, 2015, b). Solar Cookers
International (2015, b) states that the rocket stove has approximately twice the efficiency of the
TSF. Similar results have been reported from Sunseed Tanzania (2015), pointing out that the
rocket stove saves between 40-50% of the fuel wood compared to the TSF. This leads to an
efficiency of approximately 30% for the rocket stove compared with the 15 % for the TSF.
Table 8. A summary of the data presented in the text. (Differ group, 2012)

-24-
Type of stove Manufactured rocket stoves Improved cook stoves
Price 10-80 USD (average 30 USD) 1-100 USD
Materials Plastics and metal Ceramic, clay, bricks, dung and metal
Figure 19. A manufactured rocket stove with a tall combustion chamber and a small fuel magazine. (Solar
Cookers International Network, 2015, b).
In an article, the Differ group (2012) refers to a field study, comparing improved cook stoves
with manufactured rocket stoves in rural Uganda and Tanzania. The study was conducted by
International Energy Initiative, which is a non-governmental organisation and consists of
recognized energy experts (International Energy Initiative, 2010). In the study the improved cook
stove and the manufactured rocket stove were tested when cooking an average amount of
traditional food compared to the TSF. Cooking time, fuel reduction, price and durability were
measured among other things. Some of the results from the study are summarised in table 9. It
shows that the improved stove requires 22 minutes extra when cooking compared to the TSF,
and that there is a saving of 46 % of the fuel. The improved cook stove has an expected lifetime
of three years and a price of 20-22 USD. The manufactured rocket stoves save less fuel compared
to the improved cook stove but do not acquire as much time when cooking. The expected
lifetime for the manufactured rocket stove is two years and it has the same price as the improved
cook stove.
Table 9. The results from a field study in rural Uganda and Tanzania. (Differ group, 2012).
Indicators Improved cook stove Manufactured rocket stove
Fuel reduction -46% -38%
Cooking time + 22 min + 1 min
Durability 3 years 2 years
Price USD 20-22 USD 20-22

-25-
4 Methodology
An overview of the methodology of the project is illustrated in figure 20.
Figure 20. Different stages of the project
The literature study gives a background to the situation in Mozambique, Inhaca, wood use in
general and technical aspects of alternative renewable cooking solutions. A more exact mapping
of the current energy situation on the island was made during the minor field study. Results were
calculated and an analysis and suggestions of suitable alternative cooking solutions for different
groups is developed.
4.1 Minor Field Study
The minor field study is the main part of the methodology. Mapping of the energy situation and
interviews with the locals were conducted on Inhaca Island in Mozambique. The focus of the
interviews was to understand the current situation in the households regarding fuel consumption,
energy access, cooking practices, awareness of the on-going deforestation, attitudes towards
efficiency improvements together with alternate ways of preparing the food, amount of
agriculture, number of animals, financial status and time spent on different food related activities.
The questionnaire can be found in appendix A. These interviews were conducted to get an
understanding of the potential for improvements in the households, together with the financial
and physical marginal available for a new cooking solution.
By interviewing 25 families, approximately 4 % of the 5000 inhabitants was included in the study.
Interviews were made in all three areas of the island; 11 in Nhakene, 6 in Ribjêne and 8 in
Inguane. The interviews were made together with an interpreter, a student who grew up on the
island. The mother or the father of the families have been the ones answering the questions.
Besides the interview, the families estimated both their agricultural waste and were also asked to
collect a bundle of wood that would last for one day, or estimate how many days an already
prepared bundle of wood would last. The bundles were then weighed with a hanging scale.
An interview was also made with the local distributors of fuels used for cooking. This was done
in order to estimate the amount of different fuels sold on the island.
4.2 Methodology of results and discussion
The interviews and the measurements of wood have provided the base of the results and analysis.
Results are presented by first giving an overview of the current situation, attitudes and practices,
and thereafter an analysis on how an implementation of the alternative solutions lifted in this
Literature studyMinor Field
StudyResults and
AnalysisSensitivity analysis
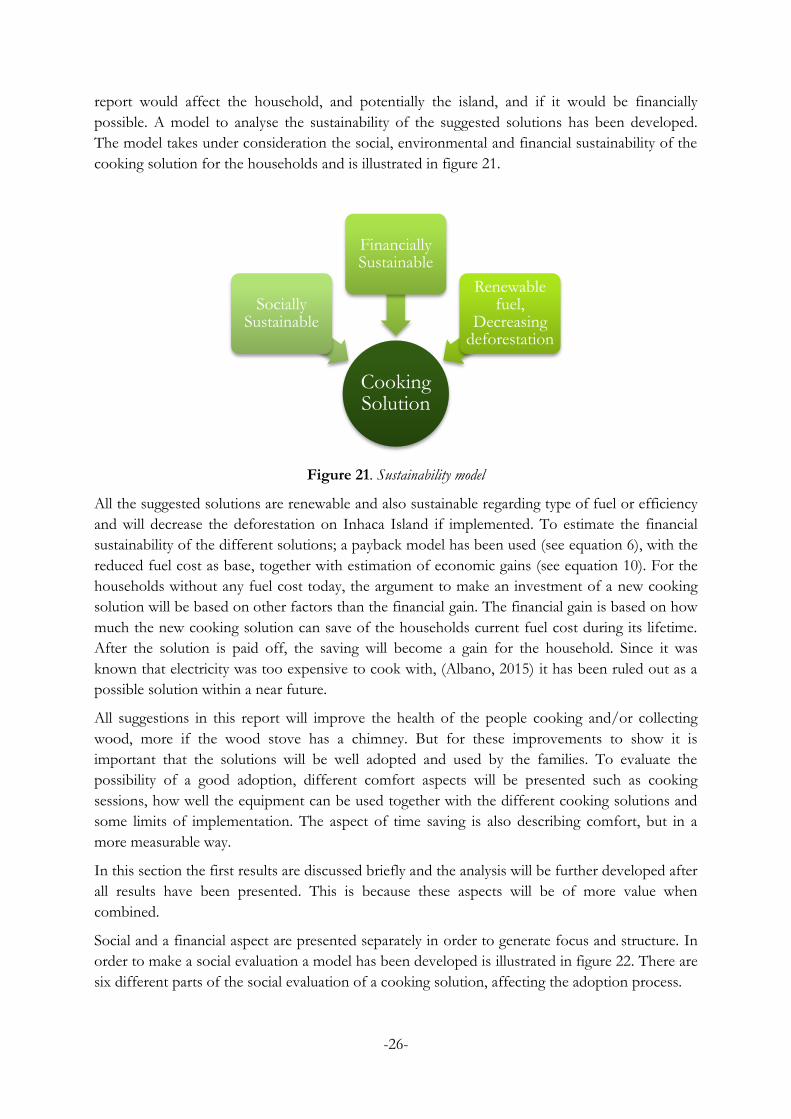
-26-
report would affect the household, and potentially the island, and if it would be financially
possible. A model to analyse the sustainability of the suggested solutions has been developed.
The model takes under consideration the social, environmental and financial sustainability of the
cooking solution for the households and is illustrated in figure 21.
Figure 21. Sustainability model
All the suggested solutions are renewable and also sustainable regarding type of fuel or efficiency
and will decrease the deforestation on Inhaca Island if implemented. To estimate the financial
sustainability of the different solutions; a payback model has been used (see equation 6), with the
reduced fuel cost as base, together with estimation of economic gains (see equation 10). For the
households without any fuel cost today, the argument to make an investment of a new cooking
solution will be based on other factors than the financial gain. The financial gain is based on how
much the new cooking solution can save of the households current fuel cost during its lifetime.
After the solution is paid off, the saving will become a gain for the household. Since it was
known that electricity was too expensive to cook with, (Albano, 2015) it has been ruled out as a
possible solution within a near future.
All suggestions in this report will improve the health of the people cooking and/or collecting
wood, more if the wood stove has a chimney. But for these improvements to show it is
important that the solutions will be well adopted and used by the families. To evaluate the
possibility of a good adoption, different comfort aspects will be presented such as cooking
sessions, how well the equipment can be used together with the different cooking solutions and
some limits of implementation. The aspect of time saving is also describing comfort, but in a
more measurable way.
In this section the first results are discussed briefly and the analysis will be further developed after
all results have been presented. This is because these aspects will be of more value when
combined.
Social and a financial aspect are presented separately in order to generate focus and structure. In
order to make a social evaluation a model has been developed is illustrated in figure 22. There are
six different parts of the social evaluation of a cooking solution, affecting the adoption process.
Cooking Solution
Socially Sustainable
Financially Sustainable
Renewable fuel,
Decreasing deforestation

-27-
The need of education is a factor since it will take time and it requires someone who can
educate and have time to spare for educating.
Equipment compatibility is evaluating how well the households’ present cooking
equipment, such as pans and pots, is compatible with the different new cooking solutions.
Usability is about whether the cooking solution is easy to use or not, or if the solution
enables frying, boiling and smoking.
The social dimension regarding time describes if there will be timesaving or losses when
using the cooking solution. Both the collecting time and the cooking time have been
included in the calculations and have been calculated with equation 9.
Cooking pattern refers to how often the families are cooking and is affected by the
cooking time of the solution. If the solution is a fast way of cooking, the cooking pattern
can be adjusted to the family’s needs, but if the solution takes more time when cooking
the families will have to plan more ahead and they might be forced to cook less and
during a longer time.
Health is the last factor and addresses the health problems from breathing in smoke.
These health problems can be decreased with all the solution and therefore better health
is an incentive for all the cooking solution presented in this report and will not be
compared between the different solutions.
Figure 22. Model regarding social sustainability
These different cooking solutions have been rated regarding the five different social aspects,
excluding health since all the solutions will have positive health impact. Education need has been
evaluated accordingly: “Much needed” equals one, “Needed” equals two and “Not needed”
equals three. The other four aspects are evaluated with “Worse” equals one, “Same” equals two
and “Better” equals three. The different rankings for each cooking solution are added to a total
number, and the higher number, the better. This has been summarised in table 14.
Socially Sustainable
cooking method
Equipment compatibility
Time
Cooking pattern
Usability
Health
Education

-28-
4.3 Boundaries of the study
By limiting the suggested cooking methods to only renewable methods it may be possible that a
more socially and financially beneficial solution for the individual household is overlooked. To
only look at cooking methods may miss other important changes that would decrease the
deforestation with a smaller investment. Not all renewable fuels available on the market have
been investigated and the solutions mentioned in this report are focused on cooking methods
that are using fuels or raw materials already available on the island instead of ones that need to be
imported from the mainland. Electricity has not been investigated because of the assumption that
it is too expensive to cook with today, which is confirmed by families interviewed.
Within renewable cooking solutions the focus has been on biogas, solar cookers and wood
stoves. These three solutions have been evaluated since they are the most used rural cooking
options to TSF (Differ group, 2012). It is also important to limit the solutions in order for the
report to have enough depth.
It has been assumed that households will make the investments alone and not that several
households go together, which could be something that affects the outcome. Although it might
be a possible way of financing a cooking solution, it is not known if that is possible for all
households to go together.
Concerning the time saved or lost due to the new cooking solution, the cooking times are
collected from different sources and they might not be applicable for all cases. Also the time it
takes to take care of the new cooking solution has not been considered when calculating the time
savings or time losses since there is very little information about this and because it is assumed
that it will not have a great affect on the results.
4.3.1 Questionnaire
During the interviews, a questionnaire has been used and can be found in appendix A. The
quality of the interviews is affected by different risks.
One risk is the language barrier. All interviews were made with help from a translator; this gives
two steps of translation, opening up the risk for misunderstandings both ways. To avoid this,
interviews were made slowly and with the use of different examples. This can lead to limitations
of the answers.
Many of the questions were based on estimations from the person who was interviewed.
Estimations can be hard to make and can result in eventual errors in the data. Also, many women
found it difficult to estimate income and expenditures of the household because it is often the
men who earn the income. This can give some uncertainty to financial assets of the household.
Three groups with different levels of fuel expenditures were created based on the stated levels of
fuel expenditures of the households. The group who spend 50 USD on fuel per year was created
at that level since creating a group with a lower level of annual fuel expense would not contribute
with much further information compared to the group without fuel expense. The highest group,
of 500 USD, was created from the highest level of fuel expense rounded down. The middle
group, with a fuel expense of 200 USD per year, was created from the average fuel expense, with
families without fuel expense excluded.

-29-
Many questions in the questionnaire are open, in order to not lock the households into pre stated
answers. This can increase the risk that people do not understand the question or forget one of
several possible answers. As an example they might have known about the phenomena biogas,
but not that it is called biogas. There is also a risk of interviewees trying to give an answer that
they think is wanted from them rather than the truthful answer.
Three different areas of the island have been covered; Nhakene, Ribjêne and Inguane. In
Nhakene 11 interviews were conducted, in Ribjêne six interviews were and eight interviews were
conducted in Inguane. All the households interviewed where close to each other in their different
areas. The answers did not differ much between the different areas and therefor the authors of
this report evaluated that the interviews conducted would be sufficient.

-30-
4.4 Equations
Equation 1.
𝑀𝐶𝑑𝑟𝑦 : 𝑊𝑒𝑡 𝑤𝑒𝑖𝑔ℎ𝑡−𝐷𝑟𝑦 𝑤𝑒𝑖𝑔ℎ𝑡
𝐷𝑟𝑦 𝑤𝑒𝑖𝑔ℎ𝑡 [%]
(Rosillo-Calle and Woods, 2007)
Equation 2.
𝑀𝐶𝑤𝑒𝑡 : 𝑊𝑒𝑡 𝑤𝑒𝑖𝑔ℎ𝑡−𝐷𝑟𝑦 𝑤𝑒𝑖𝑔ℎ𝑡
𝑊𝑒𝑡 𝑤𝑒𝑖𝑔ℎ𝑡 [%]
(Rosillo-Calle and Woods, 2007)
Equation 3.
𝐿𝐻𝑉𝑤𝑒𝑡 = 𝐿𝐻𝑉𝑑𝑟𝑦(1 − 𝑀𝐶𝑤𝑒𝑡) − 2.447𝑀𝐶𝑤𝑒𝑡 [MJ/kg]
(Sokhansanj, 2011)
Equation 4. Arithmetic mean value
Equation 4 calculates the sample mean and gives an estimate of the average answer received
during the interviews. It is highly affected by extreme values but on the other hand it includes all
answers received.
�̅� =1
𝑛∑ 𝑥𝑗
𝑛
𝑗=1
(Matematisk statistik, 2005)
Equation 5. Standard deviation
Standard deviation is calculated to quantify the variation in the data used to calculate the mean. A
high standard deviation implies a wide spread of the values in the sample.
𝑠 = √1
𝑛 − 1∑(𝑥𝑗 − �̅�)2
𝑛
𝑗=1
(Matematisk statistik, 2005)
Equation 6. Payback time
The payback method is used to calculate the time it takes for an investment to pay back the
investment cost, G.
𝑃𝐵 =𝐺
𝑆𝑎𝑣𝑖𝑛𝑔 [Years]

-31-
(Skärvad and Olsson, 2013)
Equation 7. Energy use in household
To calculate the energy use from wood for one person during one day, equation 7 has been used.
Due to the tropical climate on Inhaca Island all wood that is dried and burnt in the households
have an LHV of 14.6 MJ/kg. Using the average wood consumption per day and person from the
interviews, f, the total energy released from the fire to cover the need for one person for one day
can be calculated. Also agricultural waste can be burned but is not included in the study regarding
wood use.
𝐸𝑢𝑠𝑒 = 𝐿𝐻𝑉 ∙ 𝑓 [MJ]
Equation 8. Energy need for one person during one day
Assuming an efficiency of 15 % when using a TSF the actual energy need for one person during
one day can be calculated. This, to make it possible to compare with other energy sources or
cooking methods available.
𝐸𝑛𝑒𝑒𝑑 = 𝐿𝐻𝑉 ∙ 𝑓 ∙ 𝜂𝑐𝑜𝑜𝑘𝑖𝑛𝑔 𝑚𝑒𝑡ℎ𝑜𝑑 [MJ]
Equation 9. Time saved or lost by a cooking solution
𝑡𝑑𝑖𝑓𝑓 = 𝑡𝑐𝑜𝑙𝑙𝑒𝑐𝑡 ∗ 𝐸𝑥𝑝𝑒𝑐𝑡𝑒𝑑 𝑓𝑢𝑒𝑙 𝑠𝑎𝑣𝑖𝑛𝑔 + 𝑡𝑡ℎ𝑟𝑒𝑒 𝑠𝑡𝑜𝑛𝑒 𝑓𝑖𝑟𝑒 − 𝑡𝑐𝑜𝑜𝑘𝑖𝑛𝑔 𝑚𝑒𝑡ℎ𝑜𝑑 [h/month]
When calculating the time savings and time losses per month, referred to as 𝑡𝑑𝑖𝑓𝑓, both the
collecting time and the cooking time per month has been included. The collecting time per
month for each cooking solution is dependent on the expected fuel savings due to the new
cooking solution. If the new cooking solution saves a certain percentage of the fuel used when
cooking with the TSF, it is assumed that time saved due to reduced collecting time is the
collecting time multiplied with the percentage of fuel saved. For example it is stated that the solar
cookers will reduce the fuel consumption by 25 % and therefore the time saved due to reduced
collecting time will be the collecting time for the TSF, which is 29 h, multiplied with 25 %.
Concerning the cooking time, each cooking solution’s cooking time per month has been
compared to the cooking time per month for the TSF. If the cooking time of the new cooking
solution, 𝑡𝑐𝑜𝑜𝑘𝑖𝑛𝑔 𝑚𝑒𝑡ℎ𝑜𝑑, would exceed the cooking time for the TSF, 𝑡𝑡ℎ𝑟𝑒𝑒 𝑠𝑡𝑜𝑛𝑒 𝑓𝑖𝑟𝑒, the time
saved will be less and if there is a time loss it is due to 𝑡𝑐𝑜𝑜𝑘𝑖𝑛𝑔 𝑚𝑒𝑡ℎ𝑜𝑑 being to great.
The time that is spent on taking care of the new cooking solution has not been included in this
equation. This is because is not known how much time is required for the different cooking
solutions.
Equation 10. Economic Gain
𝑃 = (𝐿𝑇 − 𝑃𝐵) ∗ 𝑆𝑎𝑣𝑖𝑛𝑔 [USD]

-32-
The Economic Gain describes the total money saved due to purchasing a new cooking solution. The economic gain is calculated by multiplying the difference between the life time of a new cooking solution and the payback time of the cooking solution with the annual savings due to the investment. In order to generate a positive economic gain the lifetime has to be greater than the payback time or otherwise the cooking solution will not be financially recommendable. Equation 11. Biogas production
During the interviews, all families were asked to estimate the total amount of agricultural waste
created during one year. The amount of waste is the divided with 365, the number of days in a
year, to estimate the average amount of agricultural waste. This is a limitation since the amount of
waste per day can vary, depending on harvest seasons and access to different kinds of waste. All
agricultural waste is assumed to have the LHV of 0.32 m3/kg because the type of agricultural
waste vas sometimes not specified. This is added to the biogas yield, percentage of dry matter and
amount of manure from humans and animals that belong to the household to calculate the total
biogas yield possible from the waste and manure from the household
𝐵𝑖𝑜𝑔𝑎𝑠 =𝑤𝑎𝑠𝑡𝑒
365∗ 0.32 + ∑ 𝑗4
𝑗=1 ∗ 𝑏𝑖𝑜𝑔𝑎𝑠𝑦𝑖𝑒𝑙𝑑 ∗ 𝐷𝑀 [liter/person]
Equation 12. Cost for electricity
Assuming that a month has 30 days, equation 12 will estimate the cost for electricity for one
month for an average person.
𝐶 = 𝑡𝑎𝑟𝑖𝑓𝑓 ∗ 𝐸𝑛𝑒𝑒𝑑 ∗ 30
[USD/month]
Equation 13. Saving
The saving is the annual saving due to an investment in a new cooking solution and is dependent
on the annual fuel expense. The saving is calculated by multiplying the annual fuel expense with
the expected fuel savings, which is measured in percentage.
𝑆𝑎𝑣𝑖𝑛𝑔 = 𝐸𝑥𝑝𝑒𝑐𝑡𝑒𝑑 𝑓𝑢𝑎𝑙 𝑠𝑎𝑣𝑖𝑛𝑔 ∗ 𝐴𝑛𝑛𝑢𝑎𝑙 𝑓𝑢𝑒𝑙 𝑒𝑥𝑝𝑒𝑛𝑠𝑒 [USD/year]
5 Results and discussion
In this section, the findings from the field study will be presented and analysed. In the end there
will be a final analysis and recommendation of the renewable alternatives presented in the
literature study and based on social and financial aspects.
5.1 Current energy use, social patterns and attitudes
Table 10. Fuels sold on Inhaca Island that are used for cooking
Period LPG (kg/month)
Petrol
(litre/month)
Charcoal
(kg/month)
Summer 1200 150 350
Winter 400 150 210

-33-
In the summer months; tourists make visits to the island, which explains the increased usage of
more expensive fuels during these months for LPG and charcoal. The use of petrol does not vary
over the year, which can be due to petrol being primarily used to start the fires, not for the actual
cooking. This might be because these fuels are used by businesses on the island and not by
people in their everyday life.
Table 11. The number of households interviewed using different types of fuels
Fuels used by the households N % of all households
Electricity 3 12%
Natural gas 0 0%
Gas, LPG 3 12%
Ethanol, Methanol 0 0%
Kerosene 0 0%
Coal 0 0%
Charcoal 2 8%
Wood 25 100%
Crop waste 19 76%
Table 11 shows the number of households interviewed using different types of fuel. Fuel
categories are based on the energy ladder. The results confirm the importance of wood for
cooking activities. All households rely on firewood for cooking, sometimes in combination with
other types of fuel such as crop waste, charcoal, gas or electricity. Out of the households
interviewed 76% sometimes use crop waste as a fuel and no households use dung as a fuel for
cooking. Crop waste is not considered a reliable source of energy by the families, but more a way
of waste disposal. The use of more efficient and convenient fuels is mainly for cooking food that
takes short time and therefore does not require much fuel. Out of the families interviewed 88%
have electricity but only 12 % use electricity for cooking sometimes. Just like in the study by
Prasad in 2008, people on Inhaca Island use the electricity primarily for lighting, TV, radio and
few other appliances instead of for the more energy intensive activities.
The average amount of wood consumed per day and person is 1.37 kg with a standard deviation,
s = 0.57 kg (equation 5). All families interviewed use open fire/TSF with the assumed efficiency
of 15 %. This implies an energy use for cooking of 20 MJ/ person and day, s = 8.25 MJ/ person
and day (see equation 7). For the island’s entire population of 5000 people, this gives a total
wood consumption of 2.5 ton, s = 1 ton, per year. This estimation is based on the assumption
that all inhabitants use a TSF to combust the firewood. If electricity was to be used instead, and
assuming 100 % efficiency instead of 15 %, this would mean an energy need per person of 3 MJ,
𝑠 =1.23 MJ/ person and day (see equation 8 and 5). The cost to replace the average wood
consumption for one person with electricity during one month is 2.25 USD, approximately 80
MTZ (see appendix C and equation 12). For the average family in the study with the size of 7
people the total energy need covered by wood is 21 MJ per day and to replace this with pre-paid
electricity would cost 15.75 USD per month (=556 MZT per month). Replacing the wood with
LPG or petrol is not a renewable solution and will therefore not be investigated.
The energy ladder model suggests that increased affluence will cause a progression towards more
efficient fuels. During the interviews it has been clear that the choice of fuel is not solemnly
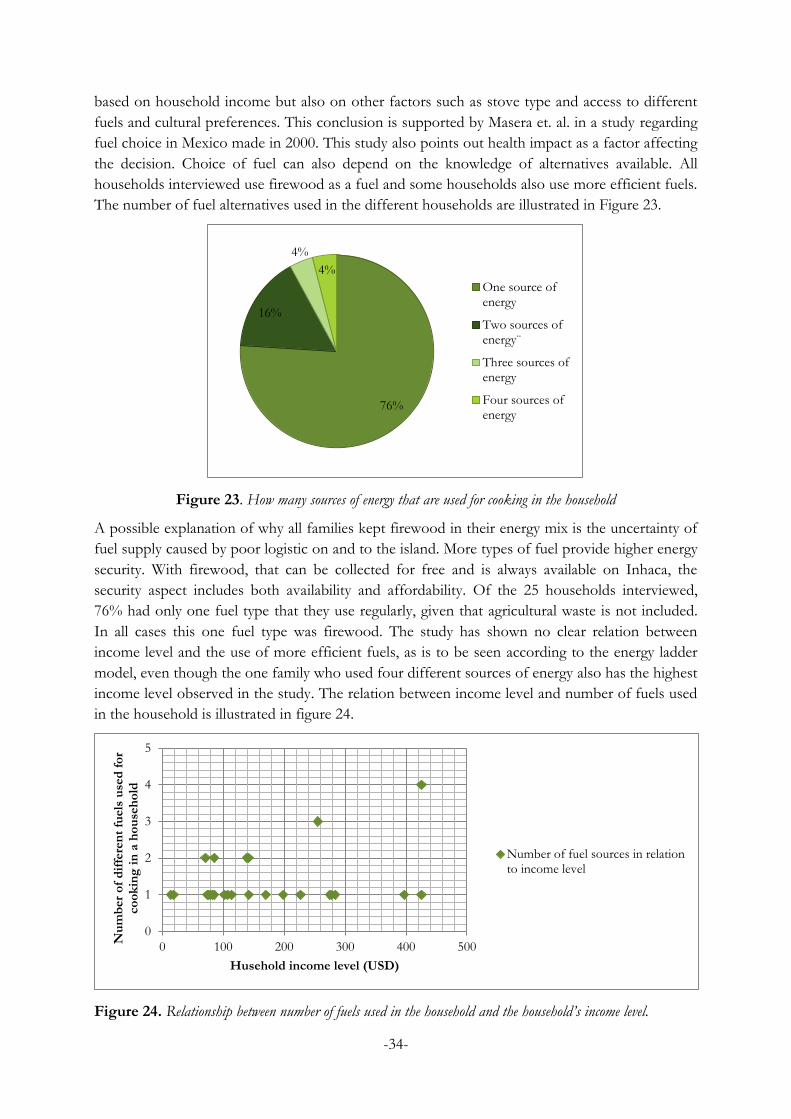
-34-
based on household income but also on other factors such as stove type and access to different
fuels and cultural preferences. This conclusion is supported by Masera et. al. in a study regarding
fuel choice in Mexico made in 2000. This study also points out health impact as a factor affecting
the decision. Choice of fuel can also depend on the knowledge of alternatives available. All
households interviewed use firewood as a fuel and some households also use more efficient fuels.
The number of fuel alternatives used in the different households are illustrated in Figure 23.
Figure 23. How many sources of energy that are used for cooking in the household
A possible explanation of why all families kept firewood in their energy mix is the uncertainty of
fuel supply caused by poor logistic on and to the island. More types of fuel provide higher energy
security. With firewood, that can be collected for free and is always available on Inhaca, the
security aspect includes both availability and affordability. Of the 25 households interviewed,
76% had only one fuel type that they use regularly, given that agricultural waste is not included.
In all cases this one fuel type was firewood. The study has shown no clear relation between
income level and the use of more efficient fuels, as is to be seen according to the energy ladder
model, even though the one family who used four different sources of energy also has the highest
income level observed in the study. The relation between income level and number of fuels used
in the household is illustrated in figure 24.
Figure 24. Relationship between number of fuels used in the household and the household’s income level.
76%
16%
4%
4%
One source ofenergy
Two sources ofenergy¨
Three sources ofenergy
Four sources ofenergy
0
1
2
3
4
5
0 100 200 300 400 500
Nu
mb
er
of
dif
fere
nt
fuels
use
d f
or
co
ok
ing
in
a h
ou
seh
old
Husehold income level (USD)
Number of fuel sources in relationto income level

-35-
The vertical axis shows the number of different fuels used by the household and is therefore also
a scale of energy security. The horizontal axis is a scale showing increasing income levels for the
households. The households with the highest monthly income levels of 15 000 MTZ (= 425
USD, see appendix C) are represented in both the group who use only firewood for cooking and
in the group who use four types of fuel for cooking (firewood, charcoal, gas and electricity). An
argument that families with more money are more interested to buy a new cooking device to
increase their energy security is therefore not so probable and this also implies the impact of
other factors when making the choice between fuels and about how many different types of fuels
to use in the household.
Higher energy security is improving life quality, according to Wentzel and Pouris (2007), and
families with low energy security would therefore be more probable to want a stove using a
different fuel as an alternative to firewood. This effect is reduced by the fact that firewood is
always available on Inhaca Island and all families therefore have a high energy security to begin
with.
Table 12 contains annual levels of income and expenses. The lowest income level found is only
3% of the highest income level found in the study. The highest annual income level in the study,
5102 USD, is significantly higher than the average annual income in Mozambique of 1200 USD
(CIA,2014) but is almost a third of the global median annual household income of 14.700 USD
(Gye, 2012). The low income levels can possibly be an additional explanation to why the
households in the study do not follow the pattern of the energy ladder model regarding fuel
choice in relation to income. The model might be more applicable when the range of income
level is wider because all alternative fuels were always available.
Of the 25 households participating in the study, 9 spend money on fuel used for cooking
activities. The average fuel expense among these households is 197.5 USD annually and this gives
room for cost savings by reduction of the fuel consumption or by switching to other less
expensive fuels. The 16 families, who do not spend money on fuel for cooking, but collect free
wood to cover their energy demand, only have the kitchen expense of pots, spoons and plates or
other things that might be needed in the kitchen. The annual average spent on kitchen appliances
of 15.4 USD is an approximation, estimated by the households, and several pointed out the
difficulty because this cost is often a rare, large and long term investment. As an example, a
cauldron can cost 37 USD. All visited families had one, and it can last ten years or more. This can
be a sign that if the families believe something to be an important investment, they will save
money to buy it.
Many of the men on the island work as fishermen and are the ones who earn the household’s
income. This gives them the responsibility of the financials and it is therefore important to also
make the men in the households understand the benefits of a renewed way of cooking.
Table 12. Household financials
Household financials (annual) MZN USD
Average household income 73 272 2 076.9
Average expense for kitchen appliances 544 15.4
Average fuel expense (if not free) 6 967 197.5
Highest level of household income 180 000 5 102
Lowest level of household income 6 000 170.1

-36-
Approximately 60% of the interviewed families are cooking two times per day and the rest are
cooking three times per day. The average time spent per day on cooking is 4.4 h, which is a
consequence of the extensive use of boiling as a cooking method. According to estimations made
by the households interviewed, the average time per month spent on collecting firewood is 29
hours per household; this is equivalent to more than 3 full work days per month spent on
collecting firewood. Cooking and firewood collection is considered the woman’s responsibility
and all firewood collectors in the study are women. A reduction of the need to collect firewood
will also lead to a decreased risk of injuries or encounters with dangerous animals in the forest.
Table 13. Average cooking times and frequencies for different common dishes observed on Inhaca Island
Dish Cooking time (min) Frequency (sessions/month)
Matapa 98 5
Beans 144 3
Seafood 43 27
Corn meal/ Porridge 68 7
Rice 28 21
Cooking methods are varied and the methods; boiling, frying and smoking have been mentioned.
Table 13 lists the dishes stated to be most common on the island. Matapa, beans, rice and corn
meal/porridge are all dishes prepared through boiling and also seafood is sometimes prepared
through boiling, other times through frying or smoking. Families without refrigerators, which are
44 % of the households, also use smoking as a way of food preservation.
Figure 25. Answers to the question “Do you see a problem with the current use of firewood on Inhaca and the
deforestation?”
Of the households interviewed, 68 % answered yes to the question if they see a problem with the
current use of firewood on Inhaca and the deforestation. This is illustrated in figure 25. Out of
the households answering no to this question, some said that the rangers were an even bigger
problem, preventing them from collecting wood where they pleased (inside the natural reserve).
This reveals a gap in the understanding of the purpose of the rangers for some people living on
the island. The natural reserve may have increased the awareness of the importance of the nature
on the island and also the need to conserve it but more education is needed.
Of the households relying solemnly on firewood for cooking, many stated to have “no
alternatives” to firewood, insinuating a will to change if they were given an alternative or maybe
68%
32%Yes
No

-37-
just a feeling of hopelessness. The awareness of the deforestation may be a reason to want an
alternative cooking method. The household can also be driven to get an alternative cooking
method by the fear of the rangers and the risk of being caught collecting the firewood resulting in
a fine.
In spite of the awareness of the deforestation and the respect for the rangers only approximately
half (56 %) of the households have ever considered doing something to improve efficiency when
cooking and thereby reducing their need for firewood. Other fuels available on the island such as
gas, petrol or electricity are considered too expensive and many therefore choose to do nothing.
Only 44 % are prepared to spend more time on cooking to save fuel even if the alternative way
of cooking would need less care (less work). This implies that there is still resistance in changing
the way of life, which will make it harder to implement a cooking solution that is very different
from the one that is used today, TSF.
5.2 Social evaluation
In this section different cooking solutions presented in the literature study will be evaluated from
a social perspective. The three different solutions will be analysed separately.
5.2.1 Solar Cookers
Solar cookers are not something that is similar to what the habitants of Inhaca are using today.
This might be barrier when implementing this cooking solution since there is little or no
knowledge of solar cookers, hence education of the households is needed.
Equipment used for cooking among the households interviewed where pans, pots and caldrons.
When using solar cookers, it is an advantage if the cooking pot is black since this increases the
efficiency, as mentioned earlier. Existing pots can therefore be painted black to increase the
efficiency. Some of the pans or pots might not fit inside the solar cooker and even if they can, the
box and panel cooker cannot fry food. Only the parabolic cooker can fry food, but in a pot, since
the equipment is hanged. None of the solar cookers can smoke food. This will limit the usability
of the solar cookers. The ability to smoke food is important because it is a preservation method
and 44 % of the households do not have a fridge.
The most frequent dish on the island is seafood. The seafood can be boiled, fried or smoked and
which is a disadvantage for the solar cookers. Rice is also common and is more suitable for a
solar cooker since a solar cooker is ideal for slow boiling food. This makes beans, matapa and
corn meal compatible foods to a solar cooker as well. Beans take long time and are therefore
consuming a large amount of wood and by using a solar cooker there is a large potential for
saving wood or increasing the frequency of eating beans on the island. Rice is cooked often and
the solar cooker could be used for some food every day since some of the foods - beans, matapa,
rice or porridge - are cooked at least once every day. Wentzel and Pouris (2007) confirm that
food that is cooked for a long time, and therefore uses a lot of fuel, is ideal for solar cooking.
There is no need for wood when using solar cookers, but since Wentzel and Pouris (2007)
reported that another study showed that solar cookers are generally used for 25 % of all cooking
activities in rural areas, there will only be 25 % decrease in fuel use. This will amount in 7.5 hours
per month saved from not collecting as much wood. However, panel and box cookers are more
time consuming when cooking than the TSF. The solar cookers can take 23 minutes longer each

-38-
cooking session without generating any time difference between TSF and solar cookers when the
collecting time is included. The parabolic cooker will most likely generate time savings since the
parabolic cooker SolSource can boil one litre of water in ten minutes for example (Solar Cookers
International, 2015, a). Even though box and panel solar cookers are the most time consuming
solar cooker alternatives, they might not require as much attention as cooking over open fire does
and the cooking time can therefore also be used for alternative activities. According to Wentzel
and Pouris (2007) there is a potential time saving using a solar cooker instead of cooking the
traditional way.
If the households on Inhaca where to cook with solar cookers, they might need to change their
cooking pattern since solar cookers are mostly slow cookers. With a slow cooking method, the
cooking pattern might change into fewer and longer sessions because many of the dishes would
take longer time to prepare. On the other hand the food cooked with a solar cooker can be left
unattended and other food can be cooked in the meantime, with the TSF, which means that the
households might be able to have the same cooking pattern as they do today. However,
concerning cooking pattern, the parabolic cooker has an advantage in comparison with the box
and panel cooker since it is a fast cooker and therefore does not need to change todays cooking
pattern.
5.2.2 Biogas
As presented earlier 12 % of the households use gas as an energy source for cooking and it can
be assumed that the other households that do not use gas still have knowledge about gas as an
energy source for cooking. Even though only one family of the 25 families interviewed knew of
biogas there might not be too difficult to understand how to use biogas, when produced, since
there is already a general knowledge about gas. However the families need to be educated about
the production of biogas and how to take care of the digester and this can be an experienced
obstacle. According to Bond and Templeton, 2011, a support network needs to be developed, in
order to repair and maintain the digesters and prevent them from decaying. At the same time it
can be an advantage that biogas is something new and the households might become curios and
willing to learn. This is depending on the attitude of the families and how the biogas concept is
presented.
When biogas is used as a cooking solution, a gas stove is needed. There are many different gas
stoves and there will be no adjustments needed of the household’s present cooking equipment.
The usage of biogas is dependent on bio mass such as agricultural waste and animal and human
manure. In the interviews the households estimated an average agricultural waste of 1.5 kg per
person and per year. Since one kilo of straw or corn produces approximately 400 L of biogas, 1.5
kg of agricultural waste will not produce more than approximately 600 L of biogas per year,
which is a very small contribution since 1500 L per day is needed for cooking two meals for a
family of five members (Bond and Templeton, 2011). Further on there are only seven of the 25
households that have enough animals in order to produce 300L of biogas or more per person and
day, statistics can be found in appendix B and equation 11 has been used, which is enough for
two meals per day (Bond and Templeton, 2011). This given that ducks and chicken produce the
same amount of manure, that food and agricultural waste have an approximate biogas yield of 0.4
and a DM (dry matter) of 80 % and also that 90 % of the waste and manure can be collected and
used in the bio digester. Goats are kept tied to trees far from the house and have therefore been

-39-
excluded from the animals contributing to the biogas production. The detailed statistics of the
different households’ animals can be seen in appendix B. Unfortunately only one household in
the study had both enough waste and manure to produce sufficient biogas to sustain the
household in combination with a current fuel expense large enough to create an economic gain.
With biogas it is possible to boil and fry, but it is not possible to smoke. This is a disadvantage, as
mentioned earlier. Further on, biogas requires planning ahead since the production of biogas
takes around 20-100 days compared to fire wood, which can be utilised the same day as collected,
but with lower efficiency because of the higher water content compared to dried fire wood (Bond
and Templeton, 2011). The fact that wood is collected and dried before it is used shows an ability
to plan the fuel consumption of the household, which suggests an ability to plan the biogas
production.
The use of biogas can generate time savings since it is not necessary to collect wood in order to
cook, which normally takes approximately 29 hours per month. Furthermore, the cooking time
with biogas will be less than the cooking time for a TSF since the families interviewed stated that
it takes approximately 15 minutes to start the fire, before being able to start cooking. The total
time saving will amount in 48 hours per month.
Since biogas is a faster way of cooking it is possible to have the same cooking patterns as before.
However the cooking patterns might change since the households do not need to plan as much
ahead, concerning when to start cooking, which is an advantage for the households since cooking
will not be as arduous as before.
5.2.3 Wood stoves
Since all of the households are using wood as primary energy source for cooking, the need for
education is smaller if implementing a wood stove compared to biogas or a solar cooker. The
time needed to educate the households will therefor probably be less than compared to the other
cooking solutions presented.
There are, as mentioned earlier, many different types of designs on wood stoves and therefore it
should not be a problem to adjust the design according to the households’ present culinary
equipment. This is an advantage when compared to solar cookers. Because of the various designs
of wood stoves, it should also be possible to adjust the design so that the stove is easy to use,
especially if local artisans build the stoves.
These wood stoves are more time consuming when cooking but since they are more efficient the
household will not have to spend as much time collecting wood as compared to using the TSF.
Households will save 11.6 hours per month since they have to collect less wood. But as the
manufactured rocket stove has a cooking time that is one minute longer than the traditional way
of cooking, the result will be a timesaving of approximately 10 hours. If the improved cook stove
where to be used there would be a time loss of approximately 16 hours per month due to the 22
minutes longer cooking time compared with the TSF (the wood stoves can have an extra cooking
time of 9 minutes if the total amount of time spent on cooking and collecting wood should
remain the same). Equation 9 has been used to calculate the time saved or lost.

-40-
With wood stoves the cooking patterns will probably be the same since the wood stoves do not
have a very much longer cooking time compared to the traditional way of cooking. The improved
cook stove might affect the cooking pattern to result in fewer, but also longer cooking sessions
per day.
5.2.4 Social ranking of the cooking solutions
The solar cookers as a group are rated six in total, although the parabolic cooker would be ranked
higher since the factor time would be rated as better or the same. The solar cookers have a low
rating compared to the other solutions since it is not possible to use all the present cooking
equipment and because it is not possible to smoke with any solar cooker or to fry with the box
and panel cooker. The solar cookers also have a low rating since the slow cooking might affect
the cooking pattern for the households. Solar cookers are not presented as a complete cooking
solution since studies have showed that people use them only for 25-38 % of all cooking
activities (Wentzel and Pouris, 2007). If the solar cooker is not a complete solution, it is not sure
that households will change their cooking pattern. Instead they will only use the solar cooker for
food that takes long time to prepare and continue to cook other foods the traditional way. This
will still result in a decreased deforestation and higher energy security for the households.
Biogas and wood stoves are both ranked with ten in total, but were ranked differently within the
different social aspects. The greatest advantages with biogas is the short cooking time and that it
is well compatible with the households’ present equipment. Usability of biogas has been ranked
low since biogas requires an amount of animals and agriculture that might not always be wanted
or possible for the households. When biogas is produced it is easy to use and it does not acquire
extra attention.
The wood stoves have also been ranked high and they also resemble the traditional way of
cooking the most. Because of this households might not need as much education as when
introducing solar cookers and biogas. This is a positive factor. It will not require as much effort
and the households will not have to adjust their present habits, as they would have to do with a
solar cooker. Further on, the wood stoves can be adjusted to the family’s present cooking
equipment. Concerning time, the improved cook stove would be ranked lower since it will be a
time loss when using it. The manufactured rocket stove would be ranked higher because of the
timesaving. The wood stoves will probably not affect the cooking pattern.
Table 14. Social ranking of the cooking solutions
Social factor
Solar
Cookers Biogas
Wood
Stoves
Educationa 1 1 2
Equipment compatibilityb 1 2 2
Usabilityb 1 1 2
Timeb 1 3 2
Cooking patternb 2 3 2
Total: 6 10 10
(a)1= much needed, 2=needed, 3= not needed (b) 1=worse, 2=same, 3=better
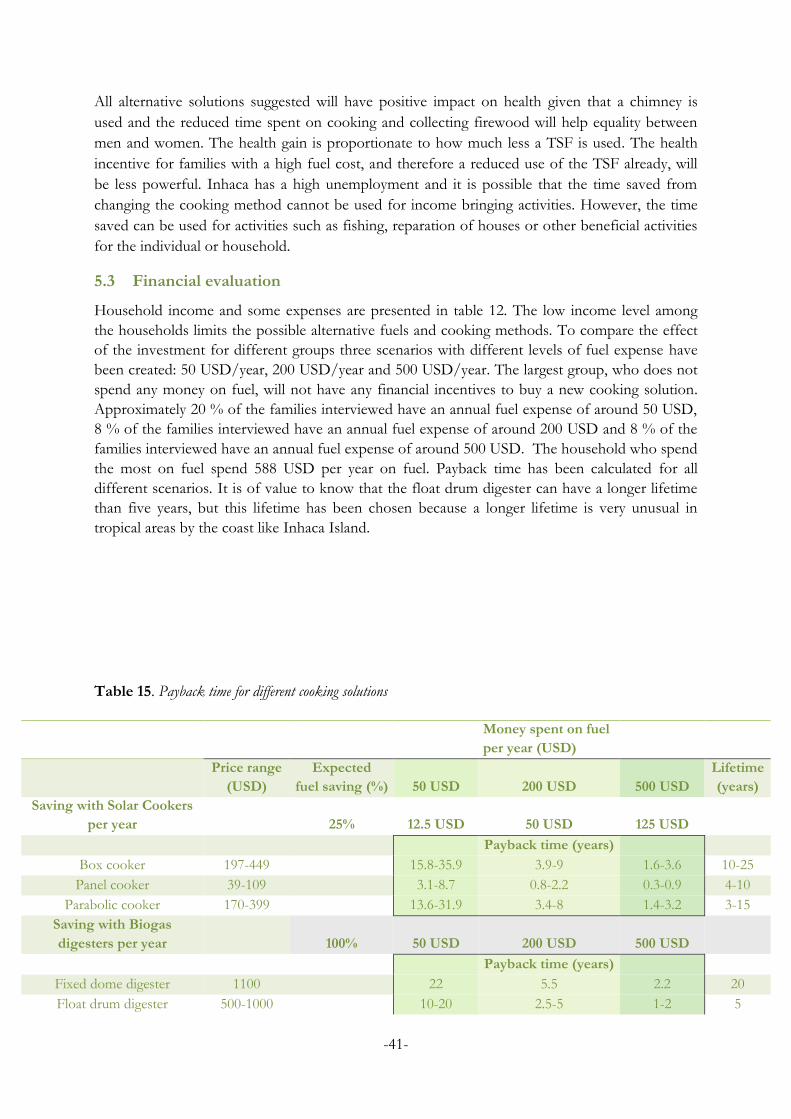
-41-
All alternative solutions suggested will have positive impact on health given that a chimney is
used and the reduced time spent on cooking and collecting firewood will help equality between
men and women. The health gain is proportionate to how much less a TSF is used. The health
incentive for families with a high fuel cost, and therefore a reduced use of the TSF already, will
be less powerful. Inhaca has a high unemployment and it is possible that the time saved from
changing the cooking method cannot be used for income bringing activities. However, the time
saved can be used for activities such as fishing, reparation of houses or other beneficial activities
for the individual or household.
5.3 Financial evaluation
Household income and some expenses are presented in table 12. The low income level among
the households limits the possible alternative fuels and cooking methods. To compare the effect
of the investment for different groups three scenarios with different levels of fuel expense have
been created: 50 USD/year, 200 USD/year and 500 USD/year. The largest group, who does not
spend any money on fuel, will not have any financial incentives to buy a new cooking solution.
Approximately 20 % of the families interviewed have an annual fuel expense of around 50 USD,
8 % of the families interviewed have an annual fuel expense of around 200 USD and 8 % of the
families interviewed have an annual fuel expense of around 500 USD. The household who spend
the most on fuel spend 588 USD per year on fuel. Payback time has been calculated for all
different scenarios. It is of value to know that the float drum digester can have a longer lifetime
than five years, but this lifetime has been chosen because a longer lifetime is very unusual in
tropical areas by the coast like Inhaca Island.
Table 15. Payback time for different cooking solutions
Money spent on fuel
per year (USD)
Price range
(USD)
Expected
fuel saving (%) 50 USD 200 USD 500 USD
Lifetime
(years)
Saving with Solar Cookers
per year
25% 12.5 USD 50 USD 125 USD
Payback time (years)
Box cooker 197-449
15.8-35.9 3.9-9 1.6-3.6 10-25
Panel cooker 39-109
3.1-8.7 0.8-2.2 0.3-0.9 4-10
Parabolic cooker 170-399
13.6-31.9 3.4-8 1.4-3.2 3-15
Saving with Biogas
digesters per year
100% 50 USD 200 USD 500 USD
Payback time (years)
Fixed dome digester 1100
22 5.5 2.2 20
Float drum digester 500-1000
10-20 2.5-5 1-2 5
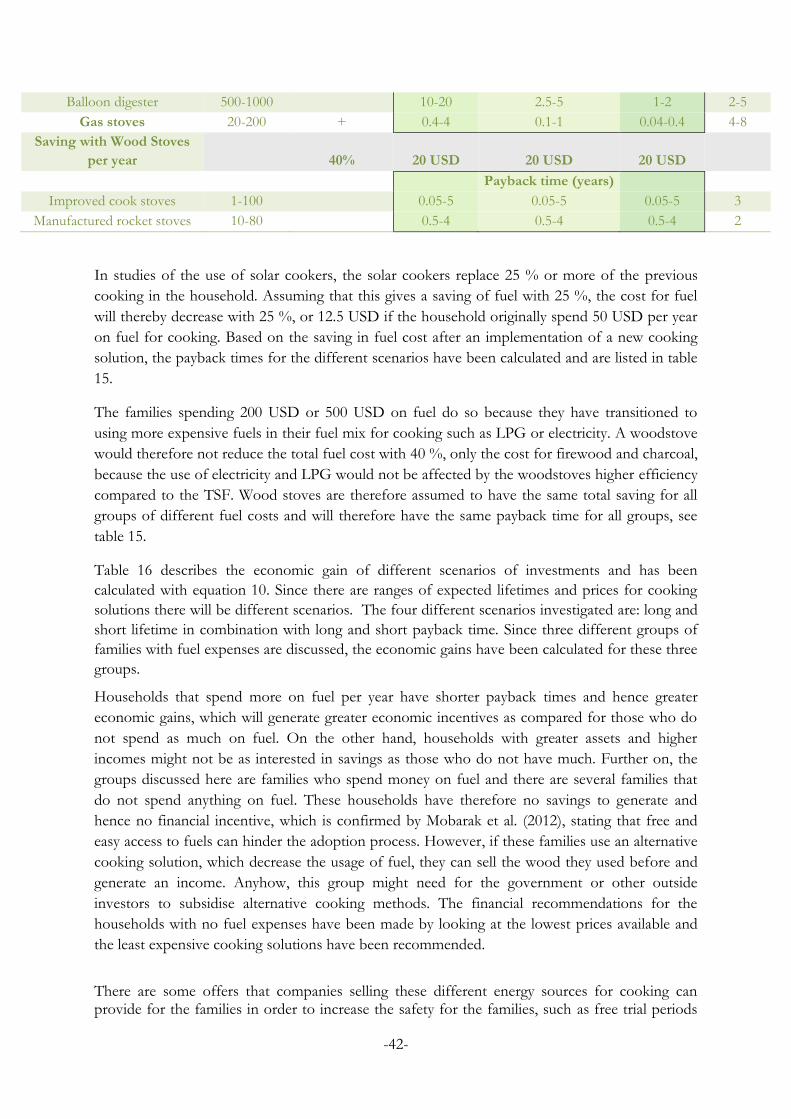
-42-
In studies of the use of solar cookers, the solar cookers replace 25 % or more of the previous
cooking in the household. Assuming that this gives a saving of fuel with 25 %, the cost for fuel
will thereby decrease with 25 %, or 12.5 USD if the household originally spend 50 USD per year
on fuel for cooking. Based on the saving in fuel cost after an implementation of a new cooking
solution, the payback times for the different scenarios have been calculated and are listed in table
15.
The families spending 200 USD or 500 USD on fuel do so because they have transitioned to
using more expensive fuels in their fuel mix for cooking such as LPG or electricity. A woodstove
would therefore not reduce the total fuel cost with 40 %, only the cost for firewood and charcoal,
because the use of electricity and LPG would not be affected by the woodstoves higher efficiency
compared to the TSF. Wood stoves are therefore assumed to have the same total saving for all
groups of different fuel costs and will therefore have the same payback time for all groups, see
table 15.
Table 16 describes the economic gain of different scenarios of investments and has been
calculated with equation 10. Since there are ranges of expected lifetimes and prices for cooking
solutions there will be different scenarios. The four different scenarios investigated are: long and
short lifetime in combination with long and short payback time. Since three different groups of
families with fuel expenses are discussed, the economic gains have been calculated for these three
groups.
Households that spend more on fuel per year have shorter payback times and hence greater
economic gains, which will generate greater economic incentives as compared for those who do
not spend as much on fuel. On the other hand, households with greater assets and higher
incomes might not be as interested in savings as those who do not have much. Further on, the
groups discussed here are families who spend money on fuel and there are several families that
do not spend anything on fuel. These households have therefore no savings to generate and
hence no financial incentive, which is confirmed by Mobarak et al. (2012), stating that free and
easy access to fuels can hinder the adoption process. However, if these families use an alternative
cooking solution, which decrease the usage of fuel, they can sell the wood they used before and
generate an income. Anyhow, this group might need for the government or other outside
investors to subsidise alternative cooking methods. The financial recommendations for the
households with no fuel expenses have been made by looking at the lowest prices available and
the least expensive cooking solutions have been recommended.
There are some offers that companies selling these different energy sources for cooking can provide for the families in order to increase the safety for the families, such as free trial periods
Balloon digester 500-1000
10-20 2.5-5 1-2 2-5
Gas stoves 20-200 + 0.4-4 0.1-1 0.04-0.4 4-8
Saving with Wood Stoves
per year
40% 20 USD 20 USD 20 USD
Payback time (years)
Improved cook stoves 1-100
0.05-5 0.05-5 0.05-5 3
Manufactured rocket stoves 10-80
0.5-4 0.5-4 0.5-4 2

-43-
and lifetime guarantees. These offers are, according to Levine and Cotterman (2012), increasing the cook stove adoption from 5 % to 45 %.
5.3.1 Households with an annual fuel expense of 50 USD
A box solar cooker with a long expected lifetime and a short payback time is a good option for this group because of the high economic gain, which is showed in table 16, however; the combination of long expected lifetime and short payback time may not be available in the market. The box cooker is a risk since no other combination of expected lifetime and payback time is financially supportable and because of the relatively long payback time. The panel cooker is a better option for the households that spend 50 USD on fuel per year since all combinations of expected lifetimes and payback times, except the panel cooker with a long payback time and a short expected lifetime, are financially sustainable. Panel cookers are therefore the safest option especially if the family chose a panel cooker in a lower price range since the payback time will be approximately 3 years and the shortest expected lifetime of a panel cooker is 4 years, see table 15. If a household invest in a panel cooker in the higher price range, they will face a greater risk of not having a positive economic gain. If it is possible to get a guarantee of the panel cookers lifetime, which is valid as long as the payback time, the risk of a negative investment will be eliminated. The panel cooker does not require as high initial investment cost as the box and parabolic solar cooker does, which make it a smaller, temporary strain on the households’ economies. The panel cooker is considered the best financial option for this group. Further on, the parabolic cooker is, as the box cooker, a great risk and the combination of a long lifetime and a short payback time is not an option that necessarily exists on the market. Also, the option where the parabolic cooker is a positive investment is an investment with low economic gain since there is a small difference between the expected lifetime and the payback time. The parabolic cooker is not an investment to recommend because of the high risk and the low economic gain. All biogas digesters are negative investments and are therefore not recommended. If the government where to finance the biogas digester or the parabolic cooker, it would be possible for the households to use these techniques. Although this would solve the financial part, it is not certain that people who receive a cooking solution for free use them as much as those who purchase them themselves. Wood stoves are also a risk; however the improved cook stove is a better alternative than the manufactured rocket stove since the improved cook stove has a longer expected lifetime. The improved cook stove can be purchased for a lower price than the manufactured rocket stove, see table 15. The wood stoves are a good alternative and are considered the second best alternative for this group.
5.3.2 Households with an annual fuel expense of 200 USD
In comparison with households spending 50 USD on fuel per year, the box and panel cooker are safe investments for households spending 200 USD on fuel per year. This is since households spending 200 USD on fuel per year will save 50 USD per year with a solar cooker whilst households spending 50 USD per year on fuel will save 12.5 USD per year with a solar cooker. The box cooker will, in most of the combinations of expected lifetime and payback time, generate a greater economic gain than the panel cooker and is therefore recommended as the second best financial alternative, whilst the panel cooker is the third financial alternative.

-44-
However the box cooker is associated with a higher risk since the initial investment cost is higher and therefore the payback time is longer. The parabolic solar cooker is still an option with a risk for these households since the shortest expected lifetime is 3 years, which does not exceed even the shortest of payback times for the parabolic cooker. However, it is a small difference in time between the shortest expected lifetime and the shortest payback time, which can be seen in table 15. Parabolic cookers do require a higher initial investment cost compared to a panel cooker, which can be seen in table 15, and do not necessarily generate a greater economic gain than the panel cooker, which can be seen in table 16. Because of this the parabolic cooker is not highly financially recommended even though it is an option. Further on, the fixed dome biogas digester is the best option for these households regarding the economic gains. This is showed in table 16 and the fixed dome digester will generate an approximate economic gain of 2900 USD since the expected lifetime is 20 years. Anyhow the initial investment cost is high and this might require a loan, which may be a disadvantage but according to Ghimire, in 2012, fixed dome biogas plants are a good option despite the high initial investment cost. If the family does not have a gas stove they also need to purchase one, which will decrease the economic gain. Owning enough animals is also a necessity in order to have biogas and if the family does not have enough animals they might be able to receive or purchase animal manure from other families or to purchase more animals. This will also affect the expected economic gain in a negative way. It is also important that the household do not purchase any fuel since this will decrease the economic gain. The balloon digester is not a good option since it has a low or negative expected economic gain and it is still a risk. Especially since the investment cost is still relatively high and the expected lifetime is not as long as the expected lifetime of the fixed dome digester, as can be seen in table 15. The float drum digester is an option for these households since it generates a neutral or positive economic gain and is recommended as option number four, just before the parabolic cooker, as showed in table 17. It may be a struggle to purchase a cooking solution that requires a high initial investment cost and therefore some households might choose not to purchase a fixed dome biogas digester or a balloon digester. An option for households that does not purchase a fixed dome biogas digester because of the high initial investment cost or lack of animals is the box cooker, the panel cooker or some of the two different wood stoves, depending on how willing they are to take a risk. Wood stoves are recommended as number six and seven.
5.3.3 Households with an annual fuel expense of 500 USD
Panel cookers and especially box cookers are a good investment for households spending 500 USD on fuel per year and are therefore recommended as the financially fifth respectively second best alternative, as showed in table 17. The box cooker is a better alternative than the panel cooker since the expected economic gain is higher, as can be seen in table 16. However the box cooker requires a higher initial investment cost, as can be seen in table 15, and is therefore a higher risk. The panel cooker does not have a high investment cost and the payback time is therefore short. This is an advantage since the family might discover that they do not want to use a solar cooker and then they only have to use it for approximately 4 months, if they choose the lower price range, in order for the investment to be neutral.

-45-
There is a risk when purchasing a parabolic cooker since the initial investment cost is high, 170-399 USD, which results in a payback time of 1.4-3.2 years, and the shortest expected lifetime is 3 years. However the risk can be eliminated if a lifetime which is as long as the payback time is guaranteed. It is a lower risk if the household chooses to purchase a parabolic cooker within the lower price range since the payback time is less likely to exceed the expected lifetime, however the low price might shorten the lifetime. The parabolic cooker can still be an option for these households and is recommended as the sixth best alternative for these households, as showed in table 17, due to the relatively low economic gain. An optimal investment option would be the fixed dome biogas digester since it generates the greatest economic gain, which is showed in table 16. However, this might not be the most obvious option for the households since there is a high initial investment cost, it requires a gas stove as well as certain amount of agricultural and animal waste. More options concerning price are available when the float drum digester is considered. This is a safe investment since the expected lifetime is higher than the payback time. This is a short-term investment but a good option because of the low risk. It would be recommendable for households who already have animals in order to produce enough biogas since the economic gain otherwise might be too low in order to be a sufficient incentive. The float drum digester is recommended as the third financial alternative for this group, which is showed in table 17. From a financially perspective, the balloon digester is not to be recommended over the float drum digester since the payback time is the same or greater and the expected lifetime is the same or lower. Concerning the wood stoves, the improved cook stove is a better alternative than the manufactured rocket stove because it generates a greater economic gain. At the same time it has a longer lifetime and can be purchased for a lower price. The wood stoves economic gains are low and therefore they are recommended as the last alternatives. Table 16. Describes the Economic Gains for different scenarios of lifetimes and payback times when investing in different cooking solutions for the different groups. LLT = Long Lifetime, SLT = Short Lifetime, LPBT= Long Payback time, SPBT= Short Payback time.
Cooking solution 50 USD 200 USD 500 USD
Box cooker Economic Gain Economic Gain Economic Gain
SLT, LPBT -323.75 50 800
SLT, SPBT -72.5 305 1 050.00
LLT, LPBT -136.25 800 2 675.00
LLT, SPBT 115 1055 2 925.00
Panel Cooker Economic Gain Economic Gain Economic Gain
SLT, LPBT -58.75 90 387.5

-46-
SLT, SPBT 11.25 160 462.5
LLT, LPBT 16.25 390 1137.5
LLT, SPBT 86.25 460 1212.5
Parabolic Cooker Economic Gain Economic Gain Economic Gain
SLT, LPBT -361.25 -250 -25
SLT, SPBT -132.5 -20 200
LLT, LPBT -211.25 350 1 475.00
LLT, SPBT 17.5 580 1 700.00
Fixed Dome Digester Economic Gain Economic Gain Economic Gain
LT, PBT -100 2 900.00 8 900.00
Float Drum Digester Economic Gain Economic Gain Economic Gain
LT, HPBT -750 0 1 500.00
LT, LPBT -250 500 2 000.00
Balloon Digester Economic Gain Economic Gain Economic Gain
SLT, LPBT -900 -600 0
SLT, SPBT -400 -100 500
LLT, LPBT -750 0 1 500.00
LLT, SPBT -250 500 2 000.00
Improved Cook Stoves Economic Gain Economic Gain Economic Gain
LT, LPBT -40 -40 -40
LT, SPBT 59 59 59
Manufactured rocket stoves Economic Gain Economic Gain Economic Gain
LT, LPBT -40 -40 -40
LT, SPBT 30 30 30
Table 17 summarises the financial recommendations and the approximate best financial option is
presented in descending order for each group. The green cooking solutions are ranked as a better
social option with a ranking of ten and the yellow cooking solutions are ranked as a six. Cooking
solutions that are not included in the table are not financially recommended as an option for the
different groups.
Table 17. A summary of the financial recommendations
5.4 Sensitivity analysis
0 USD 50 USD 200 USD 500 USD
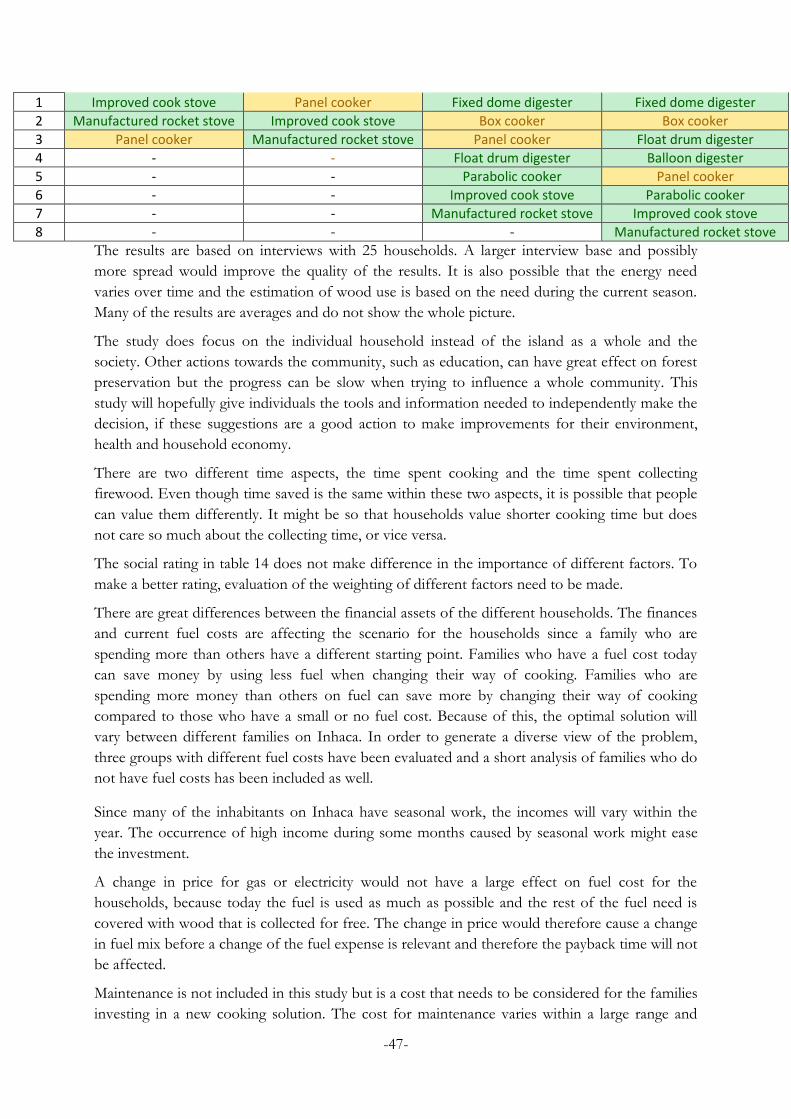
-47-
The results are based on interviews with 25 households. A larger interview base and possibly
more spread would improve the quality of the results. It is also possible that the energy need
varies over time and the estimation of wood use is based on the need during the current season.
Many of the results are averages and do not show the whole picture.
The study does focus on the individual household instead of the island as a whole and the
society. Other actions towards the community, such as education, can have great effect on forest
preservation but the progress can be slow when trying to influence a whole community. This
study will hopefully give individuals the tools and information needed to independently make the
decision, if these suggestions are a good action to make improvements for their environment,
health and household economy.
There are two different time aspects, the time spent cooking and the time spent collecting
firewood. Even though time saved is the same within these two aspects, it is possible that people
can value them differently. It might be so that households value shorter cooking time but does
not care so much about the collecting time, or vice versa.
The social rating in table 14 does not make difference in the importance of different factors. To
make a better rating, evaluation of the weighting of different factors need to be made.
There are great differences between the financial assets of the different households. The finances
and current fuel costs are affecting the scenario for the households since a family who are
spending more than others have a different starting point. Families who have a fuel cost today
can save money by using less fuel when changing their way of cooking. Families who are
spending more money than others on fuel can save more by changing their way of cooking
compared to those who have a small or no fuel cost. Because of this, the optimal solution will
vary between different families on Inhaca. In order to generate a diverse view of the problem,
three groups with different fuel costs have been evaluated and a short analysis of families who do
not have fuel costs has been included as well.
Since many of the inhabitants on Inhaca have seasonal work, the incomes will vary within the
year. The occurrence of high income during some months caused by seasonal work might ease
the investment.
A change in price for gas or electricity would not have a large effect on fuel cost for the
households, because today the fuel is used as much as possible and the rest of the fuel need is
covered with wood that is collected for free. The change in price would therefore cause a change
in fuel mix before a change of the fuel expense is relevant and therefore the payback time will not
be affected.
Maintenance is not included in this study but is a cost that needs to be considered for the families
investing in a new cooking solution. The cost for maintenance varies within a large range and
1 Improved cook stove Panel cooker Fixed dome digester Fixed dome digester
2 Manufactured rocket stove Improved cook stove Box cooker Box cooker
3 Panel cooker Manufactured rocket stove Panel cooker Float drum digester
4 - - Float drum digester Balloon digester
5 - - Parabolic cooker Panel cooker
6 - - Improved cook stove Parabolic cooker
7 - - Manufactured rocket stove Improved cook stove
8 - - - Manufactured rocket stove

-48-
specific information must be found for every type of cooking solution. The additional equipment
associated with the biogas digester has also not been included. The assumption that biogas can
replace 100 % of the fuel used today is based on the recommendation of 300 L biogas per day
and per person, but it is possible that the biogas will be used in combination with other types of
fuels, which will result in longer payback time. The possibility to have biogas is highly dependent
on the number of animals owned by the family. To increase the amount of biogas the families
could therefore buy more animals. This might harm the nature on Inhaca and the possibility to
have more animals on the island has not been investigated.
The savings with a solar cooker per year is based on how many percent of the cooking is done
with a solar cooker. If a family where to use the cooker more, the economic gain would be
greater since more fuel is saved, this amounts in more savings and a shorter payback time. Studies
refer to utilization to be between 25-38 % (Wentzel and Pouris, 2007) and in figure 26 a scenario
of 50 % utilization has also been added. A solar cooker for 200 USD has a payback time of 16
years if it is utilized 25 % of all cooking activities in a household with the previous annual fuel
cost of 50 USD, as assumed in this study. If the household instead utilize the solar cooker 38 %
of all cooking activities, as found in the study by Wentzel and Pouris in 2007, the payback time
would be reduced to 10.5 years. Additionally, if the utilization would be 50 % the payback time
for the 200 USD solar cooker would be 8 years. Solar cookers are there by a very good option
given a high adoption rate. The different payback times are illustrated in figure 26.
Figure 26. Sensitivity analysis of the payback time depending on the utilization of the solar cooker for a
household with an annual fuel expense of 50 USD
5.5 Final discussion
Mozambique is a fast growing economy. Still, it will probably take time before the prosperity will
change fuel usage on Inhaca Island. Solar cookers, biogas and wood stoves can be implemented
in a much nearer future and does not require new logistic and transport of fuel to or on Inhaca
Island. One of the biggest sources of income on the island, except for fishing, is the tourist

-49-
industry, upon which the deforestation would have a very negative impact since the island would
lose its attraction.
By transitioning from biomass to other forms of renewable fuels, Inhaca can continue its
socioeconomic development without the increased use of fossil fuels and increased emissions of
greenhouse gases. The money that is spent on fuel today can instead contribute to the
development of the island if the alternative cooking solutions are implemented.
In order to recommend solutions for the families at Inhaca the financial and social evaluation will
be combined. Cooking alternatives for four groups: those who do not have any fuel costs and
those spending 50 USD, 200 USD and 500 USD on fuel per year, will be presented.
5.5.1 Households with no fuel cost
The families with no fuel cost have no financial incentives, but they do still have social incentives
to change to another cooking solution. However these households might not be able to spend so
much on alternative cooking solutions, which means that the financially possible solutions for
this segment are slim.
An improved cook stove, a manufactured rocket stove or a panel cooker in the lower price range
might be possible for these families to purchase but otherwise, help from outside investors or the
government is needed. An incentive for the government and these families to purchase wood
stoves would be the improved health because of the decrease exposure of smoke and the reduced
risk of encountering dangerous animals when collecting wood due to the reduced time collecting.
5.5.2 Households with an annual fuel expense of 50 USD
The panel solar cooker was the best option financially for this group but wood stoves was also an
option even though it withholds a greater risk than the panel cooker. Solar cookers are not
ranked as high socially, as the wood stoves and the choice is between comfort, economic gain
and risk.
Since the wood stoves can be constructed locally at a very low price, the risk of becoming
bankrupt is small and it is possible that the economic gain is greater when investing in a wood
stove compared to investing in a panel cooker. Because of this the wood stoves would probably
be a better alternative for the households spending 50 USD on fuel per year. Additionally, the
wood stoves would save more fuel than the panel cooker and is therefore a more effective way of
slowing down the deforestation.
5.5.3 Households with an annual fuel expense of 200 USD
The fixed dome biogas digester would be an optimal solution for families spending 200 USD on
fuel per year and who have enough animals to produce a sufficient amount of biogas. However
the families might not be willing to invest that amount of money at the same time and if part time
payments or loans are not possible the households may overlook the biogas digester.
The float drum digester is an option for these households and since it is available for a lower
price, 500 USD, than the fixed dome digester. Hence it will not necessarily require as great strain
as the fixed dome digester will with its high investment cost.

-50-
Since the solar cookers are ranked low socially and there are other options that these families can
afford, the box and panel solar cooker will not be recommended. However the parabolic cooker
would be ranked higher since it is a fast cooker and can generate timesaving. It may be of interest
for the households spending 200 USD on fuel per month. The parabolic cooker is a risk but if
the lower price range is chosen the risk will be smaller.
The wood stoves have a much lower risk since they are available for a very low price. In addition
to this the manufactured rocket stove is ranked higher socially than the parabolic cooker since it
can be adapted to the household’s present equipment. The wood stoves, especially the
manufactured rocket stove, would probably be of greater interest for the families because it
generates time savings and is financially sustainable. However the parabolic cooker is still a legit
option.
5.5.4 Households with an annual fuel expense of 500 USD
As for the families who spend 200 USD on fuel per year, the fixed dome digester would be the
best option for families spending 500 USD on fuel per year with enough animals to produce a
sufficient amount of biogas. The fixed dome digester is, even for families spending 500 USD on
fuel per year, a large investment and other alternatives are important.
The floating drum digester and the balloon digester can be an optional biogas solution, but there
is still a large investment cost compared to other options. The parabolic cooker would be an
option for this group since it generates a positive economic gain and is a better social option than
the box and panel solar cooker. On the other hand, the parabolic solar cooker would not be a
complete cooking solution, since it cannot be used for smoking. Moreover, it is not completely
compatible with the present cooking equipment.
The manufactured rocket stove is also an option for households who do not want a large
investment but still wants to save money. However this is not a very effective investment since
the savings are much less than compared to the fixed dome digester, or even to the box or panel
cooker. The box and panel cooker is ranked too low socially to be recommended for these
households since the greatest incentive for them is most likely to have greater comfort than
before. They are already spending 500 USD per year to gain comfort. Hence the wood stoves
would probably be preferred over the box and panel cooker.
6 Conclusion
Electricity, charcoal and LPG are available on Inhaca Island but only 24 % of the habitants
interviewed can afford to use it for energy intensive activities such as cooking. To reduce the
deforestation with the limited financial assets available on the island using renewable energy
sources; wood stoves, biogas digesters and solar cookers should be implemented.
For households with a current fuel expense there is a possibility to make a financial gain, opening
up for more alternatives than for households with no fuel expenses. For households having large
annual fuel expenses, the alternative should offer greater comfort than the cooking methods that
are used today are. This is because these households have high fuel expenses in order to gain
comfort and will most likely not be willing to sacrifice comfort when changing cooking solution.
This is why the box and panel cooker is not recommended for these families, even though they
are financially possible. However, these families have the opportunity to choose between most

-51-
biogas digesters, wood stoves and the panel cooker, depending on individual priorities between
economical gain, risk and comfort.
For households with low annual fuel expenses, 50 USD, or no fuel expenses, the suggestions are
the panel cooker or the wood stoves. The panel cooker is not a complete substitute to TSF and
will together with the TSF generate higher energy security. The wood stoves are a complete
substitute and both the stoves will decrease the time for collecting wood, but only the
manufactured rocket stove will generate time savings in total. These households cannot prioritize
comfort as much as families with higher fuel expenses since they have financial boundaries and
they do not have as many options.
As suggested by WHO in table 1 there is a large gain for the community due to prevented
illnesses, environmental benefits and time savings if the transition is made to cleaner cooking.
These suggestions can benefit areas in all of Mozambique.
7 Future work
Awareness of alternative ways of cooking is low and for the results in this study to have an
impact on Inhaca Island and the rest of Mozambique, an extensive education and marketing
campaign is needed. More research on alternatives for outside financing to ease the burden of the
large investment cost associated with some of the suggested alternatives should be made. Further
on, research on how different social aspects should be prioritized would be of grate benefit in
order to make a better estimation of social sustainability and the adoption process.
Studies regarding the possibility to produce the suggested cooking solutions in Mozambique or
import them could speed up the transition process and increase availability. Also more studies
regarding financial aid, applicable for conditions in Mozambique, can help the families.

-52-
References
Åkesson, G., Nhate, V. (2002) Study on the Impact of Rural Electrification in Riba ́ue`,
Namiginha and Iapala A ́ reas. Report to Swedish Mozambique, Maputo.
Al Momani, F.A, Shawaqfah, M. (2013), Agricultural Solid Waste in South of Jordan: Facts and
Figures, Journal of Environmental Protection 4 (2013) pp. 309-314.
AllAfrica (2003), Mozambique: Electricity Comes to Inhaca. Available at:
<http://allafrica.com/stories/200311140661.html> Last Accessed: 2015-02-21.
Amacher, G., Hyde, W., and Joshee, B. (1992). The adoption of consumption technologies.
Blume E. (2010) Biogas för den afrikanska landsbyggden. University of Gothenburg, Department
of Plant and Enviromental Sciences.
Bond, T. and Templeton M. (2011) History and future of domestic biogas plants in the
developing world, Energy for sustainable development 14 (2011), pp. 347-354.
CIA (2014) Mozambique, Available at: <https://www.cia.gov/library/publications/the-world-
factbook/geos/mz.html> Last accessed: 2015-03-01
Conselho Municipal de Maputo (CMM) (2007) Plano Parcial de Urbanizacao do Districto
Municipal de Kanyaka.
De Boer, W. Bento, C. (1999) Birds of Inhaca Island, Mozambique. BirdLife - S. Africa, Cape
Town. p.76.
Devang, J. (2010) Concentrating solar cookers. Available at:
<http://rudrasolarcooker.blogspot.com/2010/11/concentrating-solar-cookers.html> Last
accessed: 2015-04-27.
Differ group (2012) A rough guide to clean cookstoves. Available at:
<http://cleancookstoves.org/resources_files/a-rough-guide-to-clean.pdf> Last accessed: 2015-
04-20.
EDM (2015) Electricity tariffs. Available at: <
http://www.edm.co.mz/index.php?option=com_contentview=articleid=121%3Atarifarios-de-
energia-electricacatid=38%3AservicosItemid=83lang=pt> Last accessed: 2015-05-21
EEP (2013), Introduce and promote a biogas system to provide alternative gas and energy to
institutions in rural areas of Cabo Delgado Province, Mozambique.
Energypedia (2014), Improved Cookstoves – What is it all about? Available at:
<https://energypedia.info/wiki/Improved_Cookstoves_–_What_is_it_all_about%3F> Last
accessed: 2015-04-20

-53-
Energypedia (2015), Fixed-dome Biogas Plants. Available at:
<https://energypedia.info/wiki/Fixed-dome_Biogas_Plants#Balloon_Plants> Last accessed in
2015-04-23
EON (2014), Bioenergi från biobränsle. Available at: <http://www.eon.se/om-eon/Om-
energi/Energikallor/Bioenergi/?gclid=CjwKEAiAjsunBRCy3LSlz_PJqCgSJACJY7yK1s4g1VxQ
xC_-QZwfmuqZB66qEGPXPmqzoxvv93CcSxoCUJfw_wcB > Last Accessed: 2015-02-28
Domalski, E. (1987) Thermodynamic data for Biomass Conversion and Waste Incineration.
National Bureau of Standards.
Ezzati, M. Kammen, M. (2002, 11). The Health Impacts of Exposure to Indoor Air Pollution
from Solid Fuels in Developing Countries: Knowledge, Gaps, and Data Needs. Environmental
Health Perspectives, 110(11)
Francescato, V. Antonini, E…, and Gradziuk, P. (2008) Wood Fuels Handbook. Italian
Agroforestry Energy Association.
GACC (2015c) Climate change: Tracking Black Carbon Emissions from Inefficient Cookstoves.
GACC (2015a) Biogas. Avilable at: <http://cleancookstoves.org/binary-
data/TECHNOLOGY_FUELS/document/000/000/6-1.pdf> Last accessed: 2015-04-23.
GACC. (2012). Cookstove Fuels. Available at: <www.cleancooksoves.com> Last accessed: 2015-
04-15.
Ghimire P. (2012) SNV supported domestic biogas programmes in Asia and Africa. Renewable
Energy 49 (2013), pp. 90-94.
Gine, X. and Yang, D. (2009). Insurance, Credit, and Technology Adoption: Field Experimental
Evidence from Malawi. Journal of Development Economics, 89(1).
GACC (2015b) Clean Cooking Catalog. Available at:
<http://catalog.cleancookstoves.org/#/stoves> Last accessed: 2015-04-23.
Gye, H (2012) America IS the 1%: You need just $34,000 annual income to be in the global
elite... and HALF the world's richest people live in the U.S. The daily mail. Available at:
<http://www.dailymail.co.uk/> Last Accessed: 2015-05-12
Havtun, H. (1997). Applied Thermodynamics - Collection of Formulas. Stockholm: Thermal
Engineering ER.
Hiemstra-van der Horst, G., Hovorka, A. (2008). Energy Ladder. Elsevier, Energy for Sustanible
Develoent
How Stuff Works (2009) How solar Cooking Works. Available at:
http://science.howstuffworks.com/environmental/green-science/solar-cooking1.htm Last
accessed: 2015-04-27.

-54-
IEA (2014) Africa Energy Outlook 2014, focus on energy prospects in sub-saharan Africa.
Executive Summary.
International Energy Initiative (2010) About Us. Available at:
<http://www.ieiglobal.org/journal-esd.php?iei=journal> Last accessed: 2015-04-17.
IRENA (2012) Mozambique, Renewable Readiness Assessment 2012.
Jhonels, E. Murray, S. (2013), Performance Evaluation of the FirePipe.
Kalk, M. (1995) Natural History of Inhaca Island: Mozambique. Third Edition - Witwatersrand
University Press, Cape Town. pp. 395.
Kanagawa, M. Nakata, T. (2007) Analysis of the energy access improvement and its socio-
economic impacts in rural areas of developing countries. Ecological Economics 62 (2007) pp.
319 – 329
Kanase-Patil A.B et al (2010) Integrated renewable energy systems for off grid rural electrification
of remote area, Renewable Energy 35 (2010), pp. 1342-1349.
Kjällström, M. and Voyce, S. (2009) Project Sunbaker – Development of a solar baking oven.
KTH
Kungliga Tekniska Högskolan (KTH) What a fuel consists of , Department of Energy
Technology, Division of Heat and Power Technology. Available at:
<http://www.energy.kth.se/compedu/webcompedu/index.html#Auxiliary/Welcome_to_Comp
Edu.htm> Last accessed: 2015-04-28.
Levine, D. I., Cotterman, C. (2012). What Impedes Efficient Product Adoption? Evidence from
Randomized Variation in Sales Offers for Improved Cookstoves in Uganda. Univeristy of
California, Berkeley.
Lewis, J. J., Pattanayak, S. (2012). Who Adopts Improved Fuels and Cookstoves? A Systematic
Review. Enviroment Health Perspective.
Loo Van Sjaak, K. J. (2008). The Handbook of Biomass Combustion and Co-firing. Earthscan
Masera, O. Saatkamp, B. Kammen, D (2000) From Linear Fuel Switching to Multiple Cooking
Strategies: A Critique and Alternative to the Energy Ladder Model. World Development Vol. 28,
No. 12, pp. 2083±2103, 2000 Ó 2000 Elsevier Science Ltd.
Mendonça, F. (1954) – Estudos, ensaios e documentos: Contribuições para o conhecimento da
Flora de Moçambique. Vol. II.Junta de Investigação de Ultramar, Lisboa. pp 139-178.
Miller, G., Mobarak, A. M. (2011). Intra-household externalities and low demand for a new
technology: experimental evidence on improved cookstoves. Stanford, USA: Stanford University.

-55-
Mobarak, A., Dwidevi, P., Bailis, R., Hilderman, L., Miller, G. (2012). Low Demand for
Nontraditional Cookstove Technologies. Proc. Natl Acad. Sci.
Moura, A. (1969) Ilha da Inhaca, Moçambique. Instituto de Investigacação Científica de
Moçambique. Lourenço Marques. pp. 20.
Muacanhia, T. (2003) Environmental Changes on Inhaca Island, Mozambique: Development
versus Degradation?
Muacanhia, T. and Bhat, N. (2001) Mangroves of Mozambique: natural distribution, current
status and management. In: Mangrove Ecosystems: natural distribution, biology and
management. Kuwait Institute of Scientific Research, Kuwait. p. 25-31.
NASA (2015a) Make Sun S’mores!. Available at: <http://climatekids.nasa.gov/smores/> Last
accessed: 2015-04-27.
NASA (2015b) NASA Surface meteorology and Solar Energy - Available Tables. Available at:
<https://eosweb.larc.nasa.gov/cgi-bin/sse/grid.cgi?num=213064lat=-
26.023hgt=100submit=Submitveg=17sitelev=-
[email protected]=grid_idp=swvdwncookp=midday_dwnp=clrskycookp=clrskyda
yp=clr_skyp=daylightp=T10Mstep=2lon=32.955> Last accessed: 2015-04-13.
NASA (2015c) NASA Surface meteorology and Solar Energy – Definitions. Available at:
<https://eosweb.larc.nasa.gov/sse/text/definitions.html#clr_sky> Last accessed: 2015-04-13.
OECD/IEA (2006) World Energy Outlook 2006. p. 425.
One Earth Designs (2014), How SolSource Works. Available at:
<https://www.oneearthdesigns.com/solsource/technology/> Last Accessed: 2015-02-21.
Prasad, G. (2008) Energy sector reform, energy transitions and the poor in Africa. Energy Policy
36 (2008) p. 2806– 2811. Elsevier Science.
Ramachandra T.V. (1998) Efficient household energy use in Uttara Kannada District, Karnataka,
Energy Research Group, Indian Institute of Science, Centre for Ecological Sciences, Bangalore
560 012, India.
Rehfuess, E., Mehta, S., Prüss-Üstun, A. (2006). Assessing household solid fuel use: multiple
implications for the millennium development goals. Environmental Health Perspectives.
Rosillo-Calle, F., Woods, J. (2007). The Biomass Assessment Handbook: Bioenergy for a
Sustainable Environment .
Ruiz-Mercado, I., Masera, O., Zamora, H., Smith, K. R. (2011). Adoption and sustained use of
improved cookstoves. Energy Policy, pp. 7557-7566
-56-
SamSamWater (2013) SamSamWater Climate Tool. Available at:
<http://www.samsamwater.com/climate/climatedata.php?lat=-
26.0235lng=32.9550loc=Moma%2C+Mo%E7ambique> Last accessed: 2015-04-15.
Schwarzer K. and Eugênia Vieira da Silva M. (2003) Solar cooking with or without heatstorage
for families and institutions, Solar Energy 75 (2003), pp. 35-41.
SEA. (2011). Biofuel – wood or pellets? Retrieved from Swedish Energy Agency.
Seboka, Y., Getahun, M. A., Haile-Meskel, Y. (2009). Biomass Energy for Cement Production:
Opportunities in Ethiopia. United Nations Development Programme.
Serio, M. A., Bassilakis, R., Kroo, E., Wojtowicz, M. A. (2002). Pyrolysis Processing of Animal
Manure to Produce Fuel Gases. Fuel Chemistry Division Preprints.
Sida (2014a) Landfakta. Avaiable at: <http://www.sida.se/Svenska/Har-arbetar-
vi/Afrika/Mocambique/Landfakta/> Last Accessed: 2015-04-16.
Sida (2014b) Elektricitet sätter fart på Moçambiques landsbygd. Available at:
<http://www.sida.se/Svenska/Har-arbetar vi/Afrika/Mocambique/resultatexempel/elektricitet-
satter-fart-pa-mocambiques-landsbygd/> Last Accessed: 2015-04-16.
Skärvad P.H and Olsson J. (2013) Företagsekonomi 100. Edition 16, Liber
Sokhansanj, S. (2011). Biomass Energy Data Book: The Effect of Moisture on Heating Values .
Oak Ridge National Laboratory.
Solar Cooker at Cantinawest (2008a) Buy a Solar Cooker. Available at:
<http://www.solarcooker-at-cantinawest.com/buy-a-solar-cooker.html>, Last Accessed: 2015-
02-21.
Solar Cooker at Cantinawest (2008b) Parabolic Solar Cooker: Cantinawest’s “Solar Burner”.
Available at: <cantinawest.com/parabolic_solar_cooker_solar_burner.html>, Last Accessed:
2015-02-22.
Solar Cooker at Cantinawest (2008c) SunFlair Solar Oven. Available at:
<http://www.solarcooker-at-cantinawest.com/sunflair_solar_oven.html>, Last Accessed: 2015-
02-22.
Solar Cooker at Cantinawest (2008d) SunCook Solar Oven. Available at:
<http://www.solarcooker-at-cantinawest.com/suncook_solar_oven.html>, Last Accessed: 2015-
02-22.
Solar Cookers International (2004) 25 Countries with the greatest potential benefits from solar
cookers.
Solar Cookers International (2010), How Solar Cookers Work. Available at:
<http://www.solarcookers.org/basics/how.html> Last Accessed: 2015-02-21.

-57-
Solar Cookers International (2015a) SolSource. Available at:
<http://shop.solarcookers.org/?pn=SolSourcecn=Solar+Cookersp=666c=27> Last accessed at:
2015-04-25
Solar Cookers International (2015b) CooKit. Available at: <
http://shop.solarcookers.org/?pn=CooKitp=621c=27> Last accessed: 2015-04-25.
Solar Cookers International Network (2013) Low-cost Wooden Solar Box Cooker. Available at:
<http://solarcooking.wikia.com/wiki/Low-cost_Wooden_Solar_Box_Cooker > Last accessed:
2015-04-27.
Solar Cookers International Network (2014a) Solar Box Cookers Designs. Available at:
<http://solarcooking.wikia.com/wiki/Category:Solar_box_cooker_designs > collected in 2015-
04-06.
Solar Cookers International Network (2014b) Solar Cooker Frequently-Asked Questions.
Available at: <http://solarcooking.wikia.com/wiki/Solar_cooking_frequently-asked_questions>
Last accessed: 2015-05-21.
Solar Cookers International Network (2015a) CooKit. Available at:
<http://solarcooking.wikia.com/wiki/Cookit> collected in 2015-02-21.
Solar Cookers International Network (2015b) Rocket stove. Available at:
<http://solarcooking.wikia.com/wiki/Rocket_Stove> Last accessed: 2015-04-10
Solar Cookers International Network (2015c) Solar panel cooker designs. Available at:
<http://solarcooking.wikia.com/wiki/Category:Solar_panel_cooker_designs> Last accessed:
2015-04-27
Solarex (1996) World Design Insolation. Available at: <http://www.mueller-
solartechnik.com/download/solo.pdf> Last accessed: 2015-04-15.
Sousa, A. (1966) Dendrologia de Moçambique. Junta de Investigação do Ultramar, Lisboa.
Subedi M. et al. (2014) Can biogas digesters help to reduce deforestation in Africa?. Biomas and
Bioenergy 70 (2014), pp. 87-98
Sunseed Tanzania (2015) What is the Domestic Energy Project? Available at:
<http://www.sunseedtanzania.org/domestic-energy-program.html> Last accessed: 2015-04-10
The World Bank (2014) GDP growth (annual %), Mozambique. Available at:
<http://data.worldbank.org/indicator/NY.GDP.MKTP.KD.ZG/countries/MZ?display=graph
> Last Accessed: 2015-02-24
The World Bank (2015) Poverty overview. Available at:
<http://www.worldbank.org/en/topic/poverty/overview> Last accessed: 2015-04-28

-58-
The World Bank. (2011). Household Cookstoves, Environment, Health, and Climate Change: A
New Look at an Old Problem. The World Bank, The Environment Department (Climate
Change).
Tucker M. (1999) Can solar cooking save the forests?, Ecological Economics 31 (1999) pp. 77-89.
UNDP (2010). United Nations Developent Program's Human Development Report. United
Nations.
UN-HABITAT (1993) UNCHS (Habitat) in Sub-Saharan Africa. P 75-76.
UNHCR. (2002). Cooking Options in Refugee Situations. United Nations High Commissioner
for Refugees.
Wentzel M. and Pouris A., (2007), The development impact on solar cookers: A review of solar
cooking impact research in South Africa. Energy Policy 35 (2007) pp. 1909-1919.
WHO (2006). Fuel for Life - Household Energy and Health.
WHO (2014). Indoor air pollution and health. Available at:
<http://www.who.int/mediacentre/factsheets/fs292/en/> Last accessed:
Wikipedia (2014a) Sommar. Available at: <http://sv.wikipedia.org/wiki/Sommar > Last
Accessed: 2015-04-15.
Wikipedia (2014b) Vinter. Available at: <http://sv.wikipedia.org/wiki/Vinter> Last Accessed:
2015-04-15.
Wikipedia (2015a) Årstid. Available at: <http://sv.wikipedia.org/wiki/Årstid> Last Accessed:
2015-04-15.
Wikipedia (2015b) Höst. Available at: <http://sv.wikipedia.org/wiki/Höst > Last Accessed:
2015-04-15.
Wikipedia (2015c) Vår. Available at: <http://sv.wikipedia.org/wiki/Vår> Last Accessed: 2015-
04-15.
Wikipedia (2015d) Solar Cooker. Available at: <http://en.wikipedia.org/wiki/Solar_cooker>
Last Accessed: 2015-02-21.
Windroch International (2009) Commercialzation of Improved Cookstoves for Reduced Indoor
Air Pollution - Urban Slums of Northwest Bangladesh. United States Agency for International
Development.
ISAT/GTZ (1999) Biogas Digest Volume I. Biogas Basics, Information and Advisory Service on
Appropriate Technology (ISAT), Deutsche Gesellschaft für Technische Zusammenarbeit (GTZ).

-59-
SMHI (2014) Metan. Available at: <http://www.smhi.se/slcp/om-slcp/metan-1.20073> Last
accessed: 2015-05-18

-60-
Interviews
Timba I. (2015) In person, Universidade Eduardo Mondlane, Estação de Biologia Marítima da
Inhaca, Inhaca, Mozambique.
Albano G. (2015) In person, Universidade Eduardo Mondlane, Estação de Biologia Marítima da
Inhaca, Inhaca, Mozambique.
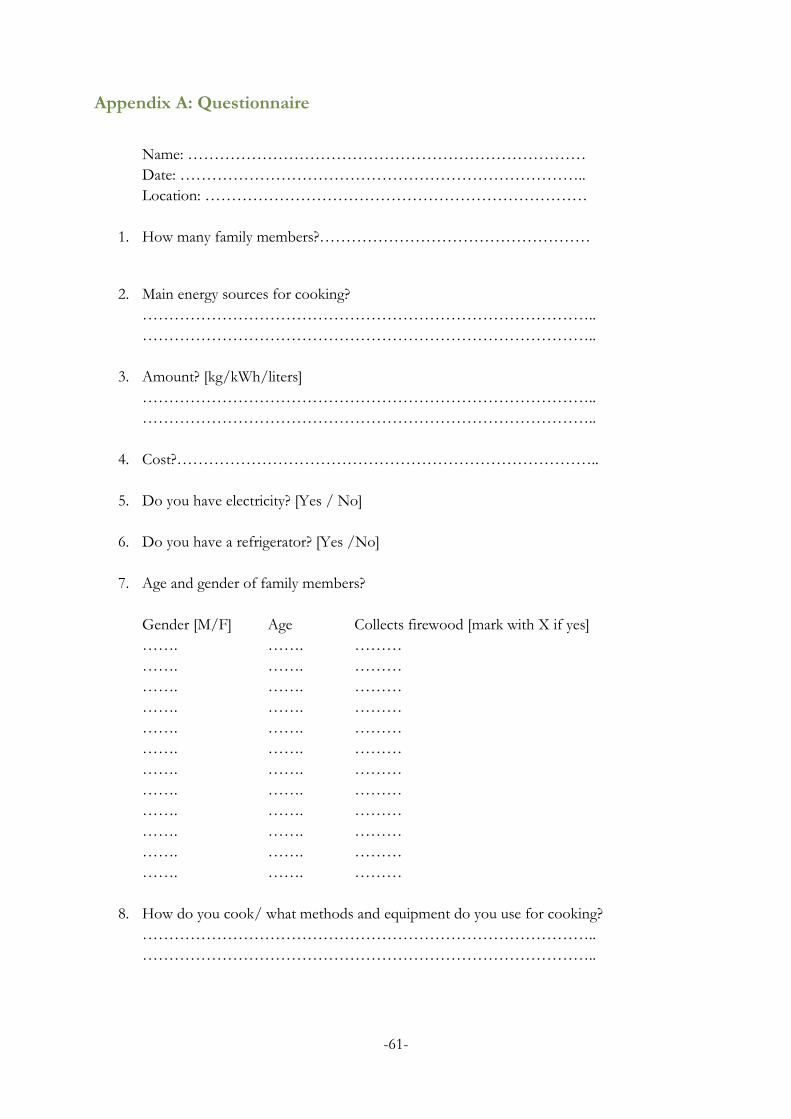
-61-
Appendix A: Questionnaire
Name: …………………………………………………………………
Date: …………………………………………………………………..
Location: ………………………………………………………………
1. How many family members?……………………………………………
2. Main energy sources for cooking?
…………………………………………………………………………..
…………………………………………………………………………..
3. Amount? [kg/kWh/liters]
…………………………………………………………………………..
…………………………………………………………………………..
4. Cost?……………………………………………………………………..
5. Do you have electricity? [Yes / No]
6. Do you have a refrigerator? [Yes /No]
7. Age and gender of family members?
Gender [M/F] Age Collects firewood [mark with X if yes]
……. ……. ………
……. ……. ………
……. ……. ………
……. ……. ………
……. ……. ………
……. ……. ………
……. ……. ………
……. ……. ………
……. ……. ………
……. ……. ………
……. ……. ………
……. ……. ………
8. How do you cook/ what methods and equipment do you use for cooking?
…………………………………………………………………………..
…………………………………………………………………………..
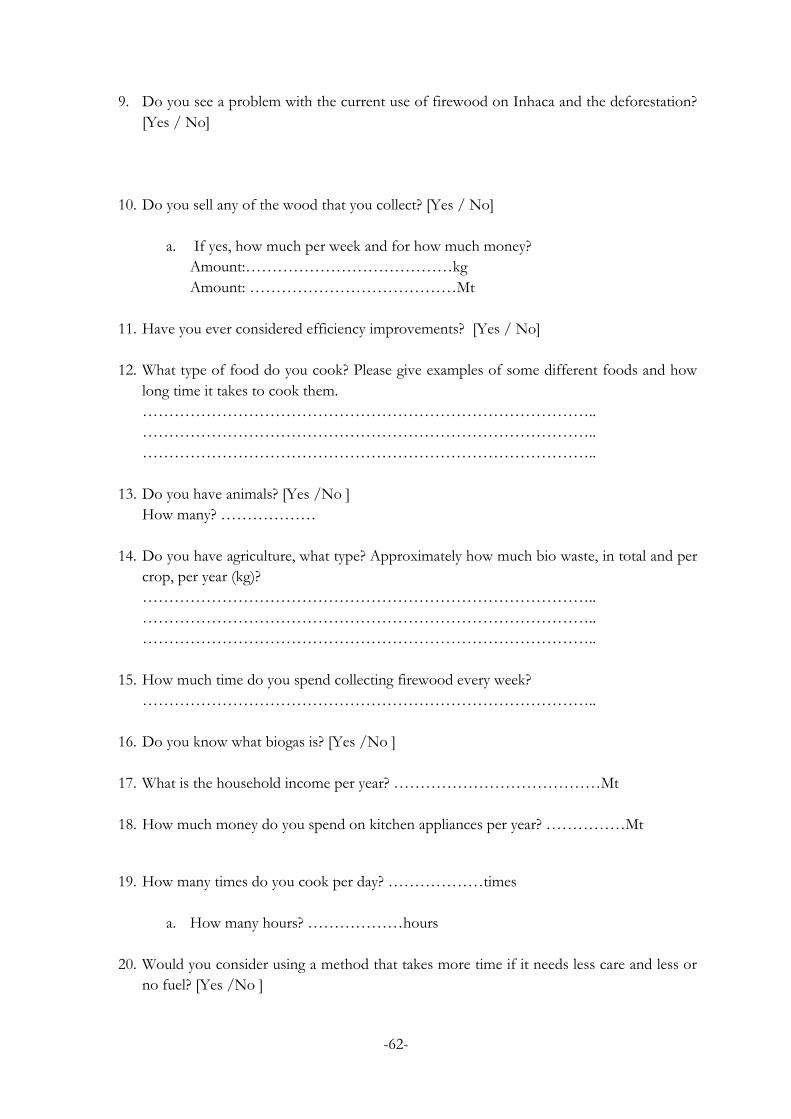
-62-
9. Do you see a problem with the current use of firewood on Inhaca and the deforestation?
[Yes / No]
10. Do you sell any of the wood that you collect? [Yes / No]
a. If yes, how much per week and for how much money?
Amount:…………………………………kg
Amount: …………………………………Mt
11. Have you ever considered efficiency improvements? [Yes / No]
12. What type of food do you cook? Please give examples of some different foods and how
long time it takes to cook them.
…………………………………………………………………………..
…………………………………………………………………………..
…………………………………………………………………………..
13. Do you have animals? [Yes /No ]
How many? ………………
14. Do you have agriculture, what type? Approximately how much bio waste, in total and per
crop, per year (kg)?
…………………………………………………………………………..
…………………………………………………………………………..
…………………………………………………………………………..
15. How much time do you spend collecting firewood every week?
…………………………………………………………………………..
16. Do you know what biogas is? [Yes /No ]
17. What is the household income per year? …………………………………Mt
18. How much money do you spend on kitchen appliances per year? ……………Mt
19. How many times do you cook per day? ………………times
a. How many hours? ………………hours
20. Would you consider using a method that takes more time if it needs less care and less or
no fuel? [Yes /No ]

-63-
21. Do you use open fire today? [Yes/No]
22. How much wood do you use during one day?
Weighted amount:…………………………………………………………kg

-64-
Appendix B: Animals and agricultural waste in households
Family
members,
j=1
Hen,
j=2 Pig, j=3
Duck,
j=4
Total
waste
per year
Total biogas production
(liter)
Biogas in household
(liter per person)
8 15 2 0 20 2565,5 320,7
12 1 1 0 29 1508,8 125,7
9 12 3 0 13,5 3674,6 408,3
4 1 0 0 3 134,7 33,7
9 8 0 0 2,5 335,9 37,3
7 0 1 0 8 1328,4 189,8
9 14 0 15 4,5 469,8 52,2
3 8 0 0 3 147,3 49,1
5 10 1 0 2,5 1324,1 264,8
7 0 0 0 0 220,5 31,5
11 0 0 0 35 374,1 34,0
7 0 0 0 20 236,3 33,8
15 1 0 0 30 502,5 33,5
6 0 0 0 0 189,0 31,5
6 2 4 0 8 4614,3 769,1
6 18 4 0 6,5 4713,9 785,7
9 0 0 0 2 285,1 31,7
5 10 0 0 3,5 223,3 44,7
7 17 0 0 4 330,8 47,3
6 0 0 0 8 195,3 32,6
11 4 6 3 3 7002,6 636,6
6 0 2 0 5 2396,1 399,4
8 1 0 0 21 274,9 34,4
4 0 0 0 10 133,9 33,5
2 0 1 0 11 1173,3 586,6

-65-
Appendix C: Exchange rates
Exchange rates 1 USD 35.28 MZT
1 USD 63.07 INR
1 USD 0.91 EUR