identifying accident hotspots - sjjpa · 3.55%. thruway bus routes. route. ridership. bus market...
TRANSCRIPT
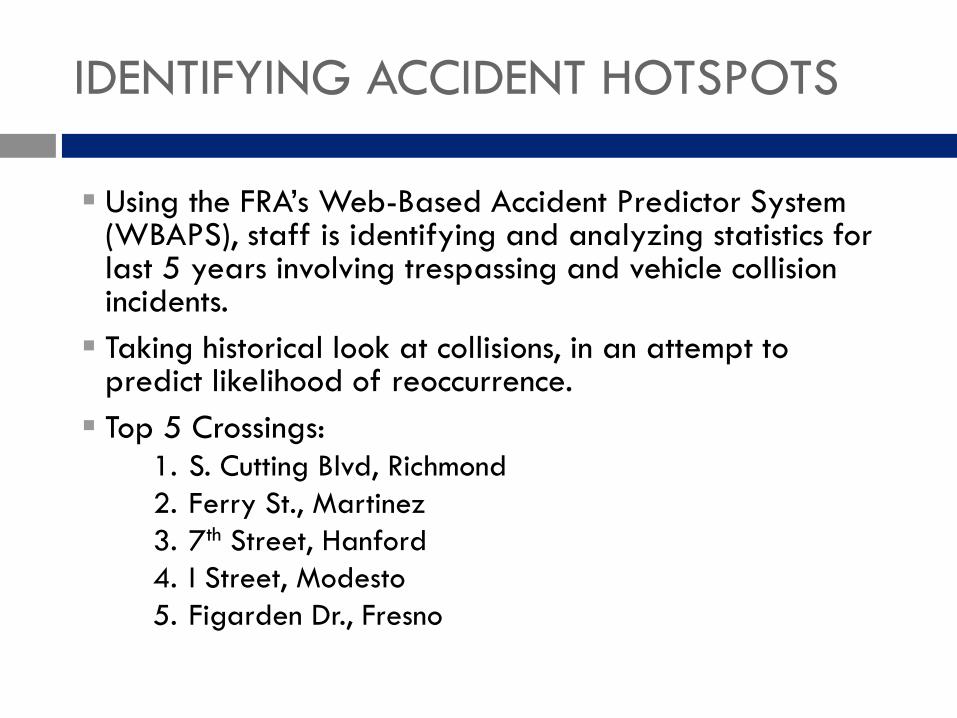
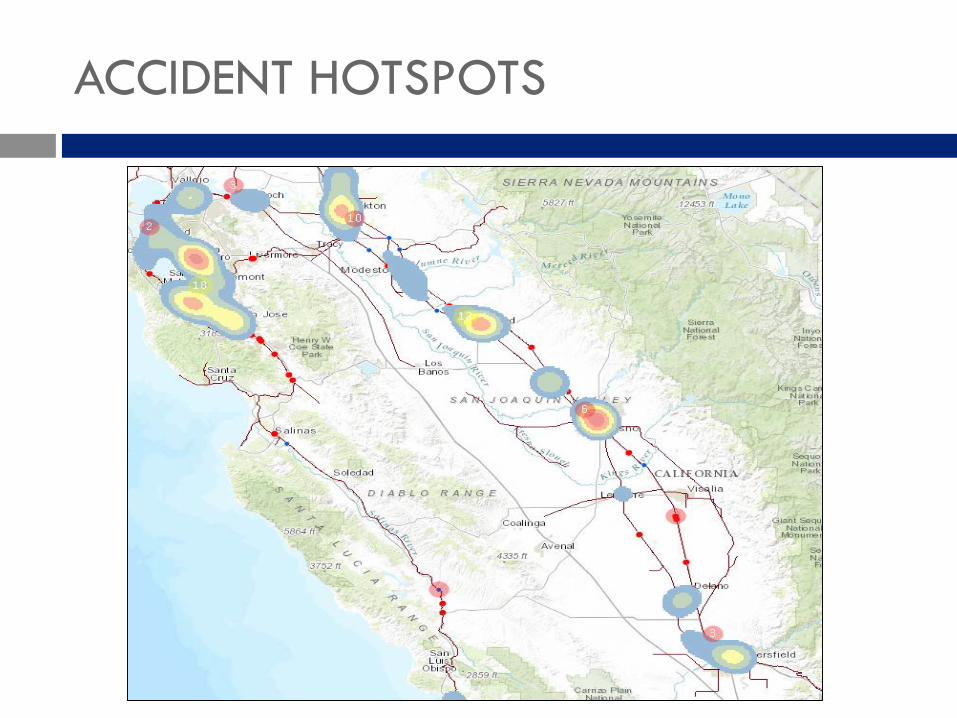
Using the FRA’s Web-Based Accident Predictor System (WBAPS), staff is identifying and analyzing statistics for last 5 years involving trespassing and vehicle collision incidents. Taking historical look at collisions, in an attempt to
predict likelihood of reoccurrence. Top 5 Crossings:
1. S. Cutting Blvd, Richmond2. Ferry St., Martinez3. 7th Street, Hanford4. I Street, Modesto5. Figarden Dr., Fresno
IDENTIFYING ACCIDENT HOTSPOTS
ACCIDENT HOTSPOTS
Northern California Rail Safety Team (NC RST)
CAOL, FRA, CPUC, freight RRs, Amtrak, SJRRC, SJJPA, Caltrain, and Caltrans Education: media events, safety presentations,
safety messages (PSAs), partner with business along ROW to present rail safety message at safety meetings, driver / employee training; SJJPA Safety & Security information on website.
Enforcement: safety train, informational blitzes, working with local law enforcement.
Engineering: signage, fencing, landscaping, pavement markings, crossing closures.
COLLABORATIVE STRATEGIES
California Operation Lifesaver www.caol.us – September –California Rail Safety Month – 100s of people reached through fairs, booths, presentations.
Antioch Unified School District Bus Drivers –training/awareness sessions.
Emergency Notification Sign (ENS) cards developed to be placed on trains, stations, distribute to driver training classes, etc.
Ag Alert article: Safety First – Making Good Decisions Near Railroad Tracks
Kids ‘n’ Trains – letter included by Amtrak in all group confirmation packets that encourages the trip coordinator to obtain free safety training for kids.
OUTREACH EFFORTS
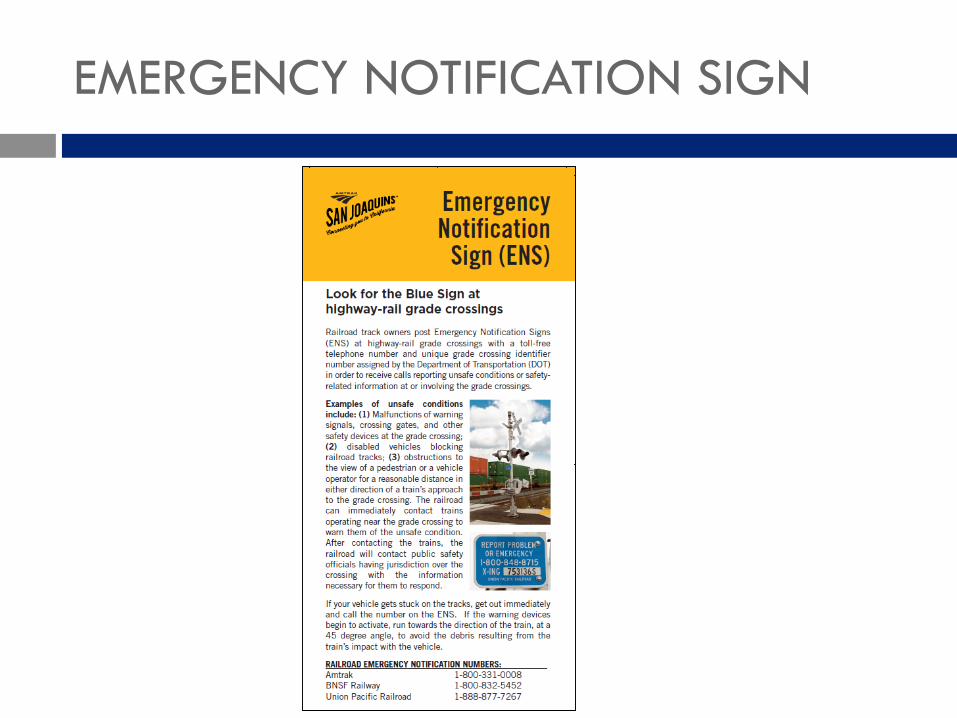
EMERGENCY NOTIFICATION SIGN

Safety and security plan components:
Meetings with LE / Coroner –discussed steps taken after incident occurs; what do they need from railroad to possibly expedite train movement.
Amtrak Police liaison Martino activities report (excerpt): MARTINEZ, CA March 3, 2016 Interagency Liaison Met with Captain Roxanne Gruenheld, Sgt
David Cook, and Deputy Guy Worth from the Contra Costa Sheriff’s Department. We rode an Amtrak Capitol Corridor train from Martinez to Sacramento. Amtrak Managers, Sean Paul, and Clint Watkins accompanied us on the trip. Each of the officers were allowed into the cab car so that they could get the Engineers view. Conversations ensued about rail incidents and the responses from emergency service personnel and the coroners office. Mr. Paul also explained how Amtrak Managers will allow police personnel to view the video footage on scene so that it may help to expedite the investigatory process.
PLANNING EFFORTS
Law Enforcement Fare Exemption (LEFE) – fare exempt program for sworn LE officers willing to assist in an on-board incident – Letter and application issued by SJJPA and Amtrak PD is being sent to LE identified along the SJ corridor.
Officer on a Train – extend this program to officers to ride the head end of a train to experience locomotive engineer’s viewpoint and see the right of way from a new perspective.
Safety Train – 9.26.16 Richmond to Martinez – LE (ATK, BN, UP, local) positioned at highway/rail grade crossings to cite drivers/pedestrians driving/walking around lowered gates. Police and Fire departments were given the opportunity to ride head end.
PLANNING EFFORTS
Goal – Conduct and coordinate 2 Safety Train exercises next year on SJ route with Amtrak and host railroad(s).
Partnership with OES along SJ route – worked together during CA Rail Safety Month in Sept. to raise awareness through robust social media campaign, outreach efforts.
PLANNING EFFORTS
Amtrak employee block training – attend training class in Nov. – review and assess
Training and Exercises with First Responders August 2016 – hosted TSA exercise Stockton – IED
scenario Sept. 28 – TTX Dublin – catastrophic train derailment at
Jack London Square Nov 17th drill – BNSF Ry – train / bus collision in Richmond Nov. 21st – Exercise with San Joaquin County Office of
Emergency Services
EMERGENCY PREPAREDNESS
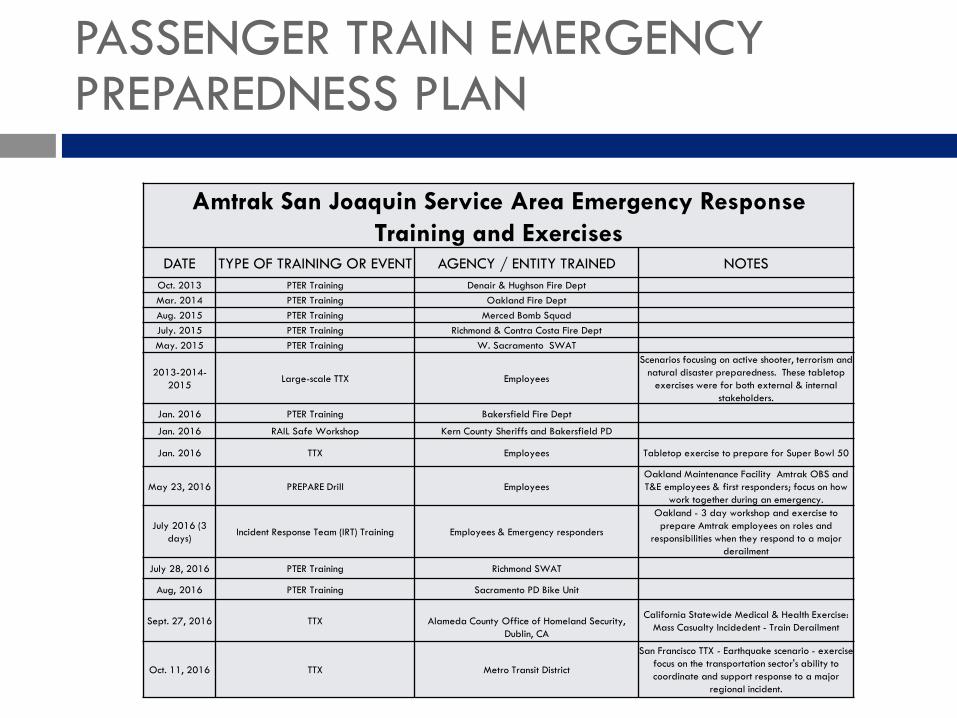
Amtrak San Joaquin Service Area Emergency Response Training and Exercises
DATE TYPE OF TRAINING OR EVENT AGENCY / ENTITY TRAINED NOTESOct. 2013 PTER Training Denair & Hughson Fire DeptMar. 2014 PTER Training Oakland Fire DeptAug. 2015 PTER Training Merced Bomb SquadJuly. 2015 PTER Training Richmond & Contra Costa Fire DeptMay. 2015 PTER Training W. Sacramento SWAT
2013-2014-2015 Large-scale TTX Employees
Scenarios focusing on active shooter, terrorism and natural disaster preparedness. These tabletop
exercises were for both external & internal stakeholders.
Jan. 2016 PTER Training Bakersfield Fire Dept
Jan. 2016 RAIL Safe Workshop Kern County Sheriffs and Bakersfield PD
Jan. 2016 TTX Employees Tabletop exercise to prepare for Super Bowl 50
May 23, 2016 PREPARE Drill EmployeesOakland Maintenance Facility Amtrak OBS and T&E employees & first responders; focus on how
work together during an emergency.
July 2016 (3 days) Incident Response Team (IRT) Training Employees & Emergency responders
Oakland - 3 day workshop and exercise to prepare Amtrak employees on roles and
responsibilities when they respond to a major derailment
July 28, 2016 PTER Training Richmond SWAT
Aug, 2016 PTER Training Sacramento PD Bike Unit
Sept. 27, 2016 TTX Alameda County Office of Homeland Security, Dublin, CA
California Statewide Medical & Health Exercise: Mass Casualty Incidedent - Train Derailment
Oct. 11, 2016 TTX Metro Transit District
San Francisco TTX - Earthquake scenario - exercise focus on the transportation sector's ability to coordinate and support response to a major
regional incident.
PASSENGER TRAIN EMERGENCY PREPAREDNESS PLAN
Provision of training opportunities through DHS, FEMA, Cal OES, etc. Managers / supervisors to participate in ICS 400 in Sacramento
in December 2016. Online toolkit available through Cal OES – Workplace Violence.
Utilize Amtrak’s expertise in security matters via their Emergency Management and Corp. Security (EMCS), Region X; multi-disciplinary station security assessments to be conducted 2016/2017.
SAFETY & SECURITY RESOURCES
San Joaquin Joint Powers Authority
Item 12Station Connectivity Report
Daniel Krause
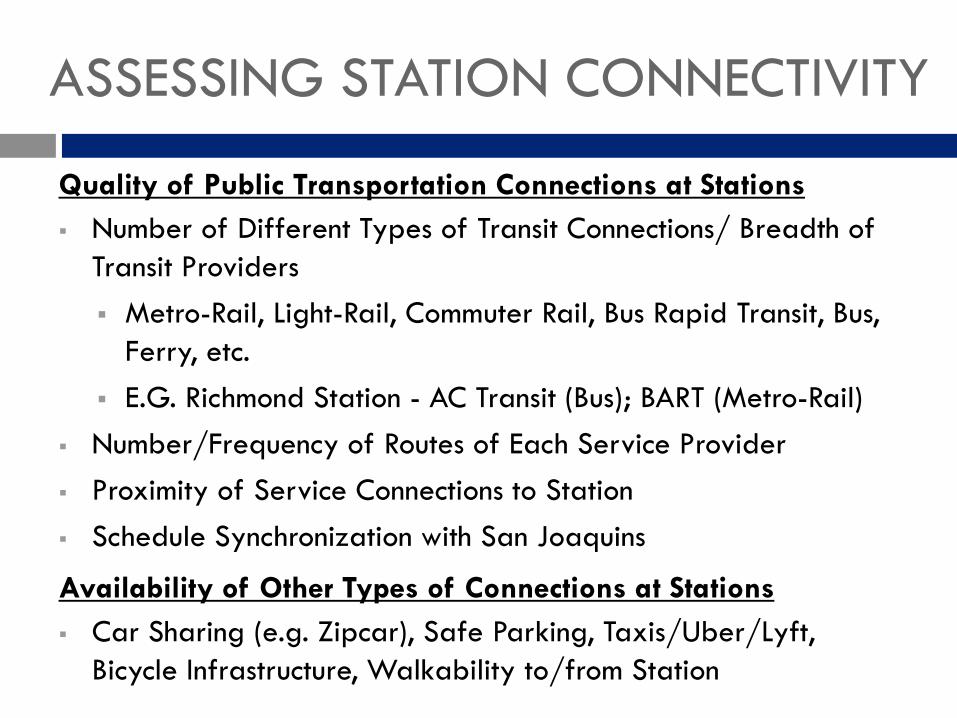
ASSESSING STATION CONNECTIVITY
Quality of Public Transportation Connections at Stations Number of Different Types of Transit Connections/ Breadth of
Transit Providers Metro-Rail, Light-Rail, Commuter Rail, Bus Rapid Transit, Bus,
Ferry, etc. E.G. Richmond Station - AC Transit (Bus); BART (Metro-Rail)
Number/Frequency of Routes of Each Service Provider Proximity of Service Connections to Station Schedule Synchronization with San Joaquins
Availability of Other Types of Connections at Stations Car Sharing (e.g. Zipcar), Safe Parking, Taxis/Uber/Lyft,
Bicycle Infrastructure, Walkability to/from Station
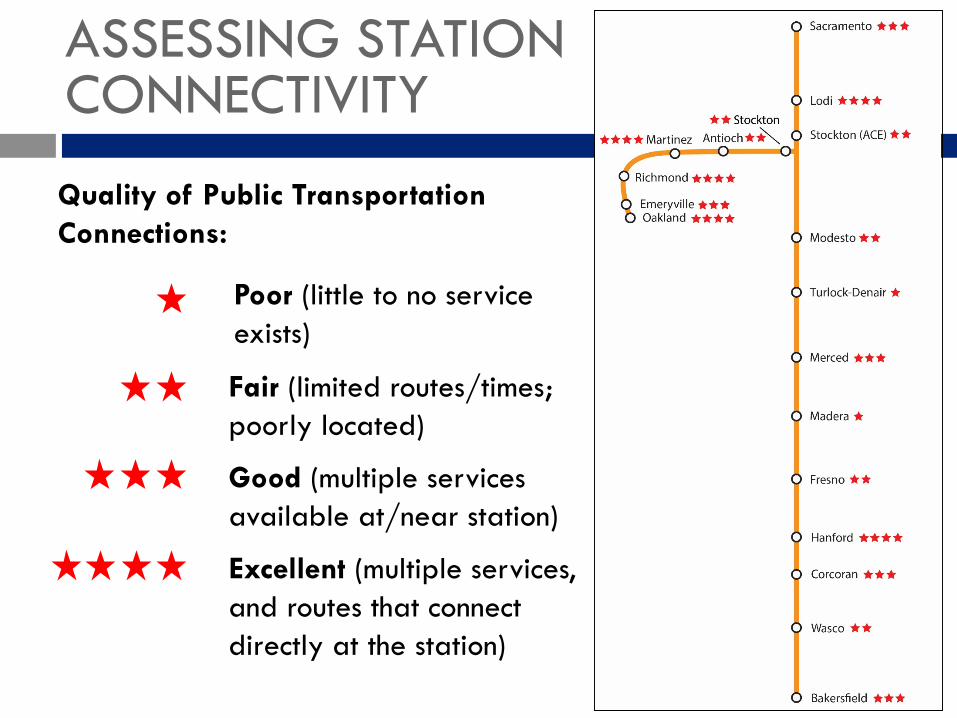
ASSESSING STATION CONNECTIVITY
Quality of Public Transportation Connections:
Poor (little to no service exists)
Fair (limited routes/times;poorly located)
Good (multiple servicesavailable at/near station)
Excellent (multiple services,and routes that connectdirectly at the station)
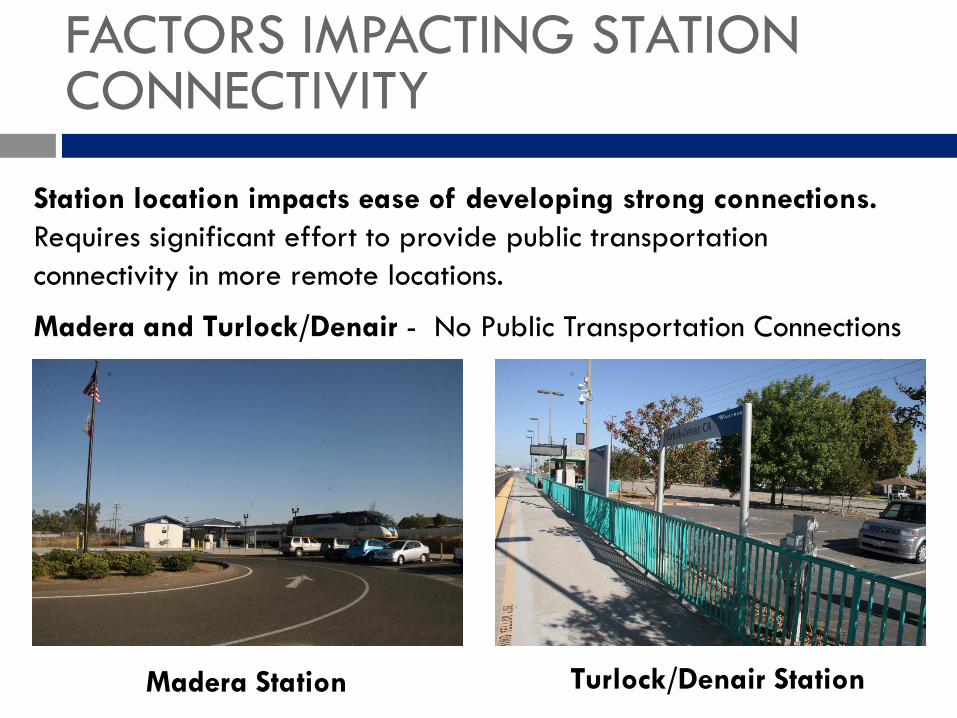
Station location impacts ease of developing strong connections.Requires significant effort to provide public transportation connectivity in more remote locations.
Madera and Turlock/Denair - No Public Transportation Connections
FACTORS IMPACTING STATION CONNECTIVITY
Madera Station Turlock/Denair Station
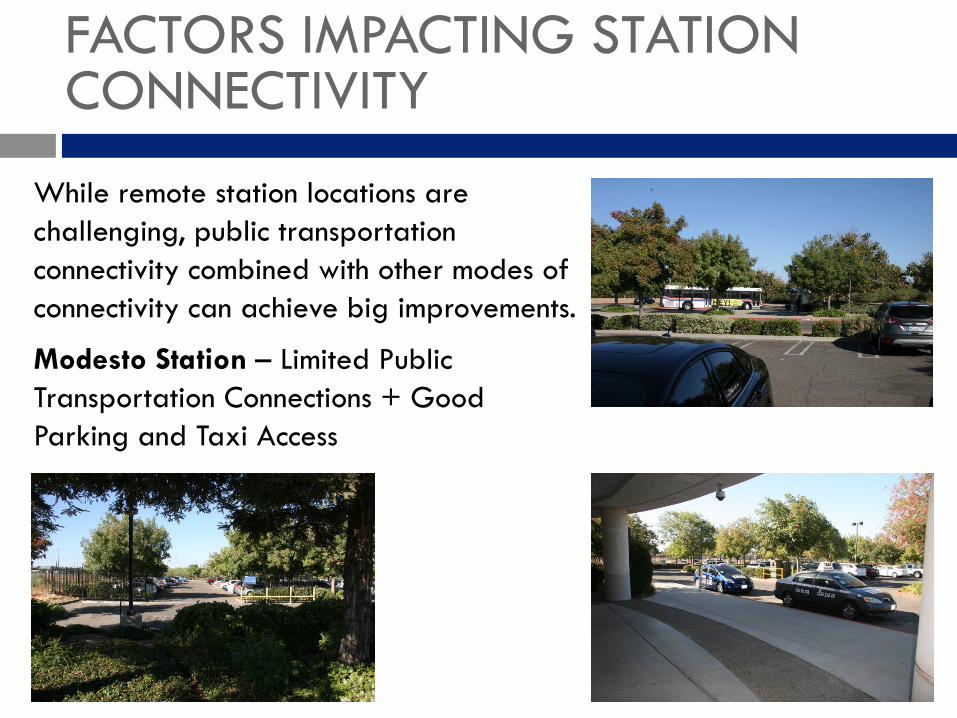
FACTORS IMPACTING STATION CONNECTIVITY
While remote station locations are challenging, public transportation connectivity combined with other modes of connectivity can achieve big improvements.
Modesto Station – Limited Public Transportation Connections + Good Parking and Taxi Access
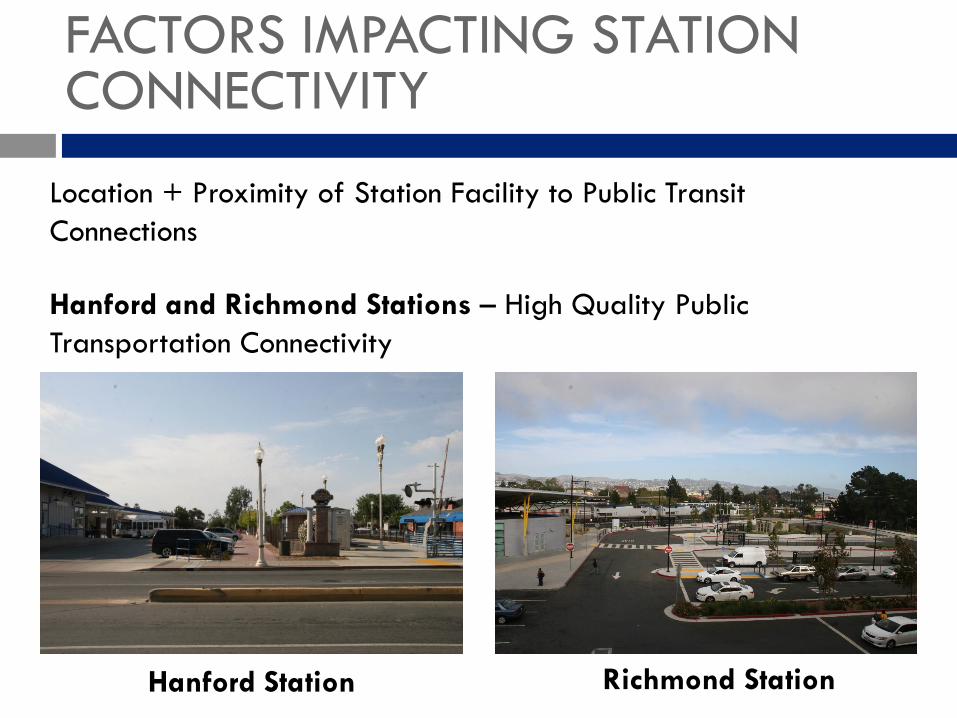
Location + Proximity of Station Facility to Public Transit Connections
FACTORS IMPACTING STATION CONNECTIVITY
Hanford Station Richmond Station
Hanford and Richmond Stations – High Quality Public Transportation Connectivity
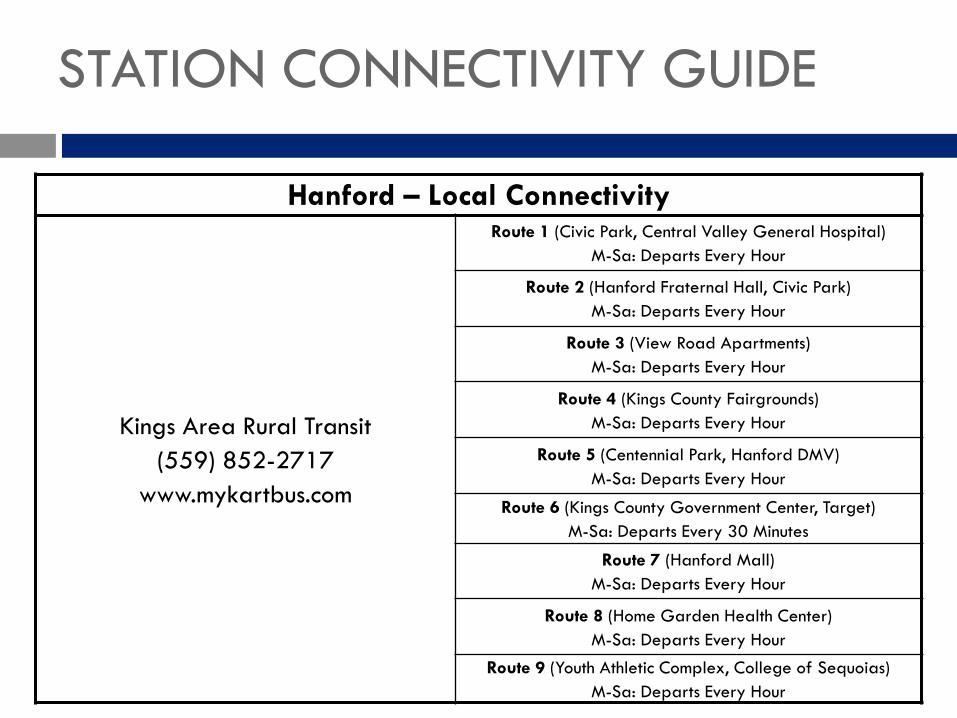
Hanford – Local Connectivity
Kings Area Rural Transit(559) 852-2717
www.mykartbus.com
Route 1 (Civic Park, Central Valley General Hospital)M-Sa: Departs Every Hour
Route 2 (Hanford Fraternal Hall, Civic Park)M-Sa: Departs Every Hour
Route 3 (View Road Apartments)M-Sa: Departs Every Hour
Route 4 (Kings County Fairgrounds)M-Sa: Departs Every Hour
Route 5 (Centennial Park, Hanford DMV)M-Sa: Departs Every Hour
Route 6 (Kings County Government Center, Target)M-Sa: Departs Every 30 Minutes
Route 7 (Hanford Mall)M-Sa: Departs Every Hour
Route 8 (Home Garden Health Center)M-Sa: Departs Every Hour
Route 9 (Youth Athletic Complex, College of Sequoias)M-Sa: Departs Every Hour
STATION CONNECTIVITY GUIDE
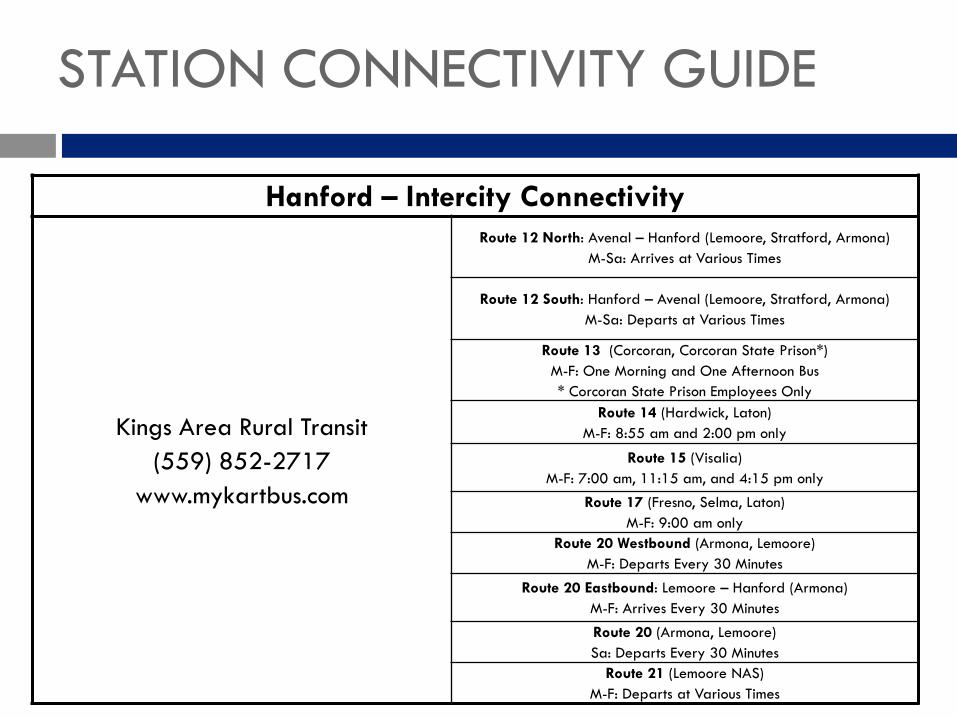
Hanford – Intercity Connectivity
Kings Area Rural Transit(559) 852-2717
www.mykartbus.com
Route 12 North: Avenal – Hanford (Lemoore, Stratford, Armona)M-Sa: Arrives at Various Times
Route 12 South: Hanford – Avenal (Lemoore, Stratford, Armona)M-Sa: Departs at Various Times
Route 13 (Corcoran, Corcoran State Prison*)M-F: One Morning and One Afternoon Bus* Corcoran State Prison Employees Only
Route 14 (Hardwick, Laton)M-F: 8:55 am and 2:00 pm only
Route 15 (Visalia)M-F: 7:00 am, 11:15 am, and 4:15 pm only
Route 17 (Fresno, Selma, Laton)M-F: 9:00 am only
Route 20 Westbound (Armona, Lemoore)M-F: Departs Every 30 Minutes
Route 20 Eastbound: Lemoore – Hanford (Armona)M-F: Arrives Every 30 Minutes
Route 20 (Armona, Lemoore)Sa: Departs Every 30 Minutes
Route 21 (Lemoore NAS)M-F: Departs at Various Times
STATION CONNECTIVITY GUIDE
Working with Amtrak to Post Station Connectivity Information on the AmtrakSanJoaquins.com Website.
Working with Cities/Counties to Increase Transit Service to Remote Stations
Working with Transit Providers to Improve Schedule Coordination
Signage Improvements between Modes (e.g. Oakland Amtrak Station – SF Ferry Building/Jack London Square Ferry Terminals)
SJJPA Efforts to Improve Public Transportation Connectivity
IMPROVING STATION CONNECTIVITY
San Joaquin Joint Powers Authority
Item 13Thruway Bus Service Update
Daniel Krause
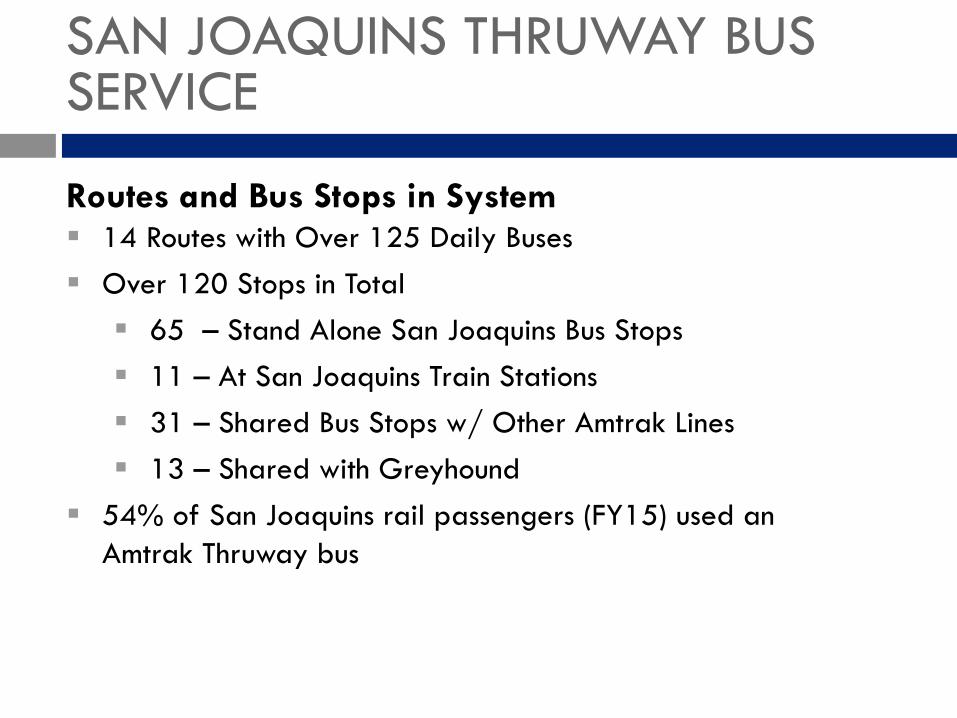
Routes and Bus Stops in System 14 Routes with Over 125 Daily Buses Over 120 Stops in Total 65 – Stand Alone San Joaquins Bus Stops 11 – At San Joaquins Train Stations 31 – Shared Bus Stops w/ Other Amtrak Lines 13 – Shared with Greyhound
54% of San Joaquins rail passengers (FY15) used an Amtrak Thruway bus
SAN JOAQUINS THRUWAY BUS SERVICE
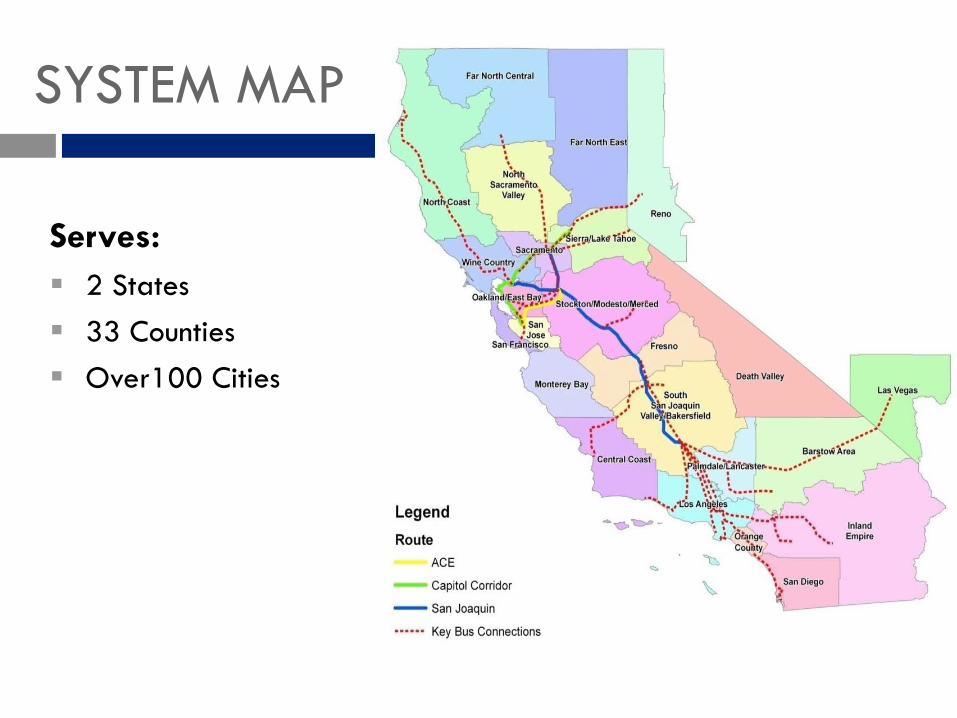
SYSTEM MAP
Serves: 2 States 33 Counties Over100 Cities
SAN JOAQUINS THRUWAY BUS SERVICE
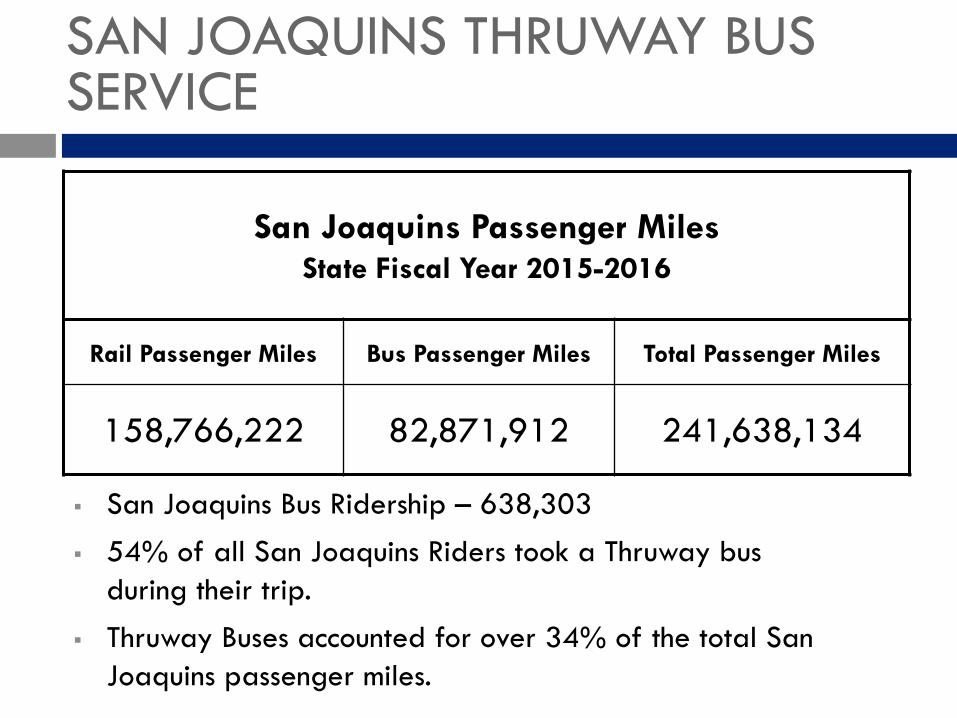
San Joaquins Passenger MilesState Fiscal Year 2015-2016
Rail Passenger Miles Bus Passenger Miles Total Passenger Miles
158,766,222 82,871,912 241,638,134
San Joaquins Bus Ridership – 638,303 54% of all San Joaquins Riders took a Thruway bus
during their trip. Thruway Buses accounted for over 34% of the total San
Joaquins passenger miles.

THRUWAY BUS ROUTES
Route RidershipBus Market
Share
Route 1
A: Bakersfield/Fresno • Los Angeles • Santa Ana • San Diego (15 Buses) 177,114
310,288 39.63%B: Bakersfield • Long Beach • San Pedro
(8 Buses) 86,314
C: Bakersfield • Van Nuys • UCLA • Torrance(8 Buses) 46,860
Route 3: Stockton/Sacramento • Davis • Chico • Redding(19 Buses) 142,227 18.17%
Route 7: Martinez • Napa • Santa Rosa • Arcata(12 Buses) 63,177 8.07%
Route 99: Emeryville • San Francisco(10 Buses) 58,292 7.45%
THRUWAY BUS ROUTES
Route RidershipBus Market
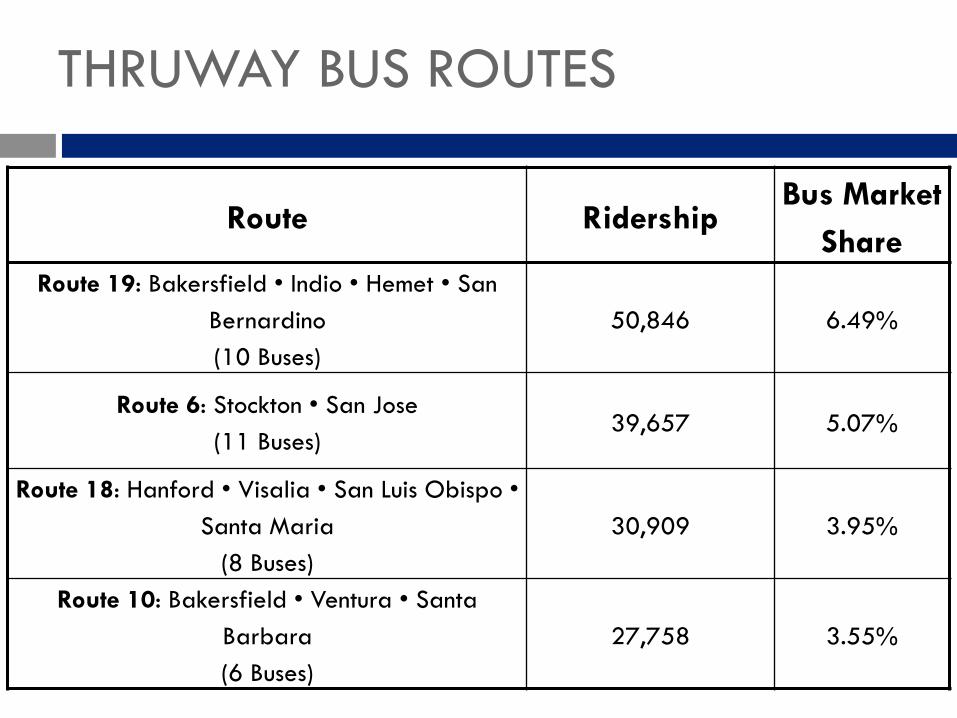
ShareRoute 19: Bakersfield • Indio • Hemet • San
Bernardino(10 Buses)
50,846 6.49%
Route 6: Stockton • San Jose(11 Buses)
39,657 5.07%
Route 18: Hanford • Visalia • San Luis Obispo • Santa Maria
(8 Buses)30,909 3.95%
Route 10: Bakersfield • Ventura • Santa Barbara(6 Buses)
27,758 3.55%
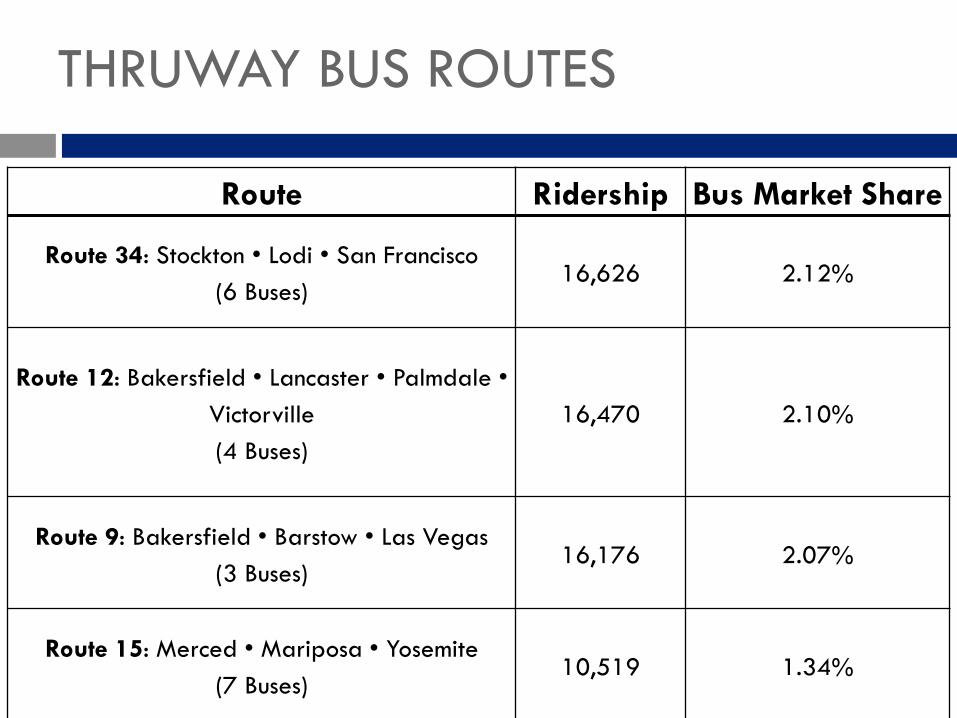
THRUWAY BUS ROUTES
Route Ridership Bus Market Share
Route 34: Stockton • Lodi • San Francisco(6 Buses)
16,626 2.12%
Route 12: Bakersfield • Lancaster • Palmdale • Victorville(4 Buses)
16,470 2.10%
Route 9: Bakersfield • Barstow • Las Vegas(3 Buses)
16,176 2.07%
Route 15: Merced • Mariposa • Yosemite(7 Buses)
10,519 1.34%
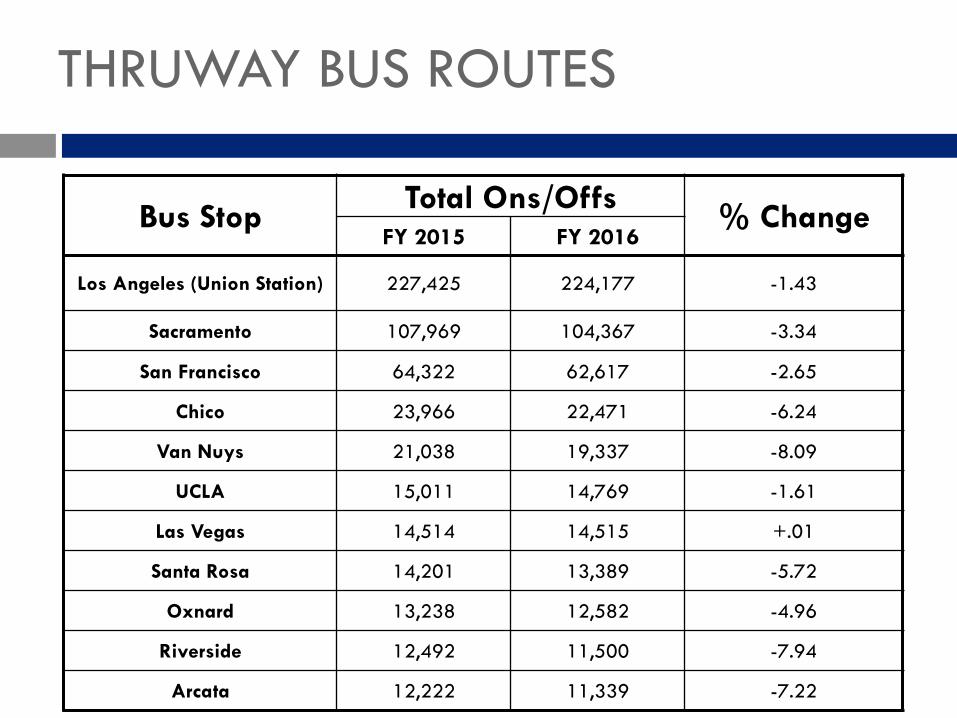
THRUWAY BUS ROUTES
Bus Stop Total Ons/Offs % ChangeFY 2015 FY 2016
Los Angeles (Union Station) 227,425 224,177 -1.43
Sacramento 107,969 104,367 -3.34
San Francisco 64,322 62,617 -2.65
Chico 23,966 22,471 -6.24
Van Nuys 21,038 19,337 -8.09
UCLA 15,011 14,769 -1.61
Las Vegas 14,514 14,515 +.01
Santa Rosa 14,201 13,389 -5.72
Oxnard 13,238 12,582 -4.96
Riverside 12,492 11,500 -7.94
Arcata 12,222 11,339 -7.22
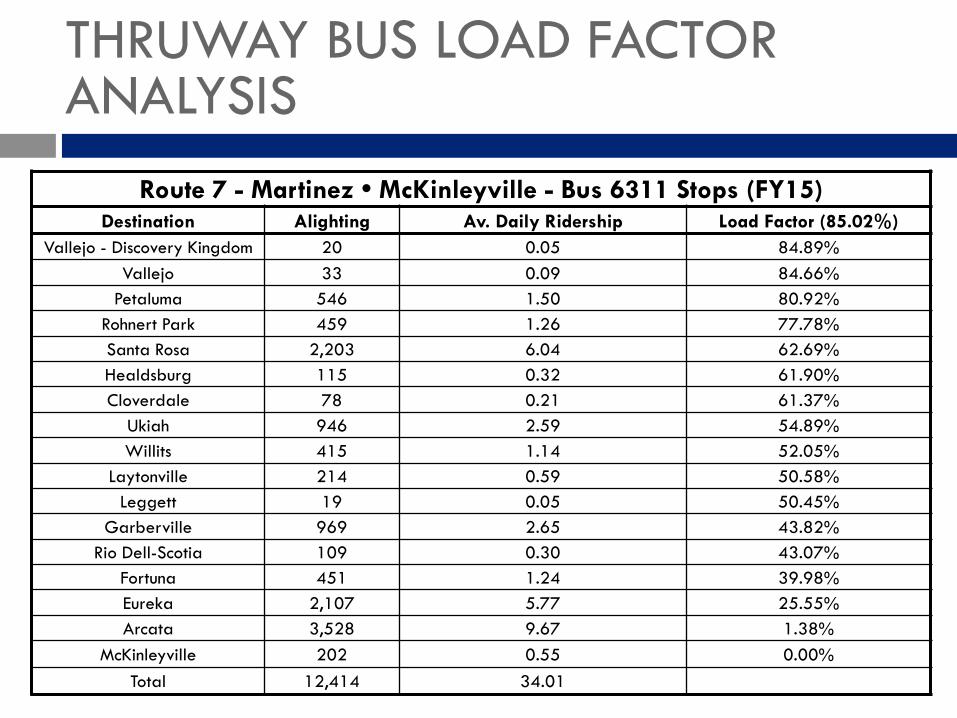
Route 7 - Martinez • McKinleyville - Bus 6311 Stops (FY15)Destination Alighting Av. Daily Ridership Load Factor (85.02%)
Vallejo - Discovery Kingdom 20 0.05 84.89%Vallejo 33 0.09 84.66%
Petaluma 546 1.50 80.92%Rohnert Park 459 1.26 77.78%Santa Rosa 2,203 6.04 62.69%Healdsburg 115 0.32 61.90%Cloverdale 78 0.21 61.37%
Ukiah 946 2.59 54.89%Willits 415 1.14 52.05%
Laytonville 214 0.59 50.58%Leggett 19 0.05 50.45%
Garberville 969 2.65 43.82%Rio Dell-Scotia 109 0.30 43.07%
Fortuna 451 1.24 39.98%Eureka 2,107 5.77 25.55%Arcata 3,528 9.67 1.38%
McKinleyville 202 0.55 0.00%Total 12,414 34.01
THRUWAY BUS LOAD FACTOR ANALYSIS
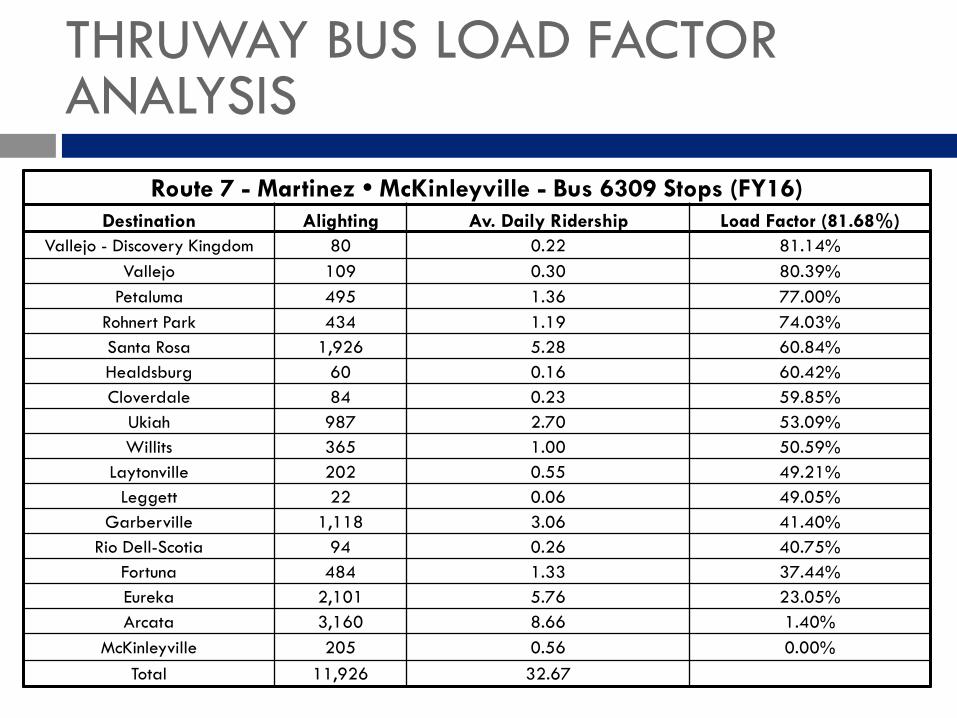
Route 7 - Martinez • McKinleyville - Bus 6309 Stops (FY16)Destination Alighting Av. Daily Ridership Load Factor (81.68%)
Vallejo - Discovery Kingdom 80 0.22 81.14%Vallejo 109 0.30 80.39%
Petaluma 495 1.36 77.00%Rohnert Park 434 1.19 74.03%Santa Rosa 1,926 5.28 60.84%Healdsburg 60 0.16 60.42%Cloverdale 84 0.23 59.85%
Ukiah 987 2.70 53.09%Willits 365 1.00 50.59%
Laytonville 202 0.55 49.21%Leggett 22 0.06 49.05%
Garberville 1,118 3.06 41.40%Rio Dell-Scotia 94 0.26 40.75%
Fortuna 484 1.33 37.44%Eureka 2,101 5.76 23.05%Arcata 3,160 8.66 1.40%
McKinleyville 205 0.56 0.00%Total 11,926 32.67
THRUWAY BUS LOAD FACTOR ANALYSIS
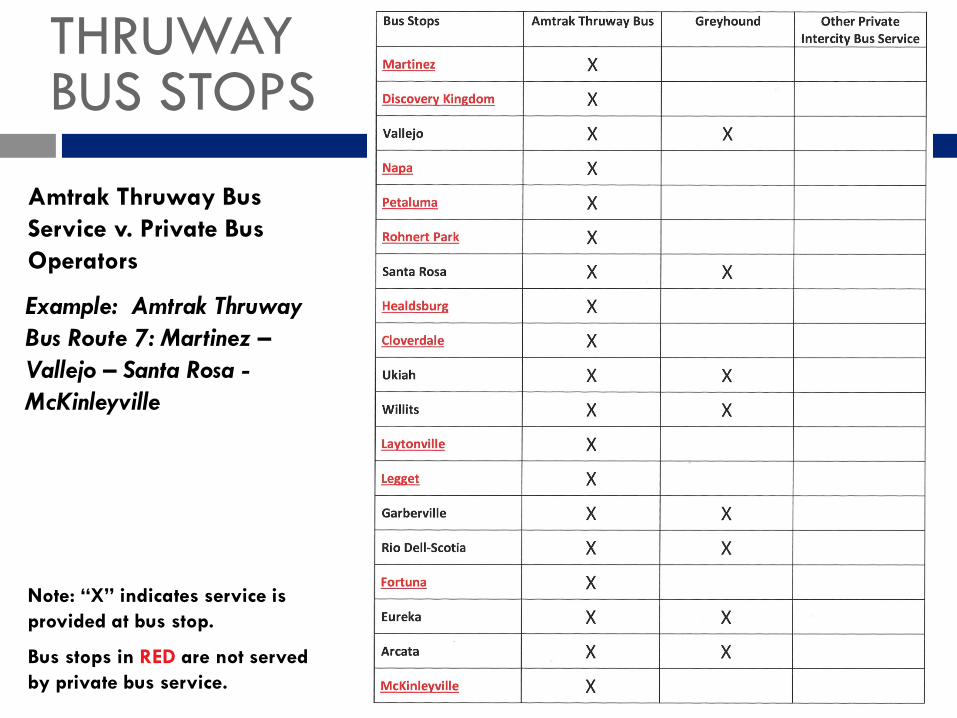
THRUWAY BUS STOPS
Amtrak Thruway Bus Service v. Private Bus Operators
Example: Amtrak Thruway Bus Route 7: Martinez –Vallejo – Santa Rosa -McKinleyville
Bus stops in RED are not served by private bus service.
Note: “X” indicates service is provided at bus stop.
Next Steps Continue to refine bus data we receive from Amtrak. Calculate distribution of Thruway Bus passengers who
ride the San Joaquins rail portion Provide in-depth FY comparison for all routes, stops, and
buses Calculate GHG/VMT reductions for all routes and buses
THRUWAY BUS SERVICE
San Joaquin Joint Powers Authority
Item 14Marketing and Outreach Update
David Lipari
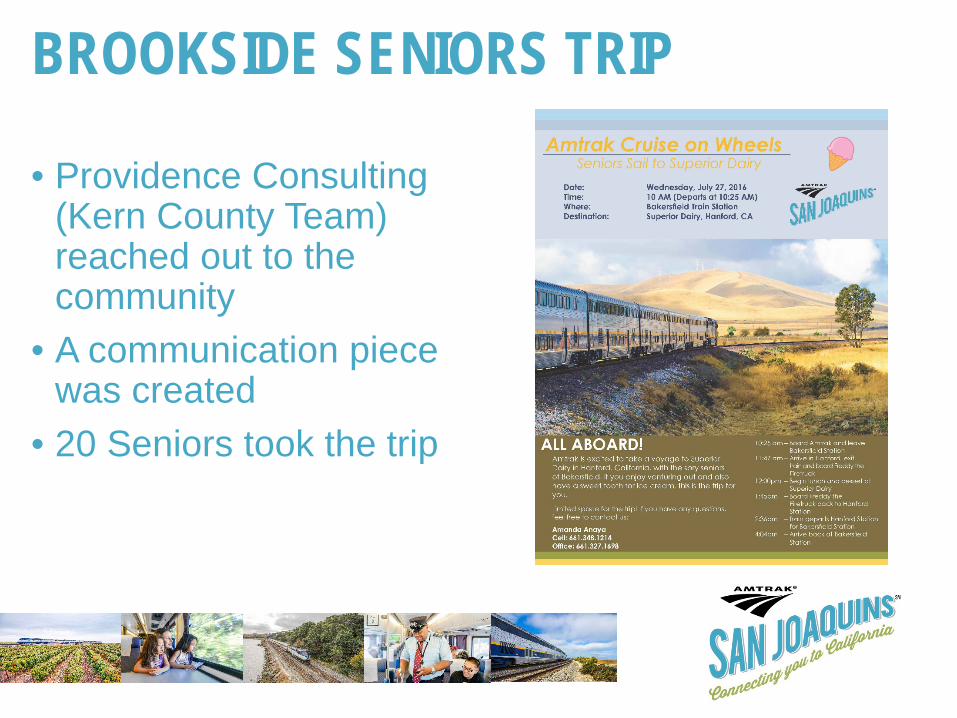
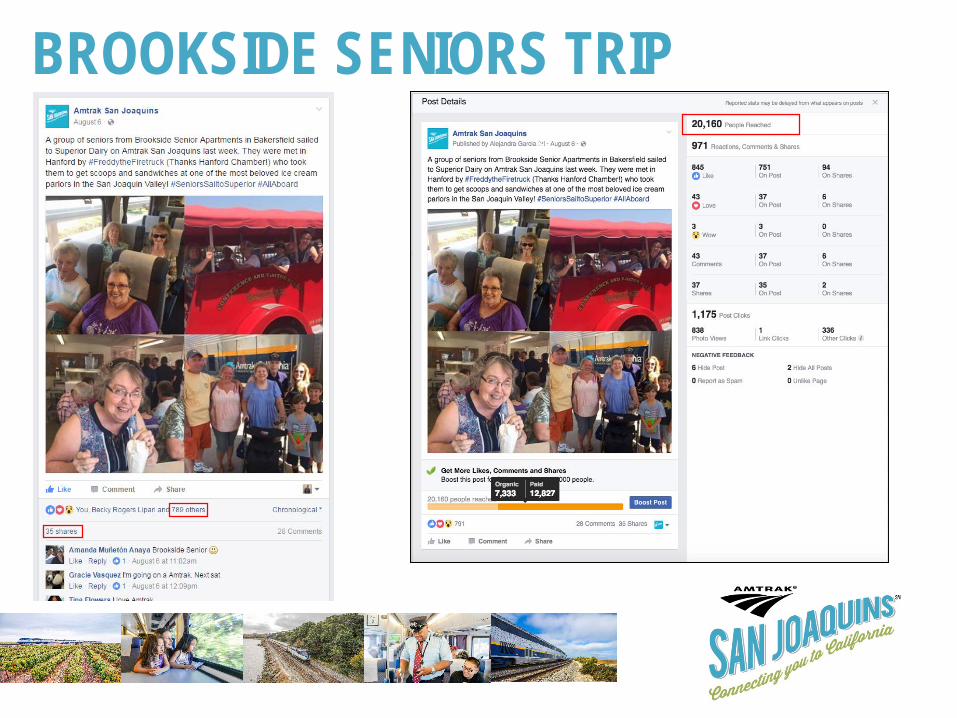
BROOKSIDE SENIORS TRIP
• Providence Consulting (Kern County Team) reached out to the community
• A communication piece was created
• 20 Seniors took the trip
BROOKSIDE SENIORS TRIP

RAIL ADVENTURESGROUP / RIDER STORYTELLING CAMPAIGN
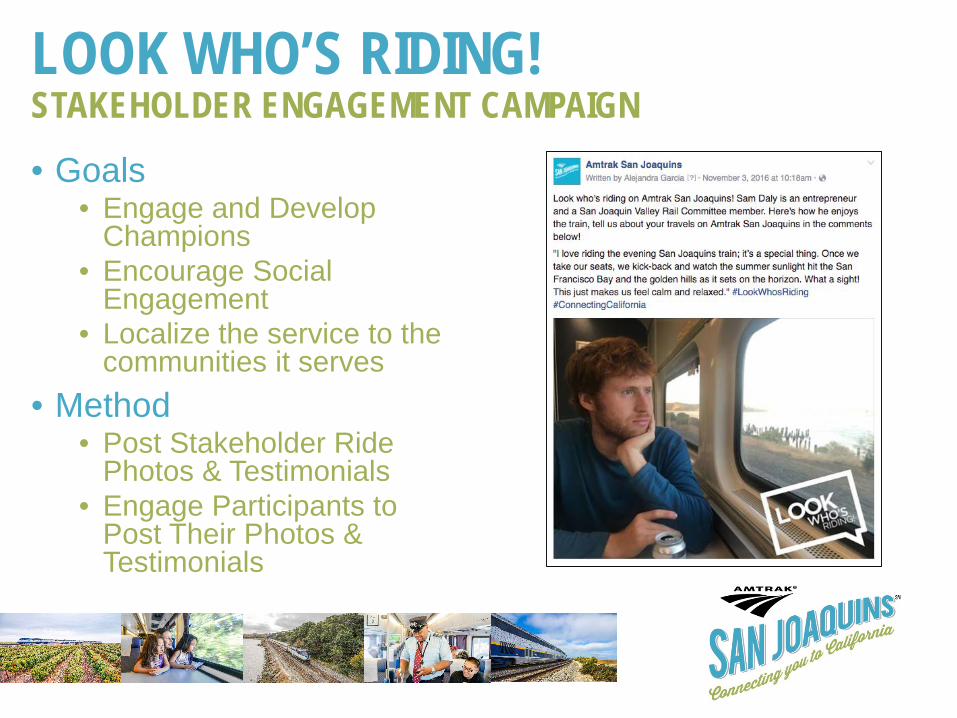
LOOK WHO’S RIDING!STAKEHOLDER ENGAGEMENT CAMPAIGN
• Goals• Engage and Develop
Champions• Encourage Social
Engagement• Localize the service to the
communities it serves• Method
• Post Stakeholder Ride Photos & Testimonials
• Engage Participants to Post Their Photos & Testimonials

LOOK WHO’S RIDING!STAKEHOLDER ENGAGEMENT CAMPAIGN
• How Do People Engage?
• Simple Outreach Flyer• Outreach at Board,
Committee, and Org Meetings
• Employ Marketing & Outreach Teams
• Organic Participation• Social Post Visibility
COG CHALLENGEMEMBER AGENCY ENGAGEMENT CAMPAIGN• Goals
• Capitalize on the ‘Look Who’s Riding!’ Campaign• Engage and Develop Champions• Localize the service to the communities it serves
• Method• Challenge Each Member Agency along with Its Member
Cities to Ride the Train and Report to SJJPA• Prizes Will Be Awarded for 1st, 2nd, and 3rd
• Coming Q1 2017
A CONNECTION FOR EVERYONEVIDEO CAMPAIGN• Release Mechanisms
• Social Posting & Advertising• Facebook• Instagram• Twitter• Youtube
• Art Walk Display• Fresno Art Walk – JSA Offices
• Photo Stream on Website• Community Interaction
• Gather Photos from Riders to Populate New Videos
San Joaquin Joint Powers Authority
Item 15
Executive Director’s Report
Stacey Mortensen
San Joaquin Joint Powers Authority
Item 16
Administrative Items
Dan Leavitt
San Joaquin Joint Powers Authority
Item 17
Board Members Comments
San Joaquin Joint Powers Authority
Item 18
Adjournment
November 3, 2016 Board Meeting