identifikasi industri
TRANSCRIPT

Identifikasi Industri

Non-competitive Industries ?
De-industrialization?
Shift to domestic market due to very high domestic demand?
Global production network?
Industries with high imported input?
Assembling Industries?
Industries with Low value added?
Shift to domestic market ? Competitive Industries ?
Import Growth
Export Growth

Telephones for cellular networks mobile, Electronic integrated circuits as
memories, Copper cathodes and sections of cathodes unwrought, Cargo
vessels, cameras, Articles of plastics (39.01 to 39.14), Digital processing units not sold as complete systems,
Medicaments, Automobiles, Electronic integrated circuit, Gold non-monetary, Portable digital
computers, Machines for the reception, conversion and transmission or regeneration, Parts of telephone,
Aircraft >15000, Parts and accessories of printers, copying machines and facsimile, Parts and
accessories of bodies for motor vehicles, Aircraft parts, Reception apparatus for television,
Transmissions for motor vehicles, Static converters, Taps, cocks, valves, Parts of turbo-jets, Diesel
powered trucks < 5 Tons, Pneumatic tire new of rubber for motor car, Printed circuits
Electronic integrated circuits as processors and controllers,
Parts&accessories of automatic data processg machines, Computer data storage units, Motor vehicle parts,
Articles of jewellery
Photosensitive semiconductdevice,photovoltaic cells&light emit
diodes.
Import Growth
Export Growth
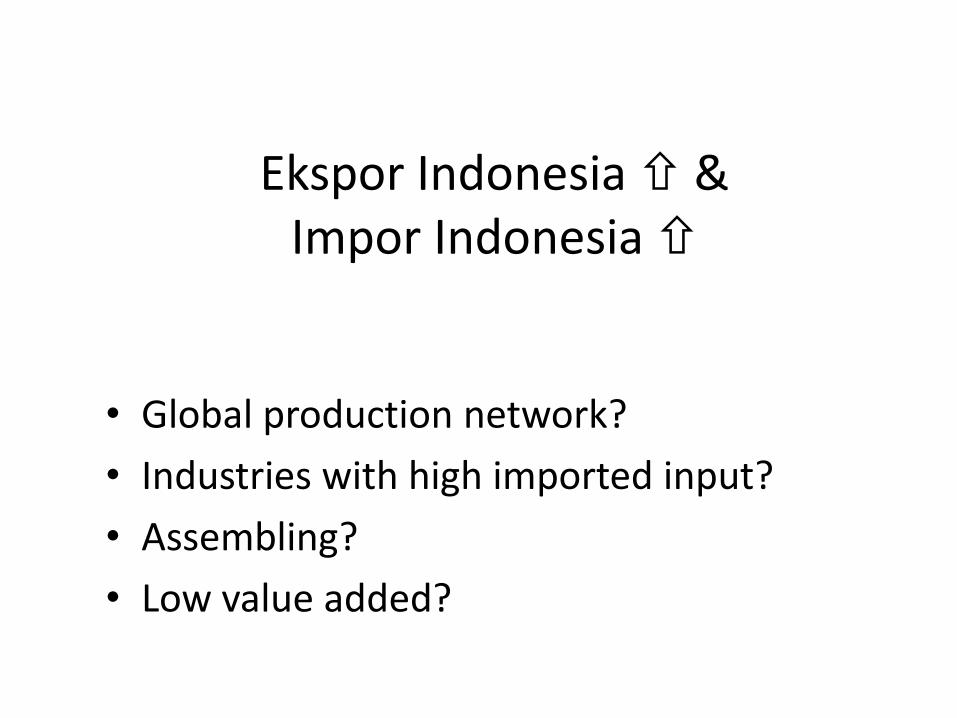
Ekspor Indonesia &Impor Indonesia
• Global production network?
• Industries with high imported input?
• Assembling?
• Low value added?

300490 - Medicaments nes, in dosage (BK)
-
20,000
40,000
60,000
80,000
100,000
120,000
140,000
160,000
180,000
2003 2004 2005 2006 2007 2008 2009 2010 2011 2012
-
50,000,000
100,000,000
150,000,000
200,000,000
250,000,000
300,000,000
2003 2004 2005 2006 2007 2008 2009 2010 2011 2012
-
50,000
100,000
150,000
200,000
250,000
300,000
350,000
2003 2004 2005 2006 2007 2008 2009 2010 2011 2012
Impor Dunia (Demand)
Ekspor Indonesia
Impor Indonesia

300490 - Medicaments nes, in dosageImporters 2004 2005 2006 2007 2008 2009 2010 2011 2012
1 United States of America 13.9% 14.1% 15.6% 15.2% 14.4% 14.8% 15.2% 13.6% 12.8%2 Germany 5.9% 6.6% 6.8% 6.5% 6.6% 7.0% 7.1% 8.6% 7.8%3 Belgium 18.7% 18.2% 15.7% 15.3% 14.1% 12.0% 10.8% 8.4% 7.1%4 France 5.9% 5.8% 6.1% 6.4% 6.4% 6.6% 6.2% 5.9% 6.0%5 Japan 2.2% 2.4% 2.2% 2.1% 2.2% 3.0% 3.5% 4.0% 5.1%6 United Kingdom 6.5% 5.6% 5.2% 5.3% 4.9% 4.8% 5.2% 4.8% 4.7%7 Italy 4.3% 4.2% 4.3% 4.3% 4.4% 4.7% 4.6% 4.9% 4.7%8 Netherlands 4.1% 4.1% 4.0% 4.0% 3.7% 3.7% 3.6% 3.7% 3.9%9 Switzerland 3.6% 3.7% 3.8% 3.5% 3.2% 3.5% 3.3% 3.7% 3.7%
10 Spain 3.5% 3.3% 3.0% 3.3% 3.7% 4.3% 3.7% 3.4% 3.6%11 Russian Federation 1.1% 1.6% 2.0% 1.8% 2.2% 2.1% 2.5% 2.8% 2.9%12 Canada 3.1% 3.1% 3.4% 3.1% 2.8% 3.0% 2.9% 2.8% 2.7%13 Australia 2.3% 2.4% 2.1% 2.1% 2.1% 2.1% 2.3% 2.7% 2.6%14 China 0.5% 0.6% 0.6% 0.8% 1.0% 1.2% 1.3% 1.8% 2.4%
Exporters 2004 2005 2006 2007 2008 2009 2010 2011 20121 Germany 14.2% 15.1% 15.1% 15.8% 16.4% 15.2% 14.4% 14.0% 14.3%2 Switzerland 7.3% 7.8% 8.3% 8.0% 8.7% 9.0% 9.1% 10.1% 10.5%3 Belgium 16.5% 16.6% 15.7% 16.1% 14.6% 13.7% 11.7% 11.3% 9.4%4 France 9.3% 9.4% 8.8% 8.7% 9.0% 8.8% 8.2% 7.9% 8.5%5 United States of America 6.5% 6.4% 6.7% 6.2% 6.4% 7.6% 7.5% 7.7% 8.2%6 United Kingdom 10.0% 8.6% 8.5% 8.3% 8.4% 8.1% 8.1% 7.0% 7.0%7 Ireland 9.9% 7.7% 6.6% 6.1% 6.7% 7.8% 8.2% 8.3% 6.8%8 Italy 4.2% 4.5% 4.7% 4.4% 4.1% 3.9% 4.3% 4.7% 5.1%9 Netherlands 4.2% 4.0% 4.0% 3.9% 2.9% 3.1% 4.1% 4.3% 4.5%
10 Spain 2.2% 3.0% 2.9% 3.4% 3.5% 3.2% 3.3% 3.0% 3.1%11 India 0.7% 0.9% 0.9% 0.9% 1.1% 1.2% 1.5% 2.0% 2.6%12 Sweden 3.6% 3.2% 3.3% 2.9% 2.8% 2.7% 2.7% 2.3% 1.8%13 Singapore 0.2% 1.0% 1.9% 2.1% 1.4% 1.5% 1.6% 1.3% 1.8%14 Israel 0.8% 1.1% 1.4% 1.3% 1.7% 1.6% 1.9% 1.6% 1.6%
Indonesia 0.0% 0.0% 0.0% 0.0% 0.0% 0.0% 0.0% 0.0% 0.1%
Thailand
Korea, Republic of
Australia
Nigeria
Philippines
Viet Nam
Malaysia
Singapore
Sri Lanka
Myanmar
Destinasi Ekspor Indonesia

870323 - Automobiles w reciprocatg piston engine displacg > 1500 cc to 3000 cc (BK/BM)
-
50,000,000
100,000,000
150,000,000
200,000,000
250,000,000
300,000,000
2003 2004 2005 2006 2007 2008 2009 2010 2011 2012
-
100,000
200,000
300,000
400,000
500,000
600,000
700,000
800,000
900,000
1,000,000
2003 2004 2005 2006 2007 2008 2009 2010 2011 2012-
200,000
400,000
600,000
800,000
1,000,000
1,200,000
2003 2004 2005 2006 2007 2008 2009 2010 2011 2012

870323 - Automobiles w reciprocatg piston engine displacg > 1500 cc to 3000 cc
Importers 2004 2005 2006 2007 2008 2009 2010 2011 20121 United States of America 26.3% 25.4% 27.0% 23.5% 23.3% 25.2% 27.1% 26.9% 30.6%2 China 1.6% 1.4% 1.6% 1.9% 2.5% 5.2% 8.5% 11.3% 12.4%
3 Canada 5.7% 6.3% 6.2% 5.9% 6.1% 5.9% 5.9% 5.4% 5.6%
4 Russian Federation 1.8% 2.6% 3.7% 5.3% 7.3% 2.7% 2.7% 4.3% 4.4%
5 Germany 6.9% 6.6% 6.4% 5.4% 5.6% 6.6% 4.8% 4.2% 3.3%
6 Australia 3.0% 3.2% 2.9% 3.0% 2.9% 3.0% 3.5% 3.0% 3.2%7 Brazil 0.2% 0.3% 0.7% 0.9% 1.4% 2.1% 2.3% 3.1% 2.5%
8 Japan 2.7% 2.7% 2.1% 2.0% 1.6% 1.5% 1.6% 1.9% 2.2%
9 Saudi Arabia 1.3% 1.4% 1.5% 1.8% 1.9% 2.3% 2.5% 2.8% 2.1%10 Belgium 2.8% 2.5% 2.1% 2.2% 2.3% 3.0% 2.1% 2.0% 1.9%
11 United Kingdom 10.5% 9.2% 8.7% 9.0% 7.1% 6.6% 5.0% 2.5% 1.7%
12 Mexico 2.3% 2.5% 2.6% 2.3% 1.9% 1.6% 1.7% 1.7% 1.7%
13 Argentina 0.4% 0.5% 0.6% 0.7% 1.2% 1.1% 1.5% 1.7% 1.6%
14 United Arab Emirates 0.0% 1.2% 0.0% 1.3% 1.9% 0.8% 1.2% 1.4% 1.5%
Exporters 2004 2005 2006 2007 2008 2009 2010 2011 20121 Japan 17.9% 18.6% 20.0% 21.3% 22.9% 19.5% 21.0% 18.4% 20.3%
2 Germany 18.4% 21.0% 20.6% 17.8% 17.7% 21.5% 21.2% 21.5% 19.8%
3 Korea, Republic of 7.3% 7.4% 7.2% 7.5% 7.5% 9.3% 9.2% 10.9% 11.1%
4 United States of America 7.7% 9.0% 9.4% 9.7% 9.8% 8.1% 8.7% 9.7% 8.3%
5 Mexico 3.9% 5.0% 6.7% 6.7% 7.2% 7.4% 8.6% 7.9% 7.6%
6 Canada 3.3% 2.8% 2.9% 3.1% 3.0% 4.2% 5.4% 5.5% 6.8%
7 United Kingdom 6.0% 5.1% 4.2% 4.7% 4.6% 3.9% 3.9% 4.2% 5.5%
8 Belgium 7.7% 7.0% 6.1% 5.3% 4.1% 4.6% 3.2% 3.7% 3.4%
9 Slovakia 1.3% 1.0% 1.3% 1.4% 0.7% 0.8% 1.2% 1.6% 1.5%10 Spain 4.9% 3.3% 3.1% 3.3% 3.0% 3.1% 1.8% 1.5% 1.3%
11 France 6.3% 5.4% 3.8% 3.2% 2.6% 2.0% 1.6% 1.5% 1.2%12 Czech Republic 0.5% 0.6% 0.6% 0.6% 0.8% 1.0% 0.8% 0.9% 1.1%
13 Brazil 1.5% 1.6% 1.5% 1.4% 1.5% 1.4% 1.4% 1.2% 1.1%
14 Sweden 3.4% 2.7% 1.9% 1.5% 1.0% 0.8% 1.0% 1.1% 1.0%
Indonesia 0.0% 0.1% 0.1% 0.2% 0.2% 0.2% 0.2% 0.3% 0.4%
Saudi Arabia
Thailand
United Arab Emirates
Oman
Philippines
Kuwait
South Africa
Qatar
Peru
Taipei, Chinese

854239 - Electronic integrated circuits (excl. such as processors, controllers, (BB)
-
50,000
100,000
150,000
200,000
250,000
300,000
350,000
2003 2004 2005 2006 2007 2008 2009 2010 2011 2012
0
20000000
40000000
60000000
80000000
10000000
12000000
14000000
16000000
18000000
20000000
2003 2004 2005 2006 2007 2008 2009 2010 2011 2012
-
200,000
400,000
600,000
800,000
1,000,000
1,200,000
1,400,000
1,600,000
2003 2004 2005 2006 2007 2008 2009 2010 2011 2012

854239 - Electronic integrated circuits (excl. such as processors, controllers,Importers 2007 2008 2009 2010 2011 2012
1 Singapore 34.3% 28.1% 21.4% 22.3% 21.0% 21.1%
2 China 15.2% 17.7% 18.1% 17.9% 17.8% 20.3%
3 Hong Kong, China 16.3% 16.3% 15.8% 15.3% 15.9% 15.9%
4 Taipei, Chinese 0.0% 0.0% 13.9% 13.8% 13.9% 12.7%
5 Japan 6.5% 6.7% 4.8% 4.9% 4.9% 4.7%
6 United States of America 6.4% 6.6% 4.7% 4.4% 4.7% 4.3%
7 Korea, Republic of 4.0% 4.2% 4.6% 3.2% 3.0% 3.2%
8 Malaysia 0.0% 0.0% 1.7% 1.7% 1.8% 2.6%
9 Germany 3.6% 3.8% 2.5% 3.0% 3.0% 2.6%
10 Thailand 2.1% 1.8% 1.6% 1.7% 1.6% 1.6%
11 Mexico 0.0% 2.5% 1.9% 1.8% 1.7% 1.5%
12 France 1.5% 1.5% 1.1% 1.5% 1.2% 1.4%
13 Viet Nam 0.0% 0.5% 0.5% 0.7% 1.4% 0.9%
14 Indonesia 0.0% 0.0% 0.0% 0.4% 0.6% 0.7%
Exporters 2007 2008 2009 2010 2011 2012
1 Japan 0.0% 0.0% 27.4% 27.2% 30.7% 31.4%
2 Germany 46.0% 39.1% 26.0% 26.2% 22.2% 19.9%
3 Korea, Republic of 13.2% 16.4% 13.5% 13.7% 14.0% 15.2%
4 United States of America 10.7% 12.3% 8.3% 8.0% 7.3% 7.1%
5 Mexico 11.6% 11.1% 6.8% 6.6% 5.8% 5.4%
6 Canada 2.4% 3.0% 2.5% 3.0% 3.0% 4.6%
7 United Kingdom 0.0% 0.0% 4.2% 3.6% 4.2% 4.0%
8 Belgium 2.3% 2.6% 1.3% 1.8% 2.4% 2.3%
9 Slovakia 2.9% 3.6% 2.2% 2.2% 2.4% 2.2%
10 Spain 2.1% 1.2% 1.0% 1.0% 1.3% 2.0%
11 France 1.8% 2.5% 1.9% 2.1% 1.6% 1.0%
12 Czech Republic 1.7% 1.8% 1.1% 0.8% 0.8% 0.9%
13 Brazil 1.3% 1.3% 0.9% 0.8% 1.0% 0.8%
14 Sweden 1.0% 1.2% 0.7% 0.6% 0.6% 0.6%
Indonesia 0.0% 0.0% 0.0% 0.2% 0.2% 0.2%
Singapore
France
Malaysia
Korea, Republic of
China
Philippines
Japan
Hong Kong, China
Thailand
Uruguay

710812 - Gold in unwrought forms non-monetary (BB)
-
20,000,000
40,000,000
60,000,000
80,000,000
100,000,000
120,000,000
140,000,000
160,000,000
180,000,000
200,000,000
2003 2004 2005 2006 2007 2008 2009 2010 2011 2012
-
200,000
400,000
600,000
800,000
1,000,000
1,200,000
1,400,000
1,600,000
1,800,000
2,000,000
2003 2004 2005 2006 2007 2008 2009 2010 2011 2012
-
10,000
20,000
30,000
40,000
50,000
60,000
70,000
2003 2004 2005 2006 2007 2008 2009 2010 2011 2012

710812 - Gold in unwrought forms non-monetaryImporters 2004 2005 2006 2007 2008 2009 2010 2011 2012
1 India 20.5% 19.2% 24.1% 22.5% 23.6% 37.2% 37.8% 32.6% 27.2%
2 Hong Kong, China 4.7% 1.4% 2.3% 4.7% 5.7% 6.2% 7.2% 16.2% 26.3%
3 United States of America 13.6% 12.8% 15.5% 9.1% 8.3% 12.7% 11.8% 9.3% 8.8%
4 Thailand 3.6% 5.5% 5.2% 3.2% 8.9% 5.8% 7.7% 10.5% 5.8%
5 Canada 3.1% 5.4% 6.9% 6.4% 5.4% 6.3% 7.4% 6.6% 5.4%
6 Turkey 8.8% 11.0% 12.4% 12.4% 7.6% 2.6% 2.5% 4.0% 4.2%
7 United Arab Emirates 0.0% 12.8% 0.0% 14.2% 14.3% 2.6% 1.9% 1.8% 4.0%
8 Iran (Islamic Republic of) 0.1% 0.2% 0.0% 0.0% 0.0% 0.0% 0.5% 0.0% 3.6%
9 Italy 12.4% 9.8% 10.2% 9.6% 5.5% 4.5% 3.6% 2.7% 2.8%
10 Germany 1.2% 0.0% 0.0% 0.0% 0.0% 5.2% 4.2% 3.4% 2.6%
11 Australia 3.5% 3.2% 1.0% 1.1% 2.3% 2.9% 2.7% 2.2% 2.3%
12 United Kingdom 0.0% 0.0% 0.0% 0.0% 0.0% 0.0% 0.0% 0.0% 1.0%
13 Netherlands 0.3% 0.3% 0.8% 0.9% 1.4% 1.8% 1.4% 1.2% 1.0%
14 Austria 0.5% 0.9% 0.5% 1.5% 3.1% 4.4% 2.1% 1.4% 0.9%
Exporters 2004 2005 2006 2007 2008 2009 2010 2011 2012
1 Hong Kong, China 24.4% 9.3% 13.8% 9.4% 9.7% 11.9% 9.0% 15.7% 23.2%
2 United States of America 15.1% 19.8% 20.0% 25.3% 22.5% 14.3% 13.5% 14.8% 15.6%
3 Canada 11.2% 14.3% 13.1% 12.0% 10.5% 8.7% 12.0% 10.3% 7.1%
4 Turkey 0.2% 0.5% 1.5% 2.1% 5.0% 5.5% 1.9% 0.9% 6.2%
5 United Arab Emirates 0.0% 9.5% 0.0% 9.9% 10.9% 7.1% 8.2% 7.4% 6.2%
6 Italy 1.3% 2.0% 1.8% 1.8% 1.5% 3.3% 3.5% 5.0% 4.7%
7 Peru 10.4% 13.1% 11.1% 9.2% 7.6% 8.0% 6.9% 6.0% 4.4%
8 Germany 0.9% 0.0% 0.0% 0.0% 0.0% 3.1% 5.9% 5.5% 4.1%
9 Mexico 0.6% 1.2% 2.7% 3.3% 3.5% 4.3% 4.7% 4.3% 3.3%
10 Thailand 0.4% 0.6% 1.2% 3.1% 4.5% 6.5% 5.6% 3.4% 2.9%
11 Russian Federation 0.0% 0.0% 0.0% 0.0% 0.0% 0.0% 0.0% 0.0% 2.4%
12 Japan 0.6% 1.3% 3.6% 3.5% 3.9% 2.8% 3.2% 3.8% 2.0%
13 Colombia 2.2% 2.0% 0.6% 0.6% 1.1% 1.7% 1.8% 1.6% 1.5%
14 Korea, Republic of 3.3% 0.6% 1.7% 0.9% 1.1% 2.4% 2.0% 1.5% 1.2%
Indonesia 1.0% 0.9% 1.5% 1.5% 1.1% 1.0% 1.0% 1.1% 0.9%
South Africa
Australia
Singapore
Hong Kong, China
Taipei, Chinese

847130 - Portable digital computers <10kg (BM)
-
20,000,000
40,000,000
60,000,000
80,000,000
100,000,000
120,000,000
140,000,000
160,000,000
2003 2004 2005 2006 2007 2008 2009 2010 2011 2012
-
2,000
4,000
6,000
8,000
10,000
12,000
14,000
2003 2004 2005 2006 2007 2008 2009 2010 2011 2012
-
200,000
400,000
600,000
800,000
1,000,000
1,200,000
1,400,000
2003 2004 2005 2006 2007 2008 2009 2010 2011 2012

847130 - Portable digital computers <10kgImporters 2004 2005 2006 2007 2008 2009 2010 2011 2012
1 United States of America 33.2% 33.0% 32.1% 31.3% 28.5% 30.8% 28.8% 30.0% 29.4%
2 Netherlands 7.4% 3.0% 3.6% 4.2% 3.4% 3.8% 6.5% 5.6% 5.8%
3 Germany 7.5% 10.4% 11.7% 10.1% 9.6% 7.9% 8.1% 6.4% 5.6%
4 Japan 6.7% 6.7% 5.2% 4.5% 5.0% 4.9% 5.1% 5.4% 5.4%
5 United Kingdom 6.9% 6.3% 6.3% 5.9% 5.8% 5.3% 4.8% 4.1% 4.6%
6 Hong Kong, China 1.1% 1.1% 0.9% 1.2% 1.5% 1.3% 1.9% 2.7% 4.0%
7 France 3.9% 4.4% 4.2% 4.1% 4.0% 3.2% 2.7% 2.9% 2.9%
8 Canada 3.0% 2.9% 3.0% 2.9% 3.0% 2.8% 2.9% 3.1% 2.8%
9 United Arab Emirates 0.0% 0.4% 0.0% 0.4% 0.6% 2.1% 2.1% 2.4% 2.8%
10 Russian Federation 0.1% 0.3% 0.6% 1.5% 2.2% 1.8% 2.6% 2.2% 2.5%
11 Australia 2.1% 2.1% 1.9% 2.0% 2.1% 2.2% 2.3% 2.4% 2.4%
12 Italy 3.5% 3.4% 3.0% 2.8% 2.6% 2.7% 2.3% 2.3% 2.1%
13 Czech Republic 0.4% 0.4% 0.8% 1.0% 1.1% 1.3% 2.0% 2.7% 2.0%
14 Singapore 1.3% 1.5% 1.6% 1.5% 1.3% 1.5% 1.7% 1.7% 1.8%
Exporters 2004 2005 2006 2007 2008 2009 2010 2011 2012
1 China 43.8% 53.4% 55.7% 61.5% 66.4% 71.3% 75.0% 73.0% 73.4%
2 United States of America 4.3% 4.0% 4.2% 4.4% 4.3% 4.4% 4.1% 4.5% 4.3%
3 Netherlands 6.0% 2.6% 2.3% 2.6% 2.5% 3.9% 4.9% 4.4% 3.7%
4 Germany 5.8% 8.6% 8.7% 7.4% 6.4% 4.8% 3.8% 3.3% 2.8%
5 Czech Republic 0.1% 0.1% 0.3% 0.5% 0.6% 0.8% 1.5% 2.2% 2.3%
6 Hong Kong, China 0.4% 0.4% 0.3% 0.6% 0.9% 0.7% 0.9% 1.4% 2.2%
7 Singapore 0.9% 1.0% 0.9% 0.9% 0.9% 1.0% 0.9% 1.2% 1.2%
8 Viet Nam 0.0% 0.0% 0.0% 0.0% 0.0% 0.0% 0.0% 0.2% 1.1%
9 Korea, Republic of 1.0% 0.4% 0.2% 0.1% 0.2% 0.4% 0.7% 0.9% 1.0%
10 Italy 0.2% 0.1% 0.1% 0.1% 0.1% 0.2% 0.3% 0.9% 1.0%
11 Mexico 0.7% 0.7% 0.7% 0.7% 0.7% 0.6% 0.7% 0.8% 0.9%
12 United Kingdom 0.9% 0.9% 1.9% 0.7% 0.7% 0.7% 0.5% 0.6% 0.7%
13 Japan 3.5% 3.6% 3.3% 2.7% 1.9% 1.3% 0.9% 0.7% 0.6%
14 Sweden 0.3% 0.3% 0.4% 0.6% 0.5% 0.5% 0.5% 0.6% 0.6%
Indonesia 0.0% 0.0% 0.0% 0.0% 0.0% 0.0% 0.0% 0.0% 0.0%
China
United States of America
Australia
Singapore
Japan

870324 - Automobiles with reciprocating piston engine displacing > 3000 cc (BK/BM)
-
20,000,000
40,000,000
60,000,000
80,000,000
100,000,000
120,000,000
140,000,000
160,000,000
2003 2004 2005 2006 2007 2008 2009 2010 2011 2012
-
20,000
40,000
60,000
80,000
100,000
120,000
140,000
160,000
180,000
200,000
2003 2004 2005 2006 2007 2008 2009 2010 2011 2012
-
20,000
40,000
60,000
80,000
100,000
120,000
140,000
160,000
180,000
2003 2004 2005 2006 2007 2008 2009 2010 2011 2012

870324 - Automobiles with reciprocating piston engine displacing > 3000 ccImporters 2004 2005 2006 2007 2008 2009 2010 2011 2012
1 United States of America 66.4% 62.2% 59.0% 54.2% 48.3% 45.9% 47.7% 46.2% 49.1%
2 China 1.6% 1.8% 2.8% 3.9% 6.1% 7.0% 8.5% 10.2% 8.4%
3 Canada 5.7% 6.0% 6.9% 6.9% 6.5% 7.1% 6.9% 6.9% 6.6%
4 Saudi Arabia 1.6% 2.6% 2.7% 2.2% 2.8% 3.7% 3.8% 3.2% 5.3%
5 United Arab Emirates 0.0% 1.4% 0.0% 2.1% 3.2% 2.3% 2.9% 2.7% 3.5%
6 Russian Federation 0.9% 1.1% 2.0% 3.0% 4.2% 2.0% 2.1% 2.6% 2.5%
7 Japan 2.8% 2.5% 2.5% 1.9% 1.8% 1.9% 1.4% 1.8% 1.9%
8 Australia 1.2% 1.3% 1.1% 1.3% 1.5% 1.9% 1.9% 1.8% 1.9%
9 Mexico 1.9% 2.5% 2.8% 2.7% 2.5% 2.1% 2.0% 2.2% 1.8%
10 Kuwait 0.0% 0.0% 0.1% 1.0% 1.5% 1.4% 1.4% 1.3% 1.6%
11 United Kingdom 2.5% 3.0% 2.2% 2.4% 1.5% 1.6% 2.0% 1.9% 1.5%
12 Qatar 0.0% 0.0% 0.0% 0.0% 0.1% 0.0% 0.0% 0.7% 1.2%
13 Germany 1.6% 2.1% 2.7% 1.8% 1.8% 1.7% 1.2% 1.3% 1.1%
14 Switzerland 0.9% 0.9% 0.9% 0.9% 1.0% 1.2% 1.0% 1.1% 1.0%
Exporters 2004 2005 2006 2007 2008 2009 2010 2011 2012
1 Canada 28.2% 26.7% 24.9% 22.2% 19.0% 21.7% 22.3% 22.3% 22.9%
2 Japan 22.4% 21.6% 22.9% 24.1% 24.5% 23.7% 24.4% 20.7% 22.4%
3 Germany 21.8% 23.3% 24.0% 23.3% 21.9% 21.2% 19.8% 21.2% 19.9%
4 United States of America 9.0% 10.2% 10.5% 11.9% 13.4% 13.0% 13.7% 15.3% 16.4%
5 United Kingdom 3.8% 4.8% 4.8% 4.8% 5.1% 5.7% 7.6% 8.1% 6.7%
6 Mexico 4.1% 2.8% 1.8% 1.5% 1.8% 1.9% 1.8% 2.3% 2.6%
7 Italy 1.4% 1.4% 1.6% 1.8% 2.2% 2.6% 2.1% 2.4% 2.6%
8 Korea, Republic of 3.7% 2.9% 3.1% 3.0% 2.8% 2.3% 2.9% 2.4% 2.1%
9 Austria 1.4% 1.3% 1.1% 0.6% 0.6% 0.5% 0.6% 0.5% 0.5%
10 Sweden 0.0% 0.5% 0.9% 1.6% 1.1% 1.0% 0.7% 0.7% 0.5%
11 Belgium 0.8% 0.7% 0.7% 0.7% 0.5% 0.5% 0.4% 0.4% 0.5%
12 Australia 1.1% 1.1% 0.8% 0.8% 1.3% 0.5% 0.5% 0.4% 0.4%
13 Slovakia 0.1% 0.2% 0.2% 0.1% 1.7% 1.2% 0.6% 0.3% 0.4%
14 Hong Kong, China 0.6% 0.5% 0.5% 0.5% 0.7% 1.0% 0.6% 0.5% 0.4%
Indonesia 0.0% 0.0% 0.0% 0.1% 0.1% 0.0% 0.0% 0.1% 0.1%
Saudi Arabia
United Arab Emirates
Oman
Kuwait
Qatar
Bahrain

870332 - Automobiles with diesel engine displacing more than 1500 cc to 2500 cc (BK/BM)
-
20,000,000
40,000,000
60,000,000
80,000,000
100,000,000
120,000,000
140,000,000
2003 2004 2005 2006 2007 2008 2009 2010 2011 2012
-
50,000
100,000
150,000
200,000
250,000
2003 2004 2005 2006 2007 2008 2009 2010 2011 2012
-
100,000
200,000
300,000
400,000
500,000
600,000
2003 2004 2005 2006 2007 2008 2009 2010 2011 2012
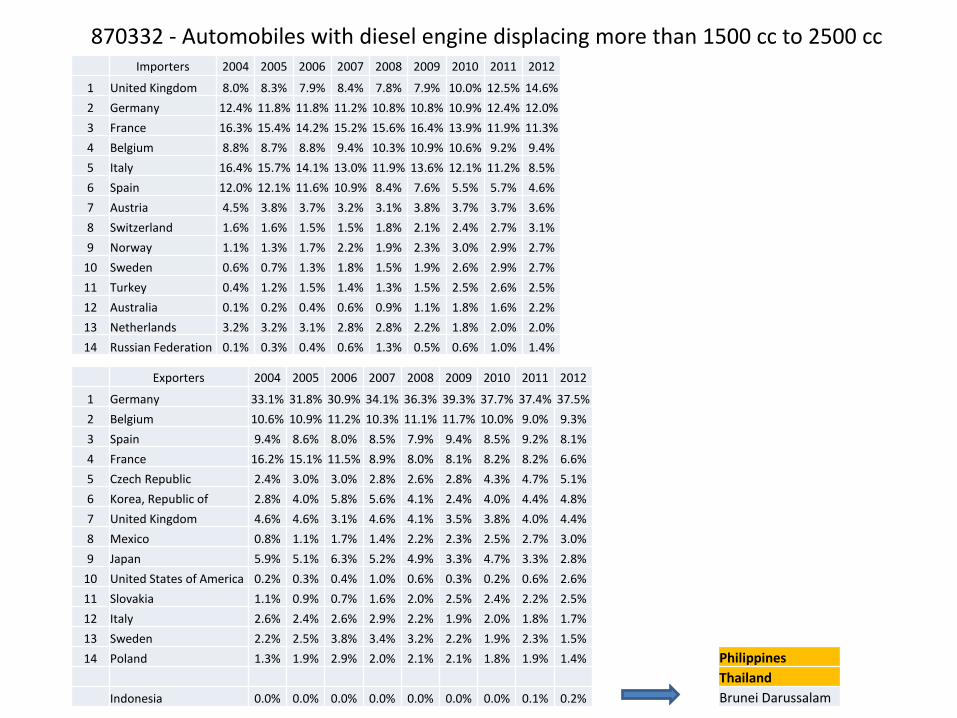
870332 - Automobiles with diesel engine displacing more than 1500 cc to 2500 ccImporters 2004 2005 2006 2007 2008 2009 2010 2011 2012
1 United Kingdom 8.0% 8.3% 7.9% 8.4% 7.8% 7.9% 10.0% 12.5% 14.6%
2 Germany 12.4% 11.8% 11.8% 11.2% 10.8% 10.8% 10.9% 12.4% 12.0%
3 France 16.3% 15.4% 14.2% 15.2% 15.6% 16.4% 13.9% 11.9% 11.3%
4 Belgium 8.8% 8.7% 8.8% 9.4% 10.3% 10.9% 10.6% 9.2% 9.4%
5 Italy 16.4% 15.7% 14.1% 13.0% 11.9% 13.6% 12.1% 11.2% 8.5%
6 Spain 12.0% 12.1% 11.6% 10.9% 8.4% 7.6% 5.5% 5.7% 4.6%
7 Austria 4.5% 3.8% 3.7% 3.2% 3.1% 3.8% 3.7% 3.7% 3.6%
8 Switzerland 1.6% 1.6% 1.5% 1.5% 1.8% 2.1% 2.4% 2.7% 3.1%
9 Norway 1.1% 1.3% 1.7% 2.2% 1.9% 2.3% 3.0% 2.9% 2.7%
10 Sweden 0.6% 0.7% 1.3% 1.8% 1.5% 1.9% 2.6% 2.9% 2.7%
11 Turkey 0.4% 1.2% 1.5% 1.4% 1.3% 1.5% 2.5% 2.6% 2.5%
12 Australia 0.1% 0.2% 0.4% 0.6% 0.9% 1.1% 1.8% 1.6% 2.2%
13 Netherlands 3.2% 3.2% 3.1% 2.8% 2.8% 2.2% 1.8% 2.0% 2.0%
14 Russian Federation 0.1% 0.3% 0.4% 0.6% 1.3% 0.5% 0.6% 1.0% 1.4%
Exporters 2004 2005 2006 2007 2008 2009 2010 2011 2012
1 Germany 33.1% 31.8% 30.9% 34.1% 36.3% 39.3% 37.7% 37.4% 37.5%
2 Belgium 10.6% 10.9% 11.2% 10.3% 11.1% 11.7% 10.0% 9.0% 9.3%
3 Spain 9.4% 8.6% 8.0% 8.5% 7.9% 9.4% 8.5% 9.2% 8.1%
4 France 16.2% 15.1% 11.5% 8.9% 8.0% 8.1% 8.2% 8.2% 6.6%
5 Czech Republic 2.4% 3.0% 3.0% 2.8% 2.6% 2.8% 4.3% 4.7% 5.1%
6 Korea, Republic of 2.8% 4.0% 5.8% 5.6% 4.1% 2.4% 4.0% 4.4% 4.8%
7 United Kingdom 4.6% 4.6% 3.1% 4.6% 4.1% 3.5% 3.8% 4.0% 4.4%
8 Mexico 0.8% 1.1% 1.7% 1.4% 2.2% 2.3% 2.5% 2.7% 3.0%
9 Japan 5.9% 5.1% 6.3% 5.2% 4.9% 3.3% 4.7% 3.3% 2.8%
10 United States of America 0.2% 0.3% 0.4% 1.0% 0.6% 0.3% 0.2% 0.6% 2.6%
11 Slovakia 1.1% 0.9% 0.7% 1.6% 2.0% 2.5% 2.4% 2.2% 2.5%
12 Italy 2.6% 2.4% 2.6% 2.9% 2.2% 1.9% 2.0% 1.8% 1.7%
13 Sweden 2.2% 2.5% 3.8% 3.4% 3.2% 2.2% 1.9% 2.3% 1.5%
14 Poland 1.3% 1.9% 2.9% 2.0% 2.1% 2.1% 1.8% 1.9% 1.4%
Indonesia 0.0% 0.0% 0.0% 0.0% 0.0% 0.0% 0.0% 0.1% 0.2%
Philippines
Thailand
Brunei Darussalam

851762 - Machines for the reception, conversion and transmission or regeneratio (BM)
0
20000000
40000000
60000000
80000000
10000000
12000000
2003 2004 2005 2006 2007 2008 2009 2010 2011 2012
-
10,000
20,000
30,000
40,000
50,000
60,000
2003 2004 2005 2006 2007 2008 2009 2010 2011 2012
-
100,000
200,000
300,000
400,000
500,000
600,000
700,000
800,000
900,000
2003 2004 2005 2006 2007 2008 2009 2010 2011 2012

851762 - Machines for the reception, conversion and transmission or regeneratioImporters 2009 2010 2011 2012
1 United States of America 21.4% 24.8% 23.1% 25.3%
2 Netherlands 9.9% 9.8% 8.9% 8.4%
3 Hong Kong, China 6.1% 5.6% 6.2% 6.9%
4 Japan 4.2% 4.4% 5.0% 5.8%
5 Germany 5.7% 5.1% 4.9% 4.8%
6 China 4.4% 4.7% 4.9% 4.4%
7 United Kingdom 4.9% 4.3% 3.7% 3.5%
8 Mexico 2.6% 3.0% 3.3% 3.2%
9 Canada 2.4% 2.5% 3.0% 3.0%
10 France 2.9% 2.6% 2.6% 2.4%
11 Singapore 2.4% 2.4% 2.1% 2.2%
12 Australia 1.8% 1.6% 1.8% 2.0%
13 Sweden 1.1% 1.3% 1.7% 1.6%
14 Russian Federation 1.0% 1.7% 1.7% 1.6%
Exporters 2009 2010 2011 2012
1 China 28.3% 27.6% 27.7% 26.9%
2 United States of America 13.6% 14.5% 15.7% 15.9%
3 Hong Kong, China 13.9% 14.4% 12.9% 14.3%
4 Netherlands 9.4% 9.8% 9.8% 9.0%
5 Mexico 4.3% 4.5% 3.8% 5.6%
6 Germany 5.2% 4.8% 4.5% 4.1%
7 Singapore 2.5% 2.7% 2.9% 2.8%
8 Sweden 2.2% 2.8% 3.3% 2.7%
9 United Kingdom 2.9% 2.7% 2.3% 2.0%
10 France 1.9% 1.7% 1.8% 1.6%
11 Canada 1.8% 1.7% 1.8% 1.6%
12 Japan 2.3% 2.0% 1.8% 1.5%
13 Korea, Republic of 1.5% 1.6% 1.4% 1.1%
14 Czech Republic 1.1% 1.1% 1.3% 1.1%
Indonesia 0.0% 0.0% 0.0% 0.1%
Hong Kong, China
Mexico
Singapore
United States of America

851770 - Parts of telephone sets, telephones for cellular networks or for other (BB)
0
20000000
40000000
60000000
80000000
10000000
12000000
2003 2004 2005 2006 2007 2008 2009 2010 2011 2012
-
50,000
100,000
150,000
200,000
250,000
2003 2004 2005 2006 2007 2008 2009 2010 2011 2012
-
200,000
400,000
600,000
800,000
1,000,000
1,200,000
1,400,000
1,600,000
2003 2004 2005 2006 2007 2008 2009 2010 2011 2012

851770 - Parts of telephone sets, telephones for cellular networks or for other
Importers 2009 2010 2011 2012
1 China 29.5% 34.7% 37.8% 38.0%
2 Hong Kong, China 16.6% 19.7% 21.3% 24.9%
3 Korea, Republic of 13.1% 9.9% 8.9% 6.9%
4 Mexico 4.4% 5.1% 4.7% 5.9%
5 United States of America 6.4% 5.4% 4.5% 3.8%
6 Taipei, Chinese 0.8% 1.1% 2.0% 2.9%
7 Netherlands 3.6% 2.9% 2.6% 1.8%
8 Japan 5.0% 3.6% 2.3% 1.8%
9 Sweden 4.0% 3.8% 3.1% 1.8%
10 Germany 2.5% 2.1% 1.7% 1.3%
11 France 1.3% 1.4% 1.5% 1.3%
12 Thailand 0.6% 0.6% 0.5% 0.8%
13 Viet Nam 0.1% 0.2% 0.4% 0.7%
14 Singapore 0.7% 0.5% 0.6% 0.7%
Exporters 2009 2010 2011 2012
1 China 20.7% 19.7% 24.3% 31.2%
2 Hong Kong, China 16.8% 18.7% 18.2% 21.4%
3 United States of America 9.1% 8.3% 6.2% 5.6%
4 Japan 5.1% 4.0% 3.2% 3.7%
5 Mexico 5.6% 5.7% 5.2% 3.6%
6 India 3.7% 3.3% 2.7% 2.7%
7 Viet Nam 0.3% 0.7% 1.8% 2.4%
8 Korea, Republic of 3.7% 3.1% 3.0% 2.3%
9 Hungary 2.6% 4.2% 3.9% 2.2%
10 Netherlands 3.4% 3.0% 2.7% 2.2%
11 Brazil 2.0% 1.8% 2.1% 1.9%
12 Argentina 0.2% 0.7% 1.3% 1.7%
13 Germany 2.8% 2.2% 1.8% 1.3%
14 Indonesia 0.0% 1.1% 1.2% 1.3%
Indonesia 0.0% 1.1% 1.2% 1.3%
China
Sweden
India
Finland
Singapore
United States of America

880240 - Aircraft nes of an unladen weight exceeding 15,000 kg (BM)
-
20,000,000
40,000,000
60,000,000
80,000,000
100,000,000
120,000,000
2003 2004 2005 2006 2007 2008 2009 2010 2011 2012
-
10,000
20,000
30,000
40,000
50,000
60,000
70,000
80,000
90,000
2003 2004 2005 2006 2007 2008 2009 2010 2011 2012
-
500,000
1,000,000
1,500,000
2,000,000
2,500,000
3,000,000
3,500,000
4,000,000
2003 2004 2005 2006 2007 2008 2009 2010 2011 2012

880240 - Aircraft nes of an unladen weight exceeding 15,000 kgImporters 2004 2005 2006 2007 2008 2009 2010 2011 2012
1 France 3.0% 3.0% 3.2% 4.2% 2.8% 4.8% 14.2% 15.4% 15.6%
2 China 7.7% 10.1% 14.5% 13.1% 12.0% 13.3% 13.2% 12.7% 14.5%
3 Germany 20.2% 21.7% 21.7% 14.1% 17.5% 20.4% 20.1% 17.9% 14.1%
4 United States of America 10.9% 11.6% 8.3% 10.9% 10.0% 8.5% 6.7% 6.5% 5.5%
5 Japan 5.1% 5.8% 4.6% 5.7% 5.0% 4.4% 3.1% 2.2% 4.9%
6 United Arab Emirates 0.0% 0.4% 0.0% 0.8% 3.1% 2.5% 3.9% 2.8% 3.8%
7 Indonesia 0.3% 0.7% 1.3% 2.1% 2.3% 4.5% 3.8% 3.1% 3.6%
8 Malaysia 1.0% 0.9% 1.5% 1.4% 1.4% 1.0% 1.4% 2.9% 3.2%
9 Russian Federation 0.4% 0.6% 0.0% 0.0% 0.0% 0.0% 0.0% 0.0% 3.1%
10 Ireland 2.6% 3.9% 1.9% 4.3% 3.9% 7.4% 3.9% 3.2% 2.8%
11 Turkey 1.9% 0.2% 1.9% 1.1% 1.7% 0.8% 2.8% 3.5% 2.3%
12 Chile 0.0% 0.5% 0.9% 0.7% 1.2% 0.6% 0.6% 0.9% 2.0%
13 Thailand 0.4% 1.4% 0.7% 0.8% 0.7% 1.1% 0.3% 1.0% 2.0%
14 Korea, Republic of 1.0% 1.5% 2.9% 2.7% 1.6% 0.9% 2.2% 3.2% 2.0%
Exporters 2004 2005 2006 2007 2008 2009 2010 2011 2012
1 Hong Kong, China 23.5% 25.8% 22.6% 21.3% 25.1% 39.6% 50.6% 48.8% 46.7%
2 United States of America 20.2% 19.2% 20.3% 19.0% 20.1% 36.3% 31.2% 33.8% 36.1%
3 Canada 2.0% 2.8% 2.8% 3.9% 4.4% 5.1% 4.3% 4.0% 3.9%
4 Turkey 3.7% 5.1% 4.3% 4.2% 3.6% 7.6% 6.2% 5.0% 3.8%
5 United Arab Emirates 34.1% 39.2% 43.0% 44.8% 38.9% 0.5% 0.8% 1.2% 2.7%
6 Italy 0.0% 0.1% 0.3% 0.3% 0.7% 1.0% 0.8% 1.1% 0.9%
7 Peru 3.2% 0.7% 0.0% 0.0% 0.0% 0.0% 0.0% 0.0% 0.8%
8 Germany 0.1% 0.1% 0.0% 0.0% 0.0% 0.1% 0.0% 0.1% 0.6%
9 Mexico 4.1% 0.1% 0.5% 0.3% 0.1% 0.1% 0.2% 0.1% 0.5%
10 Thailand 1.6% 1.4% 0.7% 1.1% 1.0% 1.4% 0.8% 0.7% 0.4%
11 Russian Federation 0.0% 0.0% 0.0% 0.0% 0.0% 0.0% 0.0% 0.0% 0.3%
12 Japan 1.6% 0.5% 0.4% 0.2% 0.8% 1.5% 0.3% 0.3% 0.3%
13 Colombia 2.0% 1.4% 0.8% 1.0% 0.7% 0.8% 0.6% 0.5% 0.3%
14 Korea, Republic of 0.0% 0.0% 0.0% 0.0% 0.0% 0.0% 0.0% 0.0% 0.2%
Indonesia 0.002% 0.008% 0.001% 0.028% 0.004% 0.134% 0.015% 0.032% 0.031%
Malaysia
United Arab Emirates
France
Saudi Arabia
Hong Kong, China
Philippines

852990 - Parts suitable f use solely/princ w the app of headings 85.25 to 85.28 (BB)
-
10,000,000
20,000,000
30,000,000
40,000,000
50,000,000
60,000,000
70,000,000
80,000,000
90,000,000
100,000,000
2003 2004 2005 2006 2007 2008 2009 2010 2011 2012
-
50,000
100,000
150,000
200,000
250,000
300,000
350,000
400,000
450,000
500,000
2003 2004 2005 2006 2007 2008 2009 2010 2011 2012
-
200,000
400,000
600,000
800,000
1,000,000
1,200,000
1,400,000
1,600,000
2003 2004 2005 2006 2007 2008 2009 2010 2011 2012

852990 - Parts suitable f use solely/princ w the app of headings 85.25 to 85.28Importers 2004 2005 2006 2007 2008 2009 2010 2011 2012
1 Hong Kong, China 12.7% 13.2% 13.0% 12.9% 12.1% 12.6% 12.2% 13.5% 16.8%
2 Mexico 6.2% 7.8% 9.5% 11.7% 12.1% 16.2% 14.9% 13.3% 13.4%
3 China 20.5% 22.4% 20.9% 10.9% 10.9% 10.0% 9.3% 10.3% 10.0%
4 Japan 7.1% 7.6% 5.8% 6.1% 6.1% 5.5% 5.9% 6.1% 6.1%
5 Brazil 1.8% 2.1% 2.4% 1.2% 2.2% 1.8% 3.9% 4.7% 4.7%
6 Germany 3.6% 3.1% 4.1% 5.4% 6.0% 4.7% 4.8% 4.4% 4.6%
7 Russian Federation 0.4% 0.4% 0.5% 0.8% 1.1% 1.6% 2.8% 3.2% 4.0%
8 Poland 0.8% 1.5% 2.9% 4.0% 4.7% 4.5% 5.5% 3.6% 3.9%
9 United States of America 9.3% 7.8% 6.0% 4.8% 3.4% 3.1% 3.0% 3.7% 3.6%
10 Hungary 2.1% 1.9% 3.1% 3.8% 4.3% 5.2% 4.8% 3.4% 3.4%
11 Thailand 0.5% 0.6% 1.0% 1.3% 1.7% 2.6% 2.5% 2.8% 3.2%
12 Malaysia 2.0% 1.7% 1.7% 2.9% 2.7% 2.7% 4.0% 4.5% 2.9%
13 Czech Republic 0.6% 1.0% 1.6% 3.6% 4.2% 3.2% 3.6% 3.2% 2.2%
14 Slovakia 0.2% 0.4% 0.9% 5.3% 6.5% 6.4% 5.7% 3.2% 2.0%
Exporters 2004 2005 2006 2007 2008 2009 2010 2011 2012
1 Hong Kong, China 15.1% 16.0% 15.6% 17.5% 18.2% 21.2% 20.7% 20.6% 23.4%
2 China 16.6% 21.4% 24.4% 15.5% 17.7% 17.6% 18.9% 18.3% 17.9%
3 Korea, Republic of 12.2% 12.9% 13.5% 10.8% 10.0% 11.6% 14.0% 14.3% 11.9%
4 Japan 14.6% 13.0% 12.6% 14.6% 14.6% 10.7% 9.7% 8.8% 8.3%
5 United States of America 6.1% 5.0% 5.2% 6.0% 5.2% 6.2% 4.5% 5.2% 5.7%
6 Germany 3.3% 3.1% 3.7% 5.1% 5.7% 3.9% 4.2% 4.3% 4.3%
7 Viet Nam 0.0% 0.0% 0.0% 0.0% 0.1% 0.2% 0.2% 0.2% 3.7%
8 Poland 0.8% 0.5% 0.6% 2.4% 3.1% 2.5% 3.4% 2.8% 2.7%
9 Thailand 1.2% 0.8% 0.5% 1.1% 1.2% 2.4% 2.6% 2.7% 2.2%
10 Slovakia 0.0% 0.0% 0.1% 0.3% 0.9% 2.3% 2.1% 1.5% 2.1%
11 Malaysia 2.0% 1.7% 2.1% 3.0% 2.8% 2.7% 2.6% 2.8% 1.9%
12 Taipei, Chinese 2.6% 2.3% 1.5% 2.1% 2.1% 1.5% 1.6% 1.8% 1.5%
13 Singapore 2.8% 2.9% 3.1% 5.3% 3.1% 2.0% 1.8% 1.7% 1.5%
14 Hungary 1.2% 1.1% 1.1% 1.0% 1.6% 1.7% 1.9% 2.0% 1.4%
Indonesia 0.44% 0.36% 0.25% 0.38% 0.43% 0.63% 0.41% 0.63% 0.80%
China
Korea, Republic of
Singapore
Poland
Malaysia
Hong Kong, China
India
Viet Nam
United States of America
Japan
Argentina
Brazil
Turkey
United Kingdom
Czech Republic

870322 - Automobiles w reciprocatg piston engine displacg > 1000 cc to 1500 cc (BK/BM)
-
10,000,000
20,000,000
30,000,000
40,000,000
50,000,000
60,000,000
70,000,000
80,000,000
2003 2004 2005 2006 2007 2008 2009 2010 2011 2012
-
100,000
200,000
300,000
400,000
500,000
600,000
700,000
800,000
900,000
1,000,000
2003 2004 2005 2006 2007 2008 2009 2010 2011 2012
-
200,000
400,000
600,000
800,000
1,000,000
1,200,000
2003 2004 2005 2006 2007 2008 2009 2010 2011 2012

870322 - Automobiles w reciprocatg piston engine displacg > 1000 cc to 1500 cc
Importers 2004 2005 2006 2007 2008 2009 2010 2011 2012
1 Germany 14.7% 14.4% 12.4% 10.5% 9.8% 18.6% 12.7% 12.8% 12.4%
2 United Kingdom 10.0% 8.5% 7.7% 8.2% 6.4% 7.1% 7.9% 7.6% 9.1%
3 Italy 12.0% 11.6% 10.1% 10.7% 10.5% 13.2% 10.6% 8.6% 5.7%
4 United States of America 6.9% 8.0% 11.3% 10.0% 10.3% 4.7% 3.8% 3.5% 5.5%
5 Belgium 5.6% 5.3% 5.7% 4.9% 5.3% 5.9% 5.7% 4.5% 5.3%
6 France 5.4% 5.9% 4.9% 4.0% 4.3% 6.6% 6.7% 6.8% 4.6%
7 Netherlands 2.9% 2.4% 2.4% 2.4% 3.1% 3.7% 4.4% 5.1% 3.8%
8 Algeria 0.7% 0.8% 0.8% 1.1% 1.5% 1.2% 1.2% 1.5% 3.1%
9 Japan 0.6% 0.6% 0.3% 0.6% 0.8% 1.0% 2.2% 2.7% 2.9%
10 Switzerland 1.2% 1.2% 1.1% 1.2% 1.5% 1.7% 2.4% 2.7% 2.3%
11 Brazil 0.0% 0.0% 0.1% 0.0% 0.3% 0.7% 1.8% 2.8% 2.2%
12 Australia 1.2% 1.3% 1.5% 1.4% 1.1% 1.1% 1.6% 1.8% 2.1%
13 Austria 1.4% 1.9% 1.7% 1.7% 1.9% 2.4% 2.2% 2.3% 2.0%
14 Russian Federation 1.7% 2.5% 3.3% 5.0% 5.8% 1.7% 2.0% 2.2% 2.0%
Exporters 2004 2005 2006 2007 2008 2009 2010 2011 2012
1 Germany 8.5% 6.3% 6.4% 9.3% 8.7% 10.6% 12.7% 14.2% 14.3%
2 Japan 17.5% 19.8% 24.9% 24.4% 25.4% 12.0% 12.5% 11.1% 12.0%
3 Spain 13.0% 12.3% 9.4% 8.5% 9.3% 12.5% 12.0% 11.5% 9.8%
4 Korea, Republic of 8.6% 8.9% 8.0% 7.3% 5.5% 4.7% 5.9% 6.3% 6.5%
5 Czech Republic 3.3% 3.0% 3.0% 3.1% 2.9% 5.1% 5.1% 5.6% 5.3%
6 France 12.4% 10.6% 10.6% 9.3% 7.5% 8.0% 6.1% 4.7% 5.2%
7 Poland 4.9% 4.8% 3.9% 4.0% 6.0% 8.6% 7.4% 6.5% 5.2%
8 Belgium 6.9% 6.2% 5.5% 4.6% 4.8% 5.7% 4.5% 5.2% 4.8%
9 India 0.5% 1.1% 1.1% 1.3% 2.4% 3.2% 3.5% 3.1% 3.9%
10 China 0.1% 0.5% 0.8% 1.2% 1.7% 1.0% 1.5% 2.6% 3.3%
11 Mexico 0.0% 0.0% 0.0% 0.0% 0.0% 0.0% 0.0% 1.2% 3.2%
12 Thailand 1.5% 1.1% 1.1% 1.0% 1.0% 0.8% 2.3% 2.0% 3.1%
13 Italy 4.2% 3.5% 4.5% 3.9% 3.4% 4.2% 3.6% 3.1% 2.6%
14 Turkey 1.7% 1.5% 2.3% 2.3% 2.6% 2.8% 2.7% 2.8% 2.5%
Indonesia 0.13% 0.06% 0.26% 0.49% 0.74% 0.54% 0.74% 0.67% 1.40%
Thailand
Japan
Malaysia
Australia
Philippines
Mexico
South Africa
Saudi Arabia
Egypt
Lebanon
Brunei Darussalam
Algeria
Peru
Angola
Lao People's Democratic Republic

844399 - Parts and accessories of printers, copying machines and facsimile mach (BB)
-
20,000
40,000
60,000
80,000
100,000
120,000
140,000
160,000
180,000
2003 2004 2005 2006 2007 2008 2009 2010 2011 2012
-
20,000
40,000
60,000
80,000
100,000
120,000
140,000
160,000
180,000
200,000
2003 2004 2005 2006 2007 2008 2009 2010 2011 2012
-
10,000,000
20,000,000
30,000,000
40,000,000
50,000,000
60,000,000
70,000,000
80,000,000
2007 2008 2009 2010 2011 2012

844399 - Parts and accessories of printers, copying machines and facsimile machImporters 2007 2008 2009 2010 2011 2012
1 Germany 17.4% 18.1% 18.9% 16.5% 16.9% 16.9%
2 United Kingdom 8.0% 8.0% 8.6% 10.9% 11.2% 11.7%
3 Italy 13.7% 14.2% 13.0% 12.8% 11.4% 9.9%
4 United States of America 5.0% 6.1% 6.4% 8.1% 8.0% 8.4%
5 Belgium 7.4% 10.1% 8.9% 8.7% 9.1% 8.3%
6 France 19.3% 3.4% 3.7% 3.7% 3.9% 3.9%
7 Netherlands 4.2% 4.5% 4.1% 3.6% 3.7% 3.7%
8 Algeria 3.1% 3.0% 3.0% 3.1% 3.1% 3.6%
9 Japan 2.8% 3.1% 3.2% 3.1% 3.3% 3.3%
10 Switzerland 0.0% 2.6% 2.3% 2.3% 2.1% 2.0%
11 Brazil 1.8% 2.0% 2.2% 2.4% 2.1% 1.9%
12 Australia 1.6% 1.8% 1.7% 1.8% 1.7% 1.8%
13 Austria 1.6% 1.6% 1.8% 1.6% 1.7% 1.7%
14 Russian Federation 1.0% 1.1% 1.3% 1.3% 1.5% 1.5%
Exporters 2007 2008 2009 2010 2011 2012
1 Germany 19.6% 22.3% 19.7% 20.0% 19.7% 19.3%
2 Japan 6.8% 8.8% 9.0% 11.0% 12.0% 13.7%
3 Spain 9.0% 10.7% 10.7% 12.2% 12.6% 13.4%
4 Korea, Republic of 11.4% 13.6% 14.1% 12.3% 12.0% 10.5%
5 Czech Republic 28.1% 9.7% 11.9% 11.8% 10.6% 10.2%
6 France 8.7% 12.2% 11.9% 10.2% 10.5% 10.0%
7 Poland 4.4% 6.1% 5.7% 6.0% 6.0% 6.3%
8 Belgium 2.5% 2.9% 3.4% 3.0% 2.8% 2.6%
9 India 2.2% 2.3% 2.1% 2.1% 1.5% 1.5%
10 China 0.9% 1.1% 1.1% 1.2% 1.2% 1.3%
11 Mexico 0.9% 1.8% 1.5% 1.7% 1.9% 1.2%
12 Thailand 0.0% 1.3% 1.0% 0.9% 0.8% 1.2%
13 Italy 0.0% 0.1% 0.2% 0.2% 0.3% 0.9%
14 Turkey 1.0% 1.2% 1.1% 1.0% 1.0% 0.9%
Indonesia 0.00% 0.00% 0.00% 0.24% 0.28% 0.26%
Singapore
United States of America
United Kingdom
Philippines
Japan
Netherlands
Thailand
Hong Kong, China
Germany
China
Malaysia
Taipei, Chinese
Brazil
Finland
United Arab Emirates

870829 - Parts and accessories of bodies nes for motor vehicles (BB)
-
10,000,000
20,000,000
30,000,000
40,000,000
50,000,000
60,000,000
70,000,000
2003 2004 2005 2006 2007 2008 2009 2010 2011 2012
-
20,000
40,000
60,000
80,000
100,000
120,000
140,000
2003 2004 2005 2006 2007 2008 2009 2010 2011 2012 -
50,000
100,000
150,000
200,000
250,000
300,000
350,000
400,000
450,000
2003 2004 2005 2006 2007 2008 2009 2010 2011 2012

870829 - Parts and accessories of bodies nes for motor vehiclesImporters 2004 2005 2006 2007 2008 2009 2010 2011 2012
1 United States of America 19.0% 19.9% 18.9% 16.3% 13.3% 12.7% 15.5% 15.0% 17.3%
2 Germany 10.0% 10.6% 11.0% 11.1% 12.4% 12.8% 12.0% 12.8% 11.7%
3 Canada 14.8% 13.7% 12.6% 10.9% 9.1% 8.6% 9.3% 8.5% 9.1%
4 China 5.8% 5.2% 5.3% 3.7% 4.1% 5.8% 6.4% 6.3% 6.7%
5 Mexico 6.3% 6.4% 5.5% 6.1% 5.6% 7.0% 5.8% 5.7% 6.6%
6 Slovakia 1.7% 1.6% 2.3% 3.5% 3.9% 4.1% 3.4% 3.8% 4.2%
7 Belgium 5.9% 6.0% 6.2% 5.9% 5.7% 5.6% 4.7% 4.8% 4.1%
8 Russian Federation 0.4% 0.7% 1.2% 1.8% 2.5% 1.7% 2.5% 3.5% 3.8%
9 United Kingdom 4.1% 4.1% 3.5% 4.5% 4.3% 3.4% 4.0% 4.0% 3.4%
10 Czech Republic 1.4% 1.7% 1.8% 2.0% 2.1% 2.5% 2.3% 2.6% 2.8%
11 France 4.5% 4.2% 4.2% 4.1% 4.4% 4.2% 3.5% 3.2% 2.6%
12 Brazil 1.0% 1.1% 1.1% 1.3% 2.0% 1.9% 2.0% 2.3% 2.5%
13 Spain 3.0% 2.6% 2.6% 3.1% 2.1% 2.9% 3.4% 2.7% 2.0%
14 Poland 1.7% 1.7% 2.0% 1.9% 2.5% 2.2% 2.1% 2.3% 1.8%
Exporters 2004 2005 2006 2007 2008 2009 2010 2011 2012
1 Germany 15.7% 15.4% 15.9% 16.2% 16.7% 16.9% 16.1% 17.4% 17.0%
2 United States of America 22.2% 21.9% 21.8% 18.4% 17.1% 15.2% 17.3% 15.0% 16.0%
3 Mexico 6.8% 7.1% 7.6% 6.7% 5.8% 5.5% 6.0% 6.8% 7.1%
4 Japan 9.7% 8.9% 8.1% 6.9% 7.3% 8.4% 8.4% 7.2% 6.9%
5 Canada 9.5% 9.6% 8.7% 8.3% 6.0% 4.3% 5.2% 5.0% 5.6%
6 Czech Republic 4.2% 4.5% 4.4% 4.8% 5.5% 6.4% 5.6% 5.9% 5.6%
7 China 1.1% 1.6% 2.2% 2.7% 3.1% 3.3% 3.7% 3.8% 4.4%
8 Korea, Republic of 0.8% 1.0% 0.5% 0.7% 1.3% 1.8% 2.1% 3.2% 4.2%
9 France 4.2% 4.1% 4.4% 4.1% 4.5% 5.0% 4.4% 4.0% 3.4%
10 Poland 1.5% 2.0% 1.5% 2.1% 2.8% 3.0% 2.7% 3.0% 2.9%
11 Sweden 2.6% 2.5% 2.5% 2.6% 2.2% 2.3% 2.2% 2.4% 2.2%
12 Italy 2.9% 2.9% 2.8% 3.0% 3.2% 2.7% 2.2% 2.5% 2.1%
13 Austria 1.9% 1.6% 1.8% 2.0% 2.0% 1.9% 1.8% 2.0% 1.9%
14 Netherlands 1.4% 1.7% 1.7% 1.7% 2.2% 2.0% 1.8% 1.9% 1.8%
Indonesia 0.0% 0.1% 0.1% 0.0% 0.2% 0.2% 0.2% 0.2% 0.2%
Malaysia
Philippines
Viet Nam
Thailand
India
Argentina
Taipei, Chinese
South Africa
Japan
Singapore
China
United Kingdom
Brazil
United States of America
Greece
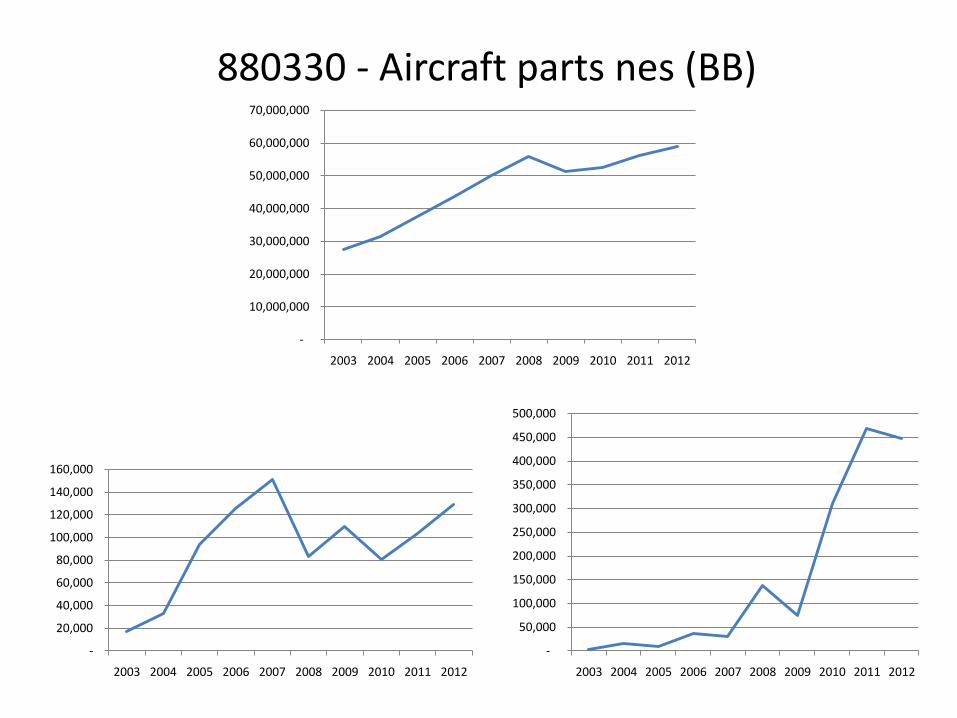
880330 - Aircraft parts nes (BB)
-
10,000,000
20,000,000
30,000,000
40,000,000
50,000,000
60,000,000
70,000,000
2003 2004 2005 2006 2007 2008 2009 2010 2011 2012
-
20,000
40,000
60,000
80,000
100,000
120,000
140,000
160,000
2003 2004 2005 2006 2007 2008 2009 2010 2011 2012
-
50,000
100,000
150,000
200,000
250,000
300,000
350,000
400,000
450,000
500,000
2003 2004 2005 2006 2007 2008 2009 2010 2011 2012

880330 - Aircraft parts nesImporters 2004 2005 2006 2007 2008 2009 2010 2011 2012
1 France 21.6% 20.9% 19.5% 18.5% 20.1% 20.6% 20.3% 20.1% 22.3%2 United States of America 12.8% 12.5% 13.2% 14.5% 13.5% 15.1% 16.1% 17.4% 20.4%3 Germany 15.2% 17.5% 20.3% 17.2% 16.3% 18.0% 17.4% 15.5% 11.7%4 Singapore 5.4% 6.9% 7.7% 7.7% 8.4% 7.3% 7.0% 7.8% 8.9%5 Canada 5.9% 5.4% 5.3% 5.0% 4.8% 4.7% 4.3% 4.5% 4.5%6 China 1.9% 1.9% 2.1% 1.9% 1.9% 1.9% 2.2% 2.8% 2.6%7 Brazil 2.4% 2.1% 2.2% 2.5% 2.7% 2.2% 2.1% 2.2% 2.3%8 Italy 2.8% 2.4% 2.1% 2.3% 2.4% 2.5% 2.0% 2.4% 2.3%9 Japan 2.9% 2.7% 3.0% 2.9% 2.6% 2.3% 2.1% 1.8% 2.2%
10 India 1.2% 1.7% 1.8% 1.7% 1.2% 1.5% 1.6% 1.6% 2.0%11 Spain 1.4% 1.4% 1.4% 1.5% 1.7% 3.2% 2.7% 1.7% 1.7%12 United Arab Emirates 0.0% 2.8% 0.0% 2.5% 3.1% 0.9% 1.2% 1.5% 1.6%13 Malaysia 1.1% 1.1% 0.6% 0.8% 1.1% 1.1% 0.8% 1.1% 1.2%14 Netherlands 1.4% 1.1% 1.2% 1.0% 0.9% 1.2% 1.1% 1.1% 1.2%
Exporters 2004 2005 2006 2007 2008 2009 2010 2011 20121 Germany 13.1% 14.5% 12.4% 10.7% 11.9% 18.6% 15.9% 17.3% 16.8%2 Singapore 3.0% 2.8% 4.1% 4.8% 5.5% 8.9% 10.4% 10.3% 10.7%3 France 10.5% 9.4% 10.0% 8.9% 8.9% 10.6% 11.0% 10.3% 10.4%4 United States of America 39.9% 41.1% 41.7% 38.1% 34.9% 11.4% 11.2% 9.6% 9.7%5 Japan 3.3% 3.6% 4.5% 4.9% 4.0% 6.1% 6.2% 6.5% 7.5%6 Italy 3.2% 3.4% 3.0% 3.0% 4.1% 5.6% 5.3% 5.0% 5.9%7 Spain 4.4% 4.3% 3.6% 3.5% 3.4% 4.6% 4.7% 5.8% 5.2%8 Canada 2.9% 2.9% 2.8% 2.9% 2.6% 3.5% 3.7% 3.3% 3.6%9 Israel 2.9% 2.3% 2.0% 2.8% 1.6% 3.1% 2.8% 3.0% 2.6%
10 Netherlands 2.4% 2.1% 2.1% 1.8% 2.1% 2.5% 2.3% 2.8% 2.6%11 India 0.1% 0.1% 0.1% 0.6% 2.0% 1.9% 3.1% 3.8% 2.6%12 Thailand 0.1% 0.0% 0.1% 1.7% 2.2% 3.0% 2.4% 2.7% 2.0%13 China 1.4% 1.8% 2.0% 2.3% 1.9% 1.9% 2.0% 1.7% 2.0%14 Switzerland 0.7% 0.8% 0.6% 0.8% 1.1% 1.3% 1.4% 1.5% 1.7%
Indonesia 0.1% 0.3% 0.3% 0.3% 0.1% 0.3% 0.2% 0.2% 0.3%
United Kingdom
Singapore
Spain
United States of America
Malaysia
France
Netherlands
China
Canada
Taipei, Chinese
Korea, Republic of
Thailand
Ukraine
Saudi Arabia
Ireland

852872 - Reception apparatus for television, colour, whether or not incorporati (BK)
0
10000000
20000000
30000000
40000000
50000000
60000000
70000000
80000000
2003 2004 2005 2006 2007 2008 2009 2010 2011 2012
-
100,000
200,000
300,000
400,000
500,000
600,000
2003 2004 2005 2006 2007 2008 2009 2010 2011 2012
-
20,000
40,000
60,000
80,000
100,000
120,000
140,000
160,000
180,000
200,000
2003 2004 2005 2006 2007 2008 2009 2010 2011 2012

852872 - Reception apparatus for television, colour, whether or not incorporatiImporters 2007 2008 2009 2010 2011 2012
1 United States of America 35.4% 31.6% 32.3% 28.5% 27.2% 29.7%
2 Germany 6.6% 7.2% 8.2% 7.5% 7.6% 8.0%
3 United Kingdom 7.7% 7.1% 6.1% 5.5% 4.6% 4.4%
4 Japan 1.4% 1.5% 3.2% 7.7% 8.7% 3.5%
5 France 5.5% 5.9% 5.8% 5.2% 5.0% 3.4%
6 Canada 3.8% 4.0% 3.0% 3.0% 2.9% 3.0%
7 Italy 3.6% 3.1% 4.0% 3.7% 3.0% 2.8%
8 United Arab Emirates 0.0% 0.8% 1.4% 2.1% 2.3% 2.2%
9 Australia 2.7% 2.6% 3.1% 2.6% 2.6% 2.2%
10 Spain 3.7% 3.3% 3.2% 3.7% 2.4% 2.1%
11 Netherlands 3.2% 3.5% 2.9% 3.2% 2.7% 2.0%
12 Sweden 2.4% 1.8% 2.0% 1.4% 1.9% 1.8%
13 Slovakia 0.8% 1.5% 1.8% 1.9% 2.0% 1.7%
14 Turkey 0.5% 0.6% 0.7% 1.0% 1.3% 1.6%
Exporters 2007 2008 2009 2010 2011 2012
1 Mexico 0.0% 28.9% 25.7% 24.9% 24.5% 25.5%
2 China 21.3% 15.3% 17.1% 20.2% 20.4% 20.5%
3 Slovakia 13.3% 11.7% 11.6% 9.9% 10.9% 10.8%
4 Poland 9.5% 7.8% 10.1% 9.3% 8.2% 7.3%
5 Hungary 6.4% 5.6% 7.2% 6.6% 5.7% 6.1%
6 Malaysia 0.0% 0.0% 3.6% 6.2% 6.5% 5.3%
7 Turkey 5.5% 2.7% 2.7% 2.3% 2.7% 3.6%
8 Czech Republic 5.9% 4.4% 3.7% 3.9% 4.1% 3.4%
9 Korea, Republic of 2.6% 1.5% 1.4% 1.3% 1.8% 1.9%
10 Germany 3.3% 2.1% 1.9% 1.6% 1.9% 1.8%
11 Thailand 1.7% 1.3% 1.3% 1.0% 1.4% 1.8%
12 United States of America 3.0% 1.4% 1.1% 1.1% 1.1% 1.7%
13 Sweden 2.0% 1.1% 1.4% 1.0% 1.3% 1.3%
14 Netherlands 3.2% 2.4% 2.1% 2.1% 1.5% 1.0%
Indonesia 0.00% 0.00% 0.00% 0.65% 0.69% 0.97%
Australia
Thailand
Viet Nam
India
Malaysia
Japan
Singapore
Philippines
United Arab Emirates
Israel
New Zealand
Saudi Arabia
Sri Lanka
Taipei, Chinese
Iran (Islamic Republic of)

870840 - Tansmissions for motor vehicles (BB)
-
10,000,000
20,000,000
30,000,000
40,000,000
50,000,000
60,000,000
2003 2004 2005 2006 2007 2008 2009 2010 2011 2012
-
50,000
100,000
150,000
200,000
250,000
300,000
350,000
400,000
450,000
500,000
2003 2004 2005 2006 2007 2008 2009 2010 2011 2012-
50,000
100,000
150,000
200,000
250,000
300,000
350,000
400,000
450,000
500,000
2003 2004 2005 2006 2007 2008 2009 2010 2011 2012

870840 - Tansmissions for motor vehiclesImporters 2004 2005 2006 2007 2008 2009 2010 2011 2012
1 United States of America 24.7% 25.1% 23.4% 20.5% 18.3% 14.0% 15.0% 14.4% 16.6%2 China 4.9% 4.8% 7.5% 8.9% 9.6% 16.0% 17.0% 16.7% 16.2%3 Germany 6.4% 6.1% 5.4% 7.6% 8.6% 8.5% 7.1% 7.4% 6.7%4 Canada 12.8% 11.9% 10.9% 9.4% 7.2% 6.9% 7.0% 6.2% 6.7%5 Mexico 4.8% 5.2% 5.4% 3.2% 4.2% 5.1% 5.8% 6.0% 6.6%6 United Kingdom 6.1% 5.6% 5.4% 6.9% 7.0% 5.5% 5.3% 5.5% 5.5%7 Thailand 0.9% 1.2% 1.3% 1.4% 2.3% 2.8% 3.7% 3.4% 5.0%8 Brazil 1.8% 2.1% 2.1% 2.2% 2.8% 3.3% 3.2% 3.2% 3.2%9 France 4.0% 4.1% 4.3% 4.8% 5.3% 5.1% 3.9% 3.5% 2.8%
10 Russian Federation 0.4% 0.5% 0.8% 1.2% 1.5% 1.0% 1.6% 2.3% 2.7%11 Belgium 4.3% 4.7% 4.3% 3.3% 2.9% 2.5% 2.4% 2.4% 2.1%12 Slovakia 1.3% 1.0% 1.1% 2.0% 1.6% 1.2% 1.6% 1.8% 2.0%13 Japan 0.8% 0.7% 0.7% 1.3% 2.0% 1.5% 1.9% 1.6% 1.9%14 Korea, Republic of 3.1% 2.9% 2.9% 2.9% 2.9% 2.9% 3.1% 2.7% 1.9%
Exporters 2004 2005 2006 2007 2008 2009 2010 2011 20121 Japan 32.3% 33.5% 32.2% 30.3% 29.3% 33.4% 35.5% 33.1% 33.8%2 Germany 17.3% 18.1% 18.1% 20.5% 20.6% 19.2% 19.1% 20.7% 20.9%3 United States of America 15.7% 14.3% 14.1% 12.2% 10.9% 10.6% 11.0% 10.5% 10.9%4 Korea, Republic of 0.3% 0.5% 0.3% 0.3% 0.7% 1.0% 1.8% 2.8% 4.7%5 France 10.9% 8.8% 8.6% 8.9% 8.3% 8.9% 7.4% 6.4% 4.5%6 Mexico 1.1% 1.4% 2.4% 2.9% 3.3% 2.0% 1.7% 2.1% 2.6%7 China 0.1% 0.2% 0.3% 0.7% 1.3% 1.3% 1.8% 2.0% 2.4%8 Italy 2.3% 1.8% 1.7% 1.7% 1.9% 1.6% 1.3% 1.8% 1.9%9 Sweden 2.0% 2.0% 1.9% 1.9% 2.1% 1.1% 1.6% 2.0% 1.7%
10 Canada 3.9% 4.3% 4.3% 4.1% 4.2% 2.7% 2.6% 1.5% 1.5%11 Spain 1.0% 0.8% 1.1% 1.5% 1.3% 1.6% 1.5% 1.5% 1.3%12 Argentina 1.1% 1.2% 1.3% 1.4% 1.4% 1.5% 1.4% 1.2% 1.2%13 Brazil 0.9% 1.1% 1.2% 1.0% 1.0% 0.8% 1.1% 1.3% 1.1%14 Poland 0.8% 1.0% 1.3% 1.4% 1.9% 1.9% 1.6% 1.6% 1.1%
Indonesia 0.4% 0.5% 0.8% 0.6% 0.7% 0.8% 0.8% 0.5% 0.8%
Thailand
Brazil
Malaysia
Taipei, Chinese
Philippines
Turkey
Argentina
Pakistan
India
China
Viet Nam
Saudi Arabia
Japan

850440 - Static converters, nes (BM)
-
10,000,000
20,000,000
30,000,000
40,000,000
50,000,000
60,000,000
2003 2004 2005 2006 2007 2008 2009 2010 2011 2012
-
50,000
100,000
150,000
200,000
250,000
300,000
350,000
400,000
450,000
2003 2004 2005 2006 2007 2008 2009 2010 2011 2012
-
50,000
100,000
150,000
200,000
250,000
2003 2004 2005 2006 2007 2008 2009 2010 2011 2012

850440 - Static converters, nesImporters 2004 2005 2006 2007 2008 2009 2010 2011 2012
1 United States of America 20.0% 19.7% 19.4% 17.4% 16.7% 15.9% 15.1% 14.6% 16.0%2 China 8.3% 9.0% 10.2% 12.1% 11.5% 13.7% 14.2% 14.8% 12.4%3 Hong Kong, China 8.4% 9.6% 9.1% 8.7% 8.8% 8.4% 10.0% 9.4% 9.7%4 Germany 7.6% 7.3% 7.2% 6.7% 6.8% 7.2% 7.2% 6.5% 6.4%5 Japan 6.7% 5.9% 5.4% 4.8% 4.6% 4.4% 4.0% 4.0% 4.2%6 Mexico 3.5% 3.1% 3.5% 3.5% 3.3% 3.5% 3.3% 3.0% 3.3%7 Korea, Republic of 3.2% 3.7% 3.8% 3.8% 3.7% 3.1% 2.9% 2.6% 2.9%8 Netherlands 3.5% 3.1% 3.0% 3.0% 2.6% 2.6% 2.7% 2.9% 2.9%9 France 3.2% 2.9% 2.9% 2.8% 2.9% 2.8% 3.2% 3.1% 2.8%
10 Russian Federation 0.4% 0.6% 0.9% 0.9% 1.1% 1.0% 1.4% 1.7% 2.2%11 United Kingdom 3.5% 3.0% 2.6% 2.4% 2.2% 2.1% 2.1% 2.6% 2.2%12 Canada 2.8% 2.6% 2.4% 2.2% 2.4% 2.3% 2.0% 2.1% 2.2%13 Italy 2.4% 2.4% 2.2% 2.1% 2.3% 2.1% 3.2% 2.5% 2.0%14 Singapore 2.2% 2.3% 2.1% 1.9% 1.9% 1.8% 1.7% 1.9% 1.7%
Exporters 2004 2005 2006 2007 2008 2009 2010 2011 20121 China 20.9% 24.1% 25.7% 27.8% 27.8% 28.6% 29.2% 29.6% 31.2%2 Hong Kong, China 10.7% 12.0% 10.9% 10.3% 9.5% 9.4% 10.4% 9.6% 10.5%3 Germany 9.5% 9.5% 9.4% 9.9% 11.3% 11.2% 11.5% 11.5% 9.6%4 United States of America 8.4% 8.3% 8.7% 7.8% 7.5% 7.4% 6.9% 7.0% 7.2%5 Japan 5.2% 4.7% 4.4% 3.8% 3.9% 3.5% 3.5% 4.1% 3.8%6 Netherlands 2.7% 2.6% 2.2% 2.5% 2.1% 3.2% 3.4% 3.7% 3.5%7 Philippines 0.1% 0.1% 1.8% 2.5% 2.4% 1.8% 2.0% 1.9% 2.4%8 Italy 2.2% 2.0% 1.8% 2.2% 2.3% 2.2% 2.4% 2.1% 2.1%9 Thailand 2.6% 2.2% 2.0% 1.7% 1.6% 1.6% 1.9% 2.1% 2.1%
10 France 3.3% 3.0% 2.8% 2.7% 2.6% 2.5% 2.0% 1.9% 2.0%11 Finland 2.3% 2.5% 2.7% 2.7% 3.0% 2.7% 2.0% 2.1% 2.0%12 Taipei, Chinese 7.0% 4.1% 3.4% 2.8% 2.6% 2.3% 2.4% 2.1% 1.9%13 Denmark 1.1% 1.1% 1.1% 1.2% 1.2% 1.3% 1.8% 1.5% 1.8%14 Switzerland 1.7% 1.9% 1.7% 1.8% 1.9% 2.3% 2.0% 1.9% 1.7%
Indonesia 0.1% 0.1% 0.1% 0.0% 0.0% 0.6% 0.9% 0.8% 0.7%
France
Japan
Singapore
Malaysia
China
Korea, Republic of
Poland
Thailand
United States of America
Philippines
Hong Kong, China
Slovakia
Brazil
India
Spain

848180 - Taps, cocks, valves and similar appliances, nes (BB)
-
10,000,000
20,000,000
30,000,000
40,000,000
50,000,000
60,000,000
2003 2004 2005 2006 2007 2008 2009 2010 2011 2012
-
10,000
20,000
30,000
40,000
50,000
2003 2004 2005 2006 2007 2008 2009 2010 2011 2012
-
100,000
200,000
300,000
400,000
500,000
600,000
2003 2004 2005 2006 2007 2008 2009 2010 2011 2012

848180 - Taps, cocks, valves and similar appliances, nesImporters 2004 2005 2006 2007 2008 2009 2010 2011 2012
1 United States of America 17.9% 18.0% 17.7% 15.4% 13.8% 12.9% 14.7% 14.5% 14.9%2 China 6.0% 6.5% 6.5% 5.7% 6.5% 7.8% 7.3% 7.5% 7.4%3 Germany 6.6% 6.3% 6.8% 6.6% 6.7% 6.0% 6.0% 6.3% 5.3%4 Russian Federation 1.0% 1.4% 1.3% 1.7% 2.4% 2.5% 3.3% 3.5% 5.0%5 Canada 5.4% 5.4% 5.1% 4.3% 4.0% 4.2% 4.2% 4.4% 4.6%6 United Kingdom 5.4% 5.1% 5.1% 5.4% 4.8% 4.2% 4.1% 3.9% 3.5%7 France 5.0% 4.5% 4.4% 4.6% 4.3% 4.3% 4.2% 3.7% 3.2%8 Korea, Republic of 3.1% 3.1% 2.9% 3.2% 2.8% 2.7% 3.0% 2.9% 3.0%9 United Arab Emirates 0.0% 1.0% 0.0% 1.6% 1.7% 2.5% 1.8% 2.7% 2.7%
10 Japan 3.1% 2.9% 2.9% 2.7% 2.5% 2.3% 2.5% 2.8% 2.6%11 Mexico 2.3% 2.5% 2.7% 2.4% 2.4% 2.1% 2.6% 2.6% 2.5%12 Saudi Arabia 0.8% 1.2% 1.0% 2.3% 1.3% 0.7% 1.4% 1.5% 2.4%13 Australia 1.9% 1.9% 1.9% 1.8% 1.9% 2.2% 2.0% 1.8% 2.3%14 Italy 3.1% 3.0% 3.1% 3.1% 3.1% 2.6% 2.5% 2.3% 2.0%
Exporters 2004 2005 2006 2007 2008 2009 2010 2011 20121 China 8.4% 10.1% 12.8% 14.7% 15.9% 15.1% 17.3% 18.0% 18.7%2 Italy 17.1% 15.7% 15.7% 15.6% 16.1% 15.5% 12.7% 12.6% 12.5%3 Germany 14.4% 14.7% 14.3% 13.5% 13.6% 13.9% 13.5% 13.6% 12.5%4 United States of America 9.9% 9.8% 9.3% 8.4% 8.4% 10.0% 10.9% 11.0% 11.6%5 Japan 6.2% 5.6% 5.0% 4.6% 4.5% 4.1% 5.2% 5.1% 4.6%6 France 4.9% 4.8% 4.5% 4.6% 4.5% 4.3% 3.9% 3.8% 3.6%7 United Kingdom 3.6% 3.2% 3.0% 3.5% 2.9% 2.9% 3.1% 2.9% 3.3%8 Korea, Republic of 1.6% 1.8% 1.9% 1.9% 2.1% 2.3% 1.9% 2.3% 3.1%9 Mexico 4.4% 4.1% 3.7% 3.2% 2.8% 2.6% 3.0% 2.6% 2.5%
10 Czech Republic 1.1% 1.2% 1.4% 1.5% 1.5% 1.6% 1.6% 1.7% 2.0%11 Spain 2.6% 2.6% 2.5% 2.6% 2.3% 2.4% 2.0% 1.8% 1.7%12 Canada 2.4% 2.5% 2.3% 2.1% 1.8% 1.8% 1.7% 1.6% 1.6%13 Netherlands 1.8% 1.9% 1.9% 1.9% 2.0% 2.2% 1.6% 1.7% 1.6%14 Denmark 2.2% 1.9% 1.6% 1.8% 1.6% 1.5% 1.9% 1.8% 1.6%
Indonesia 0.0% 0.1% 0.1% 0.1% 0.1% 0.1% 0.1% 0.1% 0.1%
Japan
Thailand
Malaysia
Singapore
Poland
United States of America
Australia
France
China
Brazil
United Arab Emirates
Italy
Bulgaria
India
Taipei, Chinese

841191 - Parts of turbo-jets or turbo-propellers (BB)
-
5,000,000
10,000,000
15,000,000
20,000,000
25,000,000
30,000,000
35,000,000
40,000,000
45,000,000
50,000,000
2003 2004 2005 2006 2007 2008 2009 2010 2011 2012
-
500
1,000
1,500
2,000
2,500
2003 2004 2005 2006 2007 2008 2009 2010 2011 2012
-
2,000
4,000
6,000
8,000
10,000
12,000
14,000
16,000
18,000
20,000
2003 2004 2005 2006 2007 2008 2009 2010 2011 2012

841191 - Parts of turbo-jets or turbo-propellersImporters 2004 2005 2006 2007 2008 2009 2010 2011 2012
1 United States of America 24.9% 26.2% 25.1% 25.4% 24.2% 22.7% 22.1% 21.9% 22.3%2 United Kingdom 14.0% 13.7% 11.7% 13.7% 14.1% 13.6% 15.5% 15.3% 14.9%3 Singapore 4.2% 5.5% 5.2% 4.0% 3.9% 4.9% 6.6% 7.9% 9.8%4 France 11.4% 11.2% 11.2% 11.6% 10.9% 11.0% 10.2% 9.0% 8.7%5 Hong Kong, China 3.3% 3.2% 3.9% 4.3% 7.1% 6.7% 6.1% 7.0% 7.0%6 Germany 9.5% 7.3% 7.7% 7.1% 6.4% 5.8% 5.9% 6.5% 6.6%7 Japan 7.2% 7.6% 7.7% 6.7% 6.3% 5.7% 5.1% 5.0% 4.8%8 Canada 5.1% 5.6% 5.5% 5.2% 5.6% 5.8% 5.3% 4.7% 4.5%9 China 1.0% 1.2% 1.2% 1.6% 2.3% 2.5% 2.7% 3.0% 3.2%
10 Brazil 1.3% 1.7% 1.7% 2.1% 2.3% 2.9% 2.4% 2.5% 2.5%11 Netherlands 2.7% 2.0% 3.0% 3.5% 3.7% 4.7% 3.7% 2.5% 2.3%12 Poland 0.1% 0.2% 0.5% 0.3% 0.2% 0.9% 1.6% 1.6% 1.6%13 Spain 2.7% 2.6% 3.2% 2.3% 1.3% 0.7% 1.0% 0.9% 1.1%14 Australia 0.5% 0.7% 1.3% 1.1% 1.2% 1.3% 1.5% 1.9% 1.1%
Exporters 2004 2005 2006 2007 2008 2009 2010 2011 20121 United Kingdom 19.3% 19.5% 21.1% 20.1% 17.2% 27.4% 26.7% 30.5% 30.5%2 France 10.4% 10.6% 12.1% 15.1% 15.1% 15.5% 14.8% 12.6% 12.5%3 Japan 4.3% 5.0% 4.9% 4.1% 3.9% 6.1% 6.3% 6.9% 7.5%4 Germany 7.1% 7.0% 5.9% 3.8% 4.3% 6.2% 5.6% 6.0% 5.1%5 Hong Kong, China 1.2% 1.1% 1.1% 1.4% 4.5% 5.7% 5.1% 5.3% 5.1%6 Singapore 0.3% 0.7% 1.7% 1.5% 1.7% 2.9% 3.8% 3.8% 4.6%7 Canada 3.8% 4.0% 3.6% 3.6% 3.4% 4.7% 4.6% 4.4% 4.3%8 United States of America 37.7% 36.8% 33.4% 34.0% 33.1% 4.7% 4.9% 4.0% 4.2%9 China 0.6% 0.8% 0.9% 1.0% 1.5% 2.6% 2.8% 3.0% 3.3%
10 Poland 0.5% 0.7% 0.7% 0.7% 0.9% 2.6% 3.6% 3.2% 3.2%11 Italy 2.5% 2.6% 2.5% 2.2% 2.1% 3.4% 3.1% 3.2% 2.9%12 Netherlands 2.3% 1.6% 3.0% 3.4% 3.6% 6.3% 5.7% 4.1% 2.7%13 Belgium 1.5% 1.4% 1.1% 1.3% 1.5% 2.1% 1.9% 1.8% 1.9%14 Spain 1.5% 1.7% 2.0% 1.8% 0.9% 0.5% 1.2% 1.0% 1.5%
Indonesia 0.000% 0.000% 0.000% 0.001% 0.000% 0.001% 0.001% 0.004% 0.004%
Singapore
United States of America
Denmark
Japan
China
Germany
Iran (Islamic Republic of)
Malaysia
Netherlands
Switzerland
Turkey
United Kingdom

870421 - Diesel powered trucks with a GVW not exceeding five tonnes (BM)
-
10,000,000
20,000,000
30,000,000
40,000,000
50,000,000
60,000,000
2003 2004 2005 2006 2007 2008 2009 2010 2011 2012
-
1,000
2,000
3,000
4,000
5,000
6,000
7,000
8,000
9,000
2003 2004 2005 2006 2007 2008 2009 2010 2011 2012-
50,000
100,000
150,000
200,000
250,000
300,000
350,000
400,000
450,000
500,000
2003 2004 2005 2006 2007 2008 2009 2010 2011 2012

870421 - Diesel powered trucks with a GVW not exceeding five tonnesImporters 2004 2005 2006 2007 2008 2009 2010 2011 2012
1 Australia 2.3% 3.0% 3.3% 4.5% 5.4% 7.1% 8.1% 7.0% 9.7%2 France 10.2% 10.7% 10.6% 10.1% 10.2% 10.3% 9.6% 8.8% 6.8%3 Germany 5.0% 4.5% 4.2% 4.5% 5.1% 5.3% 6.0% 7.6% 6.4%4 United Kingdom 8.8% 8.2% 8.6% 8.1% 7.1% 5.1% 7.0% 6.4% 6.4%5 Belgium 3.9% 4.0% 4.5% 4.8% 5.5% 6.1% 5.0% 6.0% 5.3%6 Brazil 0.7% 1.3% 1.5% 1.5% 1.8% 3.7% 4.0% 4.0% 4.9%7 United States of America 10.8% 9.1% 7.7% 4.5% 1.8% 1.6% 2.5% 2.1% 3.0%8 Algeria 0.9% 1.4% 1.2% 1.2% 1.4% 2.1% 1.7% 2.1% 3.0%9 Netherlands 3.7% 2.8% 2.7% 2.9% 3.5% 3.0% 2.7% 3.0% 2.9%
10 Italy 4.6% 4.5% 5.2% 5.4% 5.2% 6.8% 4.4% 4.2% 2.6%11 Chile 0.8% 1.2% 1.2% 1.2% 1.4% 1.1% 2.3% 1.8% 2.4%12 Russian Federation 0.3% 0.5% 0.8% 1.9% 2.7% 0.9% 1.3% 1.9% 2.4%13 Canada 3.6% 2.6% 3.6% 3.6% 1.9% 2.3% 1.9% 1.9% 1.8%14 Malaysia 1.1% 0.8% 0.6% 0.5% 0.7% 1.4% 1.6% 1.2% 1.7%
Exporters 2004 2005 2006 2007 2008 2009 2010 2011 20121 Thailand 6.7% 7.6% 9.1% 7.9% 9.7% 10.9% 13.3% 9.9% 16.8%2 Germany 12.4% 12.7% 11.7% 12.8% 13.7% 11.5% 11.9% 12.7% 11.1%3 Spain 10.3% 11.4% 14.6% 14.1% 12.4% 11.1% 10.9% 11.6% 8.4%4 Argentina 1.3% 2.6% 2.8% 2.5% 2.8% 4.2% 5.4% 6.7% 7.2%5 Italy 8.2% 8.3% 8.5% 8.9% 9.8% 8.2% 8.8% 8.5% 7.1%6 Turkey 7.1% 7.5% 7.9% 8.4% 9.8% 8.1% 8.2% 8.1% 6.3%7 Mexico 8.0% 5.7% 5.1% 5.7% 2.7% 2.9% 4.0% 4.7% 6.1%8 France 12.1% 11.0% 9.2% 8.7% 7.7% 7.6% 6.1% 6.3% 5.9%9 South Africa 0.4% 1.1% 2.5% 2.3% 2.8% 2.6% 2.5% 3.0% 4.8%
10 Korea, Republic of 3.5% 4.3% 3.6% 3.3% 4.0% 5.7% 4.7% 4.5% 4.4%11 Japan 9.4% 7.3% 5.5% 4.6% 5.4% 5.1% 4.7% 4.4% 3.9%12 Poland 2.7% 3.1% 2.9% 2.9% 2.6% 3.3% 3.1% 3.3% 3.4%13 Belgium 3.0% 2.4% 2.4% 2.6% 3.0% 3.0% 2.5% 3.0% 2.6%14 United Kingdom 4.8% 4.3% 3.4% 3.4% 3.1% 3.6% 3.1% 2.6% 1.9%
Timor-Leste
Papua New Guinea
Belgium
China
Tokelau
Australia
Bangladesh
Solomon Islands
Czech Republic
France
Germany
Guinea
Italy
Japan
Malaysia

401110 - Pneumatic tire new of rubber f motor car inclstation wagons&racg cars (BB)
-
5,000,000
10,000,000
15,000,000
20,000,000
25,000,000
30,000,000
35,000,000
40,000,000
45,000,000
50,000,000
2003 2004 2005 2006 2007 2008 2009 2010 2011 2012
-
200,000
400,000
600,000
800,000
1,000,000
1,200,000
1,400,000
1,600,000
1,800,000
2003 2004 2005 2006 2007 2008 2009 2010 2011 2012
-
10,000
20,000
30,000
40,000
50,000
60,000
70,000
2003 2004 2005 2006 2007 2008 2009 2010 2011 2012

401110 - Pneumatic tire new of rubber f motor car incl station wagons&racg carsImporters 2004 2005 2006 2007 2008 2009 2010 2011 2012
1 United States of America 16.8% 17.8% 17.1% 16.3% 16.4% 15.9% 17.1% 15.8% 17.6%2 Germany 10.5% 10.9% 11.5% 11.1% 9.8% 11.0% 10.8% 12.1% 10.9%3 France 6.2% 5.8% 5.9% 6.1% 6.4% 6.9% 6.2% 6.1% 5.6%4 United Kingdom 7.2% 6.5% 6.5% 6.8% 6.4% 5.9% 5.4% 5.0% 4.7%5 Canada 5.0% 5.0% 4.6% 4.0% 4.1% 4.8% 4.2% 3.9% 4.2%6 Netherlands 4.5% 4.0% 4.1% 4.0% 3.7% 3.7% 3.9% 4.3% 3.7%7 Italy 4.9% 4.4% 4.6% 4.6% 4.0% 4.9% 4.3% 4.4% 3.4%8 Russian Federation 1.1% 1.3% 1.7% 2.0% 2.7% 1.6% 1.7% 2.4% 3.2%9 Belgium 4.9% 4.7% 4.4% 4.3% 4.2% 3.9% 3.4% 3.3% 2.8%
10 Mexico 1.8% 2.0% 2.2% 2.1% 2.0% 1.6% 2.3% 2.2% 2.7%11 Spain 4.2% 3.1% 3.4% 3.5% 3.5% 3.7% 3.0% 2.9% 2.7%12 Australia 1.5% 1.5% 1.5% 1.5% 1.5% 1.7% 2.1% 2.1% 2.3%13 Japan 2.2% 2.4% 2.5% 2.1% 2.1% 1.9% 1.8% 1.7% 2.1%14 Czech Republic 1.3% 1.1% 1.3% 1.5% 1.7% 1.9% 1.7% 1.9% 1.7%
Exporters 2004 2005 2006 2007 2008 2009 2010 2011 20121 Thailand 3.8% 5.5% 6.9% 8.6% 9.6% 10.8% 11.2% 12.2% 13.4%2 Germany 11.9% 11.8% 11.5% 10.1% 9.4% 9.7% 10.3% 10.6% 10.3%3 Spain 11.1% 11.1% 11.1% 10.3% 10.1% 9.1% 9.6% 8.6% 7.6%4 Argentina 5.9% 6.2% 6.1% 5.6% 5.3% 5.4% 6.0% 5.8% 6.6%5 Italy 6.9% 6.4% 6.0% 5.5% 5.5% 5.7% 5.4% 4.9% 5.5%6 Turkey 9.6% 8.4% 8.3% 8.2% 7.8% 6.5% 5.7% 4.9% 4.9%7 Mexico 1.0% 1.2% 1.4% 1.8% 2.4% 2.8% 3.4% 3.9% 4.1%8 France 4.3% 3.9% 4.0% 3.8% 3.9% 4.2% 4.1% 4.1% 3.9%9 South Africa 2.7% 2.7% 2.9% 3.2% 3.1% 3.4% 3.4% 3.0% 3.2%
10 Korea, Republic of 2.1% 2.2% 2.6% 2.6% 2.7% 3.0% 3.2% 3.4% 3.2%11 Japan 2.4% 2.8% 2.9% 3.5% 3.3% 3.4% 3.3% 3.1% 2.9%12 Poland 0.2% 0.4% 0.4% 0.7% 1.4% 1.9% 2.0% 2.6% 2.8%13 Belgium 4.8% 3.9% 3.7% 3.5% 2.8% 2.8% 2.1% 2.5% 2.5%14 United Kingdom 3.9% 3.6% 4.4% 3.5% 3.5% 3.5% 2.6% 3.3% 2.5%
Indonesia 2.093% 2.244% 2.625% 2.572% 2.714% 2.971% 3.179% 3.365% 3.156%
United States of America
Japan
Australia
Malaysia
United Arab Emirates
Saudi Arabia
United Kingdom
Belgium
Philippines
Egypt
Thailand
New Zealand
South Africa
Estonia
Russian Federation

853400 - Printed circuits (BB)
-
10,000,000
20,000,000
30,000,000
40,000,000
50,000,000
60,000,000
2003 2004 2005 2006 2007 2008 2009 2010 2011 2012
-
100,000
200,000
300,000
400,000
500,000
600,000
700,000
2003 2004 2005 2006 2007 2008 2009 2010 2011 2012-
50,000
100,000
150,000
200,000
250,000
300,000
350,000
400,000
450,000
500,000
2003 2004 2005 2006 2007 2008 2009 2010 2011 2012

853400 - Printed circuitsImporters 2004 2005 2006 2007 2008 2009 2010 2011 2012
1 China 20.0% 22.3% 24.4% 27.3% 28.0% 29.4% 29.2% 30.1% 29.9%2 Hong Kong, China 10.8% 12.8% 14.8% 16.0% 16.5% 17.2% 18.7% 19.9% 20.9%3 Korea, Republic of 4.1% 4.3% 4.6% 4.3% 4.5% 4.5% 4.7% 4.9% 5.6%4 United States of America 8.7% 7.6% 6.6% 6.0% 5.5% 4.8% 4.7% 4.3% 4.1%5 Malaysia 6.5% 6.4% 6.4% 5.3% 5.5% 5.2% 4.8% 4.4% 4.0%6 Mexico 6.9% 6.2% 5.7% 5.3% 4.7% 4.2% 4.2% 3.8% 3.8%7 Germany 4.4% 4.3% 4.1% 4.0% 4.0% 3.4% 3.7% 3.9% 3.8%8 Taipei, Chinese 2.2% 2.5% 2.7% 2.3% 2.4% 2.4% 2.7% 2.7% 2.7%9 Japan 5.1% 4.4% 4.1% 3.6% 3.6% 3.5% 3.1% 2.5% 2.4%
10 Thailand 2.2% 2.8% 2.9% 3.1% 2.1% 2.4% 2.6% 2.2% 2.2%11 Viet Nam 0.1% 0.1% 0.1% 0.3% 0.5% 1.0% 1.0% 1.3% 1.9%12 Singapore 4.9% 4.5% 3.5% 3.0% 2.5% 2.0% 1.8% 1.6% 1.7%13 Hungary 3.7% 2.9% 2.1% 2.5% 2.5% 2.4% 2.0% 1.8% 1.6%14 Costa Rica 0.0% 0.3% 0.8% 1.1% 1.0% 1.2% 1.0% 1.3% 1.4%
Exporters 2004 2005 2006 2007 2008 2009 2010 2011 20121 China 14.6% 17.8% 22.0% 25.6% 27.9% 28.2% 27.7% 27.9% 29.2%2 Hong Kong, China 12.1% 13.0% 14.8% 16.4% 16.8% 18.2% 19.9% 20.3% 20.3%3 Taipei, Chinese 15.3% 14.9% 15.7% 14.5% 14.3% 13.6% 13.2% 13.6% 12.7%4 Korea, Republic of 4.7% 4.5% 5.0% 5.2% 6.0% 6.9% 6.9% 7.5% 9.1%5 Japan 11.5% 10.5% 9.8% 8.8% 8.5% 8.2% 8.2% 7.6% 7.2%6 United States of America 8.1% 7.0% 6.3% 4.9% 4.4% 5.0% 4.4% 3.7% 3.7%7 Malaysia 5.4% 5.2% 3.8% 3.5% 3.1% 2.5% 2.1% 2.0% 3.0%8 Germany 2.7% 3.1% 2.8% 2.8% 3.3% 2.5% 2.2% 2.5% 2.4%9 Singapore 4.1% 3.8% 3.8% 3.3% 2.5% 2.0% 1.5% 1.3% 1.4%
10 Thailand 5.0% 4.2% 3.0% 3.1% 2.6% 2.8% 2.4% 2.1% 1.3%11 Hungary 1.2% 1.1% 0.4% 0.8% 0.9% 0.8% 0.7% 0.8% 1.2%12 Israel 0.1% 0.2% 0.2% 0.2% 0.2% 0.3% 1.1% 2.4% 0.8%13 Austria 1.2% 1.1% 0.7% 0.9% 0.8% 0.6% 0.7% 0.7% 0.7%14 Switzerland 0.8% 0.7% 0.7% 0.7% 0.8% 0.7% 0.6% 0.7% 0.6%
Indonesia 0.640% 2.027% 0.619% 0.212% 0.145% 0.181% 0.321% 0.517% 0.466%
Singapore
United States of America
Thailand
Hong Kong, China
Malaysia
Viet Nam
Mexico
Korea, Republic of
Philippines
China
Hungary
Japan
Canada
Netherlands
Australia

Ekspor Indonesia &Impor Indonesia
• Competitive product ?

854140 - Photosensitive semiconductdevice,photovoltaic cells&light emit diodes (BB)
-
10,000,000
20,000,000
30,000,000
40,000,000
50,000,000
60,000,000
70,000,000
80,000,000
2003 2004 2005 2006 2007 2008 2009 2010 2011 2012
-
5,000
10,000
15,000
20,000
25,000
30,000
35,000
40,000
45,000
2003 2004 2005 2006 2007 2008 2009 2010 2011 2012-
20,000
40,000
60,000
80,000
100,000
120,000
140,000
160,000
180,000
2003 2004 2005 2006 2007 2008 2009 2010 2011 2012

854140 - Photosensitive semiconduct device,photovoltaic cells&light emit diodesImporters 2004 2005 2006 2007 2008 2009 2010 2011 2012
1 China 16.2% 16.2% 15.1% 14.6% 10.5% 11.2% 10.2% 10.9% 14.4%2 United States of America 9.9% 8.8% 9.3% 8.3% 6.6% 6.8% 6.2% 9.8% 13.3%3 Germany 14.8% 20.3% 20.1% 18.7% 19.9% 24.8% 22.6% 18.3% 12.4%4 Hong Kong, China 9.5% 8.4% 8.6% 7.0% 4.7% 5.5% 4.5% 4.9% 6.5%5 Japan 7.9% 7.2% 6.1% 4.3% 3.4% 3.2% 3.1% 3.1% 5.7%6 Korea, Republic of 6.8% 5.5% 4.9% 4.9% 5.1% 5.2% 3.9% 3.8% 5.6%7 Italy 1.6% 1.7% 2.4% 3.4% 4.6% 7.4% 16.4% 13.1% 5.3%8 Netherlands 1.9% 2.3% 1.5% 1.2% 1.1% 2.6% 3.2% 3.3% 3.6%9 Belgium 1.3% 1.5% 2.1% 2.0% 2.5% 4.4% 2.5% 3.7% 2.9%
10 Taipei, Chinese 3.7% 2.9% 2.6% 2.2% 1.7% 1.8% 1.9% 1.7% 2.2%11 Mexico 2.2% 2.3% 2.1% 1.7% 1.2% 1.4% 1.2% 1.5% 2.2%12 Greece 0.0% 0.0% 0.0% 0.1% 0.2% 0.3% 0.6% 1.1% 2.0%13 France 1.8% 1.7% 1.6% 2.0% 2.4% 4.2% 3.9% 4.6% 1.9%14 Australia 0.4% 0.3% 0.3% 0.3% 0.4% 1.1% 1.5% 2.0% 1.8%
Exporters 2004 2005 2006 2007 2008 2009 2010 2011 20121 China 5.0% 8.0% 12.1% 19.2% 27.2% 27.8% 34.5% 37.0% 32.0%2 Japan 35.6% 30.6% 25.5% 20.0% 14.3% 12.1% 8.8% 8.7% 10.7%3 Taipei, Chinese 9.0% 8.9% 8.3% 9.8% 10.0% 10.4% 10.5% 9.6% 10.3%4 Germany 7.3% 8.3% 10.8% 12.9% 14.6% 11.8% 11.1% 9.8% 8.3%5 Korea, Republic of 2.4% 2.0% 2.1% 2.1% 1.9% 3.4% 5.2% 5.1% 7.1%6 Hong Kong, China 6.9% 6.2% 6.1% 5.3% 3.4% 3.7% 2.9% 3.1% 4.6%7 Malaysia 6.1% 5.4% 4.9% 3.4% 1.7% 2.2% 3.6% 3.6% 4.6%8 United States of America 10.7% 10.4% 8.0% 7.0% 5.5% 6.3% 4.5% 3.9% 4.4%9 Singapore 2.5% 2.0% 2.2% 1.8% 1.7% 1.7% 1.7% 2.8% 2.9%
10 Netherlands 1.2% 1.9% 1.3% 1.8% 1.4% 1.9% 2.3% 2.6% 2.6%11 Belgium 1.0% 1.4% 2.1% 1.8% 1.8% 1.5% 1.5% 1.9% 1.8%12 Philippines 0.2% 0.1% 0.1% 0.2% 0.1% 0.3% 0.5% 1.1% 1.4%13 Mexico 0.6% 0.9% 1.1% 0.7% 0.9% 1.5% 1.0% 1.2% 1.4%14 Czech Republic 0.1% 0.5% 1.0% 1.2% 1.7% 1.7% 1.3% 1.4% 0.9%
Indonesia 0.036% 0.020% 0.006% 0.032% 0.030% 0.065% 0.047% 0.052% 0.060%
Singapore
China
Philippines
Japan
United Kingdom
Hong Kong, China
Germany
Malaysia
Bolivia
Timor-Leste
Korea, Republic of
Uruguay
Taipei, Chinese
India
United States of America

Ekspor Indonesia &Impor Indonesia
• Non-competitive Industries
• De-industrialization
• Shift to domestic use due to very high domestic demand
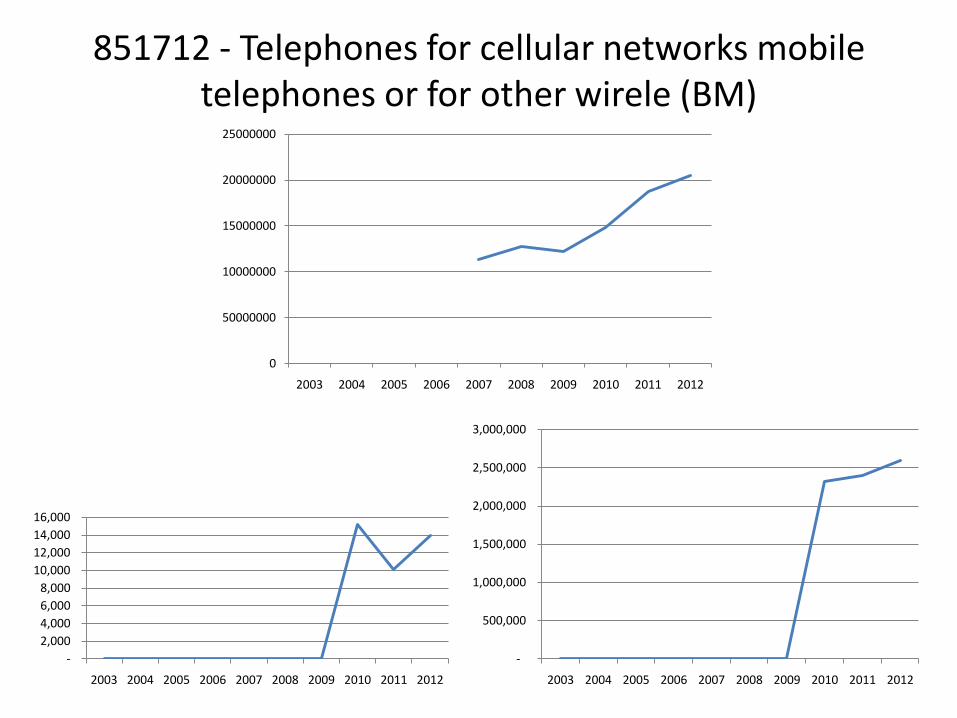
851712 - Telephones for cellular networks mobile telephones or for other wirele (BM)
0
50000000
10000000
15000000
20000000
25000000
2003 2004 2005 2006 2007 2008 2009 2010 2011 2012
-
2,000
4,000
6,000
8,000
10,000
12,000
14,000
16,000
2003 2004 2005 2006 2007 2008 2009 2010 2011 2012
-
500,000
1,000,000
1,500,000
2,000,000
2,500,000
3,000,000
2003 2004 2005 2006 2007 2008 2009 2010 2011 2012

851712 - Telephones for cellular networks mobile telephones or for other wireleImporters 2007 2008 2009 2010 2011 2012
1 United States of America 22.9% 24.2% 27.8% 25.3% 22.9% 21.5%
2 Hong Kong, China 8.2% 6.8% 7.1% 7.2% 8.8% 10.7%
3 Japan 1.4% 1.7% 2.5% 3.4% 4.9% 6.8%
4 United Kingdom 5.4% 4.7% 5.1% 5.5% 4.9% 4.9%
5 Germany 6.4% 3.4% 3.6% 3.9% 4.6% 4.7%
6 United Arab Emirates 0.0% 2.5% 3.1% 2.8% 3.8% 3.3%
7 France 3.4% 3.6% 4.0% 3.8% 3.1% 3.1%
8 Singapore 6.0% 4.3% 3.1% 3.1% 3.3% 2.9%
9 Mexico 0.0% 3.7% 3.3% 3.1% 2.5% 2.8%
10 India 0.0% 0.0% 2.6% 3.6% 3.1% 2.2%
11 Canada 1.2% 1.5% 1.6% 2.1% 2.3% 2.2%
12 Italy 2.8% 2.7% 2.4% 2.0% 2.0% 2.0%
13 Russian Federation 4.6% 4.1% 2.3% 2.4% 2.0% 2.0%
14 Australia 1.7% 1.5% 1.7% 1.8% 1.8% 1.9%
Exporters 2007 2008 2009 2010 2011 2012
1 China 33.6% 32.4% 34.7% 36.3% 38.7% 46.1%
2 Viet Nam 0.0% 0.0% 0.2% 1.2% 3.5% 7.4%
3 Korea, Republic of 17.4% 18.4% 15.8% 11.8% 9.2% 6.9%
4 Hong Kong, China 3.4% 3.9% 4.4% 5.1% 6.3% 6.2%
5 United States of America 2.9% 3.2% 3.4% 4.0% 4.0% 4.2%
6 Taipei, Chinese 0.0% 0.0% 3.2% 5.8% 6.5% 3.4%
7 Hungary 7.7% 8.4% 7.8% 7.6% 6.3% 3.0%
8 Germany 7.7% 1.9% 1.4% 2.4% 2.6% 2.7%
9 Singapore 6.0% 4.0% 2.7% 2.5% 2.7% 2.6%
10 Mexico 0.0% 7.2% 8.4% 7.6% 4.4% 2.5%
11 India 0.0% 0.0% 3.0% 1.1% 2.0% 1.6%
12 Slovakia 0.1% 0.1% 0.2% 0.6% 1.0% 1.6%
13 United Kingdom 0.8% 1.0% 1.5% 1.5% 1.7% 1.2%
14 Czech Republic 0.5% 1.0% 0.6% 0.6% 1.3% 1.2%
Indonesia 0.00% 0.00% 0.00% 0.01% 0.01% 0.01%
Singapore
Hong Kong, China
Malaysia
China
Mexico
United Arab Emirates
United States of America
Germany
Timor-Leste

854232 - Electronic integrated circuits as memories (BB)
0
10000000
20000000
30000000
40000000
50000000
60000000
70000000
80000000
90000000
10000000
2003 2004 2005 2006 2007 2008 2009 2010 2011 2012
-
100
200
300
400
500
600
700
2003 2004 2005 2006 2007 2008 2009 2010 2011 2012
-
10,000
20,000
30,000
40,000
50,000
60,000
70,000
80,000
90,000
100,000
2003 2004 2005 2006 2007 2008 2009 2010 2011 2012

854232 - Electronic integrated circuits as memoriesImporters 2007 2008 2009 2010 2011 2012
1 China 37.0% 36.5% 36.6% 40.7% 41.5% 45.6%
2 Hong Kong, China 18.1% 15.6% 17.6% 17.0% 17.2% 17.1%
3 Taipei, Chinese 0.0% 0.0% 8.3% 7.5% 7.3% 6.7%
4 Korea, Republic of 6.5% 9.1% 6.6% 6.3% 7.5% 6.1%
5 Japan 10.8% 11.1% 9.5% 8.3% 5.6% 4.8%
6 United States of America 9.0% 7.3% 5.6% 4.6% 4.5% 4.5%
7 Mexico 0.0% 1.5% 1.5% 2.0% 3.4% 2.7%
8 Singapore 0.4% 4.5% 3.0% 3.7% 2.4% 2.4%
9 Viet Nam 0.0% 0.0% 0.0% 0.0% 0.0% 1.7%
10 Malaysia 0.0% 0.0% 1.3% 1.3% 2.2% 1.3%
11 Germany 6.1% 4.6% 2.3% 2.0% 1.7% 1.3%
12 Brazil 0.8% 1.0% 0.7% 0.9% 0.8% 0.8%
13 France 1.6% 1.1% 0.6% 0.6% 0.8% 0.8%
14 Italy 1.1% 0.9% 0.6% 0.5% 0.5% 0.4%
Exporters 2007 2008 2009 2010 2011 2012
1 Korea, Republic of 27.2% 23.0% 22.3% 27.9% 25.8% 22.2%
2 China 13.4% 15.2% 12.5% 11.2% 13.4% 19.2%
3 Hong Kong, China 13.2% 12.6% 11.6% 10.8% 12.7% 13.4%
4 Japan 12.7% 13.4% 14.0% 13.3% 13.1% 12.3%
5 United States of America 15.5% 16.1% 10.4% 9.2% 9.8% 9.0%
6 Singapore 0.3% 4.2% 7.1% 8.9% 8.6% 8.2%
7 Taipei, Chinese 0.0% 0.0% 7.0% 9.4% 7.8% 7.1%
8 Thailand 2.9% 2.1% 1.8% 1.4% 1.6% 2.7%
9 Malaysia 0.0% 0.0% 3.2% 2.8% 2.4% 1.6%
10 Israel 0.0% 0.4% 4.5% 1.0% 0.8% 1.0%
11 Germany 4.6% 4.5% 1.9% 1.2% 1.1% 0.9%
12 France 1.6% 1.5% 0.9% 0.8% 0.9% 0.8%
13 Italy 1.1% 0.8% 0.5% 0.4% 0.3% 0.4%
14 Netherlands 1.9% 0.6% 0.5% 0.5% 0.4% 0.4%
Indonesia 0.0000% 0.0000% 0.0000% 0.0008% 0.0003% 0.0003%
India
Singapore
United States of America
Germany
Timor-Leste
Korea, Republic of
China
Finland
Hong Kong, China
Japan
Malaysia
Taipei, Chinese
South Africa
Thailand
United Kingdom

740311 - Copper cathodes and sections of cathodes unwrought (BB)
-
10,000,000
20,000,000
30,000,000
40,000,000
50,000,000
60,000,000
70,000,000
80,000,000
2003 2004 2005 2006 2007 2008 2009 2010 2011 2012
-
200,000
400,000
600,000
800,000
1,000,000
1,200,000
1,400,000
2003 2004 2005 2006 2007 2008 2009 2010 2011 2012
-
100,000
200,000
300,000
400,000
500,000
600,000
700,000
800,000
2003 2004 2005 2006 2007 2008 2009 2010 2011 2012

740311 - Copper cathodes and sections of cathodes unwrought
Importers 2004 2005 2006 2007 2008 2009 2010 2011 20121 China 17.9% 17.5% 11.8% 20.4% 19.4% 38.9% 36.7% 36.0% 42.5%2 Germany 8.6% 9.4% 12.2% 11.2% 11.4% 7.8% 8.7% 8.6% 7.7%3 United States of America 9.3% 12.9% 14.0% 11.3% 10.2% 7.3% 7.0% 8.2% 7.7%4 Italy 9.4% 8.4% 10.1% 9.5% 8.1% 6.1% 7.1% 7.4% 6.9%5 Taipei, Chinese 10.2% 9.1% 9.2% 8.6% 8.4% 6.1% 6.5% 5.8% 5.2%6 Turkey 3.4% 3.5% 3.1% 3.9% 4.0% 3.7% 4.2% 4.4% 4.4%7 Korea, Republic of 7.0% 5.8% 5.0% 5.4% 5.4% 5.7% 4.7% 4.2% 3.5%8 Brazil 2.3% 2.4% 2.7% 3.2% 3.8% 2.5% 3.2% 3.0% 3.3%9 Thailand 3.5% 3.4% 3.5% 3.4% 3.8% 2.9% 3.0% 3.0% 3.0%
10 Malaysia 2.7% 2.7% 2.8% 2.9% 2.5% 2.2% 2.5% 2.9% 2.6%11 France 8.4% 7.1% 7.0% 5.6% 5.6% 2.8% 2.1% 2.0% 1.9%12 Egypt 0.0% 0.0% 0.0% 0.0% 2.0% 0.8% 0.5% 1.3% 1.2%13 Indonesia 0.2% 0.2% 0.2% 0.1% 0.9% 0.5% 0.9% 0.9% 1.1%14 Viet Nam 0.8% 0.8% 1.1% 1.3% 1.0% 1.2% 1.5% 1.1% 1.0%
Exporters 2004 2005 2006 2007 2008 2009 2010 2011 20121 Chile 45.6% 41.4% 37.8% 39.4% 38.2% 39.9% 37.5% 36.5% 33.3%2 Zambia 2.7% 2.6% 3.3% 4.2% 4.3% 4.2% 5.6% 6.9% 6.5%3 Japan 2.6% 3.2% 4.2% 5.6% 5.6% 6.6% 5.8% 5.1% 6.2%4 Kazakhstan 5.5% 5.8% 5.3% 4.9% 5.0% 3.3% 3.0% 4.1% 5.2%5 Australia 4.8% 4.7% 4.3% 4.2% 4.7% 3.8% 3.6% 4.8% 4.5%6 Poland 4.2% 4.6% 4.1% 3.3% 3.9% 4.0% 3.8% 4.0% 3.9%7 China 1.9% 2.2% 3.3% 1.9% 1.6% 1.0% 0.5% 2.1% 3.5%8 India 1.9% 2.3% 3.5% 3.2% 2.5% 2.4% 7.5% 3.0% 3.4%9 Peru 7.0% 7.1% 6.8% 4.8% 5.5% 4.4% 4.1% 3.9% 3.0%
10 Germany 1.0% 1.4% 1.1% 1.1% 1.3% 1.9% 1.1% 2.1% 2.8%11 Russian Federation 4.7% 4.2% 3.5% 3.7% 2.5% 5.8% 5.3% 2.2% 2.8%
12 Democratic Republic of the Congo 0.0% 0.1% 0.0% 0.1% 0.4% 0.8% 2.3% 2.4% 2.7%13 Bulgaria 0.8% 0.6% 0.6% 0.5% 1.3% 1.9% 2.2% 2.6% 2.5%14 Belgium 0.7% 1.0% 0.8% 0.6% 0.9% 2.0% 1.2% 1.5% 2.4%
Indonesia 1.365% 2.035% 1.319% 2.303% 1.868% 2.250% 1.927% 1.682% 0.826%
Malaysia
Thailand
China
Viet Nam
Taipei, Chinese
Philippines
Singapore

890190 - Cargo vessels nes&oth vessels for the transport of both persons&goods (BM)
-
10,000,000
20,000,000
30,000,000
40,000,000
50,000,000
60,000,000
2003 2004 2005 2006 2007 2008 2009 2010 2011 2012
-
50,000
100,000
150,000
200,000
250,000
300,000
350,000
2003 2004 2005 2006 2007 2008 2009 2010 2011 2012 -
200,000
400,000
600,000
800,000
1,000,000
1,200,000
1,400,000
1,600,000
2003 2004 2005 2006 2007 2008 2009 2010 2011 2012

890190 - Cargo vessels nes&oth vessels for the transport of both persons&goodsImporters 2004 2005 2006 2007 2008 2009 2010 2011 2012
1 Panama 0.0% 0.0% 0.0% 0.0% 0.0% 0.0% 0.0% 0.0% 32.2%2 Liberia 9.6% 13.1% 13.9% 11.0% 9.0% 14.1% 14.8% 21.3% 12.3%3 Germany 9.7% 18.9% 23.9% 12.2% 20.1% 18.4% 29.5% 18.4% 9.3%4 Marshall Islands 5.6% 9.1% 5.7% 10.1% 11.4% 13.9% 11.4% 11.9% 9.0%5 Congo 0.0% 0.0% 0.0% 3.7% 2.2% 2.7% 1.8% 6.4% 5.4%6 Singapore 1.0% 2.2% 2.6% 8.0% 9.2% 2.4% 2.2% 3.8% 5.2%7 Korea, Republic of 4.0% 5.4% 2.3% 5.5% 7.1% 5.9% 4.9% 4.1% 3.6%8 Poland 7.4% 3.2% 2.5% 2.6% 3.4% 3.2% 2.6% 3.4% 2.8%9 Greece 5.0% 2.8% 5.8% 7.8% 3.8% 5.6% 4.2% 2.0% 2.4%
10 Indonesia 1.0% 0.9% 3.9% 0.8% 0.8% 4.8% 1.5% 2.5% 2.0%11 Italy 1.7% 1.3% 2.6% 1.7% 2.2% 2.2% 4.4% 2.8% 1.7%12 India 0.7% 1.3% 2.8% 4.4% 3.9% 4.5% 1.5% 0.8% 1.4%13 Norway 1.5% 2.5% 1.5% 0.8% 2.0% 1.5% 1.7% 2.1% 1.1%14 Turkey 0.9% 2.9% 0.5% 1.5% 1.7% 1.5% 1.3% 2.1% 0.9%
Exporters 2004 2005 2006 2007 2008 2009 2010 2011 20121 China 9.2% 10.9% 13.8% 17.8% 22.0% 28.6% 36.2% 36.0% 36.4%2 Korea, Republic of 27.9% 26.3% 29.4% 28.6% 26.3% 24.6% 25.9% 24.3% 24.1%3 Japan 27.5% 28.7% 23.2% 23.2% 22.1% 24.0% 21.9% 22.4% 23.9%4 Poland 7.8% 3.9% 3.1% 2.6% 2.8% 2.4% 1.7% 2.4% 2.2%5 Panama 0.0% 0.0% 0.0% 0.0% 0.0% 0.0% 0.0% 0.0% 1.3%6 Angola 0.0% 0.0% 0.0% 0.4% 0.5% 0.5% 0.3% 0.9% 1.2%7 Germany 4.0% 2.7% 4.0% 5.5% 4.0% 1.6% 1.5% 1.2% 1.2%8 Romania 1.6% 1.9% 1.9% 1.6% 1.7% 1.8% 1.2% 1.4% 1.1%9 Gabon 0.0% 0.0% 0.0% 0.0% 0.0% 0.0% 0.1% 0.6% 1.0%
10 Norway 2.4% 1.9% 1.3% 1.7% 1.7% 2.0% 1.0% 0.7% 0.9%11 Congo 0.0% 0.0% 0.0% 0.7% 0.9% 1.3% 0.9% 2.2% 0.8%12 Taipei, Chinese 1.1% 1.8% 1.2% 1.3% 1.5% 1.4% 1.1% 0.8% 0.7%13 Philippines 0.4% 0.5% 0.1% 0.1% 0.1% 0.0% 0.0% 0.0% 0.7%14 India 0.3% 0.4% 0.4% 0.8% 2.1% 1.8% 0.6% 0.5% 0.4%
Indonesia 0.139% 0.369% 0.510% 0.346% 0.559% 0.618% 0.280% 0.191% 0.319%
Singapore
Malaysia
Viet Nam
Bangladesh
China

852580 - Television cameras, digital cameras and video camera recorders (BK)
0
10000000
20000000
30000000
40000000
50000000
60000000
2003 2004 2005 2006 2007 2008 2009 2010 2011 2012
-
100,000
200,000
300,000
400,000
500,000
600,000
700,000
800,000
900,000
1,000,000
2003 2004 2005 2006 2007 2008 2009 2010 2011 2012
-
20,000
40,000
60,000
80,000
2003 2004 2005 2006 2007 2008 2009 2010 2011 2012

852580 - Television cameras, digital cameras and video camera recorders
Importers 2007 2008 2009 2010 2011 2012
1 China 7.5% 7.4% 8.4% 10.0% 14.0% 19.8%
2 United States of America 23.9% 21.8% 20.1% 19.2% 16.0% 15.1%
3 Hong Kong, China 11.5% 10.3% 11.5% 10.5% 9.8% 9.1%
4 Netherlands 4.3% 5.8% 5.4% 5.7% 5.4% 5.8%
5 Germany 8.1% 7.4% 7.4% 6.6% 6.5% 5.7%
6 Japan 3.9% 3.8% 3.7% 4.0% 3.7% 4.2%
7 Russian Federation 2.6% 3.0% 2.0% 2.6% 2.8% 3.2%
8 United Kingdom 4.9% 4.3% 4.0% 3.5% 3.2% 2.7%
9 Singapore 2.2% 2.5% 2.4% 2.4% 2.5% 2.6%
10 France 3.5% 3.1% 3.1% 2.8% 2.8% 2.4%
11 Canada 2.6% 2.5% 2.4% 2.5% 2.2% 2.1%
12 United Arab Emirates 0.0% 0.9% 1.3% 1.4% 1.6% 1.5%
13 Taipei, Chinese 0.0% 0.0% 1.2% 1.5% 2.0% 1.5%
14 Australia 1.6% 1.7% 1.7% 1.5% 1.5% 1.5%
Exporters 2007 2008 2009 2010 2011 2012
1 China 28.0% 27.0% 27.9% 27.8% 27.7% 27.6%
2 Japan 31.0% 30.7% 25.5% 22.5% 20.2% 20.2%
3 Netherlands 4.4% 5.8% 5.9% 7.0% 7.0% 7.3%
4 Hong Kong, China 10.5% 9.6% 10.0% 8.6% 8.0% 7.1%
5 Thailand 2.4% 2.8% 3.4% 4.1% 4.6% 5.0%
6 Germany 6.1% 5.1% 5.3% 4.8% 5.5% 4.4%
7 United States of America 3.7% 3.9% 4.5% 4.7% 5.1% 4.2%
8 Taipei, Chinese 0.0% 0.0% 1.2% 2.2% 3.1% 3.9%
9 Viet Nam 0.0% 1.0% 1.0% 0.8% 0.3% 3.9%
10 Singapore 1.3% 1.7% 1.7% 2.0% 2.2% 2.2%
11 Korea, Republic of 2.1% 1.9% 1.7% 1.5% 1.6% 1.6%
12 Malaysia 0.0% 0.0% 1.4% 1.2% 1.3% 1.5%
13 Slovakia 0.9% 1.0% 1.3% 1.2% 1.2% 1.2%
14 United Kingdom 1.3% 1.4% 1.3% 1.3% 1.4% 1.2%
Indonesia 0.000% 0.000% 0.000% 2.319% 1.684% 0.937%
United States of America
Netherlands
Japan
Hong Kong, China
Germany
China
Philippines
Belgium
United Arab Emirates
Canada
United Kingdom
Australia
Russian Federation
Singapore
Korea, Republic of

392690 - Articles of plastics or of other materials of Nos39.01 to 39.14 nes (BK)
-
10,000,000
20,000,000
30,000,000
40,000,000
50,000,000
60,000,000
2003 2004 2005 2006 2007 2008 2009 2010 2011 2012
-
10,000
20,000
30,000
40,000
50,000
60,000
70,000
80,000
90,000
100,000
2003 2004 2005 2006 2007 2008 2009 2010 2011 2012-
50,000
100,000
150,000
200,000
250,000
300,000
350,000
2003 2004 2005 2006 2007 2008 2009 2010 2011 2012

392690 - Articles of plastics or of other materials of Nos 39.01 to 39.14 nesImporters 2004 2005 2006 2007 2008 2009 2010 2011 2012
1 United States of America 12.3% 12.8% 12.4% 11.6% 10.8% 11.3% 11.2% 10.8% 11.8%2 Germany 7.0% 7.6% 7.8% 7.7% 8.2% 8.2% 7.8% 8.4% 7.9%3 Mexico 9.9% 9.5% 9.2% 8.0% 6.9% 6.3% 9.2% 6.5% 6.9%4 China 4.8% 5.0% 4.9% 4.9% 4.8% 5.2% 5.4% 5.5% 5.5%5 France 5.6% 5.4% 5.2% 5.4% 5.3% 5.3% 5.2% 5.2% 4.9%6 Japan 4.1% 3.9% 3.9% 3.8% 3.9% 4.3% 4.0% 4.3% 4.7%7 United Kingdom 4.9% 4.6% 4.1% 4.2% 3.7% 3.7% 3.5% 3.5% 3.4%8 Thailand 3.1% 3.0% 3.0% 2.9% 3.0% 2.8% 3.1% 3.0% 3.3%9 Canada 3.1% 3.1% 3.0% 3.1% 3.0% 3.0% 2.9% 2.9% 2.9%
10 Netherlands 2.2% 1.9% 1.9% 1.8% 2.1% 2.5% 2.2% 2.5% 2.4%11 Czech Republic 2.7% 2.7% 2.6% 2.6% 2.8% 2.5% 2.3% 2.5% 2.3%12 Italy 2.6% 2.6% 2.6% 2.7% 2.6% 2.5% 2.4% 2.6% 2.3%13 Russian Federation 0.5% 0.6% 0.8% 1.1% 1.5% 1.4% 1.7% 2.0% 2.1%14 Hong Kong, China 2.3% 2.3% 2.3% 2.4% 2.2% 2.2% 2.2% 2.0% 2.1%
Exporters 2004 2005 2006 2007 2008 2009 2010 2011 20121 China 8.9% 10.1% 10.7% 10.1% 10.1% 10.8% 12.1% 13.6% 16.1%2 Korea, Republic of 13.7% 13.9% 14.5% 15.0% 15.8% 16.0% 15.0% 15.2% 13.5%3 Japan 12.6% 12.6% 12.4% 11.8% 10.7% 10.8% 11.1% 10.6% 10.8%4 Poland 7.6% 7.1% 6.8% 7.2% 7.1% 6.6% 6.1% 5.9% 5.3%5 Panama 3.6% 3.7% 3.7% 3.5% 3.7% 3.8% 4.2% 4.1% 4.1%6 Angola 4.7% 4.5% 4.2% 4.0% 3.8% 3.9% 3.9% 3.7% 3.7%7 Germany 5.4% 5.3% 4.9% 5.0% 5.0% 4.9% 4.5% 4.3% 3.6%8 Romania 3.5% 3.5% 3.5% 3.4% 3.2% 3.1% 3.3% 2.8% 3.0%9 Gabon 2.4% 2.6% 2.3% 2.2% 2.4% 2.7% 2.4% 2.9% 2.7%
10 Norway 2.7% 2.6% 2.5% 2.2% 2.0% 2.2% 2.4% 2.1% 2.5%11 Congo 0.1% 0.1% 0.1% 0.1% 0.1% 0.1% 0.1% 0.1% 2.3%12 Taipei, Chinese 3.0% 3.1% 3.0% 3.1% 3.1% 3.0% 2.6% 2.6% 2.2%13 Philippines 1.6% 1.5% 1.7% 1.5% 1.5% 1.5% 1.8% 1.9% 2.1%14 India 3.5% 3.4% 3.2% 3.3% 2.7% 2.4% 2.2% 2.4% 2.1%
Indonesia 0.121% 0.132% 0.135% 0.170% 0.245% 0.222% 0.204% 0.176% 0.134%
Japan
Singapore
Netherlands
United States of America
Australia
Malaysia
Thailand
Timor-Leste
Viet Nam
India
China
Germany
United Kingdom
Italy
Cambodia

847150 - Digital processing units not sold as complete systems (BM)
-
5,000,000
10,000,000
15,000,000
20,000,000
25,000,000
30,000,000
35,000,000
40,000,000
45,000,000
50,000,000
2003 2004 2005 2006 2007 2008 2009 2010 2011 2012
-
50,000
100,000
150,000
200,000
250,000
300,000
350,000
400,000
2003 2004 2005 2006 2007 2008 2009 2010 2011 2012
-
50,000
100,000
150,000
200,000
250,000
300,000
350,000
2003 2004 2005 2006 2007 2008 2009 2010 2011 2012

847150 - Digital processing units not sold as complete systems
Importers 2004 2005 2006 2007 2008 2009 2010 2011 20121 United States of America 20.9% 19.1% 18.2% 20.8% 19.4% 27.7% 33.3% 32.7% 34.0%2 Japan 10.3% 9.4% 8.8% 7.3% 8.2% 7.1% 6.8% 6.8% 6.5%3 United Kingdom 7.6% 7.4% 10.1% 9.3% 8.3% 6.1% 5.0% 4.9% 5.0%4 Canada 4.5% 4.6% 4.5% 4.6% 4.7% 4.1% 4.0% 4.2% 4.4%5 Germany 8.4% 8.9% 8.4% 8.5% 8.7% 7.3% 5.7% 5.1% 4.4%6 China 1.5% 1.9% 2.4% 2.4% 2.7% 3.0% 3.1% 3.3% 4.3%7 France 7.6% 7.4% 6.8% 6.2% 6.1% 4.8% 4.2% 4.1% 3.5%8 Netherlands 6.6% 7.2% 6.6% 6.7% 7.0% 7.5% 4.9% 3.8% 3.3%9 Hong Kong, China 1.1% 1.2% 0.8% 0.8% 1.0% 1.3% 1.4% 1.8% 2.2%
10 Korea, Republic of 1.6% 1.8% 2.1% 2.1% 2.0% 1.7% 1.9% 2.0% 2.0%11 Mexico 1.9% 1.7% 1.6% 1.7% 1.7% 1.8% 1.6% 1.7% 2.0%12 Australia 1.0% 1.2% 1.4% 1.6% 1.3% 1.4% 1.2% 1.5% 1.8%13 Italy 3.4% 2.9% 3.0% 3.1% 2.6% 2.4% 2.4% 2.3% 1.8%14 India 0.6% 0.7% 1.0% 1.1% 1.0% 1.1% 1.1% 1.3% 1.5%
Exporters 2004 2005 2006 2007 2008 2009 2010 2011 20121 China 6.8% 11.4% 13.2% 16.7% 19.7% 25.3% 32.2% 30.7% 30.7%2 United States of America 12.4% 11.8% 10.8% 13.8% 16.2% 17.0% 15.8% 16.2% 16.9%3 Mexico 8.8% 7.2% 7.6% 7.7% 6.7% 8.2% 9.3% 10.1% 11.6%4 Czech Republic 1.0% 5.1% 6.1% 7.5% 8.6% 8.1% 9.1% 10.3% 9.7%5 Germany 18.7% 12.3% 9.9% 9.5% 7.6% 7.7% 5.5% 5.1% 5.0%6 Singapore 1.9% 1.6% 1.4% 1.8% 1.9% 1.8% 2.3% 4.1% 4.7%7 Hong Kong, China 1.4% 1.2% 1.0% 1.0% 0.9% 1.1% 2.1% 3.6% 4.2%8 Netherlands 9.7% 8.1% 7.4% 8.4% 8.0% 8.1% 6.5% 3.6% 3.9%9 Hungary 3.3% 2.3% 3.5% 4.5% 3.3% 2.5% 2.3% 2.4% 2.0%
10 France 4.7% 3.4% 3.3% 2.5% 3.6% 3.5% 3.3% 3.1% 1.7%11 Ireland 8.5% 16.6% 17.6% 15.2% 12.6% 6.7% 3.9% 1.9% 1.4%12 United Kingdom 12.6% 10.2% 10.3% 4.8% 3.8% 2.4% 1.3% 1.3% 1.1%13 Canada 2.4% 1.9% 0.7% 0.9% 1.0% 1.3% 0.9% 0.9% 0.9%14 Japan 1.3% 1.1% 0.9% 0.6% 0.8% 1.1% 1.2% 1.1% 0.9%
Indonesia 1.197% 1.147% 0.994% 0.000% 0.001% 0.001% 0.006% 0.018% 0.018%
Singapore
Hong Kong, China
United States of America
Germany
China
Thailand
Taipei, Chinese
Malaysia
Timor-Leste
India
Australia
Netherlands
Japan
Viet Nam
United Kingdom

Ekspor Indonesia &Impor Indonesia
• Shift to domestic market

854231 - Electronic integrated circuits as processors and controllers, whether (BB)
0
50000000
10000000
15000000
20000000
25000000
2003 2004 2005 2006 2007 2008 2009 2010 2011 2012
-
50,000
100,000
150,000
200,000
250,000
2003 2004 2005 2006 2007 2008 2009 2010 2011 2012
-
50,000
100,000
150,000
200,000
250,000
300,000
350,000
400,000
2003 2004 2005 2006 2007 2008 2009 2010 2011 2012

854231 - Electronic integrated circuits as processors and controllers, whether
Importers 2007 2008 2009 2010 2011 2012
1 China 52.0% 49.0% 45.1% 44.1% 45.2% 47.2%
2 Hong Kong, China 11.3% 12.6% 13.4% 12.8% 11.9% 10.7%
3 United States of America 4.0% 3.7% 4.0% 4.7% 6.7% 6.5%
4 Korea, Republic of 10.1% 9.0% 7.3% 6.6% 6.3% 6.3%
5 Singapore 0.3% 3.0% 3.7% 3.9% 3.6% 4.4%
6 Malaysia 0.0% 0.0% 4.8% 5.7% 4.4% 4.0%
7 Mexico 0.0% 2.6% 2.6% 2.9% 3.0% 2.8%
8 Germany 3.6% 3.2% 2.4% 2.6% 2.7% 2.1%
9 Japan 3.5% 3.1% 2.7% 2.2% 2.0% 2.0%
10 Thailand 1.8% 1.7% 1.5% 1.7% 1.5% 1.4%
11 Viet Nam 0.0% 0.1% 0.1% 0.1% 0.3% 1.1%
12 Taipei, Chinese 0.0% 0.0% 0.8% 1.2% 1.4% 1.1%
13 Czech Republic 0.9% 0.9% 1.0% 1.0% 1.0% 1.1%
14 France 1.1% 1.0% 0.8% 1.0% 0.9% 0.9%
Exporters 2007 2008 2009 2010 2011 2012
1 Singapore 1.2% 13.4% 13.5% 15.6% 18.1% 17.9%
2 China 13.2% 11.2% 11.4% 11.2% 10.9% 16.0%
3 Hong Kong, China 16.7% 17.3% 18.7% 16.8% 16.2% 12.8%
4 Korea, Republic of 12.7% 10.7% 9.6% 10.6% 11.5% 12.5%
5 United States of America 17.0% 16.8% 12.5% 13.0% 10.8% 9.9%
6 Malaysia 0.0% 0.0% 10.5% 9.1% 10.4% 9.3%
7 Japan 9.6% 7.2% 5.3% 5.5% 4.4% 3.7%
8 Germany 7.2% 5.6% 3.7% 3.8% 3.4% 3.6%
9 Viet Nam 0.0% 0.1% 0.1% 0.0% 0.3% 2.4%
10 France 2.5% 2.1% 1.8% 2.3% 2.1% 1.6%
11 Thailand 3.7% 2.5% 2.3% 2.2% 2.0% 1.4%
12 Costa Rica 1.4% 0.9% 0.6% 0.7% 1.2% 1.2%
13 Israel 0.0% 0.5% 0.8% 0.9% 0.6% 1.1%
14 Netherlands 4.3% 2.1% 1.5% 1.4% 1.0% 0.9%
Indonesia 0.000% 0.000% 0.000% 0.161% 0.133% 0.103%
Singapore
Japan
Germany
Malaysia
Hong Kong, China
China
Philippines
Thailand
Taipei, Chinese
United States of America
Korea, Republic of
Bulgaria
United Kingdom
Belgium
South Africa
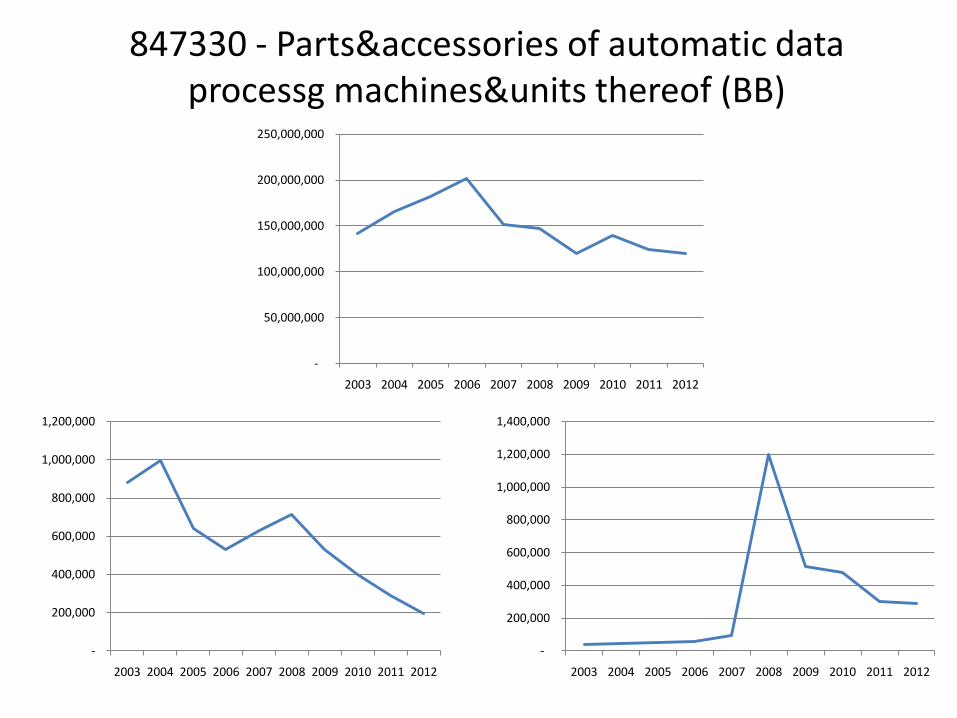
847330 - Parts&accessories of automatic data processg machines&units thereof (BB)
-
50,000,000
100,000,000
150,000,000
200,000,000
250,000,000
2003 2004 2005 2006 2007 2008 2009 2010 2011 2012
-
200,000
400,000
600,000
800,000
1,000,000
1,200,000
2003 2004 2005 2006 2007 2008 2009 2010 2011 2012
-
200,000
400,000
600,000
800,000
1,000,000
1,200,000
1,400,000
2003 2004 2005 2006 2007 2008 2009 2010 2011 2012

847330 - Parts&accessories of automatic data processg machines&units thereofImporters 2004 2005 2006 2007 2008 2009 2010 2011 2012
1 Hong Kong, China 10.3% 11.7% 12.1% 11.7% 11.5% 12.9% 14.0% 15.6% 17.7%2 China 8.3% 8.6% 9.0% 11.1% 10.2% 10.9% 13.3% 13.5% 14.3%3 United States of America 16.7% 15.5% 15.9% 14.3% 12.5% 15.3% 16.1% 12.8% 12.1%4 Netherlands 5.5% 6.5% 7.4% 6.4% 6.8% 6.7% 6.2% 7.3% 7.4%5 Singapore 6.7% 7.3% 5.9% 0.8% 8.0% 5.6% 5.4% 5.4% 5.1%6 Mexico 3.3% 2.6% 2.3% 2.6% 1.9% 2.8% 3.8% 4.0% 4.7%7 Germany 7.1% 6.8% 7.1% 5.4% 4.6% 3.7% 3.6% 3.8% 3.3%8 Thailand 1.9% 2.0% 2.1% 2.9% 3.0% 3.3% 2.9% 2.9% 3.1%9 Malaysia 3.8% 3.7% 3.4% 4.9% 4.4% 4.8% 3.6% 3.6% 3.1%
10 Philippines 2.4% 2.0% 1.8% 3.2% 3.0% 3.0% 2.9% 1.3% 2.6%11 Japan 5.1% 4.4% 3.6% 3.2% 2.9% 2.9% 3.1% 2.8% 2.6%12 Czech Republic 0.7% 0.8% 1.4% 2.2% 2.1% 2.1% 2.3% 2.6% 2.4%13 United Kingdom 4.5% 4.5% 4.5% 4.5% 3.9% 3.2% 2.6% 2.3% 2.1%14 Brazil 0.5% 0.5% 0.6% 0.7% 0.9% 1.0% 1.2% 1.4% 2.0%
Exporters 2004 2005 2006 2007 2008 2009 2010 2011 20121 China 14.3% 15.3% 15.9% 22.7% 22.0% 22.7% 23.0% 24.1% 25.1%2 Hong Kong, China 11.0% 13.3% 12.8% 12.7% 12.6% 13.4% 14.8% 16.8% 19.7%3 United States of America 10.7% 10.4% 9.7% 10.1% 9.6% 10.4% 9.8% 11.2% 12.5%4 Netherlands 4.7% 6.9% 7.5% 7.3% 6.4% 6.7% 6.2% 8.1% 7.8%5 Singapore 7.5% 8.5% 9.0% 1.1% 10.2% 7.7% 8.3% 8.4% 7.3%6 Malaysia 5.1% 4.6% 5.4% 7.7% 7.6% 8.0% 7.9% 4.9% 4.5%7 Taipei, Chinese 5.7% 4.5% 4.4% 5.7% 4.6% 4.7% 5.3% 4.4% 3.9%8 Korea, Republic of 6.5% 4.3% 4.3% 6.0% 4.3% 4.4% 6.0% 4.0% 2.9%9 Thailand 2.1% 1.7% 1.8% 2.3% 2.3% 2.7% 2.7% 3.1% 2.8%
10 Germany 4.6% 4.8% 5.4% 3.9% 3.0% 2.6% 2.3% 2.1% 1.7%11 Japan 8.8% 8.1% 7.5% 2.2% 1.9% 1.8% 1.7% 1.3% 1.4%12 Czech Republic 0.4% 0.5% 0.7% 1.0% 0.7% 0.8% 0.9% 1.5% 1.3%13 United Kingdom 3.0% 3.6% 3.9% 3.6% 2.9% 2.8% 2.4% 1.8% 1.1%14 Philippines 1.9% 1.9% 1.6% 1.4% 1.3% 1.9% 1.1% 1.0% 0.9%
Indonesia 0.597% 0.346% 0.258% 0.443% 0.500% 0.471% 0.298% 0.236% 0.167%
Singapore
Philippines
United States of America
Thailand
Malaysia
Hong Kong, China
Netherlands
Japan
China
India
Korea, Republic of
Taipei, Chinese
Ireland
Brunei Darussalam
Spain

847170 - Computer data storage units (BM)
-
10,000,000
20,000,000
30,000,000
40,000,000
50,000,000
60,000,000
70,000,000
80,000,000
90,000,000
100,000,000
2003 2004 2005 2006 2007 2008 2009 2010 2011 2012
-
100,000
200,000
300,000
400,000
500,000
600,000
2003 2004 2005 2006 2007 2008 2009 2010 2011 2012
-
50,000
100,000
150,000
200,000
250,000
300,000
350,000
2003 2004 2005 2006 2007 2008 2009 2010 2011 2012
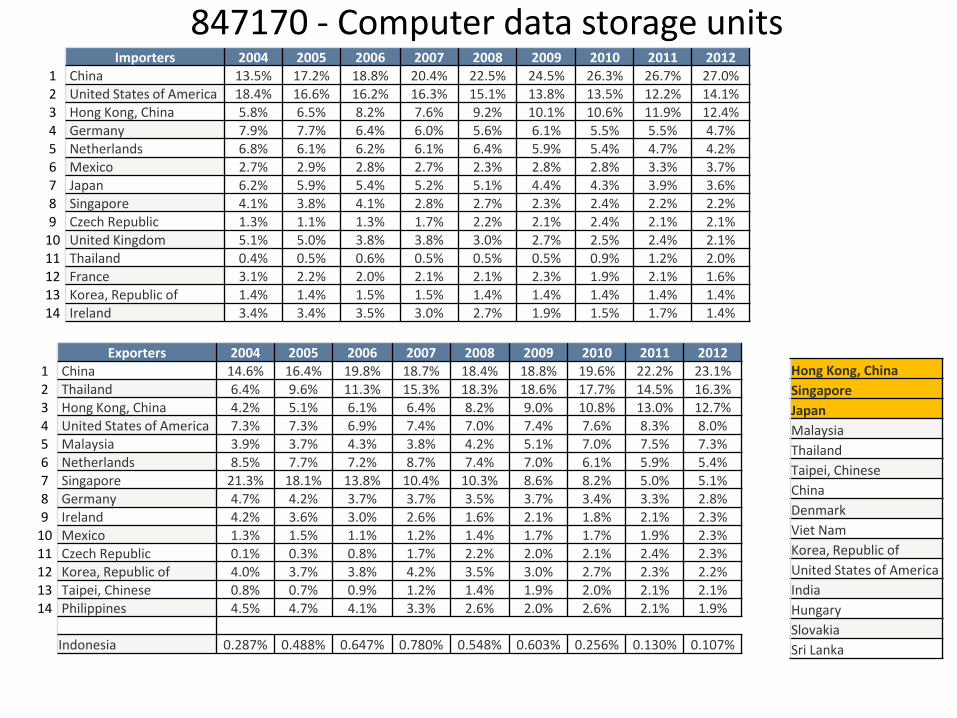
847170 - Computer data storage unitsImporters 2004 2005 2006 2007 2008 2009 2010 2011 2012
1 China 13.5% 17.2% 18.8% 20.4% 22.5% 24.5% 26.3% 26.7% 27.0%2 United States of America 18.4% 16.6% 16.2% 16.3% 15.1% 13.8% 13.5% 12.2% 14.1%3 Hong Kong, China 5.8% 6.5% 8.2% 7.6% 9.2% 10.1% 10.6% 11.9% 12.4%4 Germany 7.9% 7.7% 6.4% 6.0% 5.6% 6.1% 5.5% 5.5% 4.7%5 Netherlands 6.8% 6.1% 6.2% 6.1% 6.4% 5.9% 5.4% 4.7% 4.2%6 Mexico 2.7% 2.9% 2.8% 2.7% 2.3% 2.8% 2.8% 3.3% 3.7%7 Japan 6.2% 5.9% 5.4% 5.2% 5.1% 4.4% 4.3% 3.9% 3.6%8 Singapore 4.1% 3.8% 4.1% 2.8% 2.7% 2.3% 2.4% 2.2% 2.2%9 Czech Republic 1.3% 1.1% 1.3% 1.7% 2.2% 2.1% 2.4% 2.1% 2.1%
10 United Kingdom 5.1% 5.0% 3.8% 3.8% 3.0% 2.7% 2.5% 2.4% 2.1%11 Thailand 0.4% 0.5% 0.6% 0.5% 0.5% 0.5% 0.9% 1.2% 2.0%12 France 3.1% 2.2% 2.0% 2.1% 2.1% 2.3% 1.9% 2.1% 1.6%13 Korea, Republic of 1.4% 1.4% 1.5% 1.5% 1.4% 1.4% 1.4% 1.4% 1.4%14 Ireland 3.4% 3.4% 3.5% 3.0% 2.7% 1.9% 1.5% 1.7% 1.4%
Exporters 2004 2005 2006 2007 2008 2009 2010 2011 20121 China 14.6% 16.4% 19.8% 18.7% 18.4% 18.8% 19.6% 22.2% 23.1%2 Thailand 6.4% 9.6% 11.3% 15.3% 18.3% 18.6% 17.7% 14.5% 16.3%3 Hong Kong, China 4.2% 5.1% 6.1% 6.4% 8.2% 9.0% 10.8% 13.0% 12.7%4 United States of America 7.3% 7.3% 6.9% 7.4% 7.0% 7.4% 7.6% 8.3% 8.0%5 Malaysia 3.9% 3.7% 4.3% 3.8% 4.2% 5.1% 7.0% 7.5% 7.3%6 Netherlands 8.5% 7.7% 7.2% 8.7% 7.4% 7.0% 6.1% 5.9% 5.4%7 Singapore 21.3% 18.1% 13.8% 10.4% 10.3% 8.6% 8.2% 5.0% 5.1%8 Germany 4.7% 4.2% 3.7% 3.7% 3.5% 3.7% 3.4% 3.3% 2.8%9 Ireland 4.2% 3.6% 3.0% 2.6% 1.6% 2.1% 1.8% 2.1% 2.3%
10 Mexico 1.3% 1.5% 1.1% 1.2% 1.4% 1.7% 1.7% 1.9% 2.3%11 Czech Republic 0.1% 0.3% 0.8% 1.7% 2.2% 2.0% 2.1% 2.4% 2.3%12 Korea, Republic of 4.0% 3.7% 3.8% 4.2% 3.5% 3.0% 2.7% 2.3% 2.2%13 Taipei, Chinese 0.8% 0.7% 0.9% 1.2% 1.4% 1.9% 2.0% 2.1% 2.1%14 Philippines 4.5% 4.7% 4.1% 3.3% 2.6% 2.0% 2.6% 2.1% 1.9%
Indonesia 0.287% 0.488% 0.647% 0.780% 0.548% 0.603% 0.256% 0.130% 0.107%
Hong Kong, China
Singapore
Japan
Malaysia
Thailand
Taipei, Chinese
China
Denmark
Viet Nam
Korea, Republic of
United States of America
India
Hungary
Slovakia
Sri Lanka

870899 - Motor vehicle parts nes (BB)
-
20,000,000
40,000,000
60,000,000
80,000,000
100,000,000
120,000,000
2003 2004 2005 2006 2007 2008 2009 2010 2011 2012
-
50,000
100,000
150,000
200,000
250,000
300,000
350,000
2003 2004 2005 2006 2007 2008 2009 2010 2011 2012-
200,000
400,000
600,000
800,000
1,000,000
1,200,000
1,400,000
1,600,000
1,800,000
2003 2004 2005 2006 2007 2008 2009 2010 2011 2012

870899 - Motor vehicle parts nesImporters 2004 2005 2006 2007 2008 2009 2010 2011 2012
1 United States of America 17.6% 18.2% 16.9% 12.5% 11.3% 11.7% 14.0% 14.4% 16.6%2 Spain 13.5% 12.2% 12.0% 15.0% 14.2% 15.1% 12.2% 13.3% 11.5%3 Germany 7.2% 8.2% 8.3% 7.3% 7.7% 7.5% 7.3% 7.5% 7.1%4 France 6.5% 5.8% 5.5% 5.7% 5.8% 5.6% 5.0% 4.8% 4.6%5 United Kingdom 7.7% 7.0% 8.6% 8.7% 5.5% 4.6% 5.0% 4.7% 4.4%6 Canada 6.1% 6.0% 5.5% 3.1% 2.7% 2.7% 2.9% 3.0% 3.5%7 Mexico 3.9% 4.2% 4.6% 4.3% 3.0% 2.9% 3.2% 2.9% 3.4%8 Thailand 2.4% 2.3% 1.8% 1.8% 1.6% 1.7% 2.3% 2.2% 3.3%9 Italy 3.8% 3.7% 4.0% 4.5% 5.1% 4.9% 4.0% 3.6% 3.0%
10 China 2.4% 1.9% 2.8% 2.8% 2.1% 2.9% 3.0% 2.9% 2.9%11 Belgium 2.8% 2.3% 2.2% 2.3% 3.2% 2.9% 2.8% 2.7% 2.5%12 India 0.6% 0.7% 0.7% 0.9% 1.9% 2.4% 2.1% 1.9% 2.3%13 Sweden 2.2% 2.1% 2.1% 2.3% 2.4% 1.8% 2.3% 2.5% 2.1%14 Austria 1.8% 1.9% 2.0% 1.7% 1.7% 1.6% 1.7% 1.9% 2.0%
Exporters 2004 2005 2006 2007 2008 2009 2010 2011 20121 Korea, Republic of 5.3% 6.9% 8.1% 10.5% 11.6% 13.1% 16.2% 15.4% 14.4%2 United States of America 13.6% 12.1% 11.9% 9.8% 8.3% 9.4% 9.1% 10.9% 12.2%3 Germany 11.4% 11.8% 12.0% 8.3% 8.5% 8.4% 8.1% 8.4% 7.7%4 Japan 9.7% 9.3% 8.6% 7.1% 6.9% 7.2% 7.5% 6.5% 6.9%5 Italy 7.7% 7.3% 7.4% 8.7% 9.7% 8.3% 8.2% 7.7% 6.5%6 France 8.1% 7.2% 7.4% 7.6% 7.8% 7.8% 6.8% 6.7% 6.0%7 Spain 7.6% 7.1% 6.7% 7.4% 7.4% 6.8% 5.5% 5.6% 5.0%8 China 2.0% 2.5% 2.9% 3.7% 3.8% 3.4% 3.5% 3.5% 4.0%9 Mexico 3.1% 3.2% 3.3% 3.5% 2.0% 2.3% 2.8% 3.1% 3.6%
10 Canada 6.5% 6.2% 5.5% 4.0% 2.9% 2.3% 2.6% 2.6% 2.8%11 Thailand 1.0% 1.4% 1.5% 1.9% 2.2% 2.3% 2.4% 2.2% 2.7%12 India 0.6% 0.8% 0.8% 0.9% 1.0% 1.1% 1.4% 1.8% 2.6%13 United Kingdom 4.1% 3.6% 3.4% 2.6% 2.3% 2.3% 2.2% 2.2% 2.6%14 Belgium 2.5% 2.4% 2.4% 2.8% 2.9% 2.7% 2.6% 2.4% 2.3%
Indonesia 0.244% 0.342% 0.231% 0.229% 0.238% 0.227% 0.192% 0.157% 0.217%
Thailand
Philippines
Malaysia
Japan
South Africa
India
Singapore
Viet Nam
Brazil
Taipei, Chinese
Australia
Korea, Republic of
Pakistan
Saudi Arabia
Yemen

711319 - Articles of jewellry&pt therof of/o prec met w/n platd/clad w prec met (BK)
-
10,000,000
20,000,000
30,000,000
40,000,000
50,000,000
60,000,000
70,000,000
80,000,000
2003 2004 2005 2006 2007 2008 2009 2010 2011 2012
-
20,000
40,000
60,000
80,000
100,000
120,000
140,000
160,000
2003 2004 2005 2006 2007 2008 2009 2010 2011 2012
-
500
1,000
1,500
2,000
2,500
2003 2004 2005 2006 2007 2008 2009 2010 2011 2012

711319 - Articles of jewellry&pt therof of/o prec met w/n platd/clad w prec metImporters 2004 2005 2006 2007 2008 2009 2010 2011 2012
1 United Arab Emirates 0.0% 12.2% 0.0% 13.6% 16.7% 30.9% 22.8% 25.7% 28.0%2 Hong Kong, China 7.3% 7.5% 7.3% 9.0% 11.5% 9.7% 12.6% 15.1% 14.5%3 Switzerland 9.4% 9.4% 9.1% 9.6% 12.1% 10.5% 15.6% 14.8% 11.8%4 India 0.5% 0.5% 1.0% 1.0% 0.5% 1.3% 0.5% 1.1% 6.8%5 United States of America 27.2% 27.0% 25.8% 22.2% 15.0% 10.8% 10.3% 8.2% 6.5%6 Singapore 3.4% 3.7% 3.1% 4.0% 5.1% 4.6% 6.0% 4.6% 5.4%7 United Kingdom 11.1% 11.8% 12.3% 11.7% 8.8% 6.8% 6.3% 5.4% 4.8%8 France 3.4% 3.3% 3.4% 3.8% 3.8% 3.2% 3.6% 3.9% 3.6%9 Japan 4.7% 4.5% 4.2% 3.5% 3.5% 2.5% 2.6% 2.1% 2.0%
10 Italy 1.8% 1.8% 1.9% 2.4% 2.3% 1.6% 2.1% 2.2% 1.5%11 Macao, China 0.1% 0.2% 0.2% 0.5% 0.7% 0.8% 1.1% 0.0% 1.3%12 Germany 2.4% 2.1% 1.7% 1.6% 1.6% 1.5% 1.5% 1.6% 1.3%13 Qatar 0.1% 0.1% 0.0% 0.0% 0.1% 0.0% 0.2% 1.3% 1.1%14 Canada 1.2% 1.2% 1.6% 1.7% 1.8% 1.4% 1.5% 1.1% 1.0%
United States of America
Hong Kong, China
United Arab Emirates
Italy
South Africa
Singapore
Malaysia
Switzerland
Japan
Thailand
Turkey
Australia
Korea, Republic of
Mexico
Denmark
Exporters 2004 2005 2006 2007 2008 2009 2010 2011 20121 China 6.0% 5.9% 5.0% 5.2% 4.8% 4.7% 8.0% 12.6% 22.7%2 India 10.4% 10.5% 12.8% 11.9% 9.4% 23.0% 14.2% 18.2% 17.6%3 Switzerland 9.3% 9.0% 9.2% 9.3% 9.5% 8.7% 9.1% 9.1% 8.0%4 United States of America 9.8% 10.6% 12.0% 9.9% 10.6% 9.9% 9.9% 8.8% 7.9%5 Hong Kong, China 8.4% 8.8% 8.6% 8.6% 8.1% 6.4% 6.7% 6.5% 5.9%6 United Arab Emirates 0.0% 2.3% 0.0% 4.6% 7.8% 2.5% 2.0% 1.9% 5.7%7 Italy 16.1% 14.2% 13.3% 13.2% 11.4% 8.4% 8.6% 6.9% 5.6%8 United Kingdom 6.5% 7.8% 8.9% 8.8% 8.3% 7.4% 7.3% 6.0% 5.3%9 Singapore 2.0% 1.8% 1.6% 2.0% 3.3% 3.5% 4.7% 3.3% 3.2%
10 France 2.9% 3.1% 3.4% 3.7% 3.7% 3.1% 3.5% 3.9% 3.2%11 Turkey 3.6% 3.8% 3.1% 3.6% 3.3% 2.4% 2.8% 2.5% 2.6%12 Thailand 3.1% 3.9% 3.3% 3.2% 4.1% 3.4% 3.4% 2.9% 2.3%13 Malaysia 2.9% 3.1% 2.7% 2.9% 2.4% 2.4% 2.5% 2.3% 1.9%14 Pakistan 0.1% 0.0% 0.1% 0.3% 0.5% 1.0% 1.1% 0.6% 1.6%
Indonesia 0.154% 0.142% 0.084% 0.141% 0.165% 0.166% 0.191% 0.194% 0.076%

END